Perfect Order Alert USDJPY/BTCUSD/XAUUSDPerfect Order Alert USDJPY/BTCUSD/XAUUSD 日本語解説は下記
This indicator detects the perfect order of three moving averages and displays on the Panel in an easy-to-understand visual manner whether there is an uptrend, downtrend, or non-trend for each time leg.
This indicator detects perfect orders for the three currency pairs USDJPY/BTCUSD/XAUUSD on the 5-minute, 15-minute, 1-hour, and 4-hour time frames, and displays them on the Panel on the chart, with “▲” for up, “▼” for down, and “ー” for non-trend, so that you can quickly determine the trend. The panel is displayed on the chart.
In order to check for perfect orders without missing them, it is also possible to set up alerts that notify you of all the time frames and currency pairs as well.
Functions
Displaying 4H, 1H, 15M, 5M, up (▲), down (▼), other (-), of USDJPY/BTCUSD/XAUUSD on the panel.
*(By default, 20EMA, 75EMA, and 200EMA are hidden.)
Display position setting of the panel (You can choose from upper left, upper top, upper right, lower left, lower bottom, or lower right).
Panel color and text color change function
The moving average line can be hidden by default.
Moving average period change
Moving average color and thickness can be changed.
EMA/SMA switchable
Alert function - One alert can be set for each currency pair and time frame ▲▼, which is very useful.
Perfect Order Alert
You can use it even if you have a free account with only one alert setting.
To use the alert function, go to the Tradingview default alert settings, select “USDJPY/BTCUSD/XAUUSD” for the top item of conditions, and select “Call Alert() function” in the frame just below it!
_* Supplementary explanation: ____________
Please note that due to the limitation of the script, only 3 currency pairs and 4 time frames are displayed with 12 items (Panels for currency pairs other than USDJPY/BTCUSD/XAUUSD are also created, but they are indicators for other scripts, so if you are interested in other currency pairs, please use those. If you are interested in other currency pairs, please use them.)
Please note that we may change the functions or delete the indicator itself without prior notice.
Translated with DeepL.com (free version)
Reference image of the setting screenReference image of the setting screen
設定画面参考画像
3本の移動平均線のパーフェクトオーダーを検知し、時間足ごとに上昇トレンドか下降トレンドかノントレンドかを視覚的にわかりやすくPanelに表示するインジゲーターです。
このインジゲーターは、USDJPY/BTCUSD/XAUUSDの3通貨ペアの5分足、15分足、1時間足、4時間足のパーフェクトオーダーを検知して、チャートに表示されるPanelに、上昇は「▲」下降は「▼」ノントレンドは「ー」と、すぐに判断できる表示にしてあります。
パーフェクトオーダーを逃さずチェックできるように、それぞれの時間足や通貨ペアも全てを通知してくれるアラート設定が可能なのも特徴です。
機能紹介
・USDJPY/BTCUSD/XAUUSDの4H,1H,15M,5M,の上昇(▲),下降(▼),その他(-),をパネルに表示
※(デフォルトでは20EMA,75EMA,200EMAの3本で非表示にしてあります)
・パネルの表示位置設定(左上、上、右上、左下、下、右下、から選択できます。)
・パネルの色とテキスト色変更機能
・移動平均線表示非表示機能(デフォルトでは表示OFFにしてあります。)
・移動平均線期間変更
・移動平均線色と太さ変更
・EMA/SMA切り替え可能
・アラート機能ー1つのアラート設定で通貨ペアと時間足▲▼一つ一つを細かく教えてくれるので便利。
※パーフェクト オーダーアラート
無料アカウントで1つしかアラート設定できなくても使えます。
アラート機能はTradingviewデフォルトのアラート設定から、条件の一番上の項目を「USDJPY/BTCUSD/XAUUSD」選択、そのすぐ下の枠に「Alert()関数の呼び出し」を選択でOK!
_※ 補足説明____________
・スクリプトの制限の為、3通貨ペアと4つの時間足の12項目で表示させていますのでご了承ください
(USDJPY/BTCUSD/XAUUSD以外の通貨ペアのPanelも作成していますが別スクリプトのインジゲーターになりますので他の通貨ペアも興味がある方はそちらをお使いください)
・予告なしで機能の変更やインジゲーター自体の削除等行う事もあるかもなのでご了承ください。
Поиск скриптов по запросу "deep股票代码"

[Pandora] Vast Volatility Treasure TroveINTRODUCTION:
Volatility enthusiasts, prepare for VICTORY on this day of July 4th, 2024! This is my "Vast Volatility Treasure Trove," intended mostly for educational purposes, yet these functions will also exhibit versatility when combined with other algorithms to garner statistical excellence. Once again, I am now ripping the lid off of Pandora's box... of volatility. Inside this script is a 'vast' collection of volatility estimators, reflecting the indicators name. Whether you are a seasoned trader destined to navigate financial strife or an eagerly curious learner, this script offers a comprehensive toolkit for a broad spectrum of volatility analysis. Enjoy your journey through the realm of market volatility with this code!
WHAT IS MARKET VOLATILITY?:
Market volatility refers to various fluctuations in the value of a financial market or asset over a period of time, often characterized by occasional rapid and significant deviations in price. During periods of greater market volatility, evolving conditions of prices can move rapidly in either direction, creating uncertainty for investors with results of sharp declines as well as rapid gains. However, market volatility is a typical aspect expected in financial markets that can also present opportunities for informed decision-making and potential benefits from the price flux.
SCRIPT INTENTION:
Volatility is assuredly omnipresent, waxing and waning in magnitude, and some readers have every intention of studying and/or measuring it. This script serves as an all-in-one armada of volatility estimators for TradingView members. I set out to provide a diverse set of tools to analyze and interpret market volatility, offering volatile insights, and aid with the development of robust trading indicators and strategies.
In today's fast-paced financial markets, understanding and quantifying volatility is informative for both seasoned traders and novice investors. This script is designed to empower users by equipping them with a comprehensive suite of volatility estimators. Each function within this script has been meticulously crafted to address various aspects of volatility, from traditional methods like Garman-Klass and Parkinson to more advanced techniques like Yang-Zhang and my custom experimental algorithms.
Ultimately, this script is more than just a collection of functions. It is a gateway to a deeper understanding of market volatility and a valuable resource for anyone committed to mastering the complexities of financial markets.
SCRIPT CONTENTS:
This script includes a variety of functions designed to measure and analyze market volatility. Where applicable, an input checkbox option provides an unbiased/biased estimate. Below is a brief description of each function in the original order they appear as code upon first publish:
Parkinson Volatility - Estimates volatility emphasizing the high and low range movements.
Alternate Parkinson Volatility - Simpler version of the original Parkinson Volatility that I realized.
Garman-Klass Volatility - Estimates volatility based on high, low, open, and close prices using a formula that adjusts for biases in price dynamics.
Rogers-Satchell-Yoon Volatility #1 - Estimates volatility based on logarithmic differences between high, low, open, and close values.
Rogers-Satchell-Yoon Volatility #2 - Similar estimate to Rogers-Satchell with the same result via an alternate formulation of volatility.
Yang-Zhang Volatility - An advanced volatility estimate combining both strengths of the Garman-Klass and Rogers-Satchell estimators, with weights determined by an alpha parameter.
Yang-Zhang (Modified) Volatility - My experimental modification slightly different from the Yang-Zhang formula with improved computational efficiency.
Selectable Volatility - Basic customizable volatility calculation based on the logarithmic difference between selected numerator and denominator prices (e.g., open, high, low, close).
Close-to-Close Volatility - Estimates volatility using the logarithmic difference between consecutive closing prices. Specifically applicable to data sources without open, high, and low prices.
Open-to-Close Volatility - (Overnight Volatility): Estimates volatility based on the logarithmic difference between the opening price and the last closing price emphasizing overnight gaps.
Hilo Volatility - Estimates volatility using a method similar to Parkinson's method, which considers the logarithm of the high and low prices.
Vantage Volatility - My experimental custom 'vantage' method to estimate volatility similar to Yang-Zhang, which incorporates various factors (Alpha, Beta, Gamma) to generate a weighted logarithmic calculation. This may be a volatility advantage or disadvantage, hence it's name.
Schwert Volatility - Estimates volatility based on arithmetic returns.
Historical Volatility - Estimates volatility considering logarithmic returns.
Annualized Historical Volatility - Estimates annualized volatility using logarithmic returns, adjusted for the number of trading days in a year.
If I omitted any other known varieties, detailed requests for future consideration can be made below for their inclusion into this script within future versions...
BONUS ALGORITHMS:
This script also includes several experimental and bonus functions that push the boundaries of volatility analysis as I understand it. These functions are designed to provide additional insights and also are my ideal notions for traders looking to explore other methods of volatility measurement.
VOLATILITY APPLICATIONS:
Volatility estimators serve a common role across various facets of trading and financial analysis, offering insights into market behavior. These tools are already in instrumental with enhancing risk management practices by providing a deeper understanding of market dynamics and the inherent uncertainty in asset prices. With volatility estimators, traders can effectively quantifying market risk and adjust their strategies accordingly, optimizing portfolio performance and mitigating potential losses. Additionally, volatility estimations may serve as indication for detecting overbought or oversold market conditions, offering probabilistic insights that could inform strategic decisions at turning points. This script
distinctly offers a variety of volatility estimators to navigate intricate financial terrains with informed judgment to address challenges of strategic planning.
CODE REUSE:
You don't have to ask for my permission to use/reuse these functions in your published scripts, simply because I have better things to do than answer requests for the reuse of these functions.
Notice: Unfortunately, I will not provide any integration support into member's projects at all. I have my own projects that require way too much of my day already.

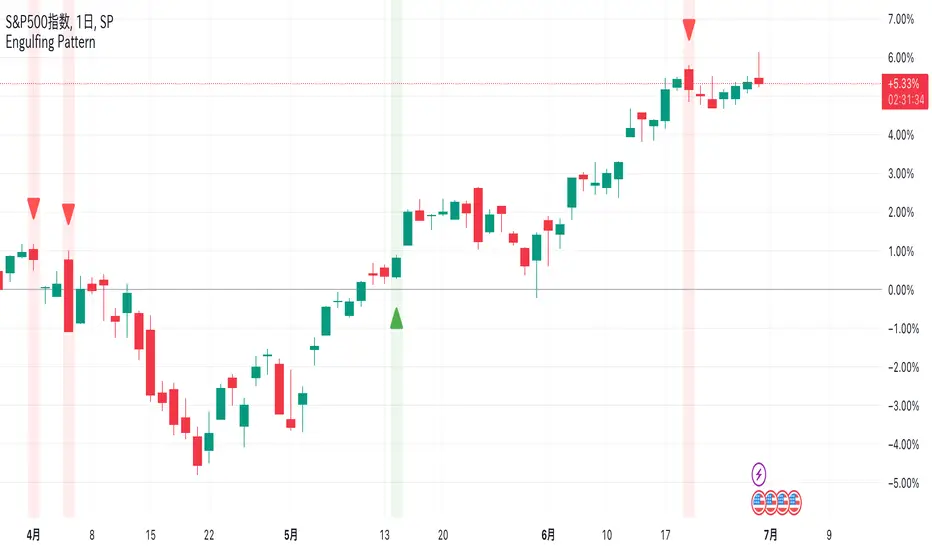
Engulfing Pattern @Ray_SP500NISAEngulfing Patterns
Bullish and bearish hugging candlesticks are powerful reversal formations that generate signals of potential reversals. These patterns are popular candlestick patterns because they are easy to spot and trade.
When the second candlestick completely wraps around the previous candlestick, it is a signal for a market reversal. A positive line encircled by a negative line may indicate a decline, while a negative line encircled by a positive line may indicate an upturn.
The system is simple enough to display these signs in red for a negative line and in green for a positive line. We hope this helps you in your investment life.
Translated with DeepL.com (free version)
Lower Timeframe Volume BarsDescription:
The Lower Timeframe Volume Bars indicator enhances your TradingView experience by allowing you to visualize volume data from lower timeframes on your current chart. This powerful tool helps you gain deeper insights into volume trends and activity that are not immediately visible on higher timeframe charts. Specifically, it shows the volume data from the last bar of the selected lower timeframe.
Key Features:
Volume Bars from Lower Timeframes:
Display volume data from 1-minute or 1-second timeframes directly on higher timeframe charts, such as 15 minutes or 1 hour.
Each volume bar represents the aggregated volume from the lower timeframe within the selected higher timeframe period.
Enhanced Volume Analysis:
Gain a more detailed understanding of volume spikes and troughs that may be hidden in higher timeframe charts.
Identify potential market turning points and confirm trends with precise volume data.
Customizable Display:
Adjust the appearance of volume bars to fit your chart style and preferences.
Configure settings such as color, size, and positioning of volume bars for optimal visibility and clarity.
Seamless Integration:
Easily add the indicator to any chart in TradingView with a few clicks.
Works in conjunction with other technical indicators and tools to provide a comprehensive analysis environment.
How to Use:
Add the Lower Timeframe Volume Bars indicator to your chart.
Select the lower timeframe you wish to fetch volume data from (e.g., 1-minute or 1-second).
Customize the display settings to match your charting style.
Observe the volume bars overlaying your current chart to analyze volume activity across different timeframes, specifically showing the last bar's volume.
Use the detailed volume information to make informed trading decisions and enhance your market analysis.
Benefits:
Increased Clarity: See detailed volume activity that is often lost in higher timeframe aggregation.
Better Decision Making: Make more informed trading decisions with a clear view of volume trends and spikes.
Improved Trend Confirmation: Use lower timeframe volume data to confirm the strength and sustainability of market trends.
Enhance your trading strategy and gain a deeper understanding of market dynamics with the Lower Timeframe Volume Bars indicator. Visualize, analyze, and trade with confidence by leveraging detailed volume insights from lower timeframes.

[UST] Protein+Support/Resistance Script: A Comprehensive Overview
Thanks to Pmgjiv for providing the foundation to this improved Version.
In the world of trading, having a robust support and resistance analysis tool can make a significant difference in decision-making and overall strategy. Let's delve into the enhancements made to the support/resistance script and how each component contributes to a trader's arsenal:
Changes and improvements made for the script to help Traders make better rational decisions in their Trading:
1. Multiple Timeframes:
Integrating multiple timeframes into the analysis provides a multi-dimensional view of the market. Traders can now assess price action across different time horizons simultaneously. This feature allows for a deeper understanding of market dynamics and helps in identifying significant support and resistance levels across various timeframes.
2. Timeframe Labels Inside Zones:
By including timeframe labels within the zones, traders can easily identify the origin of each support or resistance level. This contextual information enhances clarity and facilitates more informed decision-making, especially when navigating through multiple timeframes.
3. Visual Zone Update:
Visual updates on zones enable traders to track changes in support and resistance levels in real-time. This dynamic feature enhances the analytical process by providing immediate insights into evolving market conditions, thereby enabling traders to adapt their strategies accordingly.
4. Zones Hit:
Understanding the frequency and intensity of zone hits offers valuable insights into the strength and relevance of support and resistance levels. Traders can gauge the significance of each zone based on its historical interaction with price, thereby gaining a deeper understanding of market sentiment and potential trading opportunities.
5. Option to Turn off Current Timeframe:
The ability to toggle off the current timeframe streamlines chart analysis by focusing only on the most critical support and resistance zones. This decluttering feature helps traders prioritize key levels, reducing cognitive overload and enhancing decision-making efficiency.
Explanation of Additional Functions:
a. Lookback:
The 'lookback' parameter allows traders to customize the age of support and resistance zones based on their trading style and preferences. By adjusting the lookback setting, traders can choose whether to prioritize recent price action or consider historical data, thus tailoring the analysis to their specific trading strategies.
b. Swinglength:
Swinglength determines the sensitivity of the support and resistance zones. By modifying this parameter, traders can control how aggressively the script identifies pivot points. A higher swinglength value results in smoother, more stable zones, whereas a lower value increases sensitivity, capturing smaller price movements.
c. ZigZag Indicator:
The ZigZag indicator plays a pivotal role in identifying significant price reversals. Its period setting determines the number of price bars considered before confirming a pivot point. Traders can utilize this indicator to identify key turning points in the market, aiding in the identification of robust support and resistance levels.
Impact of Sensitivity on Zones:
Adjusting the sensitivity of the ZigZag indicator directly influences the identification and delineation of support and resistance zones. Higher sensitivity levels result in fewer but more robust zones, capturing significant price movements. Conversely, lower sensitivity levels yield more zones, accommodating smaller price fluctuations but potentially introducing noise into the analysis.
d. S/R Range:
The ability to adjust the width of support and resistance zones allows traders to customize the breadth of key areas on a chart. Choosing a wider range encompasses a broader spectrum of prices, thereby identifying more comprehensive support and resistance levels. This flexibility enables traders to adapt their analysis to different market conditions and trading strategies.
Utilization in Trading:
Comprehensive Analysis: By incorporating multiple timeframes, traders gain a holistic view of market dynamics, enabling them to identify high-probability trading opportunities across various horizons.
Contextual Understanding: Timeframe labels within zones provide context, helping traders understand the significance of each level in relation to different timeframes and market conditions.
Real-time Adaptability: Visual zone updates facilitate real-time analysis, allowing traders to adjust their strategies promptly in response to changing market conditions.
Informed Decision-making: By considering zone hits, traders can assess the strength and relevance of support and resistance levels, enhancing their ability to make informed trading decisions.
Customized Analysis: Adjustable parameters such as lookback, swinglength, and sensitivity empower traders to tailor the analysis to their individual trading styles and preferences, enhancing precision and effectiveness.
In summary, these enhancements to the support/resistance script provide traders with a powerful toolkit for analyzing market dynamics, identifying key levels, and executing well-informed trading strategies across various timeframes and market conditions.

Semaphore PlotThe Semaphore Plot V2, crafted by OmegaTools for the TradingView platform, is a sophisticated technical analysis tool designed to offer traders nuanced insights into market dynamics. This closed-source script embodies a novel approach by synthesizing multiple technical analysis methodologies into a coherent analytical framework. This detailed description aims to demystify the operational essence of the Semaphore Plot V2 and elucidate its application in trading scenarios without overstepping into claims of infallibility or price prediction accuracy.
Analytical Foundations and Integration:
At its core, the Semaphore Plot V2 is founded on the integration of several analytical dimensions, each contributing to a comprehensive market overview:
1. Dynamic Trend Analysis: Unlike conventional trend indicators that might rely solely on moving averages, the Semaphore Plot V2 examines the market's direction through a more complex lens. It assesses momentum, utilizing derivatives of price movements to understand the velocity and acceleration of trends. This analysis is deepened by examining the rate of change (ROC), providing a multi-tiered view of how swiftly market conditions are evolving.
2. Volatility Insights: Recognizing volatility as a pivotal component of market behavior, the script incorporates volatility metrics to analyze market conditions. By evaluating historical price ranges and applying statistical models, it aims to gauge the potential for future price fluctuations, thus offering insights into market stability or turbulence without predicting specific movements.
3. Linear Regression and Predictive Analysis: The script utilizes linear regression to analyze price data points over a specified period, offering a statistical basis to understand the trajectory of market trends. This regression analysis is complemented by market momentum indicators, forming a predictive model that suggests potential areas where market activity might concentrate. It's important to note that these "predictions" are not certainties but rather statistically derived zones of interest based on historical data.
4. Market Sentiment and Risk Evaluation: Incorporating an evaluation of market sentiment, the script analyzes trends in trading volume and price action to deduce the prevailing market mood. Risk assessment tools, such as the analysis of statistical deviations and Value at Risk (VaR), are also applied to offer a perspective on the risk associated with current market conditions.
Operational Mechanism:
- By processing the integrated analysis, the script generates semaphore signals which are plotted on the trading chart. These signals are not direct buy or sell signals but are designed to highlight areas where, based on the script’s complex analysis, market activity might see significant developments.
- Additionally, the Semaphore Plot V2 features an information table that provides a retrospective analysis of the signals' alignment with market movements, offering traders a tool to assess the script's historical context.
Application and Utility:
- Traders can leverage the Semaphore Plot V2 by applying it to their TradingView charts and adjusting input settings such as lookback periods and sensitivity according to their preferences.
- The semaphore signals serve as markers for areas of potential interest. Traders are encouraged to interpret these signals within the context of their overall market analysis, incorporating other fundamental and technical analysis tools as necessary.
- The informational table serves as a resource for evaluating the historical context of the signals, providing an additional layer of insight for informed decision-making.
The Essence of Originality:
The Semaphore Plot V2 distinguishes itself through the innovative melding of traditional technical analysis components into a unique analytical concoction. This originality lies not in the creation of new technical indicators but in the novel integration and application of existing methodologies to offer a holistic view of market conditions.
Responsible Usage Disclaimer:
The financial markets are characterized by uncertainty, and the Semaphore Plot V2 is intended to serve as an analytical tool within a trader's arsenal, not a standalone solution for trading decisions. It is critical for users to understand that the script does not guarantee trading success nor does it claim to predict exact price movements. Traders should employ the Semaphore Plot V2 alongside comprehensive market analysis and sound risk management practices, acknowledging that past performance is not indicative of future results and that trading involves the risk of loss.

[KVA] Custom Sessions Custom Sessions: Multi-Timeframe Analysis & Key Level Insights
Introduction:
Introducing " Custom Sessions," an innovative Pine Script indicator meticulously crafted to empower traders by offering an advanced level of analysis on various global trading sessions. This tool is designed not just to highlight trading sessions but to delve deeper into the nuances of market movements by analyzing candlestick behavior within those sessions, offering a nuanced view of market trends, liquidity, and potential turning points.
Core Features :
Session Customization : Tailor trading sessions to align with your strategy, focusing on the markets that matter most to you. Whether it's London, New York, Tokyo, Sydney, or Frankfurt, you have the control.
Enhanced Market Insight : Beyond session timing, gain a refined understanding of market dynamics through detailed candlestick analysis within each session, providing a granular view of price action.
Comprehensive Analysis Tools : Alongside session analysis, the indicator includes features like VWAP (Volume Weighted Average Price) and Fibonacci retracement levels, offering a multifaceted approach to market analysis across chosen timeframes.
VWAP : Gain insights into the market's trend and liquidity by viewing the Volume Weighted Average Price calculated for the custom timeframe.
Fibonacci Retracement Levels : Easily identify potential reversal points with automatically plotted Fibonacci levels at 0.236, 0.382, 0.5, 0.618, and 0.782for each candle
Real-Time Updates : As the market moves, so does " Custom Sessions," offering real-time insights that adapt to the unfolding market conditions.
Utilization Guide :
Configure Your Sessions : Begin by setting up the sessions that are most relevant to your trading approach, customizing their times as needed.
Select the Desired Timeframe : Input your preferred higher timeframe to analyze data that is most relevant to your trading strategy.
Dive into the Details : Use the detailed candlestick analysis within sessions to pinpoint potential entry and exit points, supported by VWAP and Fibonacci levels for deeper market insight.
Customize Your View : Adjust the visual aspects of the indicator, including session color coding and which elements to display, tailoring the tool to your preferences.
Acknowledgements :
A special thanks to Aurocks_AIF for their foundational work on "Sessions on Chart" . This project has been an invaluable resource, inspiring the development of " Custom Sessions" and pushing the boundaries of traditional session analysis.
Final Thoughts :
" Custom Sessions" is more than just an indicator; it's a comprehensive analysis tool that brings a new depth to the understanding of market sessions. By offering detailed insights into the behavior of candles within these sessions, along with essential analysis features, this indicator is a must-have for traders seeking to enhance their technical analysis arsenal.
Whether you're a day trader looking to capture short-term movements or a long-term investor seeking broader market insights, this indicator offers valuable data visualization to enhance your trading decisions. By integrating highs, lows, VWAP, and Fibonacci levels into your analysis, you gain a comprehensive view of market behavior across different timeframes and sessions

Enhanced High Volume AbsorptionDescription of the "Enhanced High Volume Absorption" Indicator
The "Enhanced High Volume Absorption" indicator is a specialized trading tool designed for the TradingView platform, optimized for the 15-minute chart timeframe. It offers traders a unique approach to analyzing market momentum and strength by focusing on significant volume movements, which are often precursors to major price shifts.
What the Indicator Does:
High Volume Detection: This indicator identifies periods of high volume trading, which is a key indicator of strong market interest. High volume periods often precede significant price movements, making this an essential tool for anticipating market trends.
Volume Absorption Analysis: It analyzes the absorption of volume in the market. Absorption here refers to situations where the market is able to absorb trading volumes significantly higher than the average without a corresponding substantial change in price. This can be an indication of strong underlying market strength or weakness.
Price Movement Correlation: The script correlates volume spikes with price movements (upward or downward) to provide context to the volume absorption. This correlation helps determine whether the absorption is due to buying pressure (bullish indication) or selling pressure (bearish indication).
How It Does It:
Moving Average Comparisons: The script calculates short-term and long-term Simple Moving Averages (SMAs) of trading volumes. By comparing current volumes to these averages, it determines if the current volume is significantly higher than usual.
Volume Thresholds: It uses user-defined multipliers and minimum volume thresholds to filter significant volume events, ensuring that only notable volume spikes are considered.
Impact Analysis: Alongside volume analysis, the script computes the price change and its impact as a percentage of the current price, providing insights into the magnitude of price movements during these high-volume periods.
How to Use It:
Market Entry and Exit Points: The indicator can be used to spot potential entry and exit points. For example, a high volume absorption event with a minimal price change might indicate a strong support or resistance level.
Confirming Market Sentiment: It can be used in conjunction with other technical indicators to confirm market trends or reversals. High volume absorption aligned with other bullish or bearish indicators can provide a stronger case for a market move.
Scalping and Short-Term Trading: Optimized for the 15-minute timeframe, this indicator is particularly useful for scalpers and short-term traders. It helps in identifying quick market movements and can be a crucial part of a scalping strategy.
Originality and Underlying Concepts:
The originality of this indicator lies in its specific focus on volume absorption and its impact on price, especially tailored for short-term trading scenarios. Unlike many indicators that only analyze price movements or standard volume analysis, this script delves deeper into how the market is reacting to volume spikes, offering a nuanced view of market dynamics
that is often overlooked. The concept of volume absorption, coupled with the analysis of price movement direction, provides a unique perspective on market strength or weakness.
This tool is distinct in its approach as it doesn't just follow trends or provide generic scalping signals. Instead, it offers a methodical analysis of volume dynamics in relation to price action. By focusing on how the market absorbs volume, the indicator gives traders insights into whether current market movements are backed by substantial trading activity or if they are more likely to be short-lived.
Understanding volume absorption is crucial, especially in a 15-minute trading environment where market movements are swift and require quick decision-making. This indicator aids in identifying those moments when the market shows a significant reaction (or lack thereof) to large volumes, indicating potential setup for a strong move or reversal.
In summary, the "Enhanced High Volume Absorption" indicator is a valuable tool for traders who want to incorporate volume analysis into their trading strategy, especially in a fast-paced, short-term trading environment. It provides a deeper understanding of market dynamics, enabling traders to make more informed decisions based on the interplay between volume and price action.

RSI MFI MultiTimeframe Oversold/OverboughtHello Traders,
This indicator is designed to easily visualize the overbought/oversold states of RSI and MFI across multiple timeframes.
The indicator is very straightforward.
The deeper the red, the closer it is to 0, and the deeper the green, the closer it is to 100. The intermediate values are rendered in a transparent gray to focus on the key regions.
However, I understand that traders may have an interest in knowing the most recent state of the oscillator, whether it was overbought or oversold.
For this reason, I have included the 'Gradient Color' option in the color settings.
By turning off this option, you can easily see at a glance which region the oscillator was in most recently.
(Gradient Color Option Off)
In addition, I know that many traders are interested in the actual RSI/MFI values across multiple timeframes.
Thus, I have displayed the RSI/MFI values for each timeframe on the far right.
Furthermore, although the name of this indicator is RSI MFI MultiTimeframe Oversold/Overbought, I have also included the Stochastic RSI as an option, as I find it personally useful.
Feel free to use it if you find it helpful.

Risk Reward Optimiser [ChartPrime]█ CONCEPTS
In modern day strategy optimization there are few options when it comes to optimizing a risk reward ratio. Users frequently need to experiment and go through countless permutations in order to tweak, adjust and find optimal in their data.
Therefore we have created the Risk Reward Optimizer.
The Risk Reward Optimizer is a technical tool designed to provide traders with comprehensive insights into their trading strategies.
It offers a range of features and functionalities aimed at enhancing traders' decision-making process.
With a focus on comprehensive data, it is there to help traders quickly and efficiently locate Risk Reward optimums for inbuilt of custom strategies.
█ Internal and external Signals:
The script can optimize risk to reward ratio for any type of signals
You can utilize the following :
🔸Internal signals ➞ We have included a number of common indicators into the optimizer such as:
▫️ Aroon
▫️ AO (Awesome Oscillator)
▫️ RSI (Relative Strength Index)
▫️ MACD (Moving Average Convergence Divergence)
▫️ SuperTrend
▫️ Stochastic RSI
▫️ Stochastic
▫️ Moving averages
All these indicators have 3 conditions to generate signals :
Crossover
High Than
Less Than
🔸External signal
▫️ by incorporating your own indicators into the analysis. This flexibility enables you to tailor your strategy to your preferences.
◽️ How to link your signal with the optimizer:
In order to be able to analysis your signal we need to read it and to do so we would need to PLOT your signal with a defined value
plot( YOUR LONG Condition ? 100 : 0 , display = display.data_window)
█ Customizable Risk to Reward Ratios:
This tool allows you to test seven different customizable risk to reward ratios , helping you determine the most suitable risk-reward balance for your trading strategy. This data-driven approach takes the guesswork out of setting stop-loss and take-profit levels.
█ Comprehensive Data Analysis:
The tool provides a table displaying key metrics, including:
Total trades
Wins
Losses
Profit factor
Win rate
Profit and loss (PNL)
This data is essential for refining your trading strategy.
🔸 It includes a tooltip for each risk to reward ratio which gives data for the:
Most Profitable Trade USD value
Most Profitable Trade % value
Most Profitable Trade Bar Index
Most Profitable Trade Time (When it occurred)
Position and size is adjustable
█ Visual insights with histograms:
Visualize your trading performance with histograms displaying each risk to reward ratio trade space, showing total trades, wins, losses, and the ratio of profitable trades.
This visual representation helps you understand the strengths and weaknesses of your strategy.
It offers tooltips for each RR ratio with the average win and loss percentages for further analysis.
█ Dynamic Highlighting:
A drop-down menu allows you to highlight the maximum values of critical metrics such as:
Profit factor
Win rate
PNL
for quick identification of successful setups.
█ Stop Loss Flexibility:
You can adjust stop-loss levels using three different calculation methods:
ATR
Pivot
VWAP
This allows you to align risk-reward ratios with your preferred risk tolerance.
█ Chart Integration:
Visualize your trades directly on your price chart, with each trade displayed in a distinct color for easy tracking.
When your take-profit (TP) level is reached , the tool labels the corresponding risk-reward ratio for that specific TP, simplifying trade management.
█ Detailed Tooltips:
Tooltips provide deeper insights into your trading performance. They include information about the most profitable trade, such as the time it occurred, the bar index, and the percentage gain. Histogram tooltips also offer average win and loss percentages for further analysis.
█ Settings:
█ Code:
In summary, the Risk Reward Optimizer is a data-driven tool that offers traders the ability to optimize their risk-reward ratios, refine their strategies, and gain a deeper understanding of their trading performance. Whether you're a day trader, swing trader, or investor, this tool can help you make informed decisions and improve your trading outcomes.

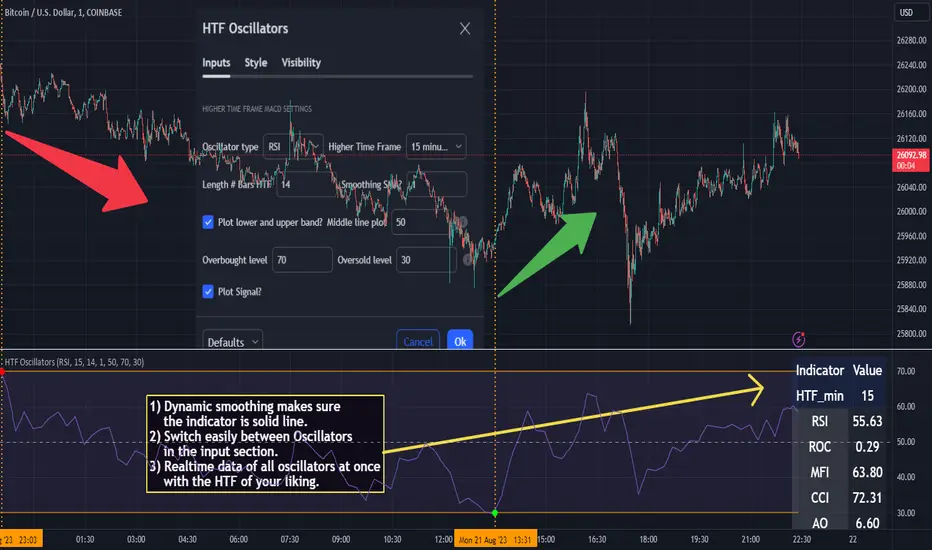
HTF Oscillators RSI/ROC/MFI/CCI/AO - Dynamic SmoothingThe Interplay of Time Frames: A Balanced View
Navigating the markets often involves interpreting trends from multiple angles. The HTF Oscillators with Dynamic Smoothing indicator enables you to do just that. This tool provides the option to integrate smoothed oscillator readings from Higher Time Frames (HTF) into lower time frame charts, such as a 1-minute chart. By doing so, the indicator offers a balanced viewpoint that bridges the gap between micro and macro perspectives, helping you make informed decisions without losing sight of the broader market context.
Features
Multi-Oscillator Support
Choose from a range of popular oscillators like the Relative Strength Index (RSI), Rate of Change (ROC), Money Flow Index (MFI), Commodity Channel Index (CCI), and Awesome Oscillator (AO). These oscillators are commonly used as foundational building blocks in trading strategy scripts by traders worldwide. Switch effortlessly between them, depending on your trading strategy and requirements. To maintain consistency and a familiar user experience, our script adopts the same visual aesthetics that you'll find in Pine Script indicators on TradingView: a sleek purple line for the oscillator and a transparent band filling. These visual elements are not only pleasing to the eye but also widely appreciated by the trading community.
Dynamic Smoothing
The unique dynamic smoothing feature calculates a smoothing factor based on the ratio of minutes between the Higher Time Frame (HTF) and your current time frame. This provides a sleek and responsive oscillator line that still holds the weight of the longer trend. One of the significant advantages of this feature is user experience; when you change your time frame, the HTF-values in your settings will remain consistent. This ensures that you can easily switch between different time frames without losing the insights provided by your selected HTF.
Visual Aids
Visual cues are an essential part of any trading strategy. The indicator not only plots signals to mark overbought and oversold conditions based on the dynamically smoothed oscillator but also provides you with the flexibility to customize your visual experience. You have the option to toggle on/off the display of these signals depending on your specific needs. Additionally, bands can be displayed at overbought and oversold levels, along with a reference middle line. If you switch between different oscillators (available in the parameter settings), remember to manually adjust the bands in the input settings to ensure signals matches with the type of oscillator to your liking.
User-Friendly Settings
We've grouped related settings together, making it easier for you to find what you're looking for. Adjust the oscillator type, length of bars, smoothing settings, and more with just a few clicks.
Information Table
A standout feature of this indicator is the real-time information table, which displays the values of all selected oscillators based on your specified Higher Time Frame (HTF) settings. This can be particularly useful for traders who depend on multiple indicators for their decision-making process. The data presented in the table is synchronized with the HTF options you've configured in the input settings, allowing for a more efficient and quick scan of values from higher time frames.
Educational Corner: The Power of the Information Table and Customization
The table incorporated into this indicator isn't just eye-candy; it's a practical tool designed to elevate your trading strategy. It dynamically displays real-time values of various oscillators for the HTF you've chosen. This is an exemplary use of TradingView's scripting capabilities to blend multiple indicators into a single visual panel, streamlining your analysis and decision-making process.
But here's the best part: You're not limited to what we've created. With some basic understanding of TradingView's scripting language, Pine Script, you can easily adapt this table to include different indicators that suit your unique trading style. The logic in the script is modular and can serve as a foundation for your own customized trading dashboard. So, go ahead, get creative and explore new combinations of indicators that will help you excel in your trading endeavors!
You no longer have to toggle between different charts or indicators to get the information you need; it's all there in one neatly organized table. We encourage you to tap into this feature and make it your own, empowering your trading like never before.
By doing so, you not only gain a more comprehensive toolset, but you also engage more deeply with your trading strategy, understanding its nuances and, ultimately, making more informed decisions.
Conclusion
The HTF Oscillators with Dynamic Smoothing is a versatile and powerful tool that brings together the best of both worlds: the perspective of higher time frames and the granularity of shorter ones. Its feature-rich setting options and real-time information table make it a potential useful addition to your trading toolkit.
Remember, while this indicator offers a comprehensive and smarter way to look at the markets, it is not a foolproof method for predicting market movements. Always use it in conjunction with other analysis methods and risk management strategies.
ATR VisualizerAdvance Your Market Analysis with the True Range Indicator
The True Range Indicator is a sophisticated screener meticulously developed to bolster your trading execution by presenting an exceptional understanding of the market direction. The centerpiece of this instrument is a distinctive candle configuration depicting the Average True Range (ATR) and the Bear/Bull range. However, it traverses beyond the conventional channels to offer specific market settings to boost your trading decisions.
User-Defined Settings
Broadly, the indicator offers five dynamic settings:
Bear/Bull Range
The Bear/Bull Range outlines the ATR for each candle type - bearish and bullish - and then smartly opts for the pertinent one based on the prevalent market circumstances. This feature aids in comparing the range of bullish and bearish candlesticks, which deepens your understanding of the price action and volatility.
Bearish Range
The Bearish Range isolates and computes the ATR for bearish candles solely. Utilizing this option spots the bear-dominated periods and provides insights about potential market reversals or downward continuations.
Bullish Range
Opposite to the Bearish Range, the Bullish Range setting tabulates the ATR exclusively for bullish candles. It assists in tracking the periods when bulls control, enlightening traders about the possibility of upward continuations or trend reversals.
Average Range
The Average Range provides an unbiased measure of range without prioritizing either bull or bear trends. This model is ideal for traders looking for a holistic interpretation of market behavior, regardless of direction.
Cumulative Average Range
Equally significant is the Cumulative Average Range which calculates the aggregate moving average of the true ranges for an expressed period. This setting is extremely valuable when evaluating the long-term volatility and spotting potential breakouts.
Dual Candle Configuration
Going a step ahead, the True Range Indicator uniquely offers the possibility to incorporate more than one candle estimate on your screen. This ensures simultaneous analysis of multiple market dynamics, thereby enhancing your trading precision multifold.
Concluding Thoughts
In essence, the True Range Indicator is an indispensable companion for traders looking to not only leverage market volatility but also make educated predictions. Equipped with an array of insightful market settings and the ability to display dual candle estimates on-screen, you can customize the functionality to suit your unique trading style and magnify your market performance dramatically.

QFL Screener [ ZCrypto ]The QFL Screener is a robust tool inspired by Quickfingersluc's trading strategy.
Known as the Base Strategy or Mean Reversals, QFL focuses on identifying moments of panic selling and buying , presenting opportunities to enter trades at deeply discounted prices.
The QFL Screener is designed to enhance your trading efficiency by simultaneously scanning 40 symbols.
You have the flexibility to enable or disable specific symbols from the screening process, allowing you to tailor the screener to your preferred markets and instruments.
The Screener has a built-in alerts system . As soon as the QFL conditions align for any of the scanned symbols, you'll receive instant notifications, empowering you to take prompt action and seize potential trading opportunities.
In addition, I've incorporated a visual element to complement the alerts. Once the conditions are true, a green arrow shape will appear directly on the chart, providing a clear and intuitive signal of the QFL opportunity.
To provide a clear overview, our screener presents a comprehensive table that highlights when the QFL condition becomes true for each symbol. This table acts as a visual guide, enabling you to monitor the status of multiple symbols at a glance, streamlining your trading decision-making process.
With the QFL Screener, you gain an edge in identifying profitable trade setups based on Quickfingersluc's renowned approach. Experience the convenience of simultaneous screening, real-time alerts, and an intuitive table display, all in one user-friendly tool.

[JL] Fractals ATR BlockI decided to combine Fractal ROC , ATR Break, and Order Blocks to an Indicator
The Fractal ROC , ATR Break, and Order Blocks indicator combines three concepts to help traders identify potential trade opportunities and manage risk. By using a combination of Fractal ROC , ATR Break, and Order Blocks, traders can gain a deeper understanding of market dynamics and make more informed trading decisions.
Fractal ROC is a momentum-based indicator that calculates the rate of change of the price between fractals, which are turning points in the market. It is calculated by taking the difference between the closing price and the lowest price in the previous n+1 periods, and dividing it by the difference between the open price 2n periods ago and the lowest price in the previous n+1 periods. This calculation is done for both up and down fractals. When the Fractal ROC value is greater than the ROC Break Level (as determined by the input variable roclevel), it indicates a potential momentum shift in the market. This can be used to identify potential trade entries or exits, depending on your trading strategy.
ATR Break is an indicator that helps traders identify significant price movements in the market. It measures the distance between the price and the Average True Range (ATR), which is a measure of the volatility of the market. ATR Break is calculated by taking the difference between the close and high/low, and dividing it by the previous ATR value. This calculation is done for both up and down movements. When the ATR Break value is greater than the ATR Break Level (as determined by the input variable atrlevel), it indicates a significant move in the market. This can be used to identify potential breakouts or breakdowns, and can be used to set stop-loss and take-profit levels.
An Order Block is a price level where significant buying or selling activity has taken place. The order blocks made by ATR Break and Fractal ROC are drawn using boxes on the chart. When the ATR or Fractal ROC level is breached, a box is drawn with the high and low of the candle that breached the level as the top and bottom of the box, respectively. The box is then extended to the right until the end of the chart or until another ATR or Fractal ROC level is breached, at which point a new box is drawn. This allows traders to easily identify significant price movements and potential support and resistance levels on the chart. When an Order Block is identified, it can be used as a potential support or resistance level . If price approaches an Order Block from below, it is likely to bounce off this level and continue in an upward direction. Similarly, if price approaches an Order Block from above, it is likely to bounce off this level and continue in a downward direction. Traders can use these levels to identify potential trade entries or exits, as well as to set stop-loss and take-profit levels.
Overall, the Fractal ROC , ATR Break, and Order Blocks indicator is a powerful tool for traders who want to identify potential trade opportunities and manage risk. By combining these three concepts, traders can gain a deeper understanding of market dynamics and make more informed trading decisions. As with any indicator, it is important to use it in conjunction with other analysis tools and to have a clear trading plan in place.

3Commas Bot DCA Backtester & Signals FREEThis is a DCA Strategy backtester + signals, built to emulate the 3Commas DCA bots. It uses your choice of 4 different buy signals, 2 of which can be adjusted in the settings. Everything is customizable so you can backtest specific settings with different buy signals and find the best performing strategy for your risk tolerance and capital. It can be used to backtest strategies on stocks as well, but just make sure your base order is larger than the share price for the entire backtesting range or it will not calculate properly.
You can use this template to code your own buy signals and then backtest them as a DCA strategy if you know some basic pine script.
The indicator shows all of your backtesting orders on the chart. The red line is your take profit level, the blue line is your average price level, the white line is your first order and the green lines are your average down orders. If you enable a stop loss in the settings your stop loss will be shown as an orange line once all of your average down orders have been hit, it will not be set until price has dipped below your covered trading range.
These levels update when things change during backtesting so you can visualize your strategy and how it would perform as well as see if your percentage deviation is large enough to cover dips. When backtesting trades are taken, the chart will show where they were taken(in backtesting) along with info on those trades such as the number each order is, the size of that order and the percentage deviation that order is from the initial buy.
SENDING SIGNALS TO 3COMMAS
Tradingview cannot sync this backtester to 3Commas and with the way alerts are setup for strategies on Tradingview, the best option for you to give signals to your bot would be to use this backtester to figure out what trigger you want to use and then setup that indicator separately to send alerts to your bot. All of the indicators used for signals in this backtester are available for free and can be configured to match this backtester and send alerts to 3Commas for you. Just make sure you set your alerts to once per bar close and don’t use less than a 15 second timeframe because then you could trigger the Tradingview threshold for alerts and get your alerts shut off.
You can also use this backtester with your own buy triggers if you know a little pine script. Just make copy of the script and code in your own buy signals and see how it backtests.
INFO PANEL FOR ANALYZING YOUR STRATEGY
The right hand side of the screen will show an info panel that shows a lot of different information so you can quickly see your bot settings and how it performed right on the screen.
In the top right corner you will see in purple your bot settings. These include your stoploss % if turned on, take profit %, average down order %, average down order % multiplier, volume multiplier, max number of orders allowed and size of your base order.
The top section of the first column “Current Trade” shows these stats: the open trade’s average price, the open trade’s take profit price, the open trade’s PNL, how far price is from your open tarde’s take profit level in percentage, your open position size and number of open orders.
The bottom section of the first column “Overall Performance” shows these stats: total number of trades taken during backtesting range, the largest amount of trades that were open at one time during backtesting, the max drawdown, the average number of bars per trade, gross profit, net profit, percent profit from your initial capital, current portfolio value and your initial capital.
CUSTOMIZABLE OPTIONS TO FIND THE PERFECT STRATEGY
Stoploss On/Off
This will turn your stoploss on or off. By default it is set to off and will not affect anything unless turned on.
Stoploss Percentage
This is the percentage below your final average down order price that will be set as a stoploss to keep your account from going too far in the red on big dips.
Take Profit Percentage - This is the percentage of profit you want the trade to hit before taking profit on your entire DCA trade. This level updates everytime you average down.
Average Down Percentage - This is the percentage that price has to drop from your initial order to initiate your first safety order. If the Average Down Percent Multiplier is set to 1 then this percentage will be the same for every average down order.
Average Down Percentage Multiplier - This multiplies your Average Down Percentage so each safety order needs a larger percentage deviation than the previous one. This keeps your buys closer together at the beginning and further apart when you hit more orders so you can extend your trading range but still be aggressive when price is going sideways.
Volume Multiplier Per New Order - This multiplies the size of each trade based on your base order. If you set it to a 2x multiplier then each average down order will be 2 times the size of the last one. So for example, a $100 base order with a 2x multiplier would have these values for the first 3 average down orders: 200, 400, 800.
Size Of Base Order - This is the size of your first position entry and will be used as a starting point for the volume multiplier. If your base order is $100 then it will buy $100 worth of whatever crypto you are backtesting this on. If you are looking at stock charts, you need to make sure your base order is higher than the share price across the entire backtesting range or it will not perform correctly.
Max Number Of Orders - This is the maximum number of orders the bot can take, including your base order. Adjust this to suit the amount of capital you are willing to allocate to your bot based on how much money it will require to run according to your bot settings.
TIPS ON HOW TO USE FOR BEST RESULTS
If you don’t have a lot of capital to work with, then use longer timeframes with a reasonable take profit percentage so that you don’t need a lot of average down orders. You can also try keeping the volume multiplier close to 1.
You can use the 3Commas dca bot settings page to see how much capital you will need for your strategy if you match it to the settings you have on this indicator. You can also check to see how much of a percentage deviation your bot is covering to make sure you have a reasonable range to trade in and orders to cover big dips. You can also check your coverage by seeing how far down the chart the green lines cover, which are your average down orders.
Make sure the initial capital in the properties tab of the settings has enough to cover all of your orders otherwise you will get unrealistic backtesting results. Also, make sure you leave the order size in the properties tab on contracts so it calculates your trades correctly. The only settings you need to touch in the properties tab is the initial capital. Unless you are trading somewhere that has lower commission fees, then you can change that to match, but leave all the other settings as is for it to function properly.
Increasing the volume multiplier will make your average price and take profit target follow the price action a lot closer as price falls, but it can also lead to having very large orders very quickly once you get into the 1.5-3x multiple range. Try using a high volume multiplier with less safety orders and you will get better results, however you need to have money on the sidelines to add on major dips to keep your bot turning a profit. Be very careful with this as greed and impatience will hurt your overall performance. This bot is meant to make money with lots of small wins so don’t get greedy and make sure you have enough money to cover large dips. If you are being aggressive with your bot, then I recommend only using 25% or less of your portfolio to trade aggressively and then use the smart trade feature on 3commas to add chunks of funds to your trades when price dips below your last safety order. Or if you want it to run without any supervision, then use lower volume multipliers and have lots of safety orders that can cover entire bear markets and still keep buying lower.
It’s a good idea to have some capital on the sidelines that you can add in when price dips quickly. This will help lower your average price and allow your bot to get out in profit quicker. 3Commas bot has a smart trade feature that will allow you to track your average price when adding extra funds and it will automatically update your other orders which is very convenient. Look at the longer timeframes when price dips and only add chunks at major areas where price is very likely to bounce. Or you can be aggressive when trading and add to your position when price dips and is at a likely bounce zone to maximize profits.
Only trade coins that have a good amount of liquidity as the larger your orders get, the harder it will be to sell if there isn’t much liquidity. Also, beware of how large your first order is as it will usually be a market order and can move the market if there is not much liquidity.
Since this bot takes a lot of trades and performs best when taking small profits consistently, you will need to factor in exchange fees. The bot is set to .5% commission(you can change this) on the buy and sell orders as most exchanges charge that amount. Some exchanges offer no fee trading on certain coins so be sure to look around for those so you can keep the commissions and maximize profits.
I strongly encourage you to try out a lot of different setting combinations across multiple different coins and do it across a few months to see how it would have performed under various market conditions. This will help you get a better idea of how much of a percentage deviation you’ll need to be able to cover to keep your bot running and making constant profits. You can also use the deep backtesting feature of the strategy panel to see how it would have done, but just beware that the info panel of the indicator will not reflect deep backtesting results, only the normal backtesting range.
MARKETS
This backtester can be used on any market including crypto, stocks, forex & futures. You just need to make sure your base order is larger than the share price when using this on things besides crypto.
TIMEFRAMES
This backtester can be used on all timeframes.

TrapFrames (Stocks)TrapFrames (Stocks) is the Stock version of Trapframes that is the table chart from Traplight that showed the current values for a symbol for Traplight and Kriss/Kross, but cranked up to 11! You can select from a large list of stocks to create a dashboard-like view of your favorite symbols. So that you can "Check the Weather" so to speak. This is mainly to be used as a companion indicator to Traplight. So, that you can find which of your symbols looks interesting, and delve more deeply into them on an individual basis from there.
TrapFramesTrapFrames is the table chart from Traplight that showed the current values for a symbol for Traplight and Kriss/Kross, but cranked up to 11! You can select from a large list of pairs/indexes to create a dashboard-like view of your favorite symbols. So that you can "Check the Weather" so to speak. This is mainly to be used as a companion indicator to Traplight. So, that you can find which of your symbols looks interesting, and delve more deeply into them on an individual basis from there.

Lyapunov Hodrick-Prescott Oscillator w/ DSL [Loxx]Lyapunov Hodrick-Prescott Oscillator w/ DSL is a Hodrick-Prescott Channel Filter that is modified using the Lyapunov stability algorithm to turn the filter into an oscillator. Signals are created using Discontinued Signal Lines.
What is the Lyapunov Stability?
As soon as scientists realized that the evolution of physical systems can be described in terms of mathematical equations, the stability of the various dynamical regimes was recognized as a matter of primary importance. The interest for this question was not only motivated by general curiosity, but also by the need to know, in the XIX century, to what extent the behavior of suitable mechanical devices remains unchanged, once their configuration has been perturbed. As a result, illustrious scientists such as Lagrange, Poisson, Maxwell and others deeply thought about ways of quantifying the stability both in general and specific contexts. The first exact definition of stability was given by the Russian mathematician Aleksandr Lyapunov who addressed the problem in his PhD Thesis in 1892, where he introduced two methods, the first of which is based on the linearization of the equations of motion and has originated what has later been termed Lyapunov exponents (LE). (Lyapunov 1992)
The interest in it suddenly skyrocketed during the Cold War period when the so-called "Second Method of Lyapunov" (see below) was found to be applicable to the stability of aerospace guidance systems which typically contain strong nonlinearities not treatable by other methods. A large number of publications appeared then and since in the control and systems literature. More recently the concept of the Lyapunov exponent (related to Lyapunov's First Method of discussing stability) has received wide interest in connection with chaos theory . Lyapunov stability methods have also been applied to finding equilibrium solutions in traffic assignment problems.
In practice, Lyapunov exponents can be computed by exploiting the natural tendency of an n-dimensional volume to align along the n most expanding subspace. From the expansion rate of an n-dimensional volume, one obtains the sum of the n largest Lyapunov exponents. Altogether, the procedure requires evolving n linearly independent perturbations and one is faced with the problem that all vectors tend to align along the same direction. However, as shown in the late '70s, this numerical instability can be counterbalanced by orthonormalizing the vectors with the help of the Gram-Schmidt procedure (Benettin et al. 1980, Shimada and Nagashima 1979) (or, equivalently with a QR decomposition). As a result, the LE λi, naturally ordered from the largest to the most negative one, can be computed: they are altogether referred to as the Lyapunov spectrum.
The Lyapunov exponent "λ" , is useful for distinguishing among the various types of orbits. It works for discrete as well as continuous systems.
λ < 0
The orbit attracts to a stable fixed point or stable periodic orbit. Negative Lyapunov exponents are characteristic of dissipative or non-conservative systems (the damped harmonic oscillator for instance). Such systems exhibit asymptotic stability; the more negative the exponent, the greater the stability. Superstable fixed points and superstable periodic points have a Lyapunov exponent of λ = −∞. This is something akin to a critically damped oscillator in that the system heads towards its equilibrium point as quickly as possible.
λ = 0
The orbit is a neutral fixed point (or an eventually fixed point). A Lyapunov exponent of zero indicates that the system is in some sort of steady state mode. A physical system with this exponent is conservative. Such systems exhibit Lyapunov stability. Take the case of two identical simple harmonic oscillators with different amplitudes. Because the frequency is independent of the amplitude, a phase portrait of the two oscillators would be a pair of concentric circles. The orbits in this situation would maintain a constant separation, like two flecks of dust fixed in place on a rotating record.
λ > 0
The orbit is unstable and chaotic. Nearby points, no matter how close, will diverge to any arbitrary separation. All neighborhoods in the phase space will eventually be visited. These points are said to be unstable. For a discrete system, the orbits will look like snow on a television set. This does not preclude any organization as a pattern may emerge. Thus the snow may be a bit lumpy. For a continuous system, the phase space would be a tangled sea of wavy lines like a pot of spaghetti. A physical example can be found in Brownian motion. Although the system is deterministic, there is no order to the orbit that ensues.
For our purposes here, we transform the HP by applying Lyapunov Stability as follows:
output = math.log(math.abs(HP / HP ))
You can read more about Lyapunov Stability here: Measuring Chaos
What is. the Hodrick-Prescott Filter?
The Hodrick-Prescott (HP) filter refers to a data-smoothing technique. The HP filter is commonly applied during analysis to remove short-term fluctuations associated with the business cycle. Removal of these short-term fluctuations reveals long-term trends.
The Hodrick-Prescott (HP) filter is a tool commonly used in macroeconomics. It is named after economists Robert Hodrick and Edward Prescott who first popularized this filter in economics in the 1990s. Hodrick was an economist who specialized in international finance. Prescott won the Nobel Memorial Prize, sharing it with another economist for their research in macroeconomics.
This filter determines the long-term trend of a time series by discounting the importance of short-term price fluctuations. In practice, the filter is used to smooth and detrend the Conference Board's Help Wanted Index (HWI) so it can be benchmarked against the Bureau of Labor Statistic's (BLS) JOLTS, an economic data series that may more accurately measure job vacancies in the U.S.
The HP filter is one of the most widely used tools in macroeconomic analysis. It tends to have favorable results if the noise is distributed normally, and when the analysis being conducted is historical.
What are DSL Discontinued Signal Line?
A lot of indicators are using signal lines in order to determine the trend (or some desired state of the indicator) easier. The idea of the signal line is easy : comparing the value to it's smoothed (slightly lagging) state, the idea of current momentum/state is made.
Discontinued signal line is inheriting that simple signal line idea and it is extending it : instead of having one signal line, more lines depending on the current value of the indicator.
"Signal" line is calculated the following way :
When a certain level is crossed into the desired direction, the EMA of that value is calculated for the desired signal line
When that level is crossed into the opposite direction, the previous "signal" line value is simply "inherited" and it becomes a kind of a level
This way it becomes a combination of signal lines and levels that are trying to combine both the good from both methods.
In simple terms, DSL uses the concept of a signal line and betters it by inheriting the previous signal line's value & makes it a level.
Included:
Bar coloring
Alerts
Signals
Loxx's Expanded Source Types

Intraday Background Time RangesThis simple script was written for studying recurring intraday behaviours of financial instruments. With it, you can highlight up to 13 customizable time ranges on your chart, filling the corresponding background space with colors you prefer. You can then write a note for each range and it will be shown in the optional related table.
The experience shows that every financial instrument has its own personality. With this in mind, the script can be useful to study intraday charts with the purpose of discovering recurring behaviours of specific instruments over a certain time range and under specific circumstances (normal days, earnings days, days with catalysts, etc.) This can help the trader to deeply understand the instrument personality, and therefore also to decide whether to enter or exit the market if its behaviour meets or not his expectations.
Please note that this script only works on minute/hourly charts.
LTF -> HTF volume delta Up/DownThis script derives from my previous Educational LTF -> HTF volume delta script.
Total volume is displayed as columns in the background.
With request.security_lower_tf() we get data from a lower timeframe.
In this case, volume, which is placed in an 'up-array' when the 'lower timeframe close' > 'lower timeframe open',
or in an 'down-array' when the 'lower timeframe close' < 'lower timeframe open'.
This is displayed here as 2 (red/green) lines
When you're at a chart timeframe (Higher timeframe), lower than Daily, the lower timeframe is automatically 50x smaller than the higher timeframe.
Example D = 1440 minutes -> divided by 50 = 28.8 or rounded a lower timeframe of 29 minutes
When this number is below 1, it will take the '1 minute timeframe' as lower timeframe
If the higher timeframe chart is Daily or higher, a 'x minute-lower timeframe' chart is calculated from the timeframe.multiplier multiplied by 25,
for example a 2D higher timeframe will do the 'lower timeframe calculations' with a 50 minute TF (25 * 2 'D')
Looking at for example BTC on the Daily higher timeframe, some interesting observations can be done when looking at the 'spikes'
This script doesn't have build in arrows, it is merely made to give some stimulation,
and hopefully some of you can work further on this technique, because I think it is very promising!
I want to thank Tradingview very deeply, why?
Just so many reasons, development, moderation, organisation, helpdesk, ...
The amount of work they are doing is incredible!

Triple ThreatThis indicator provides buy and sell signals for Bitcoin based on confluence from well-known momentum, volatility, and trend indicators. It has successfully captured the major directional trends on Bitcoin's daily chart since 2018, and the settings are currently optimized for this chart in particular. This indicator implements RSI to gauge momentum, BBWP to gauge volatility, and an EMA to gauge trend. Maximum confluence signals are represented by horizontal bars in the indicator's pane, where the tallest green bar is a confirmed buy signal, and the tallest red bar is a confirmed sell signal. The shortest bar represents a momentum-only signal, and the second-shortest bar represents a volatility signal in confluence with the previously given momentum signal.
To track momentum, the RSI is plotted to the indicator plane against a moving average of the RSI. A momentum signal is generated when the RSI crosses over its moving average, retests/approaches the moving average, and then continues in the crossover direction (i.e., it fails to cross the moving average to the opposite side, creating a successful retest). The settings that affect this trigger are the "Crossover Threshold," which specifies how much the RSI should exceed the moving average to be considered a crossover, and the "Retest threshold," which specifies how closely the RSI should approach the moving average to be considered a retest. A momentum signal is ALSO generated if the RSI or its moving average exceed their counterpart by a certain threshold. For example, if the threshold was set at 10, a BUY signal would be generated when the RSI exceeds the moving average by 10, or a SELL signal would be generated when the moving average exceeds the RSI by 10. This threshold can be set using the "Instant Signal Threshold" setting. Either type of momentum signal will be plotted on the pane as the shortest horizontal bar, with its color indicating the signal's direction.
Volatility is primarily measured using the Bollinger Band Width Percentile (BBWP) indicator, which was created by The_Caretaker. BBWP plots the volatility of the asset's price, given by Bollinger Band width, relative to past volatility by assigning the volatility readings into percentiles. The indicator also includes a moving average of the BBWP itself, where a crossover to the upside represents expanding volatility and a crossover to the downside represents contracting volatility. This indicator is used to confirm a signal given by the momentum indicators - a momentum signal that is given during a period of expanding volatility has a greater likelihood of success. Therefore, when the BBWP crosses above its moving average by a given threshold, a previously triggered momentum signal is considered to be "confirmed." The threshold for this crossover can be set using the "BBWP Confirmation Threshold" setting. However, it is also relevant that periods of extreme volatility often accompany an extremity in price action (a "top" or "bottom"), in which case the BBWP is likely to contract after price reaches such an extremity. This phenomenon is captured by also using "extreme reads" on the momentum indicator to signal that there has already been enough volatility to confirm a momentum signal. If the RSI gives an "extreme read" before triggering a signal, the momentum signal is also considered to be confirmed. For example, if the RSI is above 80, breaks below 80, and then gives a SELL signal, this sell signal is considered to be confirmed without requiring the BBWP to crossover its moving average to the upside. The threshold that would confirm a SELL signal can be set with the "Overbought" setting, and the threshold that would confirm a BUY signal can be set with the "Oversold" setting. Whenever a volatility signal confirms a momentum signal, a medium-sized horizontal bar will be plotted on the pane in the same directional color as the momentum signal. Note that a momentum signal may trigger at the exact same time as the volatility signal which confirms it; in this case, only the medium-sized bar will be visible on the pane, but its direction can still be identified by its color.
Lastly, to reduce the likelihood of "false signals," a trend indicator is used to confirm the direction of the signal. This is typically an exponential moving average. If a confirmed volatility SELL signal is given, and the closing price is below the moving average, then the SELL signal is also confirmed by the trend. Likewise, if a confirmed volatility BUY signal is given, and the closing price is above the moving average, then the BUY signal is confirmed by the trend. The type and length of the moving average used to verify the trend can be set using the "Moving Average Type" and "Moving Average Length" settings found below the momentum/volatility settings. A trend signal is plotted on the pane as a tall horizontal bar, and is more deeply colored than the momentum and volatility signals.
For maximum confluence, it is recommended that the trend signal, given by the tallest bar, is the one that forms the basis of trades executed while using the Triple Threat indicator. It is possible to enter more aggressive trades with better entries by using only the volatility signal, given by the medium-sized bar, however this entails greater risk and should only be done in confluence with an additional trading strategy of your own discretion. Backtesting has shown that using the volatility signal alone underperforms using the volatility signal in confluence with the trend signal.
Please also be advised that the default setting are optimized for Bitcoin's daily chart only. The indicator is still applicable to other timeframes and asset classes, but the settings may need to be modified. I have a list of settings for other Bitcoin timeframes, and I would be happy to share them upon request.
I hope you can find this indicator to be of some use to your trading strategies. I'd be happy to hear any feedback from the community, so please don't hesitate to reach out. Stay safe, and happy trading.

XABCD Harmonic Pattern Custom Range Interactive█ OVERVIEW
This indicator was designed based on Harmonic Pattern Book written by Scott Carney. It was simplified to user who may always used tools such as XABCD Pattern and Long Position / Short Position, which consume a lot of time, recommended for both beginner and expert of Harmonic Pattern Traders. XABCD Pattern require tool usage of Magnet tool either Strong Magnet, Week Magnet or none, which cause error or human mistake especially daily practice.
Simplified Guideline by sequence for Harmonic Pattern if using manual tools :
Step 1 : Trade Identification - XABCD Pattern
Step 2 : Trade Execution - Any manual tools of your choice
Step 3 : Trade Management - Position / Short Position
█ INSPIRATION
Inspired by design, code and usage of CAGR. Basic usage of custom range / interactive, pretty much explained here . Credits to TradingView.
I use a lot of XABCD Pattern and Long Position / Short Position, require 5 to 10 minutes on average, upon determine the validity of harmonic pattern.
Upon creating this indicator, I believed that time can be reduced, gain more confidence, reduce error during drawing XABCD, which helps most of harmonic pattern users.
█ FEATURES
Table can positioned by any postion and font size can be resized.
Table can be display through optimized display or manual control.
Validility of harmonic pattern depends on BC ratio.
Harmonic pattern can be displayed fully or optimized while showing BC ratio validity.
Trade Execution at point D can be displayed on / off.
Stop Loss and Take Profit can be calculated automatically or manually.
Optimized table display based extend line setup and profit and loss setup.
Execution zone can be offset to Point C, by default using Point D.
Currency can be show or hide.
Profit and Loss can be displayed on axis once line is extended.
█ HOW TO USE
Step 1 : Trade Identification - Draw points from Point X to Point C. Dont worry about magnet, point will attached depends on High or Low of the candle.
Step 2 : Trade Execution - Check the validity of BC to determine the validity of harmonic pattern generated. Pattern only generate 1 pattern upon success. Otherwise, redraw to other points.
Step 3 : Trade Management - Determine the current candle either reach Point D or Potential Reversal Zone (PRZ). Check for Profit & Loss once reach PRZ.
█ USAGE LIMITATIONS
Harmonic Patterns only limits to patterns mentioned in Harmonic Trading Volume 3 due to other pattern may have other or different philosophy.
Only can be used for Daily timeframe and below due to bar_time is based on minutes by default.
Not recommended for Weekly and Monthly timeframe.
If Point X, A, B, C and D is next to each other, it is recommend to use lower timeframe.
Automated alert is not supported for this release. However, alert can be done manually. Alert will updated on the version.
█ PINE SCRIPT LIMITATIONS
Known bug for when calculate time in array, causing label may not appeared or offset.
Unable to convert to library due to usage of array.get(). I prefer usage for a combination of array.get(id, 0), array.get(id, 1), array.get(id, 2) into custom function, however I faced this issue during make arrays of label. Index can be simply refered as int, for id, i not sure, already try id refered as simple, nothing happens.
linefill.new() will appeared as diamond box if overused.
Text in box.new() unable to use ternary condition or switch to change color. Bgcolor also affected.
Label display is larger than XABCD tool. Hopefully in future, have function to resize label similar to XABCD tools.
█ IMPORTANTS
Trade Management (Profit & Loss) is calculated from Point A to D.
Take Profit is calculated based on ratio 0.382 and 0.618 of Point A to D.
Always check BC validity before proceed to Trade Management.
Length of XABCD is equal to XAB plus BCD, where XAB and BCD are one to one ratio. Length is measured in time.
Use other oscillator to countercheck. Normally use built-in Relative Strength Index (RSI) and Divergence Indicator to determine starting point of Point X and A.
█ HARMONIC PATTERNS SUPPORTED
// Credits to Scott M Carney, author of Harmonic Trading Volume 3: Reaction vs. Reversal
Alt Bat - Page 101
Bat - Page 98
Crab - Page 104
Gartley - Page 92
Butterfly - Page 113
Deep Crab - Page 107
Shark - Page 119 - 220
█ FAQ
Pattern such as 5-0, perfect XABCD and ABCD that not included, will updated on either next version or new release.
Point D time is for approximation only, not including holidays and extended session.
Basic explaination for Harmonic Trading System (Trade Identification, Trade Execution and Trade Management).
Harmonic Patterns values is pretty much summarized here including Stop Loss.
Basic explanation for Alt Bat, Bat, Crab, Gartley, Deep Crab and Butterfly.
█ USAGE / TIPS EXAMPLES (Description explained in each image)

+ Breadth & Volumenote* If you've used my "+ Rate of Change Indicator", I am updating that without the OBV, which has been moved here. Just an FYI.
This "indicator" is basically a variety of indicators that measure volume, or accumulation/distribution. There's a bit of a story about how this came about but
it's not that interesting, so I'll spare you.
Indicators from which you may choose here are On Balance Volume (OBV), Money Flow Index (MFI), Chaikin Money Flow (CMF), Chaikin Oscillator, and Positive & Negative Net Volume.
I'll give a brief overview of these below, and if you want to educate yourself further on them you may. There are many web resources for that.
Most people are probably familiar with OBV. It's one of the more commonly used volume indicators, especially in the crypto crowd (at least amongst those traders I follow). It's basically a cumulative (doesn't oscillate around a midpoint) momentum indicator that measures volume of the current period versus volume of the previous period and adds it if price closed higher, but subtracts it if price closes lower. It's another way of using volume to confirm trend.
The MFI is a momentum indicator that measures the flow of money into and out of an asset over some period of time (user input). It's calculated using the RSI, so it can be used similarly to RSI (divergences, overbought, oversold, etc.), but of course unlike the RSI it's calculated primarily using volume and comparing the most recent candle close to the previous one (similar to OBV).
CMF is a volume-weighted average of accumulation and distribution over a some period of time (typically 21). It's a way of measuring accumulation versus
distribution in an asset, and oscillates around a zero line. You would use it similarly to any other oscillator, in that you can look for divergences, and general positive or negative momentum.
Chaikin Oscillator is basically a MACD (without signal line) of the accumulation and distribution index (or line--which is somehow different than simply accumulation and distribution). I haven't looked into these differences deeply, but if you look below at the calculations, and substituted 'ad' for 'accdist' you get very different readings. I actually did that, and what it looks like it would do is turn the actual Oscillator into a MACD signal line. So, by substituting 'ad' for 'accdist' (or the accumulation/distribution index) you produce a signal line of the Chaikin Oscillator.
Anyway, all that confusion out of the way, as I said, it's a MACD on the accumulation and distribution index, therefore it is another zero line oscillator, and similarly to CMF, it's a way of measuring price movements in the chart versus a/d. The zero line isn't just any old zero line, however, it is actually the accumulation distribution line. I've made an OBV version of this by substituting the OBV for AD, so if you prefer OBV maybe you will like that.
Pos. & Neg Net Volume is actually an indicator I had seen made by RafaelZioni. It basically takes net volume, calculates a cumulative of that, then subtracts a moving average of some period from the cumulative net volume in order to create a volume oscillator. Use it like the other oscillators!
Added Donchian Channels, moving averages, Bollinger Bands, colored everything, and alerts.
Enjoy!
Below I will post images with the different indicators, everything on default settings (except for lookback period, which I have adjusted to my personal preferences).
Above is an image with the MFI being compared to the RSI since they are very similar (MFI being basically a volume derivative of the RSI).
Chaikin Money Flow set to lookback of 13. You could probably extend that a bit if you wanted to smooth the line more.
Chaikin Oscillator and Chaikin Oscillator of OBV, with a zoomed in look below, to see the differences more clearly.
CO and COBV closer look.
Positive & Negative Net Volume.
