Qullamaggie ADR and Volatility and Price Change IndicatorElevate your trading strategy with Qullamaggie ADR, a dynamic indicator inspired by the Kristjan Qullamaggie trading approach. Gain a deeper understanding of market dynamics, daily price movements, and potential turning points.
Key Features:
Qullamaggie ADR: Assess market volatility through the QullaADR, offering customizable time intervals (5, 10, 15, 20 days) to adapt to various trading styles.
Today's Change: Monitor price changes relative to the low of the current trading day, providing valuable intraday insights.
PrevDay price differentials from the previous day's low, aiding in the identification of potential trend reversals.
Track the percentage change from the opening price, offering a snapshot of intraday market sentiment.
Percent from 10-day SMA: Visualize the percentage difference between the closing price and a 10-day Simple Moving Average (SMA), a key trend-following indicator.
Usage:
Utilize QullaADR to set realistic profit targets and stop-loss levels based on current market conditions.
Identify potential trend shifts by observing changes from the previous day's low with Today's QullaChange.
Incorporate QullaPercent from 10-day SMA for trend confirmation and well-informed trading decisions.
Strategy Inspiration:
QullaADR draws inspiration from the Kristjan Qullamaggie trading strategy, aiming to complement your trading toolkit and enhance decision-making.
Disclaimer:
Trading involves risk, and past performance is not indicative of future results. Use this indicator as a supplementary tool within a comprehensive trading strategy.
Version: 1.0
Поиск скриптов по запросу "deep股票代码"

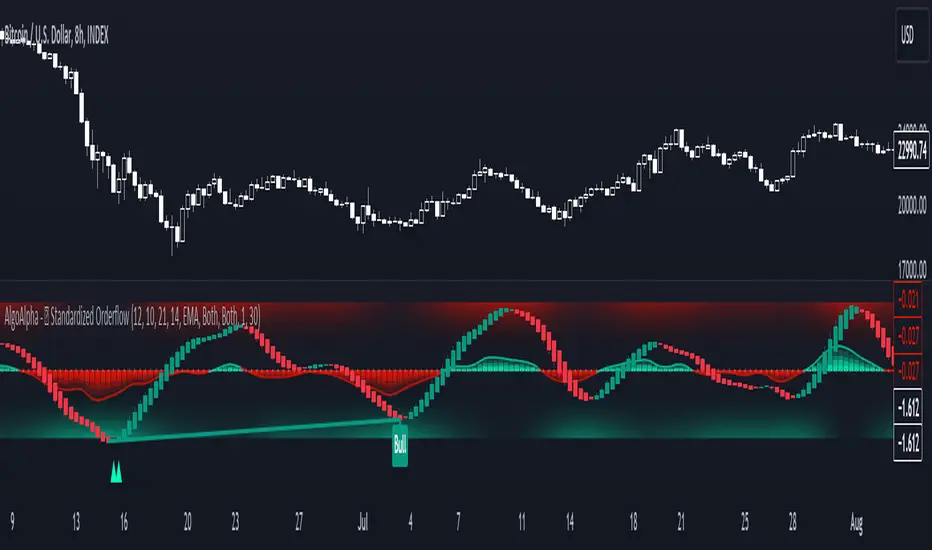
Standardized Orderflow [AlgoAlpha]Introducing the Standardized Orderflow indicator by AlgoAlpha. This innovative tool is designed to enhance your trading strategy by providing a detailed analysis of order flow and velocity. Perfect for traders who seek a deeper insight into market dynamics, it's packed with features that cater to various trading styles. 🚀📊
Key Features:
📈 Order Flow Analysis: At its core, the indicator analyzes order flow, distinguishing between bullish and bearish volume within a specified period. It uses a unique standard deviation calculation for normalization, offering a clear view of market sentiment.
🔄 Smoothing Options: Users can opt for a smoothed representation of order flow, using a Hull Moving Average (HMA) for a more refined analysis.
🌪️ Velocity Tracking: The indicator tracks the velocity of order flow changes, providing insights into the market's momentum.
🎨 Customizable Display: Tailor the display mode to focus on either order flow, order velocity, or both, depending on your analysis needs.
🔔 Alerts for Critical Events: Set up alerts for crucial market events like crossover/crossunder of the zero line and overbought/oversold conditions.
How to Use:
1. Setup: Easily configure the indicator to match your trading strategy with customizable input parameters such as order flow period, smoothing length, and moving average types.
2. Interpretation: Watch for bullish and bearish columns in the order flow chart, utilize the Heiken Ashi RSI candle calculation, and look our for reversal notations for additional market insights.
3. Alerts: Stay informed with real-time alerts for key market events.
Code Explanation:
- Order Flow Calculation:
The core of the indicator is the calculation of order flow, which is the sum of volumes for bullish or bearish price movements. This is followed by normalization using standard deviation.
orderFlow = math.sum(close > close ? volume : (close < close ? -volume : 0), orderFlowWindow)
orderFlow := useSmoothing ? ta.hma(orderFlow, smoothingLength) : orderFlow
stdDev = ta.stdev(orderFlow, 45) * 1
normalizedOrderFlow = orderFlow/(stdDev + stdDev)
- Velocity Calculation:
The velocity of order flow changes is calculated using moving averages, providing a dynamic view of market momentum.
velocityDiff = ma((normalizedOrderFlow - ma(normalizedOrderFlow, velocitySignalLength, maTypeInput)) * 10, velocityCalcLength, maTypeInput)
- Display Options:
Users can choose their preferred display mode, focusing on either order flow, order velocity, or both.
orderFlowDisplayCond = displayMode != "Order Velocity" ? display.all : display.none
wideDisplayCond = displayMode != "Order Flow" ? display.all : display.none
- Reversal Indicators and Divergences:
The indicator also includes plots for potential bullish and bearish reversals, as well as regular and hidden divergences, adding depth to your market analysis.
bullishReversalCond = reversalType == "Order Flow" ? ta.crossover(normalizedOrderFlow, -1.5) : (reversalType == "Order Velocity" ? ta.crossover(velocityDiff, -4) : (ta.crossover(velocityDiff, -4) or ta.crossover(normalizedOrderFlow, -1.5)) )
bearishReversalCond = reversalType == "Order Flow" ? ta.crossunder(normalizedOrderFlow, 1.5) : (reversalType == "Order Velocity" ? ta.crossunder(velocityDiff, 4) : (ta.crossunder(velocityDiff, 4) or ta.crossunder(normalizedOrderFlow, 1.5)) )
In summary, the Standardized Orderflow indicator by AlgoAlpha is a versatile tool for traders aiming to enhance their market analysis. Whether you're focused on short-term momentum or long-term trends, this indicator provides valuable insights into market dynamics. 🌟📉📈
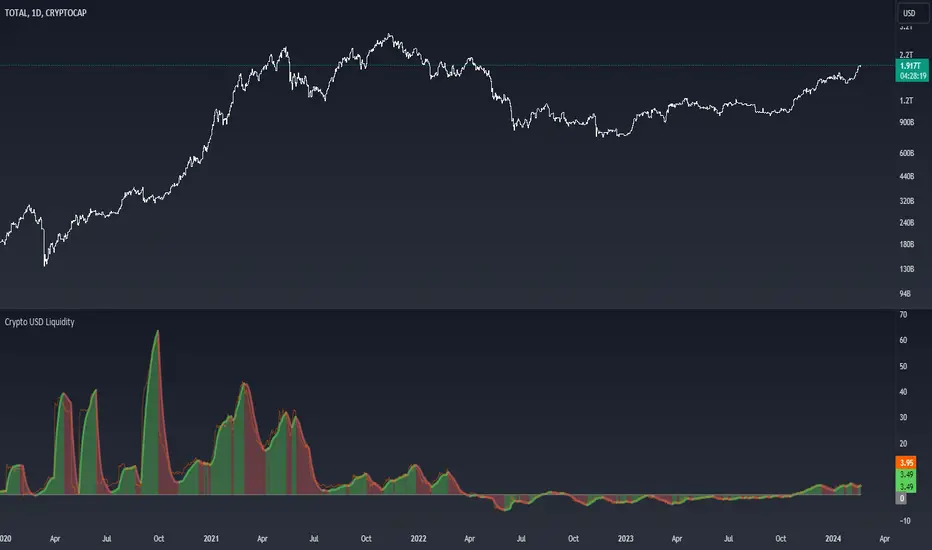
Crypto USD LiquidityThe "Crypto USD Liquidity " indicator is designed to offer a comprehensive analysis of liquidity dynamics within the cryptocurrency market, specifically focusing on various stablecoins. This versatile tool allows users to tailor their analysis by adjusting key parameters such as the Rate of Change (ROC) length and the smoothing rate.
The indicator incorporates a user-friendly interface with options to selectively display the supply data for major stablecoins, including USDT, BUSD, USDC, DAI, and TUSD . Users can toggle these options to observe and compare the liquidity trends of different stablecoin assets.
The total liquidity is computed as the summation of the selected stablecoin supplies, providing a holistic view of the overall crypto market liquidity. The Rate of Change (ROC) and its smoothing are then applied to the aggregated liquidity data. This process helps users identify trends and potential turning points in the liquidity landscape.
The visual representation on the chart includes a color-coded display: positive changing ROC values are shaded in green, indicating potential increases in liquidity, while negative values are shaded in red, suggesting potential decreases. This color scheme enhances the user's ability to quickly interpret the changing dynamics of stablecoin liquidity.
Moreover, the script includes a Zero Line for reference and overlays the raw ROC values for additional insight. The resulting chart not only serves as a powerful analytical tool for traders and investors but also contributes to a deeper understanding of the nuanced movements within the broader cryptocurrency market.
In summary, the "Crypto USD Liquidity" Pine Script indicator empowers users with a customizable and visually informative tool for analyzing and interpreting the complex dynamics of stablecoin liquidity, facilitating more informed decision-making in the realm of cryptocurrency trading and investment.
Volume-Trend Sentiment (VTS) [AlgoAlpha]Introducing the Volume-Trend Sentiment by AlgoAlpha, a unique tool designed for traders who seek a deeper understanding of market sentiment through volume analysis. This innovative indicator offers a comprehensive view of market dynamics, blending volume trends with price action to provide an insightful perspective on market sentiment. 🚀📊
Key Features:
1. 🌟 Dual Trend Analysis: This indicator combines the concepts of price movement and volume, offering a multi-dimensional view of market sentiment. By analyzing the relationship between the closing and opening prices relative to volume, it provides a nuanced understanding of market dynamics.
2. 🎨 Customizable Settings: Flexibility is at the core of this indicator. Users can adjust various parameters such as the length of the volume trend, standard deviation, and SMA length, ensuring a tailored experience to match individual trading strategies.
3. 🌈 Visual Appeal: With options to display noise, the main plot, and background colors, the indicator is not only informative but also visually engaging. Users can choose their preferred colors for up and down movements, making the analysis more intuitive.
4. ⚠️ Alerts for Key Movements: Stay ahead of market changes with built-in alert conditions. These alerts notify traders when the Volume-Trend Sentiment crosses above or below the midline, signaling potential shifts in market momentum.
How It Works:
The core of the indicator is the calculation of the Volume-Trend Sentiment (VTS). It is computed by subtracting a double-smoothed Exponential Moving Average (EMA) of the price-volume ratio from a single EMA of the same ratio. This method highlights the trend in volume relative to price changes.
volumeTrend = ta.ema((close - open) / volume, volumeTrendLength) - ta.ema(ta.ema((close - open) / volume, volumeTrendLength), volumeTrendLength)
To manage volatility and noise in the volume trend, the indicator employs a standard deviation calculation and a Simple Moving Average (SMA). This smoothing process helps in identifying the true underlying trend by filtering out extreme fluctuations.
standardDeviation = ta.stdev(volumeTrend, standardDeviationLength) * 1
smoothedVolumeTrend = ta.sma(volumeTrend / (standardDeviation + standardDeviation), smaLength)
A unique feature is the dynamic background color, which changes based on the sentiment level. This visual cue instantly communicates the market's bullish or bearish sentiment, enhancing the decision-making process.
getColor(volumeTrendValue) =>
sentimentLevel = math.abs(volumeTrendValue * 10)
baseTransparency = 60 // Base transparency level
colorTransparency = math.max(90 - sentimentLevel * 5, baseTransparency)
volumeTrendValue > 0 ? color.new(upColor, colorTransparency) : color.new(downColor, colorTransparency)
bgcolor(showBackgroundColor ? getColor(smoothedVolumeTrend) : na)
In summary, the Volume-Trend Sentiment by AlgoAlpha is a comprehensive tool that enhances market analysis through a unique blend of volume and price trends. Whether you're a seasoned trader or just starting out, this indicator offers valuable insights into market sentiment and helps in making informed trading decisions. 📈📉🔍🌐

Median Proximity Percentile [AlgoAlpha]📊🚀 Introducing the "Median Proximity Percentile" by AlgoAlpha, a dynamic and sophisticated trading indicator designed to enhance your market analysis! This tool efficiently tracks median price proximity over a specified lookback period and finds it's percentile between 2 dynamic standard deviation bands, offering valuable insights for traders looking to make informed decisions.
🌟 Key Features:
Color-Coded Visuals: Easily interpret market trends with color-coded plots indicating bullish or bearish signals.
Flexibility: Customize the indicator with your preferred price source and lookback lengths to suit your trading strategy.
Advanced Alert System: Stay ahead with customizable alerts for key trend shifts and market conditions.
🔍 Deep Dive into the Code:
Choose your preferred price data source and define lookback lengths for median and EMA calculations. priceSource = input.source(close, "Source") and lookbackLength = input.int(21, minval = 1, title = "Lookback Length")
Calculate median value, price deviation, and normalized value to analyze market position relative to the median. medianValue = ta.median(priceSource, lookbackLength)
Determine upper and lower boundaries based on standard deviation and EMA. upperBoundary = ta.ema(positiveValues, lookbackLength) + ta.stdev(positiveValues, lookbackLength) * stdDevMultiplier
lowerBoundary = ta.ema(negativeValues, lookbackLength) - ta.stdev(negativeValues, lookbackLength) * stdDevMultiplier
Compute the percentile value to track market position within these boundaries. percentileValue = 100 * (normalizedValue - lowerBoundary)/(upperBoundary - lowerBoundary) - 50
Enhance your analysis with Hull Moving Average (HMA) for smoother trend identification. emaValue = ta.hma(percentileValue, emaLookbackLength)
Visualize trends with color-coded plots and characters for easy interpretation. plotColor = percentileValue > 0 ? colorUp : percentileValue < 0 ? colorDown : na
Set up advanced alerts to stay informed about significant market movements. // Alerts
alertcondition(ta.crossover(emaValue, 0), "Bullish Trend Shift", "Median Proximity Percentile Crossover Zero Line")
alertcondition(ta.crossunder(emaValue, 0), "Bearish Trend Shift", "Median Proximity Percentile Crossunder Zero Line")
alertcondition(ta.crossunder(emaValue,emaValue ) and emaValue > 90, "Bearish Reversal", "Median Proximity Percentile Bearish Reversal")
alertcondition(ta.crossunder(emaValue ,emaValue) and emaValue < -90, "Bullish Reversal", "Median Proximity Percentile Bullish Reversal")
🚨 Remember, the "Median Proximity Percentile " is a tool to aid your analysis. It’s essential to combine it with other analysis techniques and market understanding for best results. Happy trading! 📈📉

Hedge Coin M - Statistical Support and ResistanceHedge Coin M - Statistical Support and Resistance
Introduction
"Hedge Coin M - Statistical Support and Resistance" is a sophisticated, statistically-driven indicator designed specifically for traders in the COIN-M market on Binance. It offers a nuanced approach to identifying key market levels, focusing on the dynamics of support and resistance through advanced volatility analysis.
Foundation and Credits:
This script is an advanced adaptation of TradingView's standard code for the Bollinger Bands indicator. It extends the foundational concept of Bollinger Bands by integrating additional volatility metrics.
Calculation Method
This indicator employs Volume Weighted Moving Averages (VWMA) to create two distinct sets of Bollinger Bands, named BB-a and BB-b.
BB-a is derived from the VWMA of high prices, targeting potential resistance levels.
BB-b is based on the VWMA of low prices, aimed at identifying critical support levels.
Users can independently adjust the standard deviation (SD) multipliers for the upper and lower bands of both BB-a and BB-b, accommodating different market conditions.
Enhanced Volatility Analysis
The indicator calculates additional standard deviation lines for the upper band of BB-a and the lower band of BB-b. These lines provide deeper insights into market volatility.
Plotted Graphs
The primary plots include the upper and lower bands of BB-a and BB-b, marked in distinct colors for clarity.
Additional SD lines are plotted to indicate potential extended levels of support and resistance, offering traders a broader view of possible market movements.
Purpose and Usage
"Hedge Coin M - Statistical Support and Resistance" is designed to provide traders with a consistent, statistical method for identifying significant price levels.
It aids in scaling entry into positions, helping traders to navigate the COIN-M market with more informed decision-making.
This tool is especially useful for traders who combine long-term holding with swing trading strategies, offering a balanced approach to market engagement.
Integration and Adaptation
Easily integrate this indicator into your TradingView chart for the COIN-M market.
Use the insights provided to complement your overall trading strategy, particularly in identifying and reacting to significant market movements.
Disclaimer
Important Note: This indicator is provided for informational purposes only. It does not constitute financial advice, investment advice, trading advice, or any other sort of advice. Trading decisions should be made based on your own analysis, prudence, and judgment. Please be aware of the risks involved in trading and consult a financial advisor if necessary.

Pivot Percentile Trend - Strategy [presentTrading]
█ Introduction and How it is Different
The "Pivot Percentile Trend - Strategy" from PresentTrading represents a paradigm shift in technical trading strategies. What sets this strategy apart is its innovative use of pivot percentiles, a method that goes beyond traditional indicator-based analyses. Unlike standard strategies that might depend on single-dimensional signals, this approach takes a multi-layered view of market movements, blending percentile calculations with SuperTrend indicators for a more nuanced and dynamic market analysis.
This strategy stands out for its ability to process multiple data points across various timeframes and pivot lengths, thereby capturing a broader and more detailed picture of market trends. It's not just about following the price; it's about understanding its position in the context of recent historical highs and lows, offering a more profound insight into potential market movements.
BTC 6h L/S
Where traditional methods might react to market changes, the Pivot Percentile Trend strategy anticipates them, using a calculated approach to identify trend strengths and weaknesses. This foresight gives traders a significant advantage, allowing for more strategic decision-making and potentially increasing the chances of successful trades.
In essence, this strategy introduces a more comprehensive and proactive approach to trading, harnessing the power of advanced percentile calculations combined with the robustness of SuperTrend indicators. It's a strategy designed for traders who seek a deeper understanding of market dynamics and a more calculated approach to their trading decisions.
Local picture
█ Strategy, How It Works: Detailed Explanation
🔶 Percentile Calculations
- The strategy employs percentile calculations to assess the relative position of current market prices against historical data.
- For a set of lengths (e.g., `length * 1`, `length * 2`, up to `length * 7`), it calculates the 75th percentile for high values (`percentilesHigh`) and the 25th percentile for low values (`percentilesLow`).
- These percentiles provide a sense of where the current price stands compared to recent price ranges.
Length - 10
Length - 15
🔶 SuperTrend Indicator
- The SuperTrend indicator is a key component, providing trend direction signals.
- It uses the `currentTrendValue`, derived from the difference between bull and bear strengths calculated from the percentile data.
* used the Supertrend toolkit by @EliCobra
🔶 Trend Strength Counts
- The strategy calculates counts of bullish and bearish indicators based on comparisons between the current high and low against high and low percentiles.
- `countBull` and `countBear` track the number of times the current high is above the high percentiles and the current low is below the low percentiles, respectively.
- Weak bullish (`weakBullCount`) and bearish (`weakBearCount`) counts are also determined by how often the current lows and highs fall within the percentile range.
*The idea of this strength counts mainly comes from 'Trend Strength Over Time' @federalTacos5392b
🔶 Trend Value Calculation
- The `currentTrendValue` is a crucial metric, computed as `bullStrength - bearStrength`.
- It indicates the market's trend direction, where a positive value suggests a bullish trend and a negative value indicates a bearish trend.
🔶 Trade Entry and Exit Logic
- The entry points for trades are determined by the combination of the trend value and the direction indicated by the SuperTrend indicator.
- For a long entry (`shouldEnterLong`), the `currentTrendValue` must be positive and the SuperTrend indicator should show a downtrend.
- Conversely, for a short entry (`shouldEnterShort`), the `currentTrendValue` should be negative with the SuperTrend indicating an uptrend.
- The strategy closes positions when these conditions reverse.
█ Trade Direction
The strategy is versatile, allowing traders to choose their preferred trading direction: long, short, or both. This flexibility enables traders to tailor their strategies to their market outlook and risk appetite.
█ Default Settings and Customization
1. Trade Direction: Selectable as Long, Short, or Both, affecting the type of trades executed.
2. Indicator Source: Pivot Percentile Calculations, key for identifying market trends and reversals.
3. Lengths for Percentile Calculation: Various configurable lengths, influencing the scope of trend analysis.
4. SuperTrend Settings: ATR Length 20, Multiplier 18, affecting indicator sensitivity and trend detection.
5. Style Options: Custom colors for bullish (green) and bearish (red) trends, aiding visual interpretation.
6. Additional Settings: Includes contrarian signals and UI enhancements, offering strategic and visual flexibility.

VWAP RangeThe VWAP Range indicator is a highly versatile and innovative tool designed with trading signals for trading the supply and demand within consolidation ranges.
What's a VWAP?
A VWAP (Volume Weighted Average Price) represents an equilibrium point in the market, balancing supply and demand over a specified period. Unlike simple moving averages, VWAP gives more weight to periods with higher volume. This is crucial because large volumes indicate significant trading activity, often by institutional traders, whose actions can reflect deeper market insights or create substantial market movements. The VWAP is also often used as a benchmark to evaluate the efficiency of executed trades. If a trader buys below the VWAP and sells above it, they are generally considered to have transacted favourably.
This is how it works:
Multiple VWAP Anchors:
This indicator uses multiple VWAPs anchored to different optional time periods, such as Daily, Weekly, Monthly, as well as to the highest high a lowest low within those periods. This multiplicity allows for a comprehensive view of the market’s average price based on volume and price, tailored to different trading styles and strategies.
Dynamic and Fixed Periods:
Traders can choose between using dynamic ranges, which reset at the start of each selected period, and specifying a date and time for a particular fixed range to trade. This flexibility is crucial for analyzing price movements within specific ranges or market phases.
Fixed ranges allow VWAPs to be calculated and anchored to a significant market event, the beginning of a consolidation phase or after a major news announcement.
Signal Generation:
The indicator generates buy and sell signals based on the relationship of the price to the VWAPs. It also allows for setting a maximum number of signals in one direction to avoid overtrading or pyramiding. Be sure to wait for the candle close before trading on the signals.
Average Buy/Sell Signal Lines:
Lines can be plotted to display the average buy and sell signal prices. The difference between the lines shows the average profit per trade when trading on the signals in that range. It's a good way to see how profitable a range is on average without backtesting the signals. The lines will also often turn into support and resistance areas, similar to value areas in a volume profile.
Customizable Settings:
Traders have control over various settings, such as the VWAP calculation method and bar color. There are also tooltips for every function.
Hidden Feature:
There's a subtle feature in this indicator: if you have 'Indicator values' turned on in TradingView, you'll see a Sell/Buy Ratio displayed only in the status line. This ratio indicates whether there are more sell signals than buy signals in a range, regardless of the Max Signals setting. A red value above 1 suggests that the market is trending upward, indicating you might want to hold your long positions a bit longer. Conversely, a green value below 1 implies a downward trend.

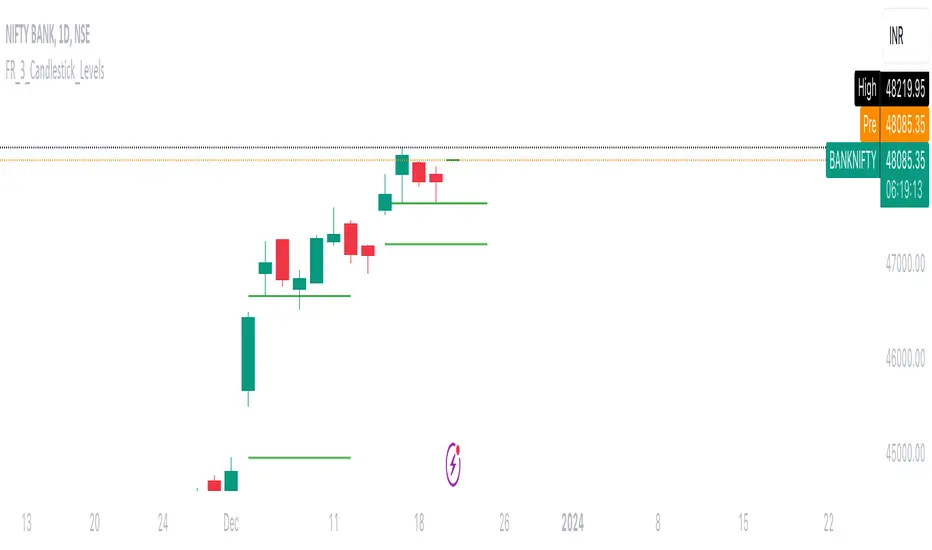
FalconRed 3 Candlestick LevelsThis Pine Script indicator is designed to enhance price action analysis by identifying specific candle patterns that signal potential buying and selling levels. The analysis is based on the characteristics of the current candle and its two immediate predecessors.
For identifying buying levels, the script examines the wicks of the candles, highlighting areas where buying and selling struggle is evident. The indicator recognizes significant breaks above wick levels, especially when followed by a subsequent candle with a lower wick. This combination suggests that previous selling pressure has been challenged and overcome.
Buy breakout and retest levels are highlighted with green color, providing a clear visual indication of potential buying opportunities. The indicator draws horizontal lines that extend to the right, offering insights into the frequency of retests and the recurrence of similar patterns in specific price zones, thereby confirming and reinforcing the observed price action.
Similarly, the indicator scrutinizes the selling side, pinpointing breakdown and retest levels. These areas are highlighted with red color, aiding in the identification of potential selling opportunities.
This indicator serves as a valuable tool for analyzing price action levels and visualizing buying and selling areas. It can be effectively combined with other technical indicators to enhance confidence in trading decisions. Gain deeper insights into market dynamics and improve decision-making by integrating this candle pattern analysis indicator into your trading strategy.
[blackcat] L1 Triple EMA ChannelHey, friends! blackcat is here to bring you an interesting and professional article today, talking about the "Triple Exponential Moving Average (TEMA) Channel" - a powerful tool as a trend indicator in volatile markets.
First of all, let's delve into the origins of the TEMA indicator. It was invented by Patrick Mulloy in the mid-90s with the aim to address the lagging issue encountered when using oscillators or Exponential Moving Averages (EMA). The TEMA indicator smooths out short-term fluctuations by utilizing multiple moving averages. What sets it apart is its unique approach of continuously using the EMA's EMA and adjusting for lag in its formula.
In this article, we will primarily focus on the functionality of the TEMA channel as a trend indicator. However, it's worth noting that its effectiveness is diminished in choppy or sideways markets. Instead, the TEMA indicator shines brightest in long-term trend trading. By utilizing TEMA, analysts can easily filter out and disregard periods of volatility, allowing them to focus on the overall trend.
To gain a comprehensive understanding of market trends, it is often recommended to combine TEMA with other oscillators or technical indicators. This combination can help traders and analysts interpret sharp price movements and assess the level of volatility. For example, some analysts suggest combining the Moving Average Convergence Divergence (MACD) with the TEMA channel to evaluate market trends more accurately.
Now, let's explore how the TEMA channel can be used as a tool to showcase interesting features of price support and resistance. In this script, the TEMA channel is represented by three bands: the upper band, the middle band, and the lower band. The upper band is depicted in white, the middle band in yellow, and the lower band in magenta.
So, let's dive deep into the world of the TEMA channel and enjoy the benefits it brings to understanding market trends. Join us on this exciting journey!

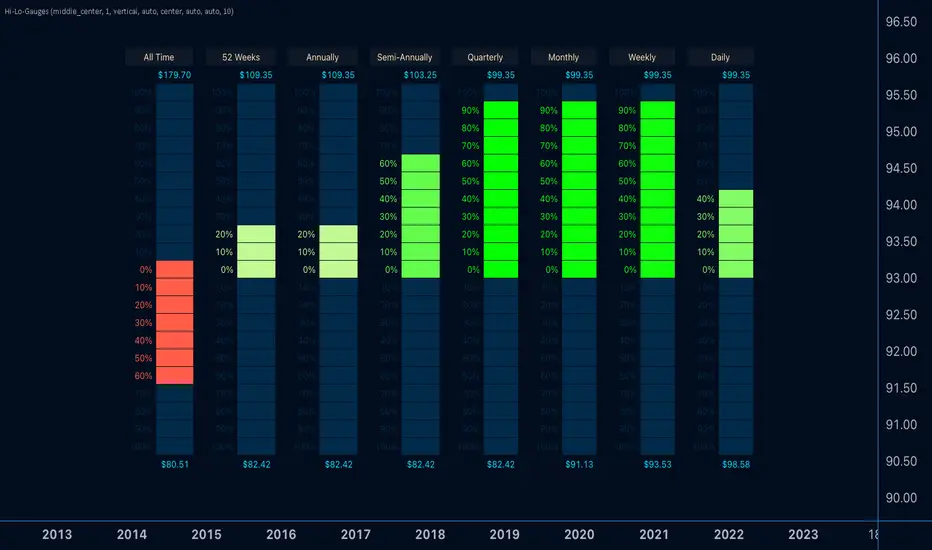
Hi-Lo-GaugesIntroducing the 'Hi-Lo-Gauges' indicator, a powerful tool designed to provide a comprehensive visual representation of key price metrics. This indicator leverages up to 8 preset gauges, each catering to a specific aspect of market data:
All-time high and low
Current 52 Weeks high and low
Current Annual High and Low
Current Semi-Annual High and Low
Current Quarterly High and Low
Current Monthly High and Low
Current Weekly High and Low
Current Daily High and Low
Users have the flexibility to choose all 8 or selectively display specific gauges. For each metric, the gauge dynamically adapts, with the low value set as the minimum and the high value as the maximum. Measurement options include utilizing the highest and lowest closes or the literal highest and lowest prices.
The active price of the underlying asset serves as the reference point, allowing users to gauge the percentage move on the scale between the chosen minimum and maximum. Complete customization is at the users' fingertips, enabling them to tailor the indicator's appearance to suit their preferences.
With 'Hi-Lo-Gauges,' traders and analysts can intuitively monitor and interpret diverse price metrics, fostering a deeper understanding of market dynamics and supporting more informed decision-making.
Note: 'Hi-Lo-Gauges' is visible and applicable exclusively on the daily timeframe due to the nature of the metrics used.
FlexiMA Variance Tracker [presentTrading]🔶 Introduction and How it is Different
The FlexiMA Variance Tracker (FlexiMA-VT) represents a novel approach in technical analysis, distinctively standing out in the realm of financial market indicators. It leverages the concept of a variable Length Moving Average (MA) to create a versatile and dynamic oscillator. Unlike traditional oscillators that rely on a fixed-length MA, the FlexiMA-VT adapts to market conditions by varying the length of the MA, offering a more responsive and nuanced view of market trends. (*The achieved method took reference from SuperTrend Polyfactor Oscillator)
This innovative design allows the FlexiMA-VT to capture a broader spectrum of market movements, making it highly effective in diverse trading environments. Whether in stable or volatile markets, its adaptability ensures consistent relevance, providing traders with deeper insights into potential market swings.
The proposed oscillator accentuates several key aspects through a distinctive mesh of bars, which are derived from the differences between the price and a set of 20 Moving Averages, each altered by varying factors. The intensity of the mesh's colors serves as an indicator, with brighter hues signifying a greater convergence of Moving Average signals.
Starting Length = 5
Starting Length = 40
🔶 Strategy, How it Works: Detailed Explanation
1. Core Concept:
The FlexiMA-VT operates by comparing the price or an average value (indicator source) against a set of moving averages with varying lengths.
These lengths are dynamically adjusted through a starting factor and multiple increment factors, ensuring a comprehensive analysis over different time scales.
2. Normalization and Standard Deviation Calculation:
Once deviations are calculated, they undergo a normalization process, which can be set to 'None', 'Max-Min', or 'Absolute Sum'.
This step is crucial as it standardizes the deviations, allowing for a consistent scale of comparison.
The standard deviation of these normalized deviations is then calculated, offering insights into the market’s volatility and potential trend strength.
🔹Normalization
3. Median Value and Oscillator Creation:
The median of the normalized deviations forms the core of the FlexiMA-VT oscillator.
This median value provides a balanced central point, reflecting the consensus of various MA lengths.
The standard deviation bands plotted around the median enhance the interpretative power of the oscillator, indicating potential overbought or oversold conditions.
4. Multi-Factor Analysis:
The FlexiMA-VT uses multiple increment factors to generate a range of MAs, each factor representing a different scale of trend analysis.
By averaging the results from these different scales, the FlexiMA-VT forms a more comprehensive and reliable oscillator.
🔹Consensus
5. Practical Application:
Traders can use the FlexiMA-VT for various purposes, including identifying trend reversals, gauging market momentum, and determining overbought or oversold conditions.
Its dynamic nature makes it adaptable to different trading strategies, from short-term scalping to long-term position trading.
🔶 Settings
1. Indicator Source (indicatorSource): Determines the base data for calculations, typically a price average (HLC3).
2. Indicator Length (indicatorLength): Sets the base length for Moving Averages, influencing initial calculations.
3. Starting Factor (startingFactor): Initial multiplier for MA length, impacting the starting point of analysis.
4. Increment Factors (incrementFactor_1, incrementFactor_2, incrementFactor_3): Modulate the rate of change in MA lengths, adding variability.
5. Normalization Method (normalizeMethod): Standardizes deviations, with methods like 'Max-Min' and 'Absolute Sum' for comparability.

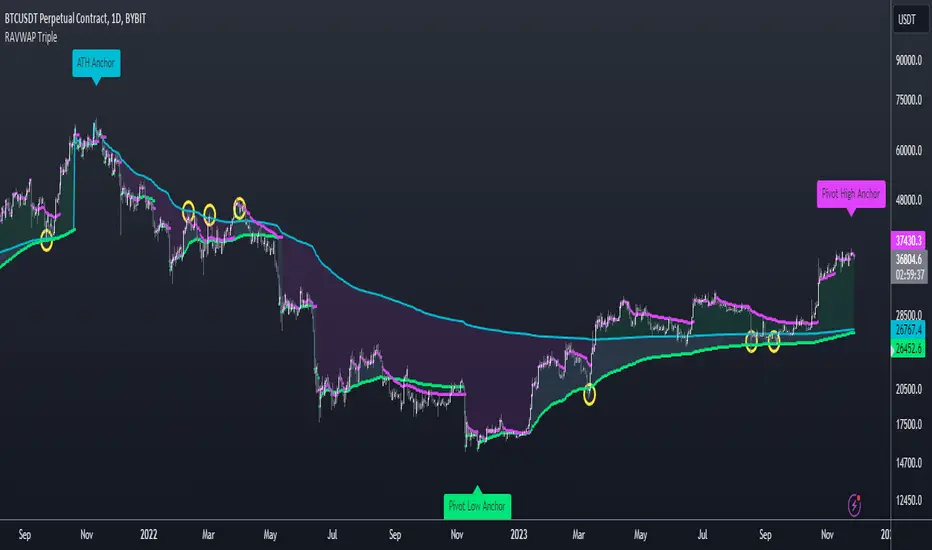
Re-Anchoring VWAP TripleThe Triple Re-Anchoring VWAP (Volume Weighted Average Price) indicator is a tool designed for traders seeking a deeper understanding of market trends and key price levels. This indicator dynamically recalibrates VWAP calculations based on significant market pivot points, offering a unique perspective on potential support and resistance levels.
Key Features:
Dynamic Re-anchoring at All-Time Highs (ATH) : The first layer of this indicator continuously tracks the all-time high and recalibrates the VWAP from each new ATH. This VWAP line, typically acting as a dynamic resistance level, offers insights into the overbought conditions and potential reversal zones.
Adaptive Re-anchoring to Post-ATH Lows : The second component of the indicator shifts focus to the market's reaction post-ATH. It identifies the lowest low following an ATH and re-anchors the VWAP calculation from this point. This VWAP line often serves as a dynamic support level, highlighting key areas where the market finds value after a significant high.
Re-anchoring to Highs After Post-ATH Lows : The third element of this tool takes adaptation one step further by tracking the highest high achieved after the lowest low post-ATH. This VWAP line can act as either support or resistance, providing a nuanced view of the market's valuation in the recovery phase or during consolidation after a significant low.
Applications:
Trend Confirmation and Reversal Signals : By comparing the price action relative to the dynamically anchored VWAP lines, traders can gauge the strength of the trend and anticipate potential reversals.
Entry and Exit Points : By highlighting significant support and resistance areas, it assists in determining optimal entry and exit points, particularly in swing trading and mean reversion strategies.
Enhanced Market Insight : The dynamic nature of the indicator, with its shifting anchor points, offers a refined understanding of market sentiment and valuation changes over time.
Why Triple Re-Anchoring VWAP?
Traditional VWAP tools offer a linear view, often missing out on the intricacies of market fluctuations. The Triple Re-Anchoring VWAP addresses this by providing a multi-faceted view of the market, adapting not just to daily price changes but pivoting around significant market events. Whether you're a day trader, swing trader, or long-term investor, this indicator adds depth to your market analysis, enabling more informed trading decisions.
Examples:
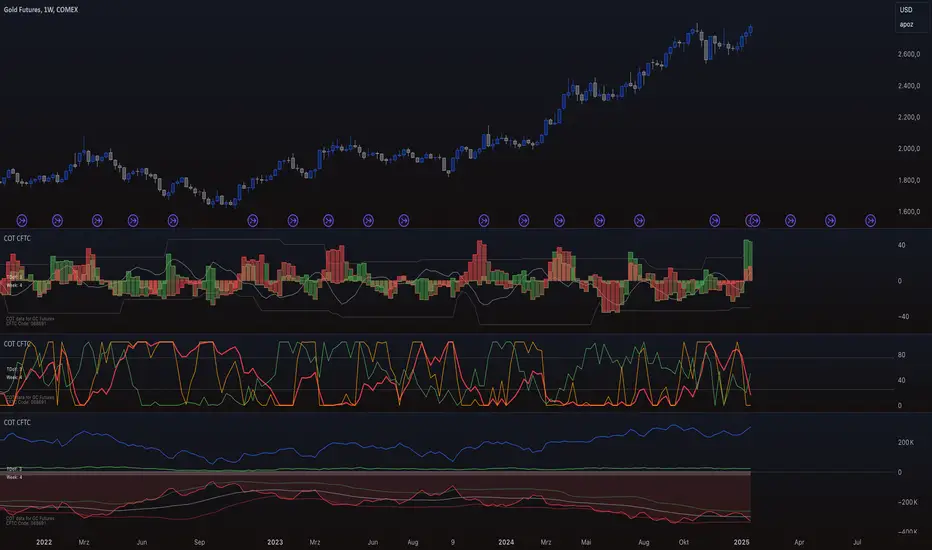
COT CFTC Title: Enhanced COT CFTC Analysis Tool
Description:
Introducing the 'Enhanced COT CFTC Analysis Tool', meticulously designed to dissect the CFTC's Commitments of Traders (COT) data. This sophisticated tool aims to equip traders and investors with profound insights into market dynamics, utilizing the positions of Large Speculators, Commercials, and Non-Reportable Positions for a comprehensive market overview.
Key Features:
Large Speculators Analysis: Visualizes the net positions of large speculators, offering insights into speculative market sentiments.
Commercials Insights: Provides a deep dive into the trading activities of commercials, known for their strategic hedging practices.
Non-Reportable Positions Tracking: Displays the activities of smaller speculators, often considered as contrarian indicators.
Additional Plots:
Options Share: Allows selection between the proportion of options in the market.
Net, Short, and Long Positions: Offers options to view net, short, and long positions.
Percentage of Net Short and Long Positions: Displays the percentage of net short and long positions, either as raw data or as an index over a specified time period.
Extreme Value Indicators: Highlights extreme values in the market data, providing critical insights into market peaks and troughs.
This tool features an intuitive display with color-coded lines and charts, simplifying the complex data analysis process. It also includes an innovative 5% detector, highlighting extreme market positions for enhanced market understanding.
Spread Analysis: This feature provides an insightful visualization of the spread between various COT data points, enabling users to gauge the market’s depth and liquidity effectively.
Usage Tips:
Utilize divergence analysis between different groups to identify potential trend reversals.
Keep a close eye on the 5% detector for early indications of market overextensions.
The 'Enhanced COT CFTC Analysis Tool' is a vital addition to your trading arsenal, designed to enrich your trading strategy with precise and actionable market insights. It’s not just an indicator; it’s a comprehensive market analysis suite.
Disclaimer: This indicator is for educational purposes only. Trading decisions should always be approached with caution and based on thorough personal analysis.
[KVA] Extremes ProfilerExtremes Profiler is a specialized indicator crafted for traders focusing on the relationship between price extremes and moving averages. This tool offers a comprehensive perspective on price dynamics by quantifying and visualizing significant distances of current prices from various moving averages. It effectively highlights the top extremes in market movements, providing key insights into price extremities relative to these averages. The indicator's ability to analyze and display these distances makes it a valuable tool for understanding market trends and potential turning points. Traders can leverage the Extremes Profiler to gain a deeper understanding of how prices behave in relation to commonly watched moving averages, thus aiding in making informed trading decisions
Key Features :
Extensive MA Analysis : Tracks the price distance from multiple moving averages including EMA, SMA, WMA, RMA, and HMA.
Top 50 (100) Distance Metrics : Highlights the 50 (100)greatest (highest or lowest) distances from each selected MA, pinpointing significant market deviations.
Customizable Periods : Offers flexibility with adjustable periods to align with diverse trading strategies.
Comprehensive View : Switch between timeframes for a well-rounded understanding of short-term fluctuations and long-term market trends.
Cross-Asset Comparison : Utilize the indicator to compare different assets, gaining insights into the relative dynamics and volatility of various markets. By analyzing multiple assets, traders can discern broader market trends and better understand asset-specific behaviors.
Customizable Display : Users can adjust the periods and number of results to suit their analytical needs.

Rainbow Fibonacci Momentum - SuperTrend🌈 "Rainbow Fibonacci Momentum - SuperTrend" Indicator 🌈
IMPORTANT: as this is a complex and elaborate TREND ANALYSIS on the graph, ALL INDICATORS REPAINT.
Experience the brilliance of "Rainbow Fibonacci Momentum - SuperTrend" for your technical analysis on TradingView! This versatile indicator allows you to visualize various types of Moving Averages, including Simple Moving Averages (SMA), Exponential Moving Averages (EMA), Weighted Moving Averages (WMA), Hull Moving Averages (HMA), and Volume Weighted Moving Averages (VWMA).
Each MA displayed in a unique color to create a stunning rainbow effect. This makes it easier for you to identify trends and potential trading opportunities.
Key Features:
📊 Multiple Moving Average Types - Choose from a range of moving average types to suit your analysis.
🎨 Stunning Color Gradient - Each moving average type is displayed in a unique color, creating a beautiful rainbow effect.
📉 Overlay Compatible - Use it as an overlay on your price chart for clear trend insights.
With the "Rainbow Fibonacci Momentum - SuperTrend" indicator, you'll add a burst of color to your trading routine and gain a deeper understanding of market trends.
HOW IT WORKS
MA Lines:
MA - 5: purple lines
MA - 8: blue lines
MA - 13: green lines
MA - 21: yellow lines
MA - 34: orange lines
MA - 55: red line
Header Color Indicators:
Purple: MA-5 is in uptrend on the chart
Blue: MA-5 and MA-8 are in the uptrend on the chart
Green: MA-5, MA-8 and MA-13 are in the uptrend on the chart
Yellow: MA-5, MA-8, MA-13 and MA-21 are in the uptrend on the chart
Orange: MA-5, MA-8, MA-13, MA-21 and MA-34 are in the uptrend on the chart
Red: MA-5, MA-8, MA-13, MA-21, MA-34 and MA-55 are in the uptrend on the chart
Red + White Arrow: All MAs are correctly aligned in the uptrend on the chart
Footer Color Indicators:
Purple: MA-5 is in downtrend on the chart
Blue: MA-5 and MA-8 are in the downtrend on the chart
Green: MA-5, MA-8 and MA-13 are in the downtrend on the chart
Yellow: MA-5, MA-8, MA-13 and MA-21 are in the downtrend on the chart
Orange: MA-5, MA-8, MA-13, MA-21 and MA-34 are in the downtrend on the chart
Red: MA-5, MA-8, MA-13, MA-21, MA-34 and MA-55 are in the downtrend on the chart
Red + White Arrow: All MAs are correctly aligned in the downtrend on the chart
Background Colors:
Light Red: All MAs are on the rise!
Red: All MAs are align correctly on the rise!
Light Green: All MAs are in freefall!
Green: All MAs are align correctly in freefall!
Tiny Arrows Indicators/Alerts:
Down Arrow: All MAs are in freefall!
Up Arrow: All MAs are on the rise!
Big Arrows Indicators/Alerts:
Down Arrow: All MAs are align correctly in freefall!
Up Arrow: All MAs are align correctly on the rise!

Zemog Channels[Zemogtrading]Channels Strategy
User Description:
This Channels strategy is a powerful technical analysis tool that empowers traders with a comprehensive view of the market's support and resistance levels. Designed for both beginners and experienced traders, this strategy brings a systematic and adaptable approach to chart analysis.
Default Parameters:
Swing Length (SL): 45
Higher Timeframe: Daily (D)
Multiplier for Level 2: 3.5
Multiplier for Level 3: 12
How It Works:
Swing Analysis: The Swing Length (SL) parameter allows users to fine-tune the sensitivity of the strategy. A higher SL value provides a more smoothed-out analysis, ideal for a broader market perspective, while a lower value enhances responsiveness to short-term price movements.
Higher Timeframe Insights: The Channels fetches high and low prices from a user-specified higher timeframe (default: Daily). This ensures that the strategy is well-informed by significant price levels from a broader market context.
Dynamic ATR Calculation: The Average True Range (ATR) adapts dynamically to changing market conditions. This ensures that support and resistance levels adjust in real-time based on the prevailing volatility, providing traders with adaptive insights.
Smoothed Support and Resistance: Utilizing a Smoothed Moving Average (SMA), the strategy calculates support and resistance levels based on high and low prices from the higher timeframe. This smoothing effect enhances clarity in identifying key levels, facilitating more informed trading decisions.
Additional Levels: The Channels introduces Level 2 and Level 3 support and resistance zones. Users can customize multipliers for these levels, allowing for the identification of secondary zones for potential market reversals.
Visualization: The strategy vividly plots support and resistance levels on the chart. Green lines indicate support, red lines denote resistance, and yellow lines represent additional support at Level 3.
Using Channels is a versatile tool that equips traders with a deeper understanding of crucial market levels. By seamlessly integrating swing analysis, higher timeframe data, and adaptive calculations, this strategy offers a holistic and user-friendly approach to technical analysis.

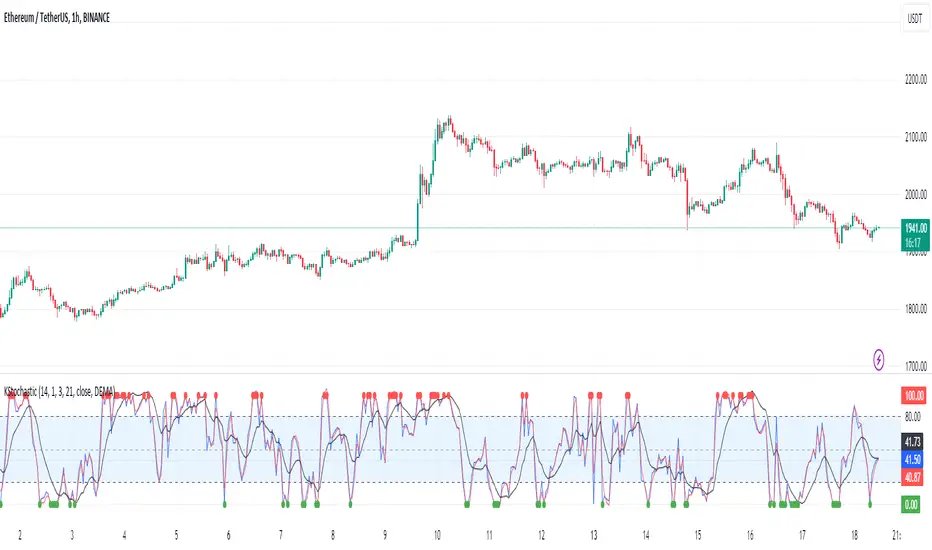
[KVA]K Stochastic IndicatorOriginal Stochastic Oscillator Formula:
%K=(C−Lowest Low)/(Highest High−Lowest Low)×100
Lowest Low refers to the lowest low of the past n periods.
Highest High refers to the highest high of the past n periods.
K Stochastic Indicator Formula:
%K=(Source−Lowest Source)/(Highest Source−Lowest Source)×100
Lowest Source refers to the lowest value of the chosen source over the past length periods.
Highest Source refers to the highest value of the chosen source over the past length periods.
Key Difference :
The original formula calculates %K using the absolute highest high and lowest low of the price over the past n periods.
The K Stochastic formula calculates %K using the highest and lowest values of a chosen source (which could be the close, open, high, or low) over the specified length periods.
So, if _src is set to something other than the high for the Highest Source or something other than the low for the Lowest Source, the K Stochastic will yield different results compared to the original formula which strictly uses the highest high and the lowest low of the price.
Impact on Traders :
Flexibility in Price Source :
By allowing the source (_src) to be customizable, traders can apply the Stochastic calculation to different price points (e.g., open, high, low, close, or even an average of these). This could provide a different perspective on market momentum and potentially offer signals that are more aligned with a trader's specific strategy.
Sensitivity to Price Action :
Changing the source from high/low to potentially less extreme values (like close or open) could result in a less volatile oscillator, smoothing out some of the extreme peaks and troughs and possibly offering a more filtered view of market conditions.
Customization of Periods :
The ability to adjust the length period offers traders the opportunity to fine-tune the sensitivity of the indicator to match their trading horizon. Shorter periods may provide earlier signals, while longer periods could filter out market noise.
Possibility of Applying the Indicator on Other Indicators :
Layered Technical Analysis :
The K Stochastic can be applied to other indicators, not just price. For example, it could be applied to a moving average to analyze its momentum or to indicators like RSI or MACD, offering a meta-analysis that studies the oscillator's behavior of other technical tools.
Creation of Composite Indicator s:
By applying the K Stochastic logic to other indicators, traders could create composite indicators that blend the characteristics of multiple indicators, potentially leading to unique signals that could offer an edge in certain market conditions.
Enhanced Signal Interpretation :
When applied to other indicators, the K Stochastic can help in identifying overbought or oversold conditions within those indicators, offering a different dimension to the interpretation of their output.
Overall Implications :
The KStochastic Indicator's modifications could lead to a more tailored application, giving traders the ability to adapt the tool to their specific trading style and analysis preferences.
By being applicable to other indicators, it broadens the scope of stochastic analysis beyond price action, potentially offering innovative ways to interpret data and make trading decisions.
The changes might also influence the trading signals, either by smoothing the oscillator's output to reduce noise or by altering the sensitivity to generate more or fewer signal
Including the additional %F line, which is unique to the K Stochastic Indicator, further expands the potential impacts and applications for traders:
Impact on Traders with the %F Line:
Triple Smoothing :
The %F line introduces a third level of smoothing, which could help in identifying longer-term trends and filtering out short-term fluctuations. This could be particularly useful for traders looking to avoid whipsaws and focus on more sustained movements.
Potential for Enhanced Confirmation :
The %F line might be used as a confirmation signal. For instance, if all three lines (%K, %D, and %F) are in agreement, a trader might consider this as a stronger signal to buy or sell, as opposed to when only the traditional two lines (%K and %D) are used.
Risk Management:
The additional line could be utilized for more sophisticated risk management strategies, where a trader might decide to scale in or out of positions based on the convergence or divergence of these lines.
Possibility of Applying the Indicator on Other Indicators with the %F Line:
Depth of Analysis :
When applied to other indicators, the %F line can provide an even deeper layer of analysis, perhaps identifying macro trends within the indicator it is applied to, which could go unnoticed with just the traditional two-line approach.
Refined Signal Strength Assessment :
The strength of signals from other indicators could be assessed by the position and direction of the %F line, providing an additional filter to evaluate the robustness of buy or sell signals.
Overall Implications with the %F Line :
The inclusion of the %F line in the K Stochastic Indicator enhances its utility as a tool for trend analysis and signal confirmation. It allows traders to potentially identify and act on more reliable trading opportunities.
This feature can enrich the trader's toolkit by providing a nuanced view of momentum and trend strength, which can be particularly valuable in volatile or choppy markets.
For those applying the K Stochastic to other indicators, the %F line could be integral in creating a multi-tiered analysis strategy, potentially leading to more sophisticated interpretations and decisions.
The presence of the %F line adds a dimension of depth to the analysis possible with the K Stochastic Indicator, making it a versatile tool that could be tailored to a variety of trading styles and objectives. However, as with any indicator, the additional complexity requires careful study and back-testing to ensure its signals are understood and actionable within the context of a comprehensive trading plan.
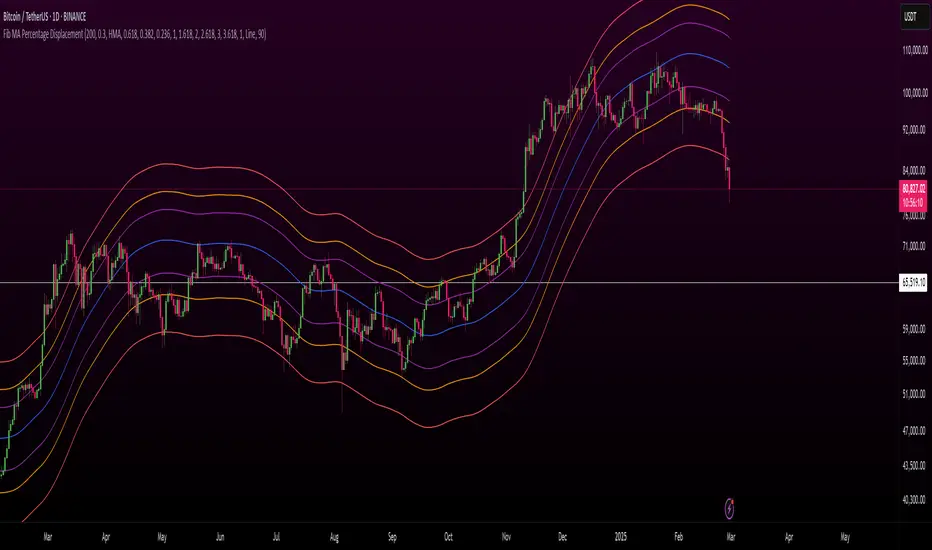
Fibonacci Displaced Moving Averages with Percentage DisplacementThis indicator combines Fibonacci levels with percentage-based displacement, creating a versatile tool for analyzing moving averages in relation to market trends and potential reversal points. It's designed to adapt to different market conditions and asset types, making it a valuable addition to a trader's toolkit.
Key Features:
Fibonacci-Infused Averages: Leverages Fibonacci ratios (0.618, 0.382, 0.236) to construct displaced moving averages. This method offers a layered perspective of market support and resistance levels.
Adaptive Percentage-Based Displacement: The displacement of the moving average is calculated as a percentage of the average, allowing for flexible and market-responsive band positioning. This feature is particularly crucial for adapting to the unique volatility and price behavior of different trading pairs.
Customizable SMA Core: The core of the indicator is a simple moving average (SMA), which can be tailored in length to suit various trading strategies and timeframes.
Logarithmic Scale Compatibility: Includes an option for logarithmic scaling, making it applicable to a broad range of assets, including those with exponential price trends.
Advanced Alert System: Equipped with a comprehensive alert system, it notifies traders of price crossings over any of the Fibonacci displaced moving averages, aiding timely market responses.
Optimizing for Different Pairs:
To maximize the indicator's effectiveness, it is crucial to fine-tune the Percentage Displacement setting according to the specific volatility and price movement characteristics of each trading pair. This customization ensures that the displaced moving averages accurately reflect the market dynamics of each asset, providing more reliable support and resistance levels for traders.
Ideal Use Cases:
This indicator is ideal for traders who seek a deeper understanding of moving averages, especially in markets where Fibonacci levels play a significant role. It is versatile enough for various trading approaches, including swing and day trading, and adaptable across multiple timeframes.
ADX Speed DerivativeThe ADX Speed Derivative (ADXSD) is a cutting-edge trading indicator meticulously crafted for trend analysis. By harnessing the power of the Average Rate Of Change (AROC) method applied to the first and second derivatives (pictured in white and purple, respectively) of the ADX oscillator, this indicator transcends conventional tools, offering traders unparalleled insights into market dynamics.
Key Features and Analysis Capabilities:
The ADXSD stands out with its ability to detect shifts in market trend directions, precisely quantify the speed and intensity of those transitions, and gauge the weakening or strengthening of prevailing trends. This comprehensive toolkit is designed for traders who demand accuracy and nuance in their technical analysis.
AROC Differentiation:
Unlike traditional ADX-based indicators, the ADXSD incorporates the AROC method, offering a nuanced perspective on trend acceleration or deceleration. The first derivative provides insight into the simplest rate of change, while the second derivative unveils the acceleration or deceleration of the trend, empowering traders with a deeper understanding of market dynamics.
Signal Precision:
This indicator excels at pinpointing potential trend reversals and transitions. Utilizing AROC on the ADX oscillator, it generates precise signals marked on the chart, giving traders timely and actionable information to make informed decisions.
Customization and Adaptability:
The ADXSD offers a range of customization options to cater to diverse trading strategies. Traders can adjust the lookback parameters to align with their risk tolerance and preferences, ensuring a personalized and adaptive approach to technical analysis.
Trend Visualization:
Incorporating a visual approach, this indicator enhances the interpretation of market trends. Traders can quickly identify shifts in trend strength and direction by observing midline crossovers, providing a visual guide for strategic decision-making.
Comprehensive Analysis:
The ADXSD serves as a comprehensive tool for traders seeking in-depth insights into market trends. It complements existing technical indicators, offering a holistic approach to market analysis.
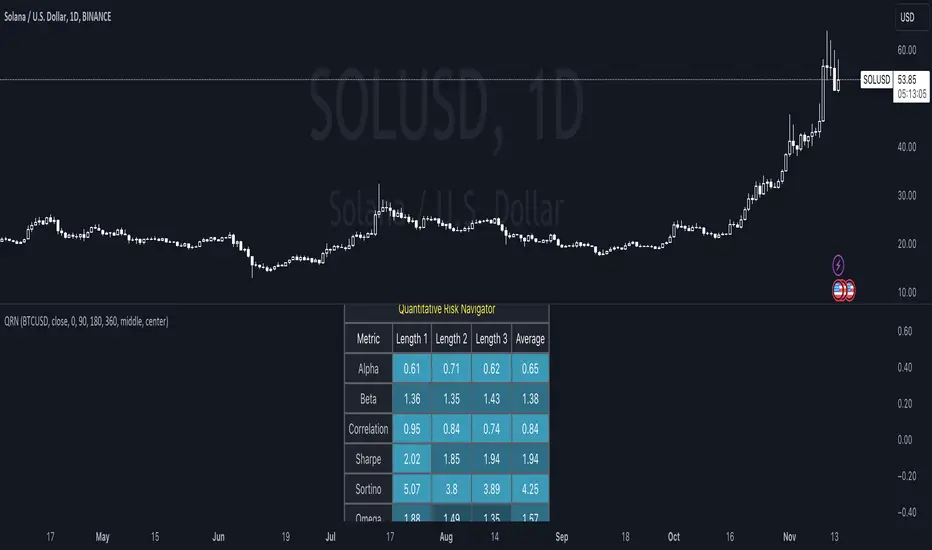
Quantitative Risk Navigator [kikfraben]📊 Quantitative Risk Navigator - Your Financial Performance GPS
Navigate the complexities of financial markets with confidence using the Quantitative Risk Navigator. This indicator provides you with a comprehensive dashboard to assess and understand the risk and performance of your chosen asset.
📈 Key Features:
Alpha and Beta Analysis: Uncover the outperformance (Alpha) and risk exposure (Beta) of your asset compared to a selected benchmark. Know where your investment stands in the market.
Correlation Insights: Understand the relationship between your asset and its benchmark through a clear visualization of correlation trends over different time lengths.
Risk-Return Metrics: Evaluate risk and return simultaneously with Sharpe and Sortino ratios. Make informed decisions by assessing the reward-to-risk ratio of your investment.
Omega Ratio: Gain deeper insights into your asset's performance by analyzing the Omega Ratio, which highlights the distribution of positive and negative returns.
Customizable Visualization: Tailor your chart to focus on specific metrics and time frames. Choose which metrics to display, allowing you to concentrate on the aspects that matter most to you.
Interactive Metrics Table: A user-friendly metrics table provides a quick overview of key values, including average metrics, enabling you to grasp the financial health of your asset at a glance.
Color-Coded Clarity: The indicator employs color-coded visualizations, making it easy to identify bullish and bearish trends, helping you make rapid and informed decisions.
🛠️ How to Use:
Symbol Selection: Choose your base symbol and preferred data source for analysis.
Risk-Free Rate: Input your risk-free rate to fine-tune calculations.
Length Customization: Adjust the lengths for different metrics to align with your analysis preferences.
Whether you're a seasoned trader or just stepping into the financial world, the Quantitative Risk Navigator empowers you to make strategic decisions by providing a comprehensive view of your asset's risk and return profile. Stay in control of your investments with this powerful financial GPS.
🚀 Start Navigating Your Financial Journey Today!
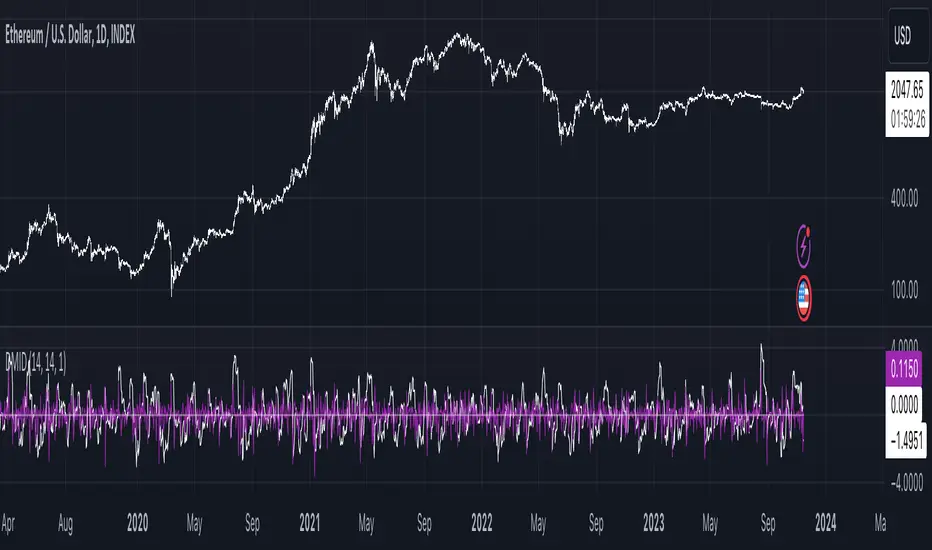
ATRMonitor: Dynamic ATR and RSI-Based HistogramThe ATRMonitor is a cutting-edge technical indicator designed for traders seeking to harness the combined power of Average True Range (ATR) and Relative Strength Index (RSI) in one intuitive histogram. This innovative tool plots a histogram based on the RSI (6 periods), but with a unique twist: the color of each bar is determined by the relationship between the ATR (6 periods) and its Exponential Moving Average (EMA, 6 periods).
Green Bars: Indicate bullish momentum when the ATR is above its EMA, signaling potential strength in price movements.
Red Bars: Suggest bearish sentiment when the ATR falls below its EMA, potentially indicating weaker price movements.
Ideal for both novice and experienced traders, the ATRMonitor offers a straightforward visualization of market volatility and momentum. It's perfect for various trading styles, including scalping, day trading, and swing trading across diverse markets. Enhance your trading decisions with the ATRMonitor, your go-to tool for a deeper understanding of market dynamics.

Standardized SuperTrend Oscillator
The Standardized SuperTrend Oscillator (SSO) is a versatile tool that transforms the SuperTrend indicator into an oscillator, offering both trend-following and mean reversion capabilities. It provides deeper insights into trends by standardizing the SuperTrend with respect to its upper and lower bounds, allowing traders to identify potential reversals and contrarian signals.
Methodology:
Lets begin with describing the SuperTrend indicator, which is the fundamental tool this script is based on.
SuperTrend:
The SuperTrend is calculated based on the average true range (ATR) and multiplier. It identifies the trend direction by placing a line above or below the price. In an uptrend, the line is below the price; in a downtrend, it's above the price.
pine_st(float src = hl2, float factor = 3., simple int len = 10) =>
float atr = ta.atr(len)
float up = src + factor * atr
up := up < nz(up ) or close > nz(up ) ? up : nz(up )
float lo = src - factor * atr
lo := lo > nz(lo ) or close < nz(lo ) ? lo : nz(lo )
int dir = na
float st = na
if na(atr )
dir := 1
else if st == nz(up )
dir := close > up ? -1 : 1
else
dir := close < lo ? 1 : -1
st := dir == -1 ? lo : up
SSO Oscillator:
The SSO is derived from the SuperTrend and the source price. It calculates the standardized difference between the SuperTrend and the source price. The standardization is achieved by dividing this difference by the distance between the upper and lower bounds of the SuperTrend.
float sso = (src - st) / (up - lo)
Components and Features:
SuperTrend of Oscillator - An additional SuperTrend based on the direction and volatility of the oscillator, behaving as the SuperTrend OF the SuperTrend. This provides further trend analysis of the underlying broad trend regime.
Reversion Tracer - The RSI of the direction of the original SuperTrend, providing a dynamic threshold for premium and discount price areas.
float rvt = ta.rsi(dir, len)
Heikin Ashi Transform - An option to apply the Heikin Ashi transform to the source price of the oscillator, providing a smoother visual representation of trends.
Display Modes - Choose between Line mode for a standard oscillator view or Candle mode, displaying the oscillator as Heikin Ashi candles for more in-depth trend analysis.
Contrarian and Reversion Signals:
Contrarian Signals - Based on the SuperTrend of the oscillator, these signals can act as potential buy or sell indications, highlighting potential trend exhaustion or premature reversals.
Reversion Signals - Generated when the oscillator crosses above or below the Reversion Tracer, signaling potential mean reversion opportunities or trend breakouts.
Utility and Use Cases:
Trend Analysis - Utilize the SSO as a trend-following tool with the added benefits of the oscillator's SuperTrend and Heikin Ashi transform.
Valuation Analysis - Leverage the oscillator's reversion signals for identifying potential mean reversion opportunities in the market.
The Standardized SuperTrend Oscillator enhances the capabilities of the SuperTrend indicator, offering a balanced approach to both trend-following and mean reversion strategies. Its customizable options and contrarian signals make it a valuable instrument for traders seeking comprehensive trend analysis and potential reversal signals.
