The Flash-Strategy with Minervini Stage Analysis QualifierThe Flash-Strategy (Momentum-RSI, EMA-crossover, ATR) with Minervini Stage Analysis Qualifier
Introduction
Welcome to a comprehensive guide on a cutting-edge trading strategy I've developed, designed for the modern trader seeking an edge in today's dynamic markets. This strategy, which I've honed through my years of experience in the trading arena, stands out for its unique blend of technical analysis and market intuition, tailored specifically for use on the TradingView platform.
As a trader with a deep passion for the financial markets, my journey began several years ago, driven by a relentless pursuit of a trading methodology that is both effective and adaptable. My background in trading spans various market conditions and asset classes, providing me with a rich tapestry of experiences from which to draw. This strategy is the culmination of that journey, embodying the lessons learned and insights gained along the way.
The cornerstone of this strategy lies in its ability to generate precise long signals in a Stage 2 uptrend and equally accurate short signals in a Stage 4 downtrend. This approach is rooted in the principles of trend following and momentum trading, harnessing the power of key indicators such as the Momentum-RSI, EMA Crossover, and Average True Range (ATR). What sets this strategy apart is its meticulous design, which allows it to adapt to the ever-changing market conditions, providing traders with a robust tool for navigating both bullish and bearish scenarios.
This strategy was born out of a desire to create a trading system that is not only highly effective in identifying potential trade setups but also straightforward enough to be implemented by traders of varying skill levels. It's a reflection of my belief that successful trading hinges on clarity, precision, and disciplined execution. Whether you are a seasoned trader or just beginning your journey, this guide aims to provide you with a comprehensive understanding of how to harness the full potential of this strategy in your trading endeavors.
In the following sections, we will delve deeper into the mechanics of the strategy, its implementation, and how to make the most out of its features. Join me as we explore the nuances of a strategy that is designed to elevate your trading to the next level.
Stage-Specific Signal Generation
A distinctive feature of this trading strategy is its focus on generating long signals exclusively during Stage 2 uptrends and short signals during Stage 4 downtrends. This approach is based on the widely recognized market cycle theory, which divides the market into four stages: Stage 1 (accumulation), Stage 2 (uptrend), Stage 3 (distribution), and Stage 4 (downtrend). By aligning the signal generation with these specific stages, the strategy aims to capitalize on the most dynamic and clear-cut market movements, thereby enhancing the potential for profitable trades.
1. Long Signals in Stage 2 Uptrends
• Characteristics of Stage 2: Stage 2 is characterized by a strong uptrend, where prices are consistently rising. This stage typically follows a period of accumulation (Stage 1) and is marked by increased investor interest and bullish sentiment in the market.
• Criteria for Long Signal Generation: Long signals are generated during this stage when the technical indicators align with the characteristics of a Stage 2 uptrend.
• Rationale for Stage-Specific Signals: By focusing on Stage 2 for long trades, the strategy seeks to enter positions during the phase of strong upward momentum, thus riding the wave of rising prices and investor optimism. This stage-specific approach minimizes exposure to less predictable market phases, like the consolidation in Stage 1 or the indecision in Stage 3.
2. Short Signals in Stage 4 Downtrends
• Characteristics of Stage 4: Stage 4 is identified by a pronounced downtrend, with declining prices indicating prevailing bearish sentiment. This stage typically follows the distribution phase (Stage 3) and is characterized by increasing selling pressure.
• Criteria for Short Signal Generation: Short signals are generated in this stage when the indicators reflect a strong bearish trend.
• Rationale for Stage-Specific Signals: Targeting Stage 4 for shorting capitalizes on the market's downward momentum. This tactic aligns with the natural market cycle, allowing traders to exploit the downward price movements effectively. By doing so, the strategy avoids the potential pitfalls of shorting during the early or late stages of the market cycle, where trends are less defined and more susceptible to reversals.
In conclusion, the strategy’s emphasis on stage-specific signal generation is a testament to its sophisticated understanding of market dynamics. By tailoring the long and short signals to Stages 2 and 4, respectively, it leverages the most compelling phases of the market cycle, offering traders a clear and structured approach to aligning their trades with dominant market trends.
Strategy Overview
At the heart of this trading strategy is a philosophy centered around capturing market momentum and trend efficiency. The core objective is to identify and capitalize on clear uptrends and downtrends, thereby allowing traders to position themselves in sync with the market's prevailing direction. This approach is grounded in the belief that aligning trades with these dominant market forces can lead to more consistent and profitable outcomes.
The strategy is built on three foundational components, each playing a critical role in the decision-making process:
1. Momentum-RSI (Relative Strength Index): The Momentum-RSI is a pivotal element of this strategy. It's an enhanced version of the traditional RSI, fine-tuned to better capture the strength and velocity of market trends. By measuring the speed and change of price movements, the Momentum-RSI provides invaluable insights into whether a market is potentially overbought or oversold, suggesting possible entry and exit points. This indicator is especially effective in filtering out noise and focusing on substantial market moves.
2. EMA (Exponential Moving Average) Crossover: The EMA Crossover is a crucial component for trend identification. This strategy employs two EMAs with different timeframes to determine the market trend. When the shorter-term EMA crosses above the longer-term EMA, it signals an emerging uptrend, suggesting a potential long entry. Conversely, a crossover below indicates a possible downtrend, hinting at a short entry opportunity. This simple yet powerful tool is key in confirming trend directions and timing market entries.
3. ATR (Average True Range): The ATR is instrumental in assessing market volatility. This indicator helps in understanding the average range of price movements over a given period, thus providing a sense of how much a market might move on a typical day. In this strategy, the ATR is used to adjust stop-loss levels and to gauge the potential risk and reward of trades. It allows for more informed decisions by aligning trade management techniques with the current volatility conditions.
The synergy of these three components – the Momentum-RSI, EMA Crossover, and ATR – creates a robust framework for this trading strategy. By combining momentum analysis, trend identification, and volatility assessment, the strategy offers a comprehensive approach to navigating the markets. Whether it's capturing a strong trend in its early stages or identifying a potential reversal, this strategy aims to provide traders with the tools and insights needed to make well-informed, strategically sound trading decisions.
Detailed Component Analysis
The efficacy of this trading strategy hinges on the synergistic functioning of its three key components: the Momentum-RSI, EMA Crossover, and Average True Range (ATR). Each component brings a unique perspective to the strategy, contributing to a well-rounded approach to market analysis.
1. Momentum-RSI (Relative Strength Index)
• Definition and Function: The Momentum-RSI is a modified version of the classic Relative Strength Index. While the traditional RSI measures the velocity and magnitude of directional price movements, the Momentum-RSI amplifies aspects that reflect trend strength and momentum.
• Significance in Identifying Trend Strength: This indicator excels in identifying the strength behind a market's move. A high Momentum-RSI value typically indicates strong bullish momentum, suggesting the potential continuation of an uptrend. Conversely, a low Momentum-RSI value signals strong bearish momentum, possibly indicative of an ongoing downtrend.
• Application in Strategy: In this strategy, the Momentum-RSI is used to gauge the underlying strength of market trends. It helps in filtering out minor fluctuations and focusing on significant movements, providing a clearer picture of the market's true momentum.
2. EMA (Exponential Moving Average) Crossover
• Definition and Function: The EMA Crossover component utilizes two exponential moving averages of different timeframes. Unlike simple moving averages, EMAs give more weight to recent prices, making them more responsive to new information.
• Contribution to Market Direction: The interaction between the short-term and long-term EMAs is key to determining market direction. A crossover of the shorter EMA above the longer EMA is an indicator of an emerging uptrend, while a crossover below signals a developing downtrend.
• Application in Strategy: The EMA Crossover serves as a trend confirmation tool. It provides a clear, visual representation of the market's direction, aiding in the decision-making process for entering long or short positions. This component ensures that trades are aligned with the prevailing market trend, a crucial factor for the success of the strategy.
3. ATR (Average True Range)
• Definition and Function: The ATR is an indicator that measures market volatility by calculating the average range between the high and low prices over a specified period.
• Role in Assessing Market Volatility: The ATR provides insights into the typical market movement within a given timeframe, offering a measure of the market's volatility. Higher ATR values indicate increased volatility, while lower values suggest a calmer market environment.
• Application in Strategy: Within this strategy, the ATR is instrumental in tailoring risk management techniques, particularly in setting stop-loss levels. By accounting for the market's volatility, the ATR ensures that stop-loss orders are placed at levels that are neither too tight (risking premature exits) nor too loose (exposing to excessive risk).
In summary, the combination of Momentum-RSI, EMA Crossover, and ATR in this trading strategy provides a comprehensive toolkit for market analysis. The Momentum-RSI identifies the strength of market trends, the EMA Crossover confirms the market direction, and the ATR guides in risk management by assessing volatility. Together, these components form the backbone of a strategy designed to navigate the complexities of the financial markets effectively.
1. Signal Generation Process
• Combining Indicators: The strategy operates by synthesizing signals from the Momentum-RSI, EMA Crossover, and ATR indicators. Each indicator serves a specific purpose: the Momentum-RSI gauges trend momentum, the EMA Crossover identifies the trend direction, and the ATR assesses the market’s volatility.
• Criteria for Signal Validation: For a signal to be considered valid, it must meet specific criteria set by each of the three indicators. This multi-layered approach ensures that signals are not only based on one aspect of market behavior but are a result of a comprehensive analysis.
2. Conditions for Long Positions
• Uptrend Confirmation: A long position signal is generated when the shorter-term EMA crosses above the longer-term EMA, indicating an uptrend.
• Momentum-RSI Alignment: Alongside the EMA crossover, the Momentum-RSI should indicate strong bullish momentum. This is typically represented by the Momentum-RSI being at a high level, confirming the strength of the uptrend.
• ATR Consideration: The ATR is used to fine-tune the entry point and set an appropriate stop-loss level. In a low volatility scenario, as indicated by the ATR, the stop-loss can be set tighter, closer to the entry point.
3. Conditions for Short Positions
• Downtrend Confirmation: Conversely, a short position signal is indicated when the shorter-term EMA crosses below the longer-term EMA, signaling a downtrend.
• Momentum-RSI Confirmation: The Momentum-RSI should reflect strong bearish momentum, usually seen when the Momentum-RSI is at a low level. This confirms the bearish strength of the market.
• ATR Application: The ATR again plays a role in determining the stop-loss level for the short position. Higher volatility, as indicated by a higher ATR, would warrant a wider stop-loss to accommodate larger market swings.
By adhering to these mechanics, the strategy aims to ensure that each trade is entered with a high probability of success, aligning with the market’s current momentum and trend. The integration of these indicators allows for a holistic market analysis, providing traders with clear and actionable signals for both entering and exiting trades.
Customizable Parameters in the Strategy
Flexibility and adaptability are key features of this trading strategy, achieved through a range of customizable parameters. These parameters allow traders to tailor the strategy to their individual trading style, risk tolerance, and specific market conditions. By adjusting these parameters, users can fine-tune the strategy to optimize its performance and align it with their unique trading objectives. Below are the primary parameters that can be customized within the strategy:
1. Momentum-RSI Settings
• Period: The lookback period for the Momentum-RSI can be adjusted. A shorter period makes the indicator more sensitive to recent price changes, while a longer period smoothens the RSI line, offering a broader view of the momentum.
• Overbought/Oversold Thresholds: Users can set their own overbought and oversold levels, which can help in identifying extreme market conditions more precisely according to their trading approach.
2. EMA Crossover Settings
• Timeframes for EMAs: The strategy uses two EMAs with different timeframes. Traders can modify these timeframes, choosing shorter periods for a more responsive approach or longer periods for a more conservative one.
• Source Data: The choice of price data (close, open, high, low) used in calculating the EMAs can be varied depending on the trader’s preference.
3. ATR Settings
• Lookback Period: Adjusting the lookback period for the ATR impacts how the indicator measures volatility. A longer period may provide a more stable but less responsive measure, while a shorter period offers quicker but potentially more erratic readings.
• Multiplier for Stop-Loss Calculation: This parameter allows traders to set how aggressively or conservatively they want their stop-loss to be in relation to the ATR value.
Here are the standard settings:
Поиск скриптов по запросу "deep股票代码"

Supertrend Advance Pullback StrategyHandbook for the Supertrend Advance Strategy
1. Introduction
Purpose of the Handbook:
The main purpose of this handbook is to serve as a comprehensive guide for traders and investors who are looking to explore and harness the potential of the Supertrend Advance Strategy. In the rapidly changing financial market, having the right tools and strategies at one's disposal is crucial. Whether you're a beginner hoping to dive into the world of trading or a seasoned investor aiming to optimize and diversify your portfolio, this handbook offers the insights and methodologies you need. By the end of this guide, readers should have a clear understanding of how the Supertrend Advance Strategy works, its benefits, potential pitfalls, and practical application in various trading scenarios.
Overview of the Supertrend Advance Pullback Strategy:
At its core, the Supertrend Advance Strategy is an evolution of the popular Supertrend Indicator. Designed to generate buy and sell signals in trending markets, the Supertrend Indicator has been a favorite tool for many traders around the world. The Advance Strategy, however, builds upon this foundation by introducing enhanced mechanisms, filters, and methodologies to increase precision and reduce false signals.
1. Basic Concept:
The Supertrend Advance Strategy relies on a combination of price action and volatility to determine the potential trend direction. By assessing the average true range (ATR) in conjunction with specific price points, this strategy aims to highlight the potential starting and ending points of market trends.
2. Methodology:
Unlike the traditional Supertrend Indicator, which primarily focuses on closing prices and ATR, the Advance Strategy integrates other critical market variables, such as volume, momentum oscillators, and perhaps even fundamental data, to validate its signals. This multidimensional approach ensures that the generated signals are more reliable and are less prone to market noise.
3. Benefits:
One of the main benefits of the Supertrend Advance Strategy is its ability to filter out false breakouts and minor price fluctuations, which can often lead to premature exits or entries in the market. By waiting for a confluence of factors to align, traders using this advanced strategy can increase their chances of entering or exiting trades at optimal points.
4. Practical Applications:
The Supertrend Advance Strategy can be applied across various timeframes, from intraday trading to swing trading and even long-term investment scenarios. Furthermore, its flexible nature allows it to be tailored to different asset classes, be it stocks, commodities, forex, or cryptocurrencies.
In the subsequent sections of this handbook, we will delve deeper into the intricacies of this strategy, offering step-by-step guidelines on its application, case studies, and tips for maximizing its efficacy in the volatile world of trading.
As you journey through this handbook, we encourage you to approach the Supertrend Advance Strategy with an open mind, testing and tweaking it as per your personal trading style and risk appetite. The ultimate goal is not just to provide you with a new tool but to empower you with a holistic strategy that can enhance your trading endeavors.
2. Getting Started
Navigating the financial markets can be a daunting task without the right tools. This section is dedicated to helping you set up the Supertrend Advance Strategy on one of the most popular charting platforms, TradingView. By following the steps below, you'll be able to integrate this strategy into your charts and start leveraging its insights in no time.
Setting up on TradingView:
TradingView is a web-based platform that offers a wide range of charting tools, social networking, and market data. Before you can apply the Supertrend Advance Strategy, you'll first need a TradingView account. If you haven't set one up yet, here's how:
1. Account Creation:
• Visit TradingView's official website.
• Click on the "Join for free" or "Sign up" button.
• Follow the registration process, providing the necessary details and setting up your login credentials.
2. Navigating the Dashboard:
• Once logged in, you'll be taken to your dashboard. Here, you'll see a variety of tools, including watchlists, alerts, and the main charting window.
• To begin charting, type in the name or ticker of the asset you're interested in the search bar at the top.
3. Configuring Chart Settings:
• Before integrating the Supertrend Advance Strategy, familiarize yourself with the chart settings. This can be accessed by clicking the 'gear' icon on the top right of the chart window.
• Adjust the chart type, time intervals, and other display settings to your preference.
Integrating the Strategy into a Chart:
Now that you're set up on TradingView, it's time to integrate the Supertrend Advance Strategy.
1. Accessing the Pine Script Editor:
• Located at the top-center of your screen, you'll find the "Pine Editor" tab. Click on it.
• This is where custom strategies and indicators are scripted or imported.
2. Loading the Supertrend Advance Strategy Script:
• Depending on whether you have the script or need to find it, there are two paths:
• If you have the script: Copy the Supertrend Advance Strategy script, and then paste it into the Pine Editor.
• If searching for the script: Click on the “Indicators” icon (looks like a flame) at the top of your screen, and then type “Supertrend Advance Strategy” in the search bar. If available, it will show up in the list. Simply click to add it to your chart.
3. Applying the Strategy:
• After pasting or selecting the Supertrend Advance Strategy in the Pine Editor, click on the “Add to Chart” button located at the top of the editor. This will overlay the strategy onto your main chart window.
4. Configuring Strategy Settings:
• Once the strategy is on your chart, you'll notice a small settings ('gear') icon next to its name in the top-left of the chart window. Click on this to access settings.
• Here, you can adjust various parameters of the Supertrend Advance Strategy to better fit your trading style or the specific asset you're analyzing.
5. Interpreting Signals:
• With the strategy applied, you'll now see buy/sell signals represented on your chart. Take time to familiarize yourself with how these look and behave over various timeframes and market conditions.
3. Strategy Overview
What is the Supertrend Advance Strategy?
The Supertrend Advance Strategy is a refined version of the classic Supertrend Indicator, which was developed to aid traders in spotting market trends. The strategy utilizes a combination of data points, including average true range (ATR) and price momentum, to generate buy and sell signals.
In essence, the Supertrend Advance Strategy can be visualized as a line that moves with the price. When the price is above the Supertrend line, it indicates an uptrend and suggests a potential buy position. Conversely, when the price is below the Supertrend line, it hints at a downtrend, suggesting a potential selling point.
Strategy Goals and Objectives:
1. Trend Identification: At the core of the Supertrend Advance Strategy is the goal to efficiently and consistently identify prevailing market trends. By recognizing these trends, traders can position themselves to capitalize on price movements in their favor.
2. Reducing Noise: Financial markets are often inundated with 'noise' - short-term price fluctuations that can mislead traders. The Supertrend Advance Strategy aims to filter out this noise, allowing for clearer decision-making.
3. Enhancing Risk Management: With clear buy and sell signals, traders can set more precise stop-loss and take-profit points. This leads to better risk management and potentially improved profitability.
4. Versatility: While primarily used for trend identification, the strategy can be integrated with other technical tools and indicators to create a comprehensive trading system.
Type of Assets/Markets to Apply the Strategy:
1. Equities: The Supertrend Advance Strategy is highly popular among stock traders. Its ability to capture long-term trends makes it particularly useful for those trading individual stocks or equity indices.
2. Forex: Given the 24-hour nature of the Forex market and its propensity for trends, the Supertrend Advance Strategy is a valuable tool for currency traders.
3. Commodities: Whether it's gold, oil, or agricultural products, commodities often move in extended trends. The strategy can help in identifying and capitalizing on these movements.
4. Cryptocurrencies: The volatile nature of cryptocurrencies means they can have pronounced trends. The Supertrend Advance Strategy can aid crypto traders in navigating these often tumultuous waters.
5. Futures & Options: Traders and investors in derivative markets can utilize the strategy to make more informed decisions about contract entries and exits.
It's important to note that while the Supertrend Advance Strategy can be applied across various assets and markets, its effectiveness might vary based on market conditions, timeframe, and the specific characteristics of the asset in question. As always, it's recommended to use the strategy in conjunction with other analytical tools and to backtest its effectiveness in specific scenarios before committing to trades.
4. Input Settings
Understanding and correctly configuring input settings is crucial for optimizing the Supertrend Advance Strategy for any specific market or asset. These settings, when tweaked correctly, can drastically impact the strategy's performance.
Grouping Inputs:
Before diving into individual input settings, it's important to group similar inputs. Grouping can simplify the user interface, making it easier to adjust settings related to a specific function or indicator.
Strategy Choice:
This input allows traders to select from various strategies that incorporate the Supertrend indicator. Options might include "Supertrend with RSI," "Supertrend with MACD," etc. By choosing a strategy, the associated input settings for that strategy become available.
Supertrend Settings:
1. Multiplier: Typically, a default value of 3 is used. This multiplier is used in the ATR calculation. Increasing it makes the Supertrend line further from prices, while decreasing it brings the line closer.
2. Period: The number of bars used in the ATR calculation. A common default is 7.
EMA Settings (Exponential Moving Average):
1. Period: Defines the number of previous bars used to calculate the EMA. Common periods are 9, 21, 50, and 200.
2. Source: Allows traders to choose which price (Open, Close, High, Low) to use in the EMA calculation.
RSI Settings (Relative Strength Index):
1. Length: Determines how many periods are used for RSI calculation. The standard setting is 14.
2. Overbought Level: The threshold at which the asset is considered overbought, typically set at 70.
3. Oversold Level: The threshold at which the asset is considered oversold, often at 30.
MACD Settings (Moving Average Convergence Divergence):
1. Short Period: The shorter EMA, usually set to 12.
2. Long Period: The longer EMA, commonly set to 26.
3. Signal Period: Defines the EMA of the MACD line, typically set at 9.
CCI Settings (Commodity Channel Index):
1. Period: The number of bars used in the CCI calculation, often set to 20.
2. Overbought Level: Typically set at +100, denoting overbought conditions.
3. Oversold Level: Usually set at -100, indicating oversold conditions.
SL/TP Settings (Stop Loss/Take Profit):
1. SL Multiplier: Defines the multiplier for the average true range (ATR) to set the stop loss.
2. TP Multiplier: Defines the multiplier for the average true range (ATR) to set the take profit.
Filtering Conditions:
This section allows traders to set conditions to filter out certain signals. For example, one might only want to take buy signals when the RSI is below 30, ensuring they buy during oversold conditions.
Trade Direction and Backtest Period:
1. Trade Direction: Allows traders to specify whether they want to take long trades, short trades, or both.
2. Backtest Period: Specifies the time range for backtesting the strategy. Traders can choose from options like 'Last 6 months,' 'Last 1 year,' etc.
It's essential to remember that while default settings are provided for many of these tools, optimal settings can vary based on the market, timeframe, and trading style. Always backtest new settings on historical data to gauge their potential efficacy.
5. Understanding Strategy Conditions
Developing an understanding of the conditions set within a trading strategy is essential for traders to maximize its potential. Here, we delve deep into the logic behind these conditions, using the Supertrend Advance Strategy as our focal point.
Basic Logic Behind Conditions:
Every strategy is built around a set of conditions that provide buy or sell signals. The conditions are based on mathematical or statistical methods and are rooted in the study of historical price data. The fundamental idea is to recognize patterns or behaviors that have been profitable in the past and might be profitable in the future.
Buy and Sell Conditions:
1. Buy Conditions: Usually formulated around bullish signals or indicators suggesting upward price momentum.
2. Sell Conditions: Centered on bearish signals or indicators indicating downward price momentum.
Simple Strategy:
The simple strategy could involve using just the Supertrend indicator. Here:
• Buy: When price closes above the Supertrend line.
• Sell: When price closes below the Supertrend line.
Pullback Strategy:
This strategy capitalizes on price retracements:
• Buy: When the price retraces to the Supertrend line after a bullish signal and is supported by another bullish indicator.
• Sell: When the price retraces to the Supertrend line after a bearish signal and is confirmed by another bearish indicator.
Indicators Used:
EMA (Exponential Moving Average):
• Logic: EMA gives more weight to recent prices, making it more responsive to current price movements. A shorter-period EMA crossing above a longer-period EMA can be a bullish sign, while the opposite is bearish.
RSI (Relative Strength Index):
• Logic: RSI measures the magnitude of recent price changes to analyze overbought or oversold conditions. Values above 70 are typically considered overbought, and values below 30 are considered oversold.
MACD (Moving Average Convergence Divergence):
• Logic: MACD assesses the relationship between two EMAs of a security’s price. The MACD line crossing above the signal line can be a bullish signal, while crossing below can be bearish.
CCI (Commodity Channel Index):
• Logic: CCI compares a security's average price change with its average price variation. A CCI value above +100 may mean the price is overbought, while below -100 might signify an oversold condition.
And others...
As the strategy expands or contracts, more indicators might be added or removed. The crucial point is to understand the core logic behind each, ensuring they align with the strategy's objectives.
Logic Behind Each Indicator:
1. EMA: Emphasizes recent price movements; provides dynamic support and resistance levels.
2. RSI: Indicates overbought and oversold conditions based on recent price changes.
3. MACD: Showcases momentum and direction of a trend by comparing two EMAs.
4. CCI: Measures the difference between a security's price change and its average price change.
Understanding strategy conditions is not just about knowing when to buy or sell but also about comprehending the underlying market dynamics that those conditions represent. As you familiarize yourself with each condition and indicator, you'll be better prepared to adapt and evolve with the ever-changing financial markets.
6. Trade Execution and Management
Trade execution and management are crucial aspects of any trading strategy. Efficient execution can significantly impact profitability, while effective management can preserve capital during adverse market conditions. In this section, we'll explore the nuances of position entry, exit strategies, and various Stop Loss (SL) and Take Profit (TP) methodologies within the Supertrend Advance Strategy.
Position Entry:
Effective trade entry revolves around:
1. Timing: Enter at a point where the risk-reward ratio is favorable. This often corresponds to confirmatory signals from multiple indicators.
2. Volume Analysis: Ensure there's adequate volume to support the movement. Volume can validate the strength of a signal.
3. Confirmation: Use multiple indicators or chart patterns to confirm the entry point. For instance, a buy signal from the Supertrend indicator can be confirmed with a bullish MACD crossover.
Position Exit Strategies:
A successful exit strategy will lock in profits and minimize losses. Here are some strategies:
1. Fixed Time Exit: Exiting after a predetermined period.
2. Percentage-based Profit Target: Exiting after a certain percentage gain.
3. Indicator-based Exit: Exiting when an indicator gives an opposing signal.
Percentage-based SL/TP:
• Stop Loss (SL): Set a fixed percentage below the entry price to limit potential losses.
• Example: A 2% SL on an entry at $100 would trigger a sell at $98.
• Take Profit (TP): Set a fixed percentage above the entry price to lock in gains.
• Example: A 5% TP on an entry at $100 would trigger a sell at $105.
Supertrend-based SL/TP:
• Stop Loss (SL): Position the SL at the Supertrend line. If the price breaches this line, it could indicate a trend reversal.
• Take Profit (TP): One could set the TP at a point where the Supertrend line flattens or turns, indicating a possible slowdown in momentum.
Swing high/low-based SL/TP:
• Stop Loss (SL): For a long position, set the SL just below the recent swing low. For a short position, set it just above the recent swing high.
• Take Profit (TP): For a long position, set the TP near a recent swing high or resistance. For a short position, near a swing low or support.
And other methods...
1. Trailing Stop Loss: This dynamic SL adjusts with the price movement, locking in profits as the trade moves in your favor.
2. Multiple Take Profits: Divide the position into segments and set multiple TP levels, securing profits in stages.
3. Opposite Signal Exit: Exit when another reliable indicator gives an opposite signal.
Trade execution and management are as much an art as they are a science. They require a blend of analytical skill, discipline, and intuition. Regularly reviewing and refining your strategies, especially in light of changing market conditions, is crucial to maintaining consistent trading performance.
7. Visual Representations
Visual tools are essential for traders, as they simplify complex data into an easily interpretable format. Properly analyzing and understanding the plots on a chart can provide actionable insights and a more intuitive grasp of market conditions. In this section, we’ll delve into various visual representations used in the Supertrend Advance Strategy and their significance.
Understanding Plots on the Chart:
Charts are the primary visual aids for traders. The arrangement of data points, lines, and colors on them tell a story about the market's past, present, and potential future moves.
1. Data Points: These represent individual price actions over a specific timeframe. For instance, a daily chart will have data points showing the opening, closing, high, and low prices for each day.
2. Colors: Used to indicate the nature of price movement. Commonly, green is used for bullish (upward) moves and red for bearish (downward) moves.
Trend Lines:
Trend lines are straight lines drawn on a chart that connect a series of price points. Their significance:
1. Uptrend Line: Drawn along the lows, representing support. A break below might indicate a trend reversal.
2. Downtrend Line: Drawn along the highs, indicating resistance. A break above might suggest the start of a bullish trend.
Filled Areas:
These represent a range between two values on a chart, usually shaded or colored. For instance:
1. Bollinger Bands: The area between the upper and lower band is filled, giving a visual representation of volatility.
2. Volume Profile: Can show a filled area representing the amount of trading activity at different price levels.
Stop Loss and Take Profit Lines:
These are horizontal lines representing pre-determined exit points for trades.
1. Stop Loss Line: Indicates the level at which a trade will be automatically closed to limit losses. Positioned according to the trader's risk tolerance.
2. Take Profit Line: Denotes the target level to lock in profits. Set according to potential resistance (for long trades) or support (for short trades) or other technical factors.
Trailing Stop Lines:
A trailing stop is a dynamic form of stop loss that moves with the price. On a chart:
1. For Long Trades: Starts below the entry price and moves up with the price but remains static if the price falls, ensuring profits are locked in.
2. For Short Trades: Starts above the entry price and moves down with the price but remains static if the price rises.
Visual representations offer traders a clear, organized view of market dynamics. Familiarity with these tools ensures that traders can quickly and accurately interpret chart data, leading to more informed decision-making. Always ensure that the visual aids used resonate with your trading style and strategy for the best results.
8. Backtesting
Backtesting is a fundamental process in strategy development, enabling traders to evaluate the efficacy of their strategy using historical data. It provides a snapshot of how the strategy would have performed in past market conditions, offering insights into its potential strengths and vulnerabilities. In this section, we'll explore the intricacies of setting up and analyzing backtest results and the caveats one must be aware of.
Setting Up Backtest Period:
1. Duration: Determine the timeframe for the backtest. It should be long enough to capture various market conditions (bullish, bearish, sideways). For instance, if you're testing a daily strategy, consider a period of several years.
2. Data Quality: Ensure the data source is reliable, offering high-resolution and clean data. This is vital to get accurate backtest results.
3. Segmentation: Instead of a continuous period, sometimes it's helpful to backtest over distinct market phases, like a particular bear or bull market, to see how the strategy holds up in different environments.
Analyzing Backtest Results:
1. Performance Metrics: Examine metrics like the total return, annualized return, maximum drawdown, Sharpe ratio, and others to gauge the strategy's efficiency.
2. Win Rate: It's the ratio of winning trades to total trades. A high win rate doesn't always signify a good strategy; it should be evaluated in conjunction with other metrics.
3. Risk/Reward: Understand the average profit versus the average loss per trade. A strategy might have a low win rate but still be profitable if the average gain far exceeds the average loss.
4. Drawdown Analysis: Review the periods of losses the strategy could incur and how long it takes, on average, to recover.
9. Tips and Best Practices
Successful trading requires more than just knowing how a strategy works. It necessitates an understanding of when to apply it, how to adjust it to varying market conditions, and the wisdom to recognize and avoid common pitfalls. This section offers insightful tips and best practices to enhance the application of the Supertrend Advance Strategy.
When to Use the Strategy:
1. Market Conditions: Ideally, employ the Supertrend Advance Strategy during trending market conditions. This strategy thrives when there are clear upward or downward trends. It might be less effective during consolidative or sideways markets.
2. News Events: Be cautious around significant news events, as they can cause extreme volatility. It might be wise to avoid trading immediately before and after high-impact news.
3. Liquidity: Ensure you are trading in assets/markets with sufficient liquidity. High liquidity ensures that the price movements are more reflective of genuine market sentiment and not due to thin volume.
Adjusting Settings for Different Markets/Timeframes:
1. Markets: Each market (stocks, forex, commodities) has its own characteristics. It's essential to adjust the strategy's parameters to align with the market's volatility and liquidity.
2. Timeframes: Shorter timeframes (like 1-minute or 5-minute charts) tend to have more noise. You might need to adjust the settings to filter out false signals. Conversely, for longer timeframes (like daily or weekly charts), you might need to be more responsive to genuine trend changes.
3. Customization: Regularly review and tweak the strategy's settings. Periodic adjustments can ensure the strategy remains optimized for the current market conditions.
10. Frequently Asked Questions (FAQs)
Given the complexities and nuances of the Supertrend Advance Strategy, it's only natural for traders, both new and seasoned, to have questions. This section addresses some of the most commonly asked questions regarding the strategy.
1. What exactly is the Supertrend Advance Strategy?
The Supertrend Advance Strategy is an evolved version of the traditional Supertrend indicator. It's designed to provide clearer buy and sell signals by incorporating additional indicators like EMA, RSI, MACD, CCI, etc. The strategy aims to capitalize on market trends while minimizing false signals.
2. Can I use the Supertrend Advance Strategy for all asset types?
Yes, the strategy can be applied to various asset types like stocks, forex, commodities, and cryptocurrencies. However, it's crucial to adjust the settings accordingly to suit the specific characteristics and volatility of each asset type.
3. Is this strategy suitable for day trading?
Absolutely! The Supertrend Advance Strategy can be adjusted to suit various timeframes, making it versatile for both day trading and long-term trading. Remember to fine-tune the settings to align with the timeframe you're trading on.
4. How do I deal with false signals?
No strategy is immune to false signals. However, by combining the Supertrend with other indicators and adhering to strict risk management protocols, you can minimize the impact of false signals. Always use stop-loss orders and consider filtering trades with additional confirmation signals.
5. Do I need any prior trading experience to use this strategy?
While the Supertrend Advance Strategy is designed to be user-friendly, having a foundational understanding of trading and market analysis can greatly enhance your ability to employ the strategy effectively. If you're a beginner, consider pairing the strategy with further education and practice on demo accounts.
6. How often should I review and adjust the strategy settings?
There's no one-size-fits-all answer. Some traders adjust settings weekly, while others might do it monthly. The key is to remain responsive to changing market conditions. Regular backtesting can give insights into potential required adjustments.
7. Can the Supertrend Advance Strategy be automated?
Yes, many traders use algorithmic trading platforms to automate their strategies, including the Supertrend Advance Strategy. However, always monitor automated systems regularly to ensure they're operating as intended.
8. Are there any markets or conditions where the strategy shouldn't be used?
The strategy might generate more false signals in markets that are consolidative or range-bound. During significant news events or times of unexpected high volatility, it's advisable to tread with caution or stay out of the market.
9. How important is backtesting with this strategy?
Backtesting is crucial as it allows traders to understand how the strategy would have performed in the past, offering insights into potential profitability and areas of improvement. Always backtest any new setting or tweak before applying it to live trades.
10. What if the strategy isn't working for me?
No strategy guarantees consistent profits. If it's not working for you, consider reviewing your settings, seeking expert advice, or complementing the Supertrend Advance Strategy with other analysis methods. Remember, continuous learning and adaptation are the keys to trading success.
Other comments
Value of combining several indicators in this script and how they work together
Diversification of Signals: Just as diversifying an investment portfolio can reduce risk, using multiple indicators can offer varied perspectives on potential price movements. Each indicator can capture a different facet of the market, ensuring that traders are not overly reliant on a single data point.
Confirmation & Reduced False Signals: A common challenge with many indicators is the potential for false signals. By requiring confirmation from multiple indicators before acting, the chances of acting on a false signal can be significantly reduced.
Flexibility Across Market Conditions: Different indicators might perform better under different market conditions. For example, while moving averages might excel in trending markets, oscillators like RSI might be more useful during sideways or range-bound conditions. A mashup strategy can potentially adapt better to varying market scenarios.
Comprehensive Analysis: With multiple indicators, traders can gauge trend strength, momentum, volatility, and potential market reversals all at once, providing a holistic view of the market.
How do the different indicators in the Supertrend Advance Strategy work together?
Supertrend: This is primarily a trend-following indicator. It provides traders with buy and sell signals based on the volatility of the price. When combined with other indicators, it can filter out noise and give more weight to strong, confirmed trends.
EMA (Exponential Moving Average): EMA gives more weight to recent price data. It can be used to identify the direction and strength of a trend. When the price is above the EMA, it's generally considered bullish, and vice versa.
RSI (Relative Strength Index): An oscillator that measures the magnitude of recent price changes to evaluate overbought or oversold conditions. By cross-referencing with other indicators like EMA or MACD, traders can spot potential reversals or confirmations of a trend.
MACD (Moving Average Convergence Divergence): This indicator identifies changes in the strength, direction, momentum, and duration of a trend in a stock's price. When the MACD line crosses above the signal line, it can be a bullish sign, and when it crosses below, it can be bearish. Pairing MACD with Supertrend can provide dual confirmation of a trend.
CCI (Commodity Channel Index): Initially developed for commodities, CCI can indicate overbought or oversold conditions. It can be used in conjunction with other indicators to determine entry and exit points.
In essence, the synergy of these indicators provides a balanced, comprehensive approach to trading. Each indicator offers its unique lens into market conditions, and when they align, it can be a powerful indication of a trading opportunity. This combination not only reduces the potential drawbacks of each individual indicator but leverages their strengths, aiming for more consistent and informed trading decisions.
Backtesting and Default Settings
• This indicator has been optimized to be applied for 1 hour-charts. However, the underlying principles of this strategy are supply and demand in the financial markets and the strategy can be applied to all timeframes. Daytraders can use the 1min- or 5min charts, swing-traders can use the daily charts.
• This strategy has been designed to identify the most promising, highest probability entries and trades for each stock or other financial security.
• The combination of the qualifiers results in a highly selective strategy which only considers the most promising swing-trading entries. As a result, you will normally only find a low number of trades for each stock or other financial security per year in case you apply this strategy for the daily charts. Shorter timeframes will result in a higher number of trades / year.
• Consequently, traders need to apply this strategy for a full watchlist rather than just one financial security.
• Default properties: RSI on (length 14, RSI buy level 50, sell level 50), EMA, RSI, MACD on, type of strategy pullback, SL/TP type: ATR (length 10, factor 3), trade direction both, quantity 5, take profit swing hl 5.1, highest / lowest lookback 2, enable ATR trail (ATR length 10, SL ATR multiplier 1.4, TP multiplier 2.1, lookback = 4, trade direction = both).

New Tradability by hajiIntroduction:
The New Tradability Indicator is a state-of-the-art, meticulously coded tool designed for traders on TradingView. Crafted with precision and an in-depth understanding of market dynamics, this indicator offers a comprehensive insight into market tradability across various time frames. By leveraging the core metrics of Trend Area and Quality, it aims to empower traders with the right information to make informed decisions, mitigate FOMO, and maximize profitability.
Core Features:
Three-tiered Time Frame Analysis:
Macro Time Frame: This captures the overarching market movement by analyzing long-term trends. It gives a bird's-eye view of the market's direction and momentum, ideal for position and swing traders.
Normal Time Frame: This is aligned with the current chart time frame. It offers real-time insights for those who trade more frequently, such as day traders or those who base their decisions on hourly or daily charts.
Micro Time Frame: Tailored for scalpers and short-term traders, this captures the minutiae of market fluctuations by focusing on smaller time frames.
Dual-metric Analysis:
Trend Area: This metric delves deep into the market's current trend strength. Whether bullish or bearish, it provides a quantified representation of the trend's vigor and possible continuation. A higher percentage indicates a more pronounced trend, offering traders clarity on potential breakout or reversal scenarios.
Quality: Designed to combat one of the trader's arch-nemeses, FOMO (Fear of Missing Out), this metric evaluates the aptness of entering a trade. A high-quality score signifies a ripe opportunity, suggesting that it's an optimal time to enter the market. Conversely, a low-quality score can act as a warning sign, indicating that the prime entry point might have passed, thus cautioning traders against making hasty decisions.
Tradability Bar: The culmination of the indicator's insights is reflected in the Tradability Bar. This holistic bar synthesizes data from all metrics and time frames to present traders with a singular, easy-to-read percentage. The higher the percentage, the more favorable the market conditions are deemed for trading.
Usage Guidelines:
For optimal results, traders are advised to:
Use the Tradability Bar as an initial reference point. A high percentage suggests promising trading conditions.
Dive deeper by analyzing individual metrics (Trend Area & Quality) and respective time frames to validate or refine their trading strategies.
Always consider external market news, events, and other technical analysis tools in conjunction with this indicator for a more rounded decision-making process.
Conclusion:
The New Tradability Indicator for TradingView stands as a beacon for traders navigating the tumultuous seas of the financial markets. By distilling complex market dynamics into actionable insights, it seeks to be an indispensable ally in a trader's journey towards consistent profitability. Whether you're a seasoned trader or just starting out, this tool is tailored to provide clarity, confidence, and a competitive edge in the trading arena. Welcome to the future of informed trading.

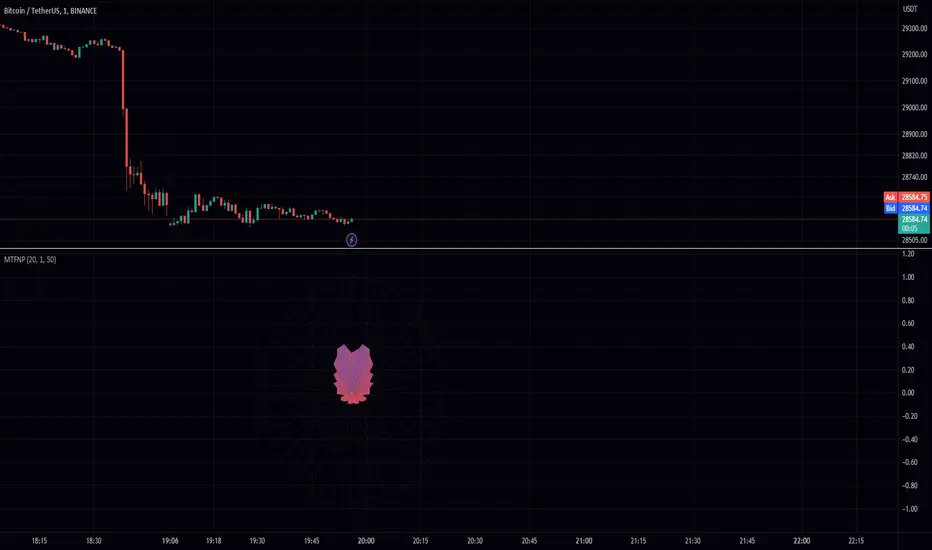
Multi Time Frame Normalized PriceEnhance Your Trading Experience with the Multi Time Frame Normalized Price Indicator
Introduction
As a trader, having a clear and informative chart is crucial for making informed decisions. In this post, we will introduce the Multi Time Frame Normalized Price (MTFNP) Indicator, an innovative trading tool that offers an insightful perspective on price action. The script creates a symmetric chart, with the time axis going from top to bottom, making it easier to identify potential tops and bottoms in various ranges. Let's dive deeper into this powerful tool to understand how it works and how it can improve your trading experience.
The Multi Time Frame Normalized Price Indicator
The MTFNP Indicator is designed to provide a comprehensive view of price action across multiple time frames. By plotting the normalized price levels for each time frame, traders can easily identify areas of support and resistance, as well as potential tops and bottoms in various ranges.
One of the key features of this indicator is the symmetry of the chart. Instead of the traditional horizontal time axis, the MTFNP Indicator plots the time axis vertically from top to bottom. This innovative approach makes it easier for traders to visualize the price action across different time frames, enabling them to make more informed decisions.
Benefits of a Symmetric Chart
There are several advantages to using a symmetric chart with a vertical time axis, such as:
Easier to read: The unique layout of the chart makes it easier to analyze price action across multiple time frames. The clear separation between each time frame helps traders avoid confusion and identify important price levels more effectively.
Identifying tops and bottoms: The symmetric presentation of price action enables traders to quickly spot potential tops and bottoms in various ranges. This can be particularly useful for identifying potential reversal points or areas of support and resistance.
Improved decision-making: By offering a comprehensive view of price action, the MTFNP Indicator helps traders make better-informed decisions. This can lead to improved trading strategies and ultimately, better results.
The MTFNP Indicator Script
The MTFNP Indicator script leverages several custom functions, including the Chebyshev Type I Moving Average, to provide a smooth and responsive signal. Additionally, the indicator uses the Spider Plot function to create a symmetric chart with the time axis going from top to bottom.
To customize the MTFNP Indicator to your preferences, you can adjust the input parameters, such as the standard deviation length, multiplier, axes color, bottom color, and top color. You can also change the scale to fit your desired chart size.
Exploring the Relationship between Min, Max Values and Time Frames
In the Multi Time Frame Normalized Price (MTFNP) script, it is crucial to understand the relationship between the min and max values across different time frames. By analyzing how these values relate to each other, traders can make more informed decisions about market trends and potential reversals. In this section, we will dive deep into the relationship between the current time frame's min and max values and those of the further-out time frames.
Interpreting Min and Max Values Across Time Frames
When analyzing the min and max values of the current time frame in relation to the further-out time frames, it is essential to keep in mind the following points:
All min values: If the current time frame and all further-out time frames have min values, this is a strong indication that the current price level is not just a local minimum. Instead, it is likely a more significant support level. In such cases, there is a higher probability that the price will bounce back upwards, making it a potentially favorable entry point for a long position.
All max values: Conversely, if the current time frame and all further-out time frames have max values, this suggests that the current price level is not just a local maximum. Instead, it is likely a more significant resistance level. In these situations, there is a higher probability that the price will reverse downwards, making it a potentially favorable entry point for a short position.
Neutral values with high current time frame: If the current time frame has a high value while the further-out time frames are more neutral, it could indicate that the trend may continue. This is because the high value in the current time frame may signify momentum in the market, whereas the neutral values in the further-out time frames suggest that the trend has not yet reached an extreme level. In this case, traders might consider following the trend and entering a position in the direction of the current movement.
Neutral values with low current time frame: If the current time frame has a low value while the further-out time frames are more neutral, it could indicate that the trend may reverse. This is because the low value in the current time frame may suggest a potential reversal point, whereas the neutral values in the further-out time frames imply that the trend has not yet reached an extreme level. In this case, traders might consider entering a counter-trend position, anticipating a potential reversal.
Balancing Different Time Frames for Optimal Decision Making
It is essential to remember that relying solely on min and max values across different time frames can lead to potential pitfalls. The market is influenced by a wide array of factors, and no single indicator or data point can provide a complete picture. To make the most informed decisions, traders should consider incorporating additional technical analysis tools and evaluating the overall market context.
Moreover, it is crucial to maintain a balance between the current time frame and the further-out time frames. While the current time frame provides information about the most recent market movements, the further-out time frames offer a broader perspective on the market's historical behavior. By combining insights from both types of time frames, traders can make more comprehensive assessments of potential opportunities and risks.
Conclusion
In conclusion, the Multi Time Frame Normalized Price (MTFNP) script offers traders valuable insights by analyzing the relationship between the current time frame and further-out time frames. By identifying potential trend reversals and continuations, traders can make better-informed decisions about market entry and exit points.
Understanding the relationship between min and max values across different time frames is an essential component of using the MTFNP script effectively. By carefully analyzing these relationships and incorporating additional technical analysis tools, traders can improve their decision-making process and enhance their overall trading strategy.
However, it is important to remember that relying solely on the MTFNP script or any single indicator can lead to potential pitfalls. The market is influenced by a wide array of factors, and no single indicator or data point can provide a complete picture. To make the most informed decisions, traders should consider using a combination of technical analysis tools, evaluating the overall market context, and maintaining a balance between the current time frame and the further-out time frames for a comprehensive understanding of the market's behavior. By doing so, they can increase their chances of success in the ever-changing and complex world of trading.
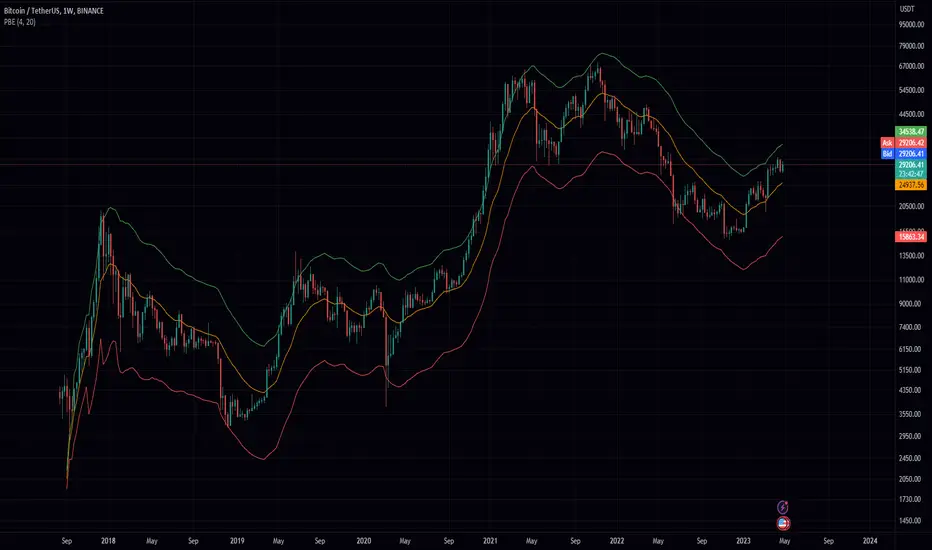
Probability Envelopes (PBE)Introduction
In the world of trading, technical analysis is vital for making informed decisions about the future direction of an asset's price. One such tool is the use of indicators, mathematical calculations that can help traders predict market trends. This article delves into an innovative indicator called the Probability Envelopes Indicator, which offers valuable insights into the potential price levels an asset may reach based on historical data. This in-depth look explores the statistical foundations of the indicator, highlighting its key components and benefits.
Section 1: Calculating Price Movements with Log Returns and Percentages
The Probability Envelopes Indicator provides the option to use either log returns or percentage changes when calculating price movements. Each method has its advantages:
Log Returns: These are calculated as the natural logarithm of the ratio of the current price to the previous price. Log returns are considered more stable and less sensitive to extreme price fluctuations.
Percentage Changes: These are calculated as the percentage difference between the current price and the previous price. They are simpler to interpret and easier to understand for most traders.
Section 2: Understanding Mean, Variance, and Standard Deviation
The Probability Envelopes Indicator utilizes various statistical measures to analyze historical price movements:
Mean: This is the average of a set of numbers. In the context of this indicator, it represents the average price movement for bullish (green) and bearish (red) scenarios.
Variance: This measure represents the dispersion of data points in a dataset. A higher variance indicates a greater spread of data points from the mean. Variance is calculated as the average of the squared differences from the mean.
Standard Deviation: This is the square root of the variance. It is a measure of the amount of variation or dispersion in a dataset. In the context of this indicator, standard deviations are used to calculate the width of the bands around the expected mean.
Section 3: Analyzing Historical Price Movements and Probabilities
The Probability Envelopes Indicator examines historical price movements and calculates probabilities based on their frequency:
The indicator first identifies and categorizes price movements into bullish (green) and bearish (red) scenarios.
It then calculates the probability of each price movement occurring by dividing the frequency of the movement by the total number of occurrences in each category (bullish or bearish).
The expected green and red movements are calculated by multiplying the probabilities by their respective price movements and summing the results.
The total expected movement, or weighted average, is calculated by combining the expected green and red movements and dividing by the total number of occurrences.
Section 4: Constructing the Probability Envelopes
The Probability Envelopes Indicator utilizes the calculated statistics to construct its bands:
The expected mean is calculated using the total expected movement and applied to the current open price.
An exponential moving average (EMA) is used to smooth the expected mean, with the smoothing length determining the degree of responsiveness.
The upper and lower bands are calculated by adding and subtracting the mean green and red movements, respectively, along with their standard deviations multiplied by a user-defined multiplier.
Section 5: Benefits of the Probability Envelopes Indicator
The Probability Envelopes Indicator offers numerous advantages to traders:
Enhanced Decision-Making: By providing probability-based estimations of future price levels, the indicator can help traders make more informed decisions and potentially improve their trading strategies.
Versatility: The indicator is applicable to various financial instruments, such as stocks, forex, commodities, and cryptocurrencies, making it a valuable tool for traders in different markets.
Customization: The indicator's parameters, including the use of log returns, multiplier values, and smoothing length, can be adjusted according to the user's preferences and trading style. This flexibility allows traders to fine-tune the Probability Envelopes Indicator to better suit their needs and goals.
Risk Management: The Probability Envelopes Indicator can be used as a component of a risk management strategy by providing insight into potential price movements. By identifying potential areas of support and resistance, traders can set stop-loss and take-profit levels more effectively.
Visualization: The graphical representation of the indicator, with its clear upper and lower bands, makes it easy for traders to quickly assess the market and potential price levels.
Section 6: Integrating the Probability Envelopes Indicator into Your Trading Strategy
When incorporating the Probability Envelopes Indicator into your trading strategy, consider the following tips:
Confirmation Signals: Use the indicator in conjunction with other technical analysis tools, such as trend lines, moving averages, or oscillators, to confirm the strength and direction of the market trend.
Timeframes: Experiment with different timeframes to find the optimal settings for your trading strategy. Keep in mind that shorter timeframes may generate more frequent signals but may also increase the likelihood of false signals.
Risk Management: Always establish a proper risk management strategy that includes setting stop-loss and take-profit levels, as well as managing your position sizes.
Backtesting: Test the Probability Envelopes Indicator on historical data to evaluate its effectiveness and fine-tune its parameters to optimize your trading strategy.
Section 7: Cons and Limitations of the Probability Envelopes Indicator
While the Probability Envelopes Indicator offers several advantages to traders, it is essential to be aware of its potential cons and limitations. Understanding these can help you make better-informed decisions when incorporating the indicator into your trading strategy.
Lagging Nature: The Probability Envelopes Indicator is primarily based on historical data and price movements. As a result, it may be less responsive to real-time changes in market conditions, and the predicted price levels may not always accurately reflect the market's current state. This lagging nature can lead to late entry and exit signals.
False Signals: As with any technical analysis tool, the Probability Envelopes Indicator can generate false signals. These occur when the indicator suggests a potential price movement, but the market does not follow through. It is crucial to use other technical analysis tools to confirm the signals and minimize the impact of false signals on your trading decisions.
Complex Statistical Concepts: The Probability Envelopes Indicator relies on complex statistical concepts and calculations, which may be challenging to grasp for some traders, particularly beginners. This complexity can lead to misunderstandings and misuse of the indicator if not adequately understood.
Overemphasis on Past Data: While historical data can be informative, relying too heavily on past performance to predict future movements can be limiting. Market conditions can change rapidly, and relying solely on past data may not provide an accurate representation of the current market environment.
No Guarantees: The Probability Envelopes Indicator, like all technical analysis tools, cannot guarantee success. It is essential to approach trading with realistic expectations and understand that no indicator or strategy can provide foolproof results.
To overcome these limitations, it is crucial to combine the Probability Envelopes Indicator with other technical analysis tools and utilize a comprehensive risk management strategy. By doing so, you can better understand the market and increase your chances of success in the ever-changing financial markets.
Section 8: Probability Envelopes Indicator vs. Bollinger Bands
Bollinger Bands and the Probability Envelopes Indicator are both technical analysis tools designed to identify potential support and resistance levels, as well as potential trend reversals. However, they differ in their underlying concepts, calculations, and applications. This section will provide a deep dive into the differences between these two indicators and how they can complement each other in a trading strategy.
Underlying Concepts and Calculations:
Bollinger Bands:
Bollinger Bands are based on a simple moving average (SMA) of the price data, with upper and lower bands plotted at a specified number of standard deviations away from the SMA.
The distance between the bands widens during periods of increased price volatility and narrows during periods of low volatility, indicating potential trend reversals or breakouts.
The standard settings for Bollinger Bands typically involve a 20-period SMA and a 2 standard deviation distance for the upper and lower bands.
Probability Envelopes Indicator:
The Probability Envelopes Indicator calculates the expected price movements based on historical data and probabilities, utilizing mean and standard deviation calculations for both upward and downward price movements.
It generates upper and lower bands based on the calculated expected mean movement and the standard deviation of historical price changes, multiplied by a user-defined multiplier.
The Probability Envelopes Indicator also allows users to choose between using log returns or percentage changes for the calculations, adding flexibility to the indicator.
Key Differences:
Calculation Method: Bollinger Bands are based on a simple moving average and standard deviations, while the Probability Envelopes Indicator uses statistical probability calculations derived from historical price changes.
Flexibility: The Probability Envelopes Indicator allows users to choose between log returns or percentage changes and adjust the multiplier, offering more customization options compared to Bollinger Bands.
Risk Management: Bollinger Bands primarily focus on volatility, while the Probability Envelopes Indicator incorporates probability calculations to provide additional insights into potential price movements, which can be helpful for risk management purposes.
Complementary Use:
Using both Bollinger Bands and the Probability Envelopes Indicator in your trading strategy can offer valuable insights into market conditions and potential price levels.
Bollinger Bands can provide insights into market volatility and potential breakouts or trend reversals based on the widening or narrowing of the bands.
The Probability Envelopes Indicator can offer additional information on the expected price movements based on historical data and probabilities, which can be helpful in anticipating potential support and resistance levels.
Combining these two indicators can help traders to better understand market dynamics and increase their chances of identifying profitable trading opportunities.
In conclusion, while both Bollinger Bands and the Probability Envelopes Indicator aim to identify potential support and resistance levels, they differ significantly in their underlying concepts, calculations, and applications. By understanding these differences and incorporating both tools into your trading strategy, you can gain a more comprehensive understanding of the market and make more informed trading decisions.
In conclusion, the Probability Envelopes Indicator is a powerful and versatile technical analysis tool that offers unique insights into expected price movements based on historical data and probability calculations. It provides traders with the ability to identify potential support and resistance levels, as well as potential trend reversals. When compared to Bollinger Bands, the Probability Envelopes Indicator offers more customization options and incorporates probability-based calculations for a different perspective on market dynamics.
Although the Probability Envelopes Indicator has its limitations and potential cons, such as the reliance on historical data and the assumption that past performance is indicative of future results, it remains a valuable addition to any trader's toolkit. By using the Probability Envelopes Indicator in conjunction with other technical analysis tools, such as Bollinger Bands, traders can gain a more comprehensive understanding of the market and make more informed trading decisions.
Ultimately, the success of any trading strategy relies on the ability to interpret and apply multiple indicators effectively. The Probability Envelopes Indicator serves as a unique and valuable tool in this regard, providing traders with a deeper understanding of the market and its potential price movements. By utilizing this indicator in combination with other tools and techniques, traders can increase their chances of success and optimize their trading strategies.
Levels Of Fear [AstrideUnicorn]"Buy at the level of maximum fear when everyone is selling." - says a well-known among traders wisdom. If an asset's price declines significantly from the most recent highest value or established range, traders start to worry. The higher the drawdown gets, the more fear market participants experience. During a sell-off, a feedback loop arises, in which the escalating fear and price decline strengthen each other.
The Levels Of Fear indicator helps analyze price declines and find the best times to buy an asset after a sell-off. In finance, volatility is a term that describes the degree of variation of an asset price over time. It is usually denoted by the letter σ (sigma) and estimated as the standard deviation of the asset price or price returns. The Levels Of Fear indicator helps measure the current price decline in the standard deviation units. It plots seven levels at distances of 1, 2, 3, 4, 5, 6, and 7 standard deviations (sigmas) below the base price (the recent highest price or upper bound of the established range). In what follows, we will refer to these levels as levels of fear.
HOW TO USE
When the price in its decline reaches a certain level of fear, it means that it has declined from its recent highest value by a corresponding number of standard deviations. The indicator helps traders see the minimum levels to which the price may fall and estimate the potential depth of the current decline based on the cause of the actual market shock. Five-seven sigma declines are relatively rare events and correspond to significant market shocks. In the lack of information, 5-7 sigma levels are good for buying an asset. Because when the price falls that deep, it corresponds to the maximum fear and pessimism in the market when most people are selling. In such situations, contrarian logic becomes the best decision.
SETTINGS
Window: the averaging window or period of the indicator. The algorithm uses this parameter to calculate the base level and standard deviations. Higher values are better for measuring deeper and longer declines.
Levels Stability: the parameter used in the decline detection. The higher the value is, the more stable and long the fear levels are, but at the same time, the lag increases. The lower it is, the faster the indicator responds to the price changes, but the fear levels are recalculated more frequently and are less stable. This parameter is mostly for fine-tuning. It does not change the overall picture much.
Mode: the parameter that defines the style for the labels. In the Cool Guys Mode , the indicator displays the labels as emojis. In the Serious Guys Mode , labels show the distance from the base level measured in standard deviation units or sigmas.

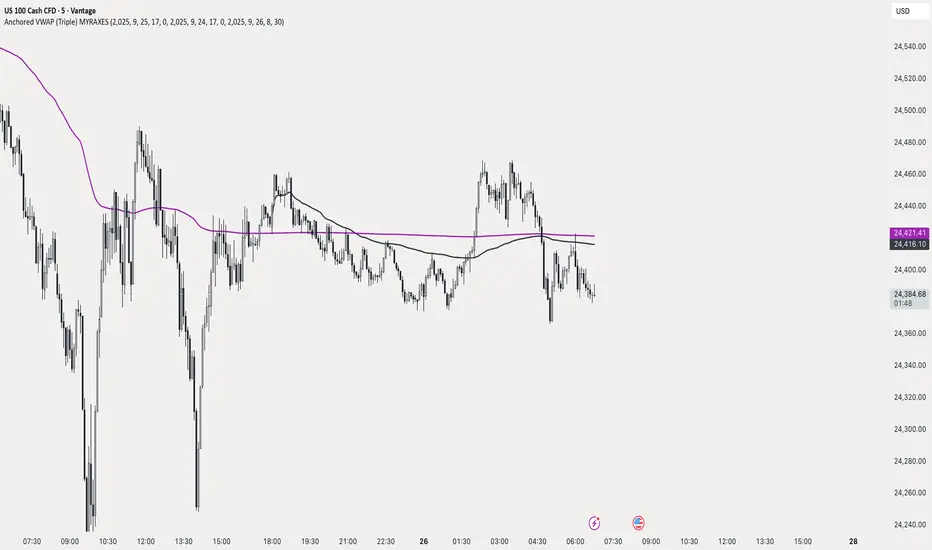
Anchored VWAP (Triple) MYRAXESAnchored VWAP Triple Indicator
The Anchored VWAP Triple indicator is a powerful tool for technical analysis, allowing traders to plot three customizable anchored Volume Weighted Average Price (VWAP) lines on a chart. Unlike traditional VWAP, which resets daily, this indicator lets you anchor each VWAP to a specific date and time, providing a unique perspective on price action relative to key market events.
Features
Three Independent VWAPs: Plot up to three VWAP lines, each anchored to a user-defined date and time.
Customizable Inputs: Set the year, month, day, hour, and minute for each VWAP anchor point. Choose distinct colors for easy identification.
Pure Anchored Design: VWAP lines start only from the anchor point, with no pre-anchor extensions, ensuring a clean and focused analysis.
Debug Mode: Optional display of hour and minute for troubleshooting or educational purposes.
Default Settings: Pre-configured with practical defaults (e.g., September 2025 dates) for immediate use.
How to Use
Add the indicator to your TradingView chart.
Adjust the anchor dates and times for each VWAP (VWAP 1, VWAP 2, VWAP 3) via the input settings.
Select custom colors for each VWAP line to differentiate them on the chart.
Enable Debug Mode if needed to verify time alignment.
Analyze price movements relative to the anchored VWAPs to identify support, resistance, or trend shifts.
Benefits
Ideal for swing traders and long-term analysts who need to anchor VWAP to significant price levels or events.
Enhances decision-making by comparing multiple VWAPs from different anchor points.
Fully compatible with TradingView’s Pine Script v6 for smooth performance.
This indicator is perfect for traders looking to deepen their market analysis with a flexible, multi-VWAP approach. Share your feedback or custom setups in the comments!
RCT RSI Pro FusionDescription for "RCT RSI Pro Fusion"
Description:
The RCT RSI Pro Fusion is an advanced indicator for TradingView, developed by Carlos Mauricio Vizcarra for the Rafael Cepeda Trader community. It combines the power of the standard Relative Strength Index (RSI) with additional elements to provide a more comprehensive market view.
Key Features:
RSI and SMA: Displays the standard RSI line along with its Simple Moving Average (SMA) applied directly to the RSI values, allowing analysis of its trend and momentum.
Clear Overbought/Oversold Zones: Uses dotted horizontal lines at the 20 (oversold) and 80 (overbought) levels, easily visible over any panel background, facilitating the identification of extreme price conditions.
Divergence Detection: Incorporates a system to identify and visualize regular and hidden bullish and bearish divergences between the price and the RSI, providing potential trend reversal signals.
Intuitive Visualization: Divergences are marked with symbols ('R' for regular, 'H' for hidden) and dotted lines connecting them, enhancing visual interpretation.
Alerts: Includes alert conditions for when different types of divergences are detected.
Customizable: Allows adjustment of RSI length, price source, RSI SMA period, and divergence visualization options.
In summary, the RCT RSI Pro Fusion is an all-in-one tool that fuses RSI analysis, its moving average, and divergence detection, all presented with clear and customizable visualization, ideal for traders looking to deepen their technical analysis.

Swing Guardrail — 30-sec Midterm Check (EBITDA Margin & EV/EBITDWhat it does
Before a short-term swing entry, this indicator right-sizes positions by a quick midterm (3–12m) durability screen using two fundamentals:
EBITDA Margin (TTM) → earning power / operational resilience
EV/EBITDA (TTM) → price tag vs earning capacity (payback feel)
A high-contrast table (top-right) shows both metrics and a verdict:
PASS — both meet thresholds → normal size
HALF — only one meets → reduce size
FAIL — neither meets → avoid
Why check “midterm” for a short-term trade?
Short swings still face earnings/news gaps, failed breakouts, and regime shifts. Names with weak margins or stretched valuation tend to break faster and deeper. A 30-sec durability check helps you:
Filter fragile setups (avoid expensive + weakening names)
Stabilize drawdowns (size down when quality/price don’t align)
Keep timing unchanged while improving risk-adjusted returns
Inputs (defaults)
Min EBITDA Margin % (TTM): 8%
Max EV/EBITDA (TTM): 12
Dark chart? High-contrast colors
How to use with a swing system
Get your entry from price/volume (e.g., Ichimoku cloud break, Kijun reclaim, Tenkan>Kijun; or your A/B/C rules).
Run this check only to set size (not timing).
Optional alerts: Once per bar close for PASS / HALF / FAIL.
Size mapping & event guard
PASS → 100% of your planned size
HALF → ~50% size / tighter stops
FAIL → watchlist only
If earnings < ~10 JP business days, drop one tier; ≤3 days → avoid.
Sector guides (tweak as needed)
Software/Internet: Margin ≥ 15%, EV/EBITDA ≤ 18
Industrials/Consumer: Margin ≥ 8%, EV/EBITDA ≤ 12
Retail: Margin ≥ 5–7%, EV/EBITDA ≤ 10–12
Edge cases / substitutions
Banks/Insurers/REITs or net-cash/negative EBITDA: EV/EBITDA may mislead → consider Net Debt/EBITDA or sector metrics (CET1/LTV/DSCR).
Sparse data / fresh listings: numbers may be NA until updates.
Notes & limitations
Data via request.financial() (TTM/most-recent). Some tickers/regions can show NA until fundamentals refresh.
This is a risk-screen / sizing tool, not a buy/sell signal.
Disclaimer
Educational use only. Not investment advice.
日本語
タイトル
スイング用ガードレール―中期“壊れにくさ”30秒チェック(EBITDAマージン & EV/EBITDA, TTM)
概要
短期スイングのエントリー前に、中期(3〜12か月)の耐久性を2指標で素早く確認し、ポジションサイズを決めるためのツールです。
EBITDAマージン(TTM):事業の稼ぐ力・体力
EV/EBITDA(TTM):その体力に対する“値札”(回収年数の感覚)
右上の高コントラスト表に数値と判定を表示:
PASS:両方クリア → 通常サイズ
HALF:片方のみ → サイズ半分
FAIL:両方NG → 見送り
なぜ短期でも“中期”を確認?
短期でも決算・ニュースのギャップ、ブレイク失敗、地合い転換は起きます。マージンが弱い/割高すぎる銘柄は崩れやすく、戻りも鈍い傾向。30秒の耐久性チェックで
脆いセットアップを回避
ドローダウンを平準化(サイズで吸収)
タイミングは変えずに、リスク調整後リターンの改善を狙えます。
入力(既定)
最低EBITDAマージン:8%
最大EV/EBITDA:12
黒背景向け:高コントラスト表示
使い方(スイング手法と併用)
まずは価格シグナル(一目の雲上抜け/基準線回復/転換線>基準線、またはA/B/Cルール)。
本インジの判定でサイズのみ決定(エントリーのタイミングは出しません)。
任意でバー確定アラート(PASS/HALF/FAIL)を設定。
サイズ目安 & イベント抑制
PASS:計画サイズ100%
HALF:約50%(ストップもタイトに)
FAIL:見送り
決算まで≦10営業日なら1段階サイズダウン、≦3営業日は原則見送り。
セクター目安(調整推奨)
ソフト/ネット:マージン 15%以上、EV/EBITDA 18以下
工業/一般消費:マージン 8%以上、EV/EBITDA 12以下
小売:マージン 5〜7%以上、EV/EBITDA 10〜12以下
例外・代替
銀行・保険・REIT/ネットキャッシュ・EBITDAマイナス:EV/EBITDAは適さない場合 → Net Debt/EBITDAやCET1/LTV/DSCR等で補助。
新規上場・データ薄:更新までNAのことあり。
注意
データは request.financial() を使用。更新前はNAの可能性。
本ツールはリスク確認/サイズ調整用で、売買シグナルではありません。
免責
情報提供のみ。投資判断は自己責任で。

Perp Imbalance Zones • Pro (clean)USD Premium (perp vs spot) → (Perp − Spot) / Spot.
Imbalance (z-score of that premium) → how extreme the current premium is relative to its own history over lenPrem bars.
Hysteresis state machine → flips to a SHORT bias when perp-long pressure is extreme; flips to LONG bias when perp-short pressure is extreme. It exits only after the imbalance cools (prevents whipsaw).
Price stretch filter (±σ) → optional Bollinger check so signals only fire when price is already stretched.
HTF confirmation (optional) → require higher-timeframe imbalance to agree with the current-TF bias.
Gradient visuals → line + background tint deepen as |z| grows (more extreme pressure).
What you see on the pane
A single line (z):
Above 0 = perp richer than spot (perp longs pressing).
Below 0 = perp cheaper than spot (perp shorts pressing).
Guides: dotted levels at ±enterZ (entry) and ±exitZ (cool-off/exit).
Background tint:
Red when state = SHORT bias (perp longs heavy).
Blue when state = LONG bias (perp shorts heavy).
Tint intensity scales with |z| (via hotZ).
Labels (optional): prints when bias flips.
Alerts (optional): “Enter SHORT/LONG bias” and “Exit bias”.
How to use it (playbook)
Attach & set symbols
Put the script on your chart.
Set Spot symbol and Perp symbol to the venue you trade (e.g., BINANCE:BTCUSDT + BINANCE:BTCUSDTPERP).
Read the bias
SHORT bias (red background): perp longs over-extended. Look for short entries if price is at resistance, σ-stretched, or your PA system agrees.
LONG bias (blue background): perp shorts over-extended. Look for long entries at support/σ-stretched down.
Entries
Use the bias flip as a context/confirm. Combine with your structure trigger (OB/level sweep, rejection wick, micro-break in market structure, etc.).
If useSigma=true, only trade when price is already ≥ upper band (shorts) or ≤ lower band (longs).
Exits
Bias auto-exits when |z| falls below exitZ.
You can also take profits at your levels or when the line fades back toward 0 while price mean-reverts to the middle band.
Tuning (what each knob does)
enterZ / exitZ (signal strictness + hysteresis)
Higher enterZ → fewer, cleaner signals (e.g., 1.8–2.2).
exitZ should be lower than enterZ (e.g., 0.6–1.0) to prevent flicker.
lenPrem (context window for z)
Larger (50–100) = steadier baseline, fewer signals.
Smaller (20–30) = more reactive, more signals.
smoothLen (EMA on z)
2–3 = snappier; 5–7 = smoother/laggier but cleaner.
useSigma, bbLen, bbK (price-stretch filter)
On filters chop. Try bbLen=100, bbK=1.0–1.5.
Off if you want more frequent signals or you already gate with your own σ/Keltner.
useHTF, htfTF, htfZmin (trend/confirmation)
Turn on to require higher-TF imbalance agreement (e.g., trading 1H → confirm with 4H htfTF=240, htfZmin≈0.6–1.0).
hotZ (visual intensity)
Lower (2.0–2.5) heats up faster; higher (4.0) is more subtle.
Ready-made presets
Conservative swing (fewer, higher-conviction):
enterZ=2.0, exitZ=1.0, lenPrem=60–80, smoothLen=5, useSigma=true, bbK=1.5, useHTF=true (240/0.8).
Balanced intraday (default feel):
enterZ=1.6–1.8, exitZ=0.8–1.0, lenPrem=50, smoothLen=3–4, useSigma=true, bbK=1.0–1.25, useHTF=false/true depending on trendiness.
Aggressive scalping (more signals):
enterZ=1.2–1.4, exitZ=0.6–0.8, lenPrem=20–30, smoothLen=2–3, useSigma=false, useHTF=false.
Practical tips
Don’t trade the line in isolation. Use it to time trades into your levels: VWAP bands, Monday high/low, prior POC/VAH/VAL, order blocks, etc.
Perp-led reversals often snap—be ready to scale out quickly back to mid-bands.
Venue matters. Keep spot & perp from the same exchange family to avoid cross-venue quirks.
Alerts: enable after you’ve tuned thresholds for your timeframe so you only get high-quality pings.

Momentum DivergenceOverview
The Momentum Divergence Oscillator is a valuable tool designed for traders who are familiar with basic charting but want to deepen their market insights. This indicator combines a momentum calculation with divergence detection, presenting the data in an intuitive way with a blue momentum line and colored divergence signals ("Bull" and "Bear"). It’s perfect for refining entry and exit points across various timeframes, especially for scalping or swing trading strategies.
Understanding the Concepts
What is Momentum?
Momentum measures the speed and strength of a price movement by comparing the current closing price to a previous close over a set period. In this indicator, it’s calculated as the difference between the current close and the close from a user-defined number of bars ago (default: 10). A rising momentum line indicates accelerating upward momentum, while a falling line suggests slowing momentum or a potential reversal. This helps you gauge whether a trend is gaining power or losing steam, making it a key indicator for spotting overbought or oversold conditions.
What is a Divergence?
A divergence occurs when the price action and the momentum indicator move in opposite directions, often signaling a potential trend reversal. The Momentum Divergence Oscillator highlights two types:
Bullish Divergence: When the price forms a lower low (indicating weakness), but the momentum shows a higher low (suggesting underlying strength). This can foreshadow an upward reversal.
Bearish Divergence: When the price reaches a higher high (showing strength), but the momentum records a lower high (indicating fading momentum). This may hint at an impending downward turn.
How the Indicator Works
The indicator plots a momentum line in a separate pane below your chart, giving you a clear view of price momentum over time. It also scans for divergences using adjustable lookback periods (default: 5 bars left and right) and a range window (default: 5-60 bars) to ensure relevance. When a divergence is detected, it’s visually highlighted, and you can customize the sensitivity through input settings like the momentum length and pivot lookback. Alerts are included to notify you of new divergence signals in real-time, saving you from constant monitoring.
How to Apply It
Identifying Opportunities: Use bullish divergences ("Bull") as a cue to consider long positions, especially when confirmed by support levels or a moving average crossover. Bearish divergences ("Bear") can signal short opportunities, particularly near resistance zones.
Combining with Other Tools: Pair this oscillator with indicators like the Relative Strength Index (RSI) or volume analysis to filter out false signals and increase confidence in your trades. For example, a bullish divergence with rising volume can be a stronger buy signal.
Timeframe Flexibility: Test it on shorter timeframes (e.g., 5-minute charts) for quick scalping trades or longer ones (e.g., 1-hour or 4-hour charts) for swing trading, adjusting the momentum length to suit the market’s pace.
Alert Setup: Enable the built-in alerts to get notified when a divergence forms, allowing you to react promptly without staring at the screen all day.
Strategy Example
Spot a bullish divergence on a 15-minute chart where the price hits a lower low, but the momentum rises.
Confirm with a break above a 20-period EMA and increasing volume.
Enter a long position with a stop-loss below the recent low and a take-profit near the next resistance level.
Customization Tips
Adjust the "Momentum Length" (default: 10) to make the oscillator more or less sensitive—shorter lengths react faster, while longer ones smooth out noise.
Tweak the "Pivot Lookback" settings to widen or narrow the divergence detection range based on your trading style.
Use the "Range Upper/Lower" inputs to focus on divergences within a specific timeframe that matches your strategy.
Important Considerations
b]This indicator is a technical analysis tool, not a guaranteed trading system. Always pair it with a solid strategy and strict risk management, such as setting stop-losses.
In strong trending markets, divergences can sometimes produce false signals. Consider adding a trend filter (e.g., ADX below 25) to avoid whipsaws.
Experiment with the settings on a demo account or backtest to find what works best for your preferred markets and timeframes.

Universal Valuation | Lyro RSUniversal Valuation
⚠️Disclaimer: This indicator is a tool for technical analysis and does not provide guaranteed results. It should be used in conjunction with other analysis methods and proper risk management practices. The creators of this indicator are not responsible for any financial decisions made based on its signals.
Overview
The Universal Valuation indicator helps identify whether the market is undervalued/cheap or overvalued/expensive. And another mode this indicator offers is This cutting-edge tool works flawlessly ACROSS ALL TIMEFRAMES & TICKERS/CHARTS.
By combining regular TradingView indicators & some of our valuation indicators basic/simple with advanced statistical functions, this indicator offers a powerful, universal valuation tool.
Key Features
INPUTS: The Universal Valuation indicator offers flexibility through its customizable input sections. The "Indicator Settings" let you adjust lengths for the raw indicators and statistical functions. The "Signals" section defines thresholds for background color changes, helping you visually spot key market moments. The "Colors" section allows you to pick from pre-defined schemes or personalize colors for better clarity. Lastly, the "Tables" section gives you full control over the UV table’s size and positioning, including options to overlay it on the chart or place it in the allocated space.
A DEEPER INSIGHT: This indicator is built around three distinct categories: "UVM Andromeda," "UVM Sentinel," and "UVM Nexus." Each category has three different drivers. The statistical function powering this indicator is the Z-score. The Z-score is an incredibly powerful tool that helps determine if the market is overvalued/expensive or undervalued/cheap, offering critical insights for traders."
Plotting: The plotted value represents the average of all the drivers. In other words, it is the combined average of all 9 Z-scored indicators, providing a balanced and comprehensive market valuation.
What is Z-score? & Why does this system use it?
Z-score is an advanced statistical function used to measure how far a value deviates from the average in a data set. The formula for Z-score is: (x - h) / o, where x is the observed value, h is the average (mean) of the data set, and o is the standard deviation.
This system uses the Z-score because it helps determine whether the market is overvalued or undervalued based on historical data and how we apply the calculation. By measuring how far a value deviates from the average, the Z-score provides a clearer and more objective valuation of market conditions. In our case, a Z-score of -3 indicates an undervalued market, while a Z-score of 3 signals an overvalued market.
UVM Andromeda:
UVM stands for Universal Valuation Model, which is the core of this indicator. Andromeda, one of the most stunning galaxies in the universe, inspired by its name. We chose this name because a powerful indicator should not only be effective but also visually appealing.
You might be wondering what drives UVM Andromeda. The three key drivers are Price, RSI, and ROC. These indicators are pre-defined, while the "Indicator Settings" allow you to adjust the length of the Z-score calculation, refining how the model analyzes market conditions.
UVM Sentinel:
Sentinel, refers to a guard or watchman, someone or something that keeps watch and provides protection. In our case this name refers to a model that actively observes market conditions, acting as a vigilant tool that signals important shifts in valuation.
Wondering what drives UVM Sentinel? The three key drivers are BB%, CCI, and Crosby. While these indicators are simple on their own, applying our Z-score function elevates them to a whole new level, enhancing their ability to detect market conditions with greater accuracy.
UVM Nexus:
We chose the name Nexus simply because it sounds cool—there’s no deeper meaning behind it for us. However, the word itself does have a meaning; it refers to a connection or link between multiple things.
The three key drivers for UVM Nexus are the Sharpe, Sortino, and Omega ratios. These are all asset performance metrics, but by applying the Z-score, we transform them into powerful valuation indicators/drivers, giving you a deeper insight into market conditions.
Why do we use 9 different indicators instead of 1?
That's a great question, and the answer is quite simple. Think of it like this: if you have one super soldier, and they miss a shot, it’s game over. But if you have many soldiers, even if one misses, the others can step in and take the shot. The strength of using multiple indicators lies in their collective power – if one misses, the others still provide valuable insights, making the overall system more reliable.
Final Thoughts:
In our Universal Valuation indicator, you have the flexibility to customize it however you like using our inputs. The system is divided into three distinct categories, with each category containing three indicators. The value plotted on the chart is the average of all nine indicators. We apply the Z-score, an advanced statistical function, to each of these nine indicators. The final plotted average is the average of all the Z-scores, giving you a comprehensive and refined market valuation. This indicator can work on any timeframe & chart ticker.
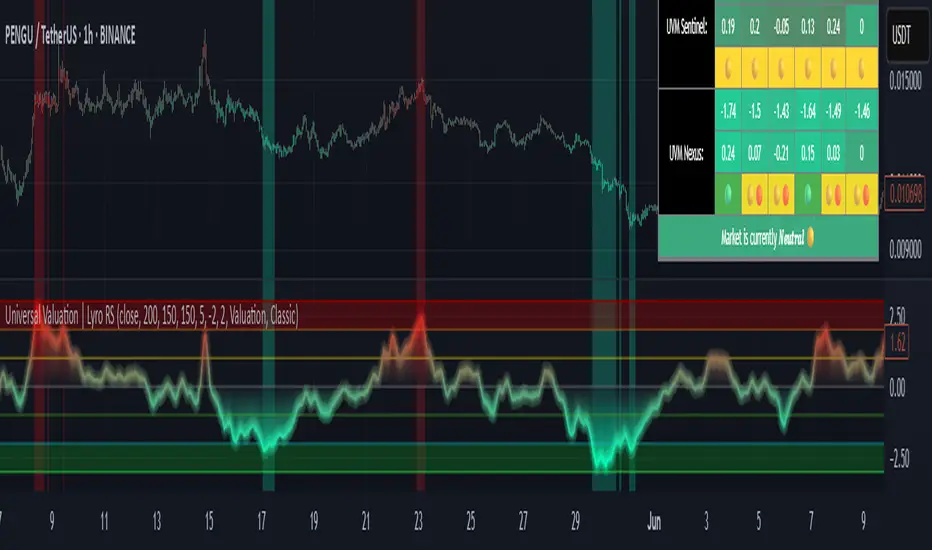
DCI### 📌 **DCI – Direction Correlation Index**
#### 🔹 **What It Is**
The **Direction Correlation Index (DCI)** is a tool for measuring how closely a group of up to 10 symbols move together in both *trend correlation* and *short-term direction*. It helps identify whether a group of assets is acting in unison or moving independently.
---
#### ⚙️ **How It Works**
DCI outputs three key metrics:
1. **Average Correlation**
* Measures the average of all pairwise correlations between the selected symbols.
* Prices are first standardized using a z-score (based on simple moving average and standard deviation over a user-defined lookback period).
* Correlation is calculated using Pearson’s method for all 45 symbol pairs.
* Result ranges from:
* `+1.00` = strong positive correlation
* `0.00` = no correlation
* `-1.00` = strong inverse correlation
2. **Direction Agreement %**
* Checks whether each symbol is moving up or down compared to its previous bar.
* Calculates the percentage of symbols moving in the same direction.
* For example: if 7 of 10 symbols are moving up and 3 are moving down, the direction agreement is 70%.
3. **Strong Correlation Count**
* Counts how many of the 45 symbol pairs have an absolute correlation above `0.7`.
* Helps highlight how many pairs are currently highly correlated.
---
#### 📈 **How to Use It**
1. **Select Symbols**
* In the **Settings**, you can input up to 10 custom symbols. These can be stocks, indices, forex pairs, crypto, or any tradable asset.
2. **Adjust the Lookback Period**
* Defines how many bars back are used to calculate z-scores and correlations.
* Default is `12`. Use shorter periods for faster response; longer periods for smoother, slower data.
3. **Interpret the Table (Plotted on Chart)**
* **Avg Corr**: Tells you how much the group is co-moving. High correlation often reflects unified market behavior.
* **Dir Agr %**: Shows directional sync. High values mean most instruments are trending the same way in the current bar.
* **> 0.7**: The number of pairs currently strongly correlated (|corr| > 0.7).
---
#### 🧠 **Practical Usage Tips**
* Use DCI to monitor **sector alignment**, **portfolio behavior**, or **market group momentum**.
* Confirm trend strength by checking if high correlation aligns with a strong direction agreement.
* Low correlation + mixed direction can signal **choppy or indecisive markets**.
* High correlation + strong direction = **trend confirmation** across your selected instruments.
- Made with DeepSeek
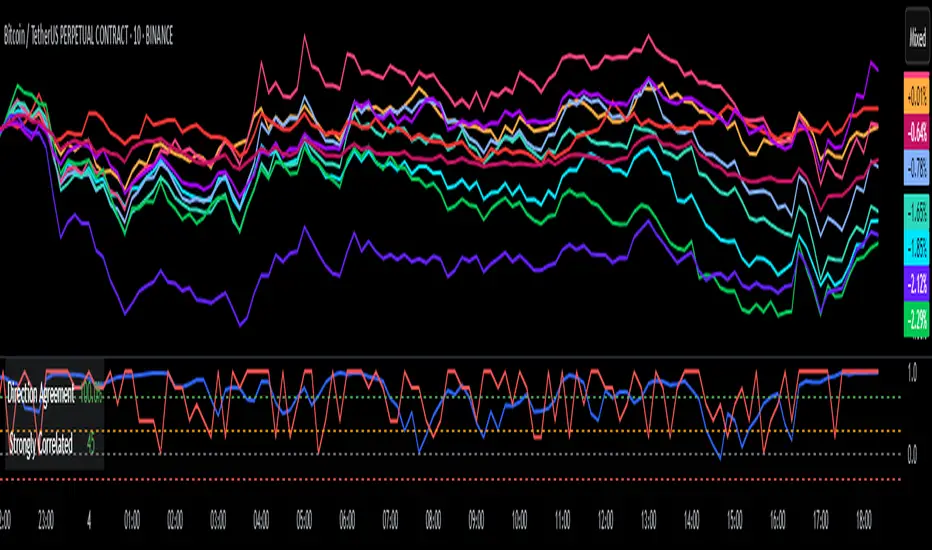
BK AK-Scope🔭 Introducing BK AK-Scope — Target Locked. Signal Acquired. 🔭
After building five precision weapons for traders, I’m proud to unveil the sixth.
BK AK-Scope — the eye of the arsenal.
This is not just an indicator. It’s an intelligence system for volatility, signal clarity, and rate-of-change dynamics — forged for elite vision in any market terrain.
🧠 Why “Scope”? And Why “AK”?
Every shooter knows: you can’t hit what you can’t see.
The Scope brings range, clarity, and target distinction. It filters motion from noise. Purpose from panic.
“AK” continues to honor the man who trained my sight — my mentor, A.K.
His discipline taught me to wait for alignment. To move with reason, not emotion.
His vision lives in every code line here.
🔬 What Is BK AK-Scope?
A Triple-Tier TSI Correlation Engine, fused with adaptive opacity logic, a volatility scoring system, and real-time signal clarity. It’s momentum dissected — by speed, depth, and rate of change.
Built to serve traders who:
Need visual hierarchy between fast, mid, and slow TSI responses.
Want adaptive fills that pulse with volatility — not static zones.
Require a volatility scoring overlay that reads the battlefield in real time.
⚙️ Core Systems: How BK AK-Scope Works
✅ Fast/Mid/Slow TSI →
Three layers of correlation: like scopes with zoom levels.
You track micro moves, mid swings, and macro flow simultaneously.
✅ Rate-of-Change Adaptive Opacity →
Momentum fills fade or flash based on speed — giving you movement density at a glance.
Bull vs. Bear zones adapt to strength. You feel the market’s pulse.
✅ Volatility Score Intelligence →
Custom algorithm measuring:
Range expansion
Rate-of-change differentials
ATR dynamics
Standard deviation pressure
All combined into a score from 0–100 with live icons:
🔥 = Extreme Heat (70+)
🧊 = Cold Zone (<30)
⚠️ = ROC Warning
• = Neutral drift
✅ Auto-Detect Volatility Modes →
Scalp = <15min
Swing = intraday/hourly
Macro = daily/weekly
Or override manually with total control.
🎯 How To Use BK AK-Scope
🔹 Trend Continuation → When all three TSI layers align in direction + volatility score climbs, ride with the trend.
🔹 Early Reversals → Opposing TSI + rapid opacity change + volatility shift = sniper reversal zone.
🔹 Consolidation Filter → Neutral fills + score < 30 = stay out, wait for signal surge.
🔹 Signal Confluence → Pair with:
• Gann fans or angles
• Fib time/price clusters
• Elliott Wave structure
• Harmonics or divergence
To isolate entry perfection.
🛡️ Why This Indicator Changes the Game
It's not just momentum. It’s TSI with depth hierarchy.
It’s not just color. It’s real-time strength visualization.
It’s not just volatility. It’s rate-weighted market intelligence.
This is market optics for the advanced trader — built for vision, clarity, and discipline.
🙏 Final Thoughts
🔹 In honor of A.K., my mentor. The man who taught me to see what others miss.
🔹 Inspired by the power of vision — because execution without clarity is chaos.
🔹 Powered by faith — because Gd alone gives sight beyond the visible.
“He gives sight to the blind and wisdom to the humble.” — Psalms 146
Every tool I build is a prayer in code — that it helps someone trade with clarity, integrity, and precision.
⚡ Zoom In. Focus Deep. Trade Clean.
BK AK-Scope — Lock on the target. See what others don’t.
🔫 Clarity is power. 🔫
Gd bless. 🙏
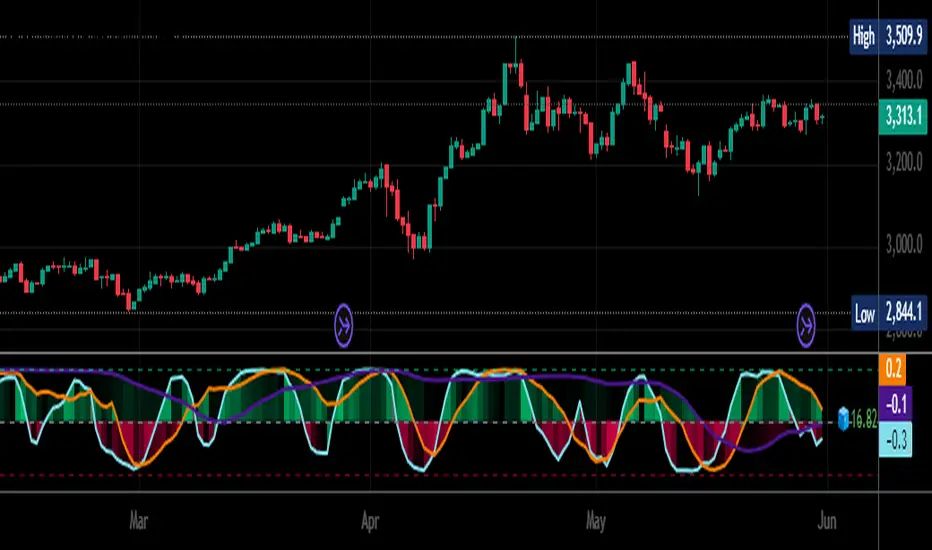
Alert TrendThis indicator is designed to function as a dynamic BIAS tool but can be adapted to various strategies depending on user needs.
Key Features and Integration:
Personally, I pair it with the "EMA Suite" indicator, as my strategy revolves around Fibonacci-based moving averages. The indicator uses EMA 55 and EMA 233 as trend references, triggering a trend shift when a candle closes fully above or below these levels. To maintain structural integrity, the EMA values are not user-configurable in the settings: adjustments require direct script modification (e.g., switching to EMA 50 and EMA 200, widely recognized reference levels), this ensures logical consistency for advanced users familiar with Pine Script.
Output Signals and Interpretation:
The indicator generates four distinct signals:
1. Uptrend: Candle closes above both EMA 55 and EMA 233.
2. Weak Uptrend: Candle closes above EMA 55 but below EMA 233.
3. Downtrend: Candle closes below both EMA 55 and EMA 233.
4. Weak Downtrend: Candle closes below EMA 55 but above EMA 233.
The area between the two EMAs represents a "complex zone" where price action contradicts higher timeframe trends. To resolve ambiguity, combine this indicator with a primary timeframe (e.g., H4) and a confirmation timeframe (e.g., H1). In smaller timeframes may also serve as entry signals, a feature currently under exploration for automation.
Alert System and Strategy Integration:
The indicator includes customizable alerts for all four signals collectively or individually, streamlining integration into Strategy scripts. This flexibility enhances adaptability for backtesting or live trading.
Critical Note:
Configure the indicator to display exclusively on the selected timeframe. Higher intervals fail to render all signals due to overlapping visualizations, distorting analysis. To resolve this, set the visibility parameter to "Visibility on intervals/Current interval and below" in the chart settings. This ensures clarity and preserves signal accuracy.
Development Status and Collaboration:
As part of an ongoing project, this tool is already integrated into my personal strategy. While functional and publicly shareable, further refinements are planned. Though not a professional developer, I utilize Deepseek for coding assistance and possess sufficient Pine Script literacy to oversee the logic. Feedback, suggestions, and collaborations are welcome to optimize its utility.
I hope this tool proves valuable to fellow traders navigating multi-timeframe analysis and trend confirmation.
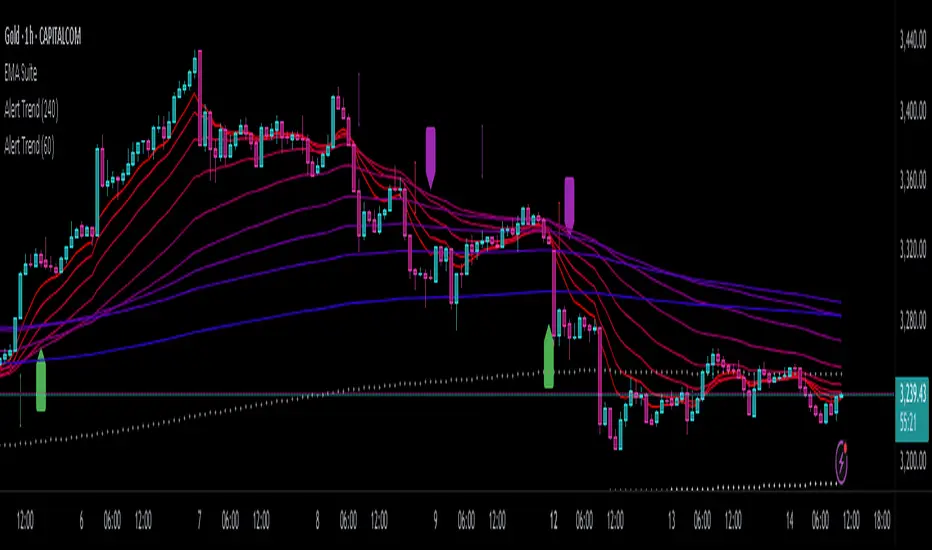
[blackcat] L1 Rhythm OscillatorOVERVIEW 📊💡
The L1 Rhythm Oscillator is an advanced oscillator designed to identify potential entry points in financial markets using a combination of Williams %R indicators and Time-Varying Moving Averages (TVMAs). This script provides traders with clear buy and sell signals that help them capitalize on trends while minimizing risk.
FEATURES 💡🌟
Williams %R Analysis:
Base Indicator (WR0): Measures overbought/oversold conditions within a specified period.
Smoothed Indicators (WR1 & WR2): Further refined versions of WR0 to filter out noise and highlight significant trends.
Dynamic Bands:
Bull Band: Shaded area between WR0 and the bullish threshold when WR0 falls below the defined level.
Bear Band: Shaded area between WR0 and the bearish threshold when WR0 exceeds the defined level.
Trading Signals:
Buy Signal: Generated when WR1 crosses above WR2, indicating a potential upward trend reversal.
Sell Signal: Triggered when WR1 crosses below WR2, suggesting a downward trend shift.
Thresholds:
Bull Threshold (default 60%): Marks levels where the asset is considered relatively undervalued.
Bear Threshold (default 40%): Indicates regions where the asset might be overvalued.
Visual Enhancements:
Colored Bands: Clearly distinguish between bullish and bearish areas.
Horizontal Lines: Provide quick reference points for overbought/oversold levels.
Labels: Display "BUY" and "SELL" markers at key signal locations.
HOW TO USE ⚙️📈
Add the Indicator to Your Chart:
Open your preferred asset's chart on TradingView.
Click on “Indicators” and search for “ L1 Rhythm Oscillator.”
Add the indicator to your chart.
Customize Parameters:
Adjust these inputs according to your trading strategy:
WR Period: Sets the lookback window for calculating Williams %R.
Bull Threshold: Defines the upper limit for bullish territory.
Bear Threshold: Establishes the lower boundary for bearish territory.
TVMA Length: Controls the sensitivity of the moving average used in calculations.
Interpret Visual Elements:
Yellow Line (WR1): The first smoothed version of the base Williams %R.
Fuchsia Line (WR2): The second smoothed line derived from WR1 via TVMA.
Lime-Shaded Area: Represents Bull Band where prices are potentially undervalued.
Red-Shaded Area: Symbolizes Bear Band indicating possible overvaluation.
Horizontal Lines:
Value 0% represents perfect overbought condition.
Value 100% indicates extreme oversold state.
Bull/Bear thresholds provide additional context for interpreting market sentiment.
Act on Crossovers:
Look for instances where WR1 crosses through WR2:
When WR1 moves above WR2 → Potential BUY opportunity.
When WR1 dips below WR2 → Likely SELL scenario.
Consider Contextual Factors:
Combine the oscillator signals with other technical indicators like MACD, RSI, or volume analysis for more robust decision-making.
Be aware of broader market trends and news events that could impact price movements.
Manage Risk:
Always use proper stop-loss orders to protect against adverse price movements.
Consider position sizing based on available capital and risk tolerance.
LIMITATIONS ⚠️🔍
Historical Data Dependency: Like most oscillators, this tool relies on past data patterns which may not always predict future behavior accurately.
False Signals: No single indicator can guarantee correct predictions; false positives/negatives can arise during volatile periods.
Overfitting Risks: Customized settings might work well historically but fail under different market conditions without careful validation.
Complexity: Multiple layers of smoothing and crossover logic require understanding to interpret correctly.
NOTES 🔍📝
Parameter Optimization: Experiment with various combinations of WR Period, Bull/Bear Thresholds, and TVMA Length to find what works best for specific assets and timeframes.
Regular Review: Continuously monitor the performance of the indicator versus actual outcomes, adjusting parameters as needed.
Educational Resources: Deepen your knowledge about oscillator strategies, particularly focusing on how they detect reversals and momentum shifts.
Consistency Key: For successful implementation, maintain consistent rules regarding trade entries/exits regardless of short-term fluctuations.
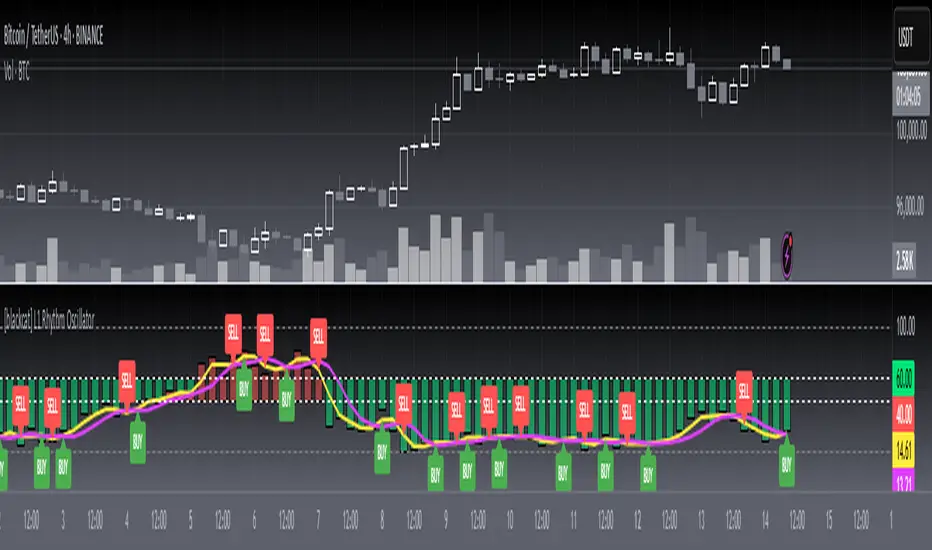
[blackcat] L1 Dynamic EdgeOVERVIEW
📈 The L1 Dynamic Edge is a sophisticated trend-following indicator designed to empower traders with a comprehensive view of market dynamics and precise buy/sell signals. By leveraging multiple Exponential Moving Averages (EMAs) and advanced signal processing, this indicator aims to capture the essence of price momentum and provide actionable insights across various financial instruments and timeframes.
🔑 Key Features:
Fully customizable EMA settings
Multi-dimensional trend analysis using high, low, and midpoint EMAs
Intuitive color-coded trend visualization
Accurate buy/sell signals with visual confirmation
Flexible alert system for real-time notifications
Seamless integration with TradingView's charting tools
FEATURES
📉 Advanced Trend Detection:
Utilizes three distinct EMAs (high, low, and midpoint) for a holistic view of market trends
Employs sophisticated logic to determine rising and falling trends
🌟 Dynamic Visualization:
Automatically adjusts the color of EMA plots based on detected trend direction
Fills the area between high and low EMAs for enhanced visual clarity
📈 Precision Signal Generation:
Identifies potential trend reversals using a combination of price action and EMA behavior
Generates clear buy/sell signals based on trend changes
📊 Comprehensive Chart Integration:
Displays buy/sell signals as easily identifiable shapes on the chart
Adds descriptive labels to signal bars for quick reference
🔔 Customizable Alert System:
Provides alert conditions for both buy and sell signals
Allows users to stay informed about potential trading opportunities even when away from the chart
🛠️ User-Friendly Interface:
Simple input parameters for easy customization
Clean and uncluttered chart appearance without overwhelming the user
🌐 Versatile Application:
Adaptable to various financial instruments, including stocks, forex, commodities, and cryptocurrencies
Effective across different timeframes, from short-term scalping to long-term investing
HOW TO USE
✨ Adding the Indicator:
Open your TradingView chart
Click on "Add Indicator" at the top of the screen
Search for " L1 Dynamic Edge" and add it to your chart
🔧 Customizing Settings:
Adjust the EMA length in the input panel to suit your trading style and preferences
Experiment with different values to find what works best for your specific strategy
🕵️♂️ Analyzing Trends:
Observe the color of the EMA bands to quickly assess the overall market sentiment
Note how the filling between the high and low EMAs responds to price movements
📈 Identifying Opportunities:
Watch for buy/sell signals indicated by triangles and labels on the chart
Consider these signals as potential entry/exit points for your trades
🎯 Implementing Strategies:
Combine the indicator's signals with your own analysis and risk management techniques
Use the provided alerts to stay informed about new trading opportunities
🚨 Setting Up Alerts:
Configure alert conditions for buy and sell signals
Choose your preferred notification method (email, SMS, push notifications, etc. )
📊 Fine-Tuning Your Approach:
Regularly review and analyze the indicator's performance
Adjust the EMA length and other parameters as needed to adapt to changing market conditions
LIMITATIONS
Like any technical indicator, the L1 Dynamic Edge should not be used as a standalone trading system
Its effectiveness may be limited during periods of extreme volatility or in highly ranging markets
The indicator's performance will vary depending on the specific instrument and timeframe being analyzed
New traders might need some time to fully understand and effectively utilize all features of the indicator
NOTES
This script utilizes Pine Script version 5 for optimal performance and compatibility with TradingView's latest features
The default EMA length is set to 3, which provides a balance between responsiveness and noise reduction
The indicator's color scheme has been carefully chosen to ensure maximum visibility while maintaining a clean chart appearance
For best results, consider combining this indicator with other forms of technical and fundamental analysis
Regular backtesting and forward testing are crucial to optimize the indicator's settings for your specific trading style and market conditions
THANKS
We extend our deepest gratitude to the vibrant TradingView community for their invaluable feedback, suggestions, and support throughout the development process of the L1 Dynamic Edge indicator. Special thanks to all the dedicated traders who took the time to test and refine this tool, helping us create a more robust and user-friendly experience for everyone.
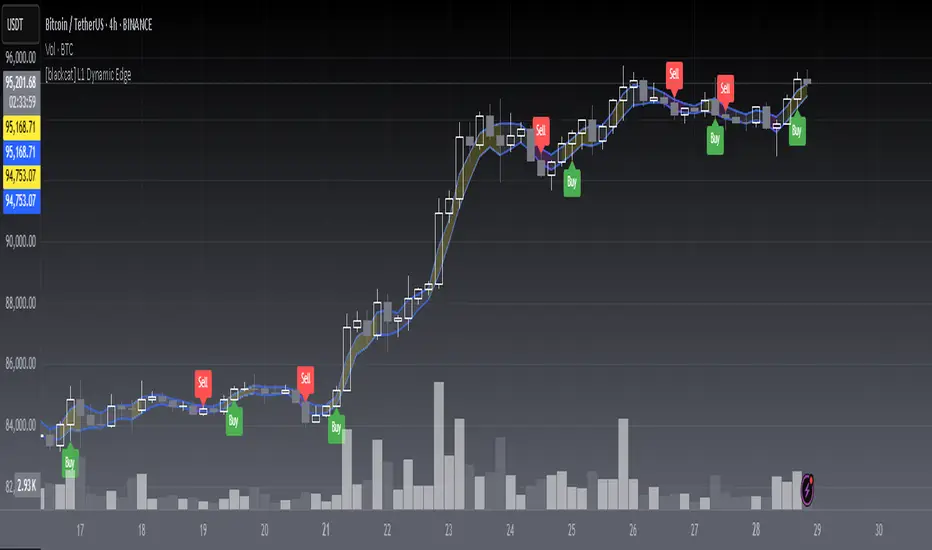
MÈGAS ALGO : ZIG-ZAG CYCLE INSIGTH [INDICATOR]Overview
The Zig-Zag Cycle Insigth is a revisited version of the classic Zig Zag indicator, designed to provide traders with a more comprehensive and actionable view of price movements.
This advanced tool not only highlights significant price swings but also incorporates additional features such as cycle analysis, real-time data tracking, and Fibonacci retracement levels. These enhancements make it an invaluable resource for identifying trends, potential reversal points, and market structure.
This indicator adheres to TradingView's guidelines and is optimized for both technical analysts and active traders who seek deeper insights into market dynamics.
Key Features:
1. Customizable Thresholds for Price Movements:
- Users can set personalized thresholds for price movement percentages and time periods.
This ensures that only significant price swings are plotted, reducing noise and increasing
clarity.
- Straight lines connect swing highs and lows, providing a cleaner visual representation of
the trend.
2. Cycle Analysis Table:
- A dynamic table is included to analyze price cycles based on three key factors:
- Price Change: Measures the magnitude of each swing (high-to-low or low-to-high).
- Time Duration (Bar Count): Tracks the number of bars elapsed between consecutive swings,
offering precise timing insights.
- Volume: Analyzes trading volume during each segment of the cycle.
- The indicator calculates the **maximum**, **minimum**, and **mean** values for each
parameter across all completed cycles, providing deeper statistical insights into market
behavior.
- This table updates in real-time, offering traders a quantitative understanding of how price
behaves over different cycles.
3. Real-Time Data Integration:
- The indicator displays live updates of current price action relative to the last identified
swing high/low. This includes:
- Current distance from the last pivot point.
- Percentage change since the last pivot.
- Volume traded since the last pivot.
4. Fibonacci Retracement Levels:
- Integrated Fibonacci retracement levels are dynamically calculated based on the most
recent significant swing high and low.
- Key retracement levels (23.6%, 38.2%, 50%, 61.8%, and 78.6%) are plotted alongside the Zig
Zag lines, helping traders identify potential support/resistance zones.
- Extension levels (100%, 161.8%, etc.) are also included to anticipate possible breakout
targets.
5. Customizable Alerts:
- Users can configure alerts for specific real-time conditions, such as:
- Price Change
- Duration
- Volume
- Fibonacci Retracement Levels
How It Works:
1. Zig Zag Identification:
- The indicator scans historical price data to identify significant turning points where the
price moves by at least the user-defined percentage threshold.
- These turning points are connected by straight lines to form the Zig Zag pattern.
2. Cycle Analysis:
For each completed cycle (from one swing high/low to the next), the indicator calculates:
- Price Change: Difference between the start and end prices of the cycle.
- Maximum Price Change: The largest price difference observed across all cycles.
- Minimum Price Change: The smallest price difference observed across all cycles.
- Mean Price Change: The average price difference across all cycles.
- Time Duration (Bar Count): Number of bars elapsed between consecutive swings.
- Maximum Duration: The longest cycle in terms of bar count.
- Minimum Duration: The shortest cycle in terms of bar count.
- Mean Duration: The average cycle length in terms of bar count.
- Volume: Total volume traded during the cycle.
- Maximum Volume: The highest volume traded during any single cycle.
- Minimum Volume: The lowest volume traded during any single cycle.
- Mean Volume: The average volume traded across all cycles.
- These calculations provide traders with a statistical overview of market behavior, enabling
them to identify patterns and anomalies in price, time, and volume.
3. Fibonacci Integration:
- Once a new swing high or low is identified, the indicator automatically calculates Fibonacci
retracement and extension levels.
- These levels serve as reference points for potential entry/exit opportunities.
4. Real-Time Updates:
- As the market evolves, the indicator continuously monitors the relationship between the
current price and the last identified swing point.
- Real-time metrics, such as percentage change and volume, are updated dynamically.
5. Alerts Based on Real-Time Parameters:
- The indicator allows users to set customizable alerts based on real-time conditions:
- Price Change Alert: Triggered when the real-time price change is less or greater than a
predefined percentage threshold (e.g., > or < fixed value).
- Duration Alert: Triggered when the cycle duration (in bars) is less or greater than a
predefined
bar count threshold (e.g., > or < fixed value).
- Volume Alert: Triggered when the trading volume during the current cycle is less or greater
than a predefined volume threshold (e.g., > or < fixed value).
Advantages of Zig-Zag Cycle Insigth
- Comprehensive Insights: Combining cycle analysis, Fibonacci retracements, and real-time data
provides a holistic view of market conditions.
- Statistical Analysis: The inclusion of maximum, minimum, and mean values for price change,
duration, and volume offers deeper insights into market behavior.
- Actionable Signals: Customizable alerts ensure traders never miss critical market events based
on real-time price, duration, and volume parameters.
- User-Friendly Design: Clear visuals and intuitive controls make it accessible for traders of all
skill levels.
Reference:
TradingView/ZigZag
TradingView/AutofibRetracement
Please Note:
This indicator is provided for informational and educational purposes only. It is not financial advice, and it should not be considered a recommendation to buy, sell, or trade any financial instrument. Trading involves significant risks, including the potential loss of your entire investment. Always conduct your own research and consult with a licensed financial advisor before making any trading decisions.
The results and images provided are based on algorithms and historical/paid real-time market data but do not guarantee future results or accuracy. Use this tool at your own risk, and understand that past performance is not indicative of future outcomes.

Reversal + Confirm ZonesThis script is written in Pine Script (version 5) for TradingView and creates an indicator called **"Reversal + Confirm Zones"**. It overlays visual zones on a price chart to identify potential reversal points and confirmation signals for trading. The indicator combines **Bollinger Bands** and **RSI** to detect overbought/oversold conditions (reversal zones) and uses **EMA crosses** and **MACD zero-line crosses** to confirm bullish or bearish trends. Below is a detailed explanation:
---
### **1. Purpose**
- The script highlights:
- **Reversal Zones**: Areas where the price might reverse due to being overbought (green) or oversold (red).
- **Confirmation Zones**: Areas where a trend reversal is confirmed using EMA and MACD signals (green for bullish, red for bearish).
- It provides visual backgrounds and alerts to assist traders in spotting potential trade setups.
---
### **2. Components**
The script is divided into two main parts: **Reversal Logic** and **Confirmation Logic**.
---
### **3. Reversal Logic (Red & Green Zones)**
#### **Bollinger Bands**
- **Parameters**:
- Length: 20 periods.
- Source: Closing price (`close`).
- Multiplier: 2.0 (standard deviations).
- **Calculation**:
- `basis`: 20-period Simple Moving Average (SMA).
- `dev`: 2 times the standard deviation of the price over 20 periods.
- `upper`: `basis + dev` (upper band).
- `lower`: `basis - dev` (lower band).
- **Purpose**: Identifies when the price moves outside the normal range (beyond 2 standard deviations).
#### **Relative Strength Index (RSI)**
- **Parameters**:
- Length: 14 periods.
- Low Threshold: 30 (oversold).
- High Threshold: 70 (overbought).
- **Calculation**: `rsiValue = ta.rsi(close, rsiLength)`.
- **Purpose**: Measures momentum to confirm overbought or oversold conditions.
#### **Zone Conditions**
- **Red Zone (Oversold)**:
- Condition: `close < lower` (price below lower Bollinger Band) AND `rsiValue < rsiLowThreshold` (RSI < 30).
- Visual: Light red background (`color.new(color.red, 80)`).
- Alert: "Deep Oversold Signal triggered!".
- **Green Zone (Overbought)**:
- Condition: `close > upper` (price above upper Bollinger Band) AND `rsiValue > rsiHighThreshold` (RSI > 70).
- Visual: Light green background (`color.new(color.green, 80)`).
- Alert: "Deep Overbought Signal triggered!".
#### **Interpretation**
- Red Zone: Suggests the price is oversold and may reverse upward.
- Green Zone: Suggests the price is overbought and may reverse downward.
---
### **4. Confirmation Logic (EMA and MACD Crosses)**
#### **Exponential Moving Averages (EMAs)**
- **Parameters**:
- Short EMA Length: 9 periods (user adjustable).
- Long EMA Length: 21 periods (user adjustable).
- **Calculation**:
- `emaShort = ta.ema(close, emaShortLength)`.
- `emaLong = ta.ema(close, emaLongLength)`.
- **Conditions**:
- **Bullish EMA Cross**: `emaCrossBullish = ta.crossover(emaShort, emaLong)` (9 EMA crosses above 21 EMA).
- **Bearish EMA Cross**: `emaCrossBearish = ta.crossunder(emaShort, emaLong)` (9 EMA crosses below 21 EMA).
#### **MACD**
- **Parameters**:
- Fast Length: 12 periods (user adjustable).
- Slow Length: 26 periods (user adjustable).
- Signal Smoothing: 9 periods (user adjustable).
- **Calculation**:
- ` = ta.macd(close, macdFastLength, macdSlowLength, macdSignalSmoothing)`.
- Only the MACD line and signal line are used; the histogram is ignored (`_`).
- **Conditions**:
- **Bullish MACD Cross**: `macdCrossBullish = ta.crossover(macdLine, 0)` (MACD crosses above zero).
- **Bearish MACD Cross**: `macdCrossBearish = ta.crossunder(macdLine, 0)` (MACD crosses below zero).
#### **Combined Confirmation Conditions**
- **Bullish Confirmation**:
- Condition: `bullishConfirmation = emaCrossBullish and macdCrossBullish`.
- Visual: Very light green background (`color.new(color.green, 90)`).
- Meaning: A bullish trend is confirmed when the 9 EMA crosses above the 21 EMA AND the MACD crosses above zero.
- **Bearish Confirmation**:
- Condition: `bearishConfirmation = emaCrossBearish and macdCrossBearish`.
- Visual: Very light red background (`color.new(color.red, 90)`).
- Meaning: A bearish trend is confirmed when the 9 EMA crosses below the 21 EMA AND the MACD crosses below zero.
---
### **5. Visual Outputs**
- **Reversal Zones**:
- Red background for oversold conditions.
- Green background for overbought conditions.
- **Confirmation Zones**:
- Light green background for bullish confirmation.
- Light red background for bearish confirmation.
- Note: The script does not plot the Bollinger Bands, EMAs, or MACD lines—only the background zones are visualized.
---
### **6. Alerts**
- **Deep Oversold Alert**: Triggers when the red zone condition is met.
- **Deep Overbought Alert**: Triggers when the green zone condition is met.
- No alerts are set for the confirmation zones (EMA/MACD crosses).
---
### **7. How It Works**
1. **Reversal Detection**:
- The script uses Bollinger Bands and RSI to flag extreme price levels (red for oversold, green for overbought).
- These zones suggest potential reversals but are not confirmed yet.
2. **Trend Confirmation**:
- EMA crosses (9/21) and MACD zero-line crosses provide confirmation of a trend direction.
- Bullish confirmation (green) occurs when both indicators align upward.
- Bearish confirmation (red) occurs when both indicators align downward.
3. **Trading Strategy**:
- Look for a red zone (oversold) followed by a bullish confirmation for a potential long entry.
- Look for a green zone (overbought) followed by a bearish confirmation for a potential short entry.
---
### **8. How to Use**
1. Add the script to TradingView.
2. Adjust inputs (EMA lengths, MACD settings) if desired.
3. Monitor the chart:
- Red zones indicate oversold conditions—watch for a potential upward reversal.
- Green zones indicate overbought conditions—watch for a potential downward reversal.
- Light green/red backgrounds confirm the trend direction after a reversal zone.
4. Set up alerts for oversold/overbought conditions to catch reversal signals early.
---
### **9. Key Features**
- **Dual Purpose**: Combines reversal detection (Bollinger Bands + RSI) with trend confirmation (EMA + MACD).
- **Visual Simplicity**: Uses background colors instead of plotting lines, keeping the chart clean.
- **Customizable**: Allows users to tweak EMA and MACD periods.
- **Alerts**: Notifies users of extreme conditions for timely action.
---
### **10. Limitations**
- No plotted indicators (e.g., Bollinger Bands, EMAs, MACD) for visual reference—relies entirely on background shading.
- Confirmation signals (EMA/MACD) may lag behind reversal zones, potentially missing fast reversals.
- No alerts for confirmation zones, limiting real-time notification of trend confirmation.
This script is ideal for traders who want a straightforward way to spot potential reversals and confirm them with trend-following indicators, all overlaid on the price chart.

Strong Levels (with Proximity Alerts)█ OVERVIEW
The "Strong Levels (with Proximity Alerts)" indicator offers a fresh approach to identifying support and resistance levels, inspired by the RexDog Trading System (RDTS). It pinpoints significant price reversals using a unique filtering method that reduces noise and enhances reliability. Paired with customizable ATR-based proximity alerts, this indicator empowers traders to track critical price zones with precision.
█ FEATURES
- Rooted in RDTS :
Inspired by the RexDog Trading System (RDTS), it highlights major pivot points where price executed sharp turnarounds, ensuring levels carry true market weight.
- Second-Highest/Lowest Open/Close Method :
Resistance levels use the *second-highest open/close* near pivot highs, while support levels use the *second-lowest open/close* near pivot lows—skipping extreme wicks for cleaner, more dependable lines.
- ATR-Driven Proximity Alerts :
Customizable proximity thresholds, calculated using the Average True Range (ATR), warn traders when price approaches key levels—a standout feature not found in most support/resistance indicators.
- Flexible Customization :
- Magnitude : Tweak pivot sensitivity (default: 10).
- Line Colors : Set resistance (red by default), support (green), and proximity (yellow) lines.
- Line Options : Adjust line origins, transparency for breached levels, and the maximum number of levels shown.
- ATR Settings : Fine-tune proximity sensitivity with ATR length and multiplier.
█ HOW TO USE
1. Add to Chart :
Find "Strong Levels (with Proximity Alerts)" in TradingView’s indicator library and apply it.
2. Read the Lines :
- Red Lines : Resistance, derived from the second-highest open/close near pivot highs.
- Green Lines : Support, based on the second-lowest open/close near pivot lows.
- Yellow Dashed Lines : Proximity thresholds (optional), signaling when price nears a level.
3. Customize :
- Raise `Magnitude` for stronger levels or lower it for more detail.
- Adjust colors, transparency, and max levels to fit your preferences.
- Toggle proximity thresholds on/off based on your trading style.
- Enabling *Plot Line from Actual Pivot Bar* offers a cleaner chart but may mislead as lines plot into the past.
4. Set Alerts :
- Open TradingView’s alert menu (the three dots ... dropdown menu next in indicator list has an option "Add alert on ...") and choose "Approaching Level" or "Level Touched.".
- Don't forget to choose the right Trigger condition, which by default is "Only Once". I usually set it to "Once Per Bar".
- Tailor alert conditions to your needs.
█ LIMITATIONS
- Past-Based Levels :
- Relying on historical pivots, it may not always forecast future moves, especially in rapid markets.
- The 'Plot Line from Actual Pivot Bar' option while visually appealing can imply historical significance that didn’t exist at the time. Be mindful of that.
- Volatility Sensitivity :
High volatility widens ATR-based thresholds, which might trigger alerts too soon.
- Display Management :
A cap on max levels avoids clutter, but tweaking `Max Levels` may be needed across timeframes.
█ ACCOMPANYING CHART
The chart showcases the indicator’s unique edge:
- A pivot high and low are flagged, with nearby bars highlighted.
- Resistance is plotted at the *second-highest open/close* around the pivot high, bypassing the highest wick.
- Support is set at the *second-lowest open/close* near the pivot low, ignoring the deepest wick.
- Yellow dashed proximity lines illustrate how the indicator warns traders as price nears these zones.
- Annotations clarify how skipping extreme wicks creates cleaner, more actionable levels.
█ HOW TO USE
1. Add to Chart :
Locate "Strong Levels (with Proximity Alerts)" in TradingView’s indicator library and apply it to your chart.
2. Read the Lines :
- Red Lines**: Resistance levels, calculated from the second-highest open/close near pivot highs.
- Green Lines : Support levels, derived from the second-lowest open/close near pivot lows.
- Yellow Dashed Lines : Optional proximity thresholds, alerting you when price nears a level.
3. Customize :
- Increase `Magnitude` for stronger, less frequent levels or decrease it for more granularity.
- Modify colors, transparency, or the maximum number of levels to suit your style.
- Enable or disable proximity thresholds as needed.
4. Set Alerts :
- Access TradingView’s alert menu and select "Approaching Level" or "Level Touched."
- Adjust conditions to match your trading preferences.
5. My Personal Approach :
I prefer using this indicator on higher timeframes, like hourly or daily charts. I adjust my `Magnitude`, so it doesn't trigger too often and set my alerts to trigger "Once Per Bar". When price nears a level, I get an alert and I anticipate a reaction but avoid placing limit orders blindly. Instead, I switch to smaller timeframes and combine it with other tools for confirmation before making a trade. This saves me a lot of screen time, and allows me to focus when it matters.
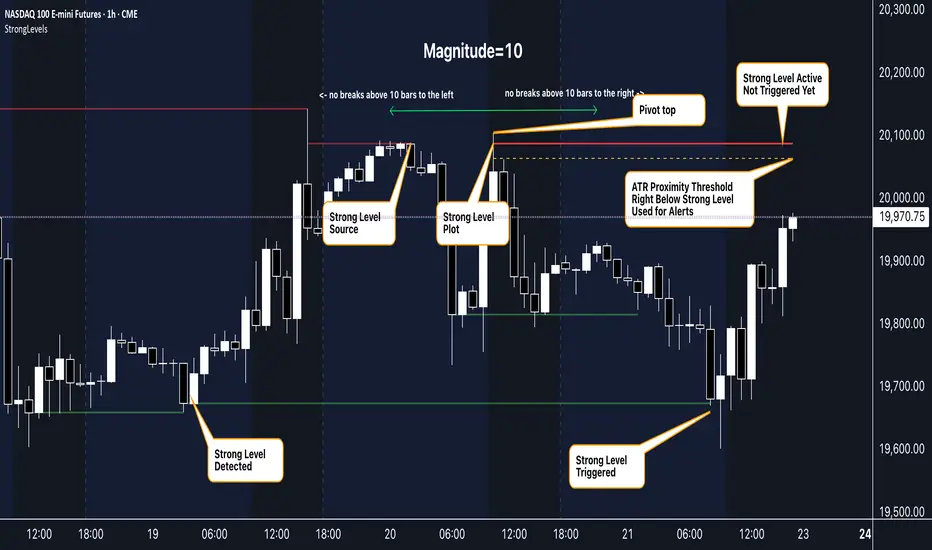
Price and Longitude Angles Planetary Price & Longitude Angles Indicator
This indicator plots planetary price and longitude angles starting from a user-selected date and time, offering a distinctive lens to explore the relationship between price and planetary timing. It supports both heliocentric and geocentric, enabling flexible and in-depth planetary analysis. The angles can be plotted across any time frame for maximum versatility.
How to Use
Once the indicator is loaded, you’ll be prompted to select a starting date and time for your analysis. From there, customize it as follows:
Select Planetary Options:
To plot the price and longitude for a single planet, choose the same planet in both dropdown menus.
To plot the average of two planets, select a different planet in each dropdown.
Set the Price Per Degree of Longitude: Adjust this value to define the scaling of the planetary angles relative to price.
Customize Fan Settings:
Toggle the mirroring of the fan on or off based on your needs.
Show or hide specific angle divisions to tailor the display to your preferences.
Display or conceal the information label that indicates the price per longitude and the number of degrees traveled.
This indicator is inspired by the methodologies of W.D. Gann and Patrick Mikula, expanding on concepts from Gann Scientific Method Unveiled, Volume 2. It was built using Astrolib by @BarefootJoey
I crafted this tool through dedication to support my own study of these ideas. I’m sharing it open-source not only to deepen my understanding and honor the work of Gann and Mikula, but also to invite collaboration. There’s always room for improvement—whether in functionality, accuracy, or design—and I hope others will join me in refining it. This is for those like me: eager to explore these concepts but lacking tools to experiment with. Let’s build on it together.
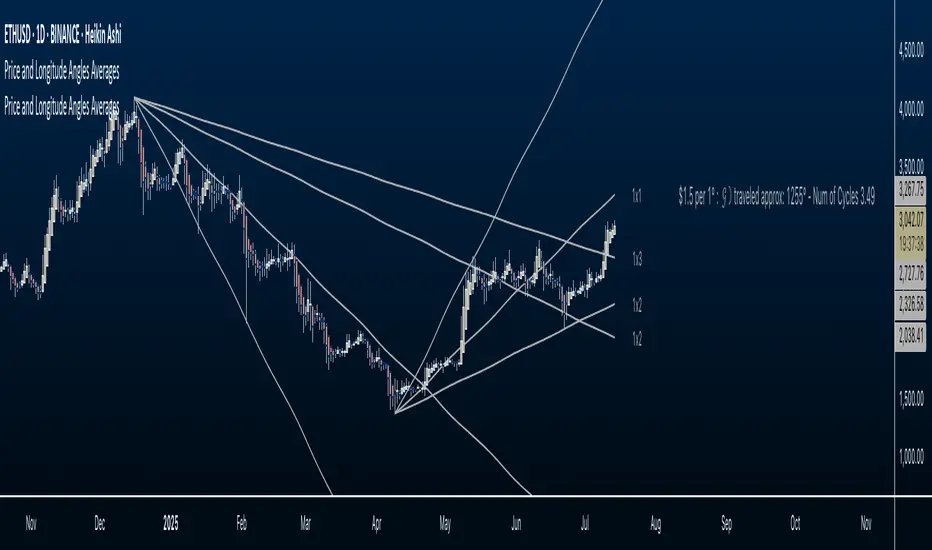
MTF Signal XpertMTF Signal Xpert – Detailed Description
Overview:
MTF Signal Xpert is a proprietary, open‑source trading signal indicator that fuses multiple technical analysis methods into one cohesive strategy. Developed after rigorous backtesting and extensive research, this advanced tool is designed to deliver clear BUY and SELL signals by analyzing trend, momentum, and volatility across various timeframes. Its integrated approach not only enhances signal reliability but also incorporates dynamic risk management, helping traders protect their capital while navigating complex market conditions.
Detailed Explanation of How It Works:
Trend Detection via Moving Averages
Dual Moving Averages:
MTF Signal Xpert computes two moving averages—a fast MA and a slow MA—with the flexibility to choose from Simple (SMA), Exponential (EMA), or Hull (HMA) methods. This dual-MA system helps identify the prevailing market trend by contrasting short-term momentum with longer-term trends.
Crossover Logic:
A BUY signal is initiated when the fast MA crosses above the slow MA, coupled with the condition that the current price is above the lower Bollinger Band. This suggests that the market may be emerging from a lower price region. Conversely, a SELL signal is generated when the fast MA crosses below the slow MA and the price is below the upper Bollinger Band, indicating potential bearish pressure.
Recent Crossover Confirmation:
To ensure that signals reflect current market dynamics, the script tracks the number of bars since the moving average crossover event. Only crossovers that occur within a user-defined “candle confirmation” period are considered, which helps filter out outdated signals and improves overall signal accuracy.
Volatility and Price Extremes with Bollinger Bands
Calculation of Bands:
Bollinger Bands are calculated using a 20‑period simple moving average as the central basis, with the upper and lower bands derived from a standard deviation multiplier. This creates dynamic boundaries that adjust according to recent market volatility.
Signal Reinforcement:
For BUY signals, the condition that the price is above the lower Bollinger Band suggests an undervalued market condition, while for SELL signals, the price falling below the upper Bollinger Band reinforces the bearish bias. This volatility context adds depth to the moving average crossover signals.
Momentum Confirmation Using Multiple Oscillators
RSI (Relative Strength Index):
The RSI is computed over 14 periods to determine if the market is in an overbought or oversold state. Only readings within an optimal range (defined by user inputs) validate the signal, ensuring that entries are made during balanced conditions.
MACD (Moving Average Convergence Divergence):
The MACD line is compared with its signal line to assess momentum. A bullish scenario is confirmed when the MACD line is above the signal line, while a bearish scenario is indicated when it is below, thus adding another layer of confirmation.
Awesome Oscillator (AO):
The AO measures the difference between short-term and long-term simple moving averages of the median price. Positive AO values support BUY signals, while negative values back SELL signals, offering additional momentum insight.
ADX (Average Directional Index):
The ADX quantifies trend strength. MTF Signal Xpert only considers signals when the ADX value exceeds a specified threshold, ensuring that trades are taken in strongly trending markets.
Optional Stochastic Oscillator:
An optional stochastic oscillator filter can be enabled to further refine signals. It checks for overbought conditions (supporting SELL signals) or oversold conditions (supporting BUY signals), thus reducing ambiguity.
Multi-Timeframe Verification
Higher Timeframe Filter:
To align short-term signals with broader market trends, the script calculates an EMA on a higher timeframe as specified by the user. This multi-timeframe approach helps ensure that signals on the primary chart are consistent with the overall trend, thereby reducing false signals.
Dynamic Risk Management with ATR
ATR-Based Calculations:
The Average True Range (ATR) is used to measure current market volatility. This value is multiplied by a user-defined factor to dynamically determine stop loss (SL) and take profit (TP) levels, adapting to changing market conditions.
Visual SL/TP Markers:
The calculated SL and TP levels are plotted on the chart as distinct colored dots, enabling traders to quickly identify recommended exit points.
Optional Trailing Stop:
An optional trailing stop feature is available, which adjusts the stop loss as the trade moves favorably, helping to lock in profits while protecting against sudden reversals.
Risk/Reward Ratio Calculation:
MTF Signal Xpert computes a risk/reward ratio based on the dynamic SL and TP levels. This quantitative measure allows traders to assess whether the potential reward justifies the risk associated with a trade.
Condition Weighting and Signal Scoring
Binary Condition Checks:
Each technical condition—ranging from moving average crossovers, Bollinger Band positioning, and RSI range to MACD, AO, ADX, and volume filters—is assigned a binary score (1 if met, 0 if not).
Cumulative Scoring:
These individual scores are summed to generate cumulative bullish and bearish scores, quantifying the overall strength of the signal and providing traders with an objective measure of its viability.
Detailed Signal Explanation:
A comprehensive explanation string is generated, outlining which conditions contributed to the current BUY or SELL signal. This explanation is displayed on an on‑chart dashboard, offering transparency and clarity into the signal generation process.
On-Chart Visualizations and Debug Information
Chart Elements:
The indicator plots all key components—moving averages, Bollinger Bands, SL and TP markers—directly on the chart, providing a clear visual framework for understanding market conditions.
Combined Dashboard:
A dedicated dashboard displays key metrics such as RSI, ADX, and the bullish/bearish scores, alongside a detailed explanation of the current signal. This consolidated view allows traders to quickly grasp the underlying logic.
Debug Table (Optional):
For advanced users, an optional debug table is available. This table breaks down each individual condition, indicating which criteria were met or not met, thus aiding in further analysis and strategy refinement.
Mashup Justification and Originality
MTF Signal Xpert is more than just an aggregation of existing indicators—it is an original synthesis designed to address real-world trading complexities. Here’s how its components work together:
Integrated Trend, Volatility, and Momentum Analysis:
By combining moving averages, Bollinger Bands, and multiple oscillators (RSI, MACD, AO, ADX, and an optional stochastic), the indicator captures diverse market dynamics. Each component reinforces the others, reducing noise and filtering out false signals.
Multi-Timeframe Analysis:
The inclusion of a higher timeframe filter aligns short-term signals with longer-term trends, enhancing overall reliability and reducing the potential for contradictory signals.
Adaptive Risk Management:
Dynamic stop loss and take profit levels, determined using ATR, ensure that the risk management strategy adapts to current market conditions. The optional trailing stop further refines this approach, protecting profits as the market evolves.
Quantitative Signal Scoring:
The condition weighting system provides an objective measure of signal strength, giving traders clear insight into how each technical component contributes to the final decision.
How to Use MTF Signal Xpert:
Input Customization:
Adjust the moving average type and period settings, ATR multipliers, and oscillator thresholds to align with your trading style and the specific market conditions.
Enable or disable the optional stochastic oscillator and trailing stop based on your preference.
Interpreting the Signals:
When a BUY or SELL signal appears, refer to the on‑chart dashboard, which displays key metrics (e.g., RSI, ADX, bullish/bearish scores) along with a detailed breakdown of the conditions that triggered the signal.
Review the SL and TP markers on the chart to understand the associated risk/reward setup.
Risk Management:
Use the dynamically calculated stop loss and take profit levels as guidelines for setting your exit points.
Evaluate the provided risk/reward ratio to ensure that the potential reward justifies the risk before entering a trade.
Debugging and Verification:
Advanced users can enable the debug table to see a condition-by-condition breakdown of the signal generation process, helping refine the strategy and deepen understanding of market dynamics.
Disclaimer:
MTF Signal Xpert is intended for educational and analytical purposes only. Although it is based on robust technical analysis methods and has undergone extensive backtesting, past performance is not indicative of future results. Traders should employ proper risk management and adjust the settings to suit their financial circumstances and risk tolerance.
MTF Signal Xpert represents a comprehensive, original approach to trading signal generation. By blending trend detection, volatility assessment, momentum analysis, multi-timeframe alignment, and adaptive risk management into one integrated system, it provides traders with actionable signals and the transparency needed to understand the logic behind them.

Waldo Momentum Cloud Bollinger Bands (WMCBB)
Title: Waldo Momentum Cloud Bollinger Bands (WMCBB)
Description:
Introducing the "Waldo Momentum Cloud Bollinger Bands (WMCBB)," an innovative trading tool crafted for those who aim to deepen their market analysis by merging two dynamic technical indicators: Dynamic RSI Bollinger Bands and the Waldo Cloud.
What is this Indicator?
WMCBB integrates the volatility-based traditional Bollinger Bands with a momentum-sensitive approach through the Relative Strength Index (RSI). Here’s how it works:
Dynamic RSI Bollinger Bands: These bands dynamically adjust according to the RSI, which tracks the momentum of price movements. By scaling the RSI to align with price levels, we generate bands that not only reflect market volatility but also the underlying momentum, offering a refined view of overbought and oversold conditions.
Waldo Cloud: This feature adds a layer of traditional Bollinger Bands, visualized as a 'cloud' on your chart. It employs standard Bollinger Band methodology but enhances it with additional moving average layers to better define market trends.
The cloud's color changes dynamically based on various market conditions, providing visual signals for trend direction and potential trend reversals.
Why Combine These Indicators?
Combining Dynamic RSI Bollinger Bands with the Waldo Cloud in WMCBB aims to:
Enhance Trend Identification: The Waldo Cloud's color-coded system aids in recognizing the overarching market trend, while the Dynamic RSI Bands give insights into momentum changes within that trend, offering a comprehensive view.
Improve Volatility and Momentum Analysis: While traditional Bollinger Bands measure market volatility, integrating RSI adds a layer of momentum analysis, potentially leading to more accurate trading signals.
Visual Clarity: The unified color scheme for both sets of bands, which changes according to RSI levels, moving average crossovers, and price positioning, simplifies the process of gauging market sentiment at a glance.
Customization: Users have the option to toggle the visibility of moving averages (MA) through the settings, allowing for tailored analysis based on individual trading strategies.
Usage:
Utilize WMCBB to identify potential trend shifts by observing price interactions with the dynamic bands or changes in the Waldo Cloud's color.
Watch for divergences between price movements and RSI to forecast potential market reversals or continuations.
This combination shines in sideways markets where traditional indicators might fall short, as it provides additional context through RSI momentum analysis.
Settings:
Customize parameters for both the Dynamic RSI and Waldo Cloud Bollinger Bands, including the calculation source, standard deviation factors, and moving average lengths.
WMCBB is perfect for traders seeking to enhance their market analysis through the synergy of momentum and volatility, all while maintaining visual simplicity. Trade with greater insight using the Waldo Momentum Cloud Bollinger Bands!
