Donchian DipThe Donchian Dip
This strategy is designed to look for good "Buy the Dip" entries on stocks that are clearly in a strong 1-year upward trend. If you do not know how to identify those stocks on your own please do not use this system or continue your education until you do. The Donchian Dip strategy was designed on the daily time frame but works amazingly well on both daily and weekly timeframes. It does still work on intraday charts also if the current trend on the daily chart is in a strong uptrend.
Chart Setup:
3-period Donchian Channel with a 1-period offset (hide basis)
Bollinger Bands with the default settings of 20/2 (display basis)
Entry Signals:
There are 3 different entry signals that will be printed on the chart that have similar underlying criteria but are ranked based on skill level just like ski slope skill levels! I recommend only taking green entries until you are familiar with the system and the stocks you are trading.
Green Easy Entry:
This is the safest buy the dip entry that is normally found at or near a large retracement bottom. You might get one or two bad entries but be persistent and eventually, a great entry will present itself!
These are the specifics for the conditions that trigger a Green entry if you want to know what they are:
1. The current bar is an up bar (green or white bar) and closed above the lower Donchian channel
2. Previous bar or 2 bars back closed below the lower Donchian channel
3. Previous bar or 2 bars back closed below the Bollinger Band Basis (20 SMA )
4. The low of the previous bar or 2 bars back was below the lower Bollinger Band
Blue Intermediate Entry:
This is a decent entry if you missed the green entry, want to add to an existing position, or are not sure it will pull back far enough to even give a green entry. I would suggest only trade these entries to add to an existing pyramid position or get back into a trade that you were recently stopped out of. However, on high-flying stocks like TSLA these signals and the Black Diamond entry signals might be the only ones you get for a long time. Also, on the weekly chart, Blue or Black entries are sometimes all you will get for a year or more.
These are the specifics for the conditions that trigger a Blue entry if you want to know what they are:
1. The current bar is an up bar (green or white bar) and closed above the lower Donchian channel
2. Previous bar or 2 bars back closed below the lower Donchian channel
3. Previous bar or 2 bars back closed below the Bollinger Band Basis (20 SMA )
Black Diamond Advanced Rule:
This is normally just a small pullback re-entry signal on a strong trending stock like TSLA ...trade with extreme caution!!! You have been warned but daredevils feel free to give it a shot. I sometimes do trade these entries if the market and sector of the stock I am trading are extremely bullish or if I am looking to add to a position but I use a conservative stop.
These are the specifics for the conditions that trigger a Black entry if you want to know what they are:
1. The current bar is an up bar (green or white bar) and closed above the lower Donchian channel
2. Previous bar or 2 bars back closed below the lower Donchian channel
3. Previous bar or 2 bars back closed above the Bollinger Band Basis (20 SMA )
Exit Criteria:
The goal of this strategy is to buy the dip and hold as long as possible...let's practice some Paytience and exercise those holding muscles! RLT!!!
So, we don't want to exit early but we also want to protect our profits somehow. We do this by using the built-in trailing stops that are defined by dots of three different shades of purple on the chart (feel free to change these in the settings). Simply move your trailing stop to the highest current dot price level. Do not move the trailing stop down ever even if a lower dot is printed later. These are simply the suggested trailing stops and definitely use your own judgment for exits but if you backtest this strategy enough you will most likely discover that in the long run, these trailing stops work really well.
I hope this strategy helps you to identify good "Buy the Dip" entries on stocks you love as well as trains you to hold your winners longer for bigger gains.
***HOW TO ADD TO YOUR CHARTS***
1) Click the "Add to Favorite Scripts" button
2) Go to a stock chart and click the "Indicators" icon at the top
3) Next, on the left, click the "Favorites" and then click the "Naked Put - Growth Indicator v2"
4) It should appear on your charts, and you can click the "gear" icon on the study to edit a few settings.
5) Read the release notes above so you understand how it works.
Поиск скриптов по запросу "donchian"

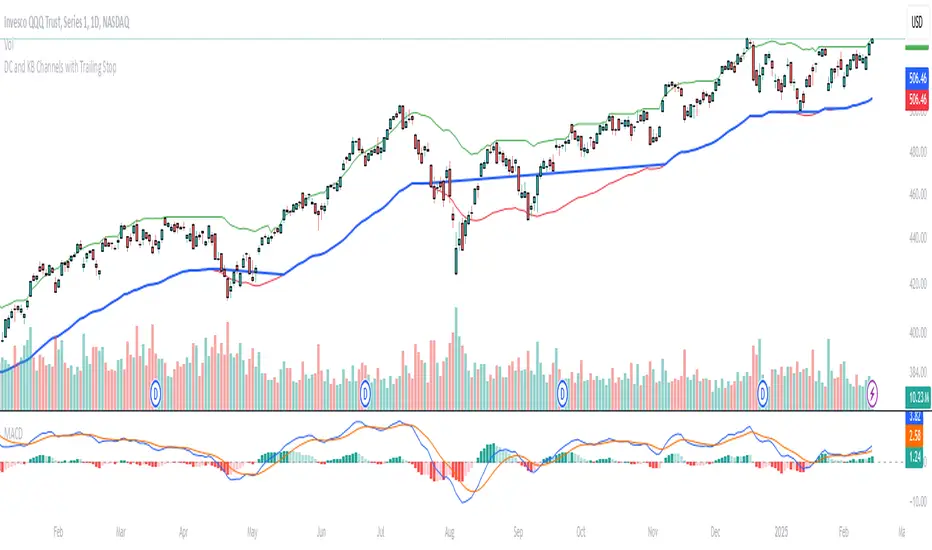
Donchian and Keltner Channels Trend Following with Trailing StopLong Only Trend-following model based on Keltner Channels and Donchian Channels.
These indicators include a noise region, which allows prices to oscillate without requiring position adjustments.
When price trades above the upper band, it signals strength; when it trades below the lower band, it signals weakness.
Keltner Channels
Keltner Channels are volatility-based envelopes set above and below an exponential moving average. Keltner Channels use the Average True Range (ATR), which measures daily volatility, to set channel distance.
Donchian Channel
Donchian Channels are are used to identify market trends and volatility. The upper and lower bands are based on the highest high and lowest low of a specified period. When the price moves above the upper band, it indicates a bullish breakout, while a
move below the lower band indicates a bearish breakout. The distance between the upper and lower channel of the Donchian Channel indicates the asset’s volatility.
Trend Following Model
The default settings are:
Upper Keltner and Upper Donchian Channel Length : 20
Lower Keltner and Lower Donchian Channel Length : 40
Keltner ATR Multiplier: 2
Entries, Exits and Trailing Stop
Entry : When price exceeds the upper band of at least one of these indicators.
Exit : When price undercuts the lower band of at least one of these indicators.
Trailing Stop : See below.
Trailing Stop
This is a stop-loss order that moves with the price of the underlying. It is designed to “trail” the price up (in the case of a long position) or down (for a short position), locking in profits as the price moves in a favorable direction.
At the end of day t, there was a Trailing Stop level in place. For the next day (day t + 1), the Trailing Stop will be adjusted. The new Trailing Stop will be the higher of two values:
The Trailing Stop from the previous day (day t).
The Lower Band computed at the end of day t + 1.
Donchian Zig-Zag [LuxAlgo]The following indicator returns a line bouncing of the extremities of a Donchian channel, with the aim of replicating a "zig-zag" indicator. The indicator can both be lagging or lagging depending on the settings user uses.
Various extended lines are displayed in order to see if the peaks and troughs made by the Donchian zig-zag can act as potential support/resistance lines.
User Settings
Length : Period of the Donchian channel indicator, higher values will return fewer changes of directions from the zig-zag line
Bounce Speed : Determine the speed of bounces made by the zig-zag line, with higher values making the zig-zag line converge faster toward the extremities of the Donchian channel.
Gradient : Determine whether to use a gradient to color the area between each Donchian channel extremities, "On" by default.
Transparency : Transparency of the area between each Donchian channel extremities.
Usage
It is clear that this is not a very common indicator to see, as such usages can be limited and very hypothetical. Nonetheless, when a bounce speed value of 1 is used, the zig-zag line will have the tendency to lag behind the price, and as such can provides crosses with the prices which can provide potential entries.
The advantage of this approach against most indicators relying on crosses with the price is that the linear nature of the indicator allows avoiding retracements, thus potentially holding a position for the entirety of the trend.
Altho this indicator would not necessarily be the most adapted to this kind of usage.
When using a bounce speed superior to 1, we can see the predictive aspects of the indicator:
We can link the peaks/troughs made by the zig-zag with the precedent ones made to get potential support and resistance lines, while such a method is not necessarily accurate it still allows for an additional to interpret the indicator.
Conclusions
We presented an indicator aiming to replicate the behaviour of a zig-zag indicator. While somehow experimental, it has the benefits of being innovative and might inspire users in one way or another.

Donchian Breakout Strategy📈 Donchian Breakout Strategy (Inspired by Way of the Turtle)
This strategy is a modern adaptation of the legendary Turtle Trading system as taught in Way of the Turtle by Curtis Faith — re-engineered for the crypto market’s volatility, 24/7 nature, and frequent fakeouts.
⸻
🐢 Original Inspiration
The original Turtle system, created by Richard Dennis and William Eckhardt, used:
• Breakouts of Donchian Channels (20-day for entry, 10-day for exit)
• Volatility-based position sizing using ATR (N)
• Simple rules, big trend exposure, and pyramiding to grow winners
It was built for futures and commodities, trading daily bars, assuming stable trading hours and regulated markets.
⸻
🚀 What’s Different in This Strategy?
✅ Optimized for Crypto
• Adapts to constant volatility and price manipulation common in crypto
• Adds commission modeling for realistic results (0.045% default)
✅ Improved Entry Filtering
• Uses EMA filter to align with trend direction
• Adds RSI momentum check to avoid early or weak breakouts
• Optional volatility and volume filters to reduce false signals
✅ Smarter Exits
• ATR-based volatility stop loss, not just Donchian reversal
• Avoids pyramiding to reduce risk from sudden reversals
✅ Backtest-Friendly
• Default backtest window starts from 2025-01-01
• Fully configurable: long/short toggle, filter control, stop loss multiplier
⸻
🧪 Use Case
• Best on trending coins with strong directional moves
• Avoids chop via filters, preserving capital
• Can be tuned for aggressive or conservative setups with just a few tweaks

Donchian Channel Oscillator (DonOsc) Preface
DonOsc stands for Donchian Channel Oscillator. This channel envelopes all prices, so if you set the height of the channel to 100 percent, you can plot the prices as percent in between, creating this sub-pane oscillator. For clarity the example chart shows a Donchian channel in the main-pane with the same look-back as the DonOsc, this way you can see how both are related.
Price River
Not only the close is plotted, but also the high and the low of the bar. Thus you get a structure that can be associated with a river, streaming from left to right, in which the price moves between the left bank (i.e. the plotted highs) and the right bank (i.e. the plotted lows), which meanders between the high border (100%) and the low border (0%) of the oscillator. The surface of the price river is gray. The price line is blue when up and dark red when down. The river has also color patches dark red, light red, blue and aqua. Stochastic patches; up: aqua, down: light red
If you look at the price river, you may notice that the price line is closer to the left bank (highs) when moving up and to the right bank (lows) when moving down. Because this phenomenon is used in the stochastic indicator, I named these stochastic patches. These are depicted on the wide side for visibility, so the aqua patches are to the right of the price line and the light-red patches to the left.
Widening patches; up: blue, down: red
If you look at tops or bottoms in bar charts, you may notice that long bars (wide range) tend to be there. You may say that prices turn with a ‘range bang’. This causes a widening of the price river, depicted as a patch on the wide side.
Channel Features
High (76.4 %) and low (23.6 %) Fibonacci levels.
In the oscillator there is no need to calculate Fibonacci levels, we can just plot them. If the price is above 50% the low level is shown with a green color, when below the high level with a pink color. When the price river crosses a level a ‘near border’ highlighter will flash, lime near the high border and orange near the low one.
New high and new low markers.
A flaw in the oscillator is that is doesn’t show actual new lows and new highs in the Donchian Channel, because everything is made relative. This is ‘repaired’ by adding markers, dark red for new low depicted between the high fib and border, blue for new high depicted between low fib and border. Used are the same colors as in the widening patches, because new highs and lows also lead to widening of the actual Channel.
Uptrend and downtrend highlighters.
If in the actual Channel the bars run in the upper half, an uptrend is happening as long as these remain there, a downtrend when the bars remain in the lower half. In the oscillator a yellow highlighter flashes when the price is higher than 50%, a red highlighter below 50%.
Interpretation of the DonOsc
This sub-pane indicator provides a wealth of useful information about what is going on in the market. First of all you immediately see whether there is an up or down trend and whether these lead to new highs or lows. Second of all you can estimate the importance of price movements in the context of the look-back period. Thirdly the width of the price river reveals the emotions in the market. The higher the emotions run, the more risk is involved in a postilion in the charted instrument.
Settings of the DonOsc
Look-back settings.
By default the script sets the look-back, depending on the time frame. This overrules the standard manual setting. If you switch this off, the manual setting will work. A feed-back label can by shown which informs about the current setting.
Smoothing
This concerns the price river. Default is 2, if you increase this setting, the river will loose its touch with the channel borders. O.t.o.h. the river wil be wider and better visible. Maximum setting is 5.
Colors
The momentum colors set both the river widening patches and new high and low markers.
Take care, Eykpunter.

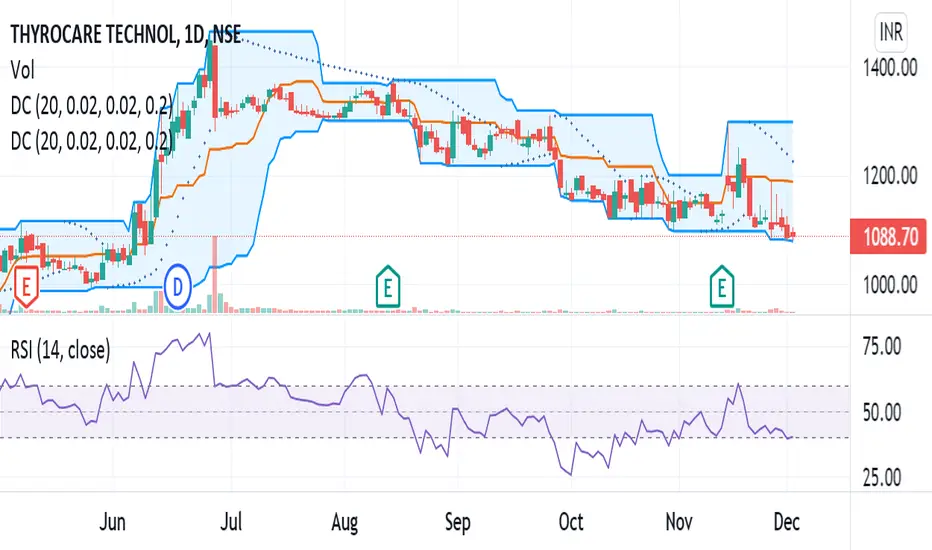
Donchian Channels+Standard Donchian Channels, this includes a Trend EMA which can be configured and the channels will use to give buy and sell signals. The channels are also colored in such a way to indicate a trend reversals. My favorite part that sets this apart from others is, if using the bClose option (which I recommend you do) the trend will not reverse until there is a close above/below the previous channel high/low. i.e. a reversal into an uptrend requires the current bar to close above the previous upper channel rather than just a new high.
The coloring of the current trend allows for a quick read of current market conditions and I use this on any timeframe across all forms of charts (forex stock, futures , crypto, etc). When taking one of the signals I use the opposite channel as the stop loss (when buying use bottom, and selling use top channel)
Update 1:
- Added my name to the code
- Updated the picture to show off the indicator better
- Raised the brightness of the fill color a bit, looks nicer I think
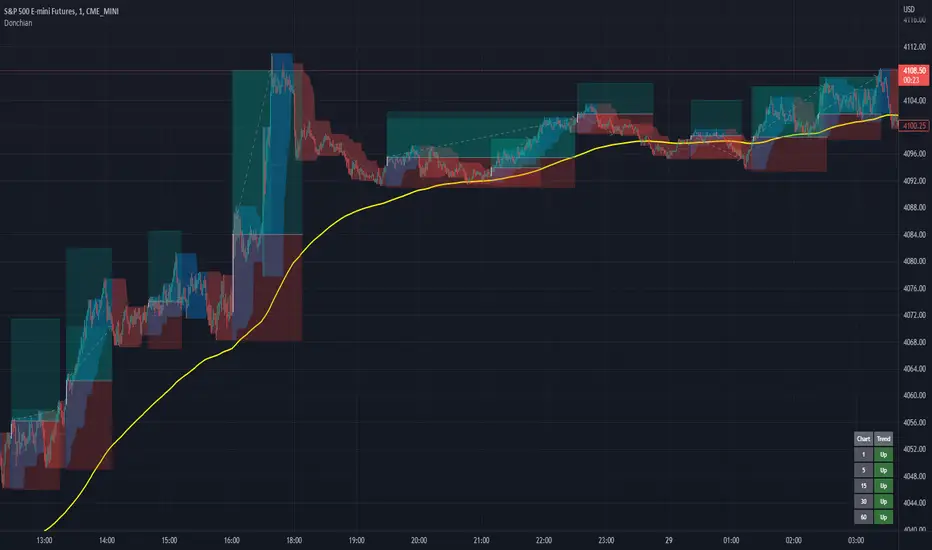
As a warning: I have obviously hand picked this picture to really show off this indicator's power to work in a trending market. Donchian Channels are a trending indicator and work best in trending markets with decent pull backs. If there are multiple signals going in each direction, it is a choppy market and you should stay out until it starts trending again. I generally use a 1:1.5 risk to reward ratio but sometimes will stretch it to 1:2 if it is a nice trade and I feel the market is in my favor as you can see from the trades placed in the picture (and I use that method for any commodity / chart and timeframe). I use the close of the white candle and then (since they are trades going short) I use the upper Donchian Channel as my stop loss.
I personally like to have the lines and labels turned off and enable all other options. Labels are just there to really stand out so you don't miss the white candle indication for a trade. OH! Also, I've had comments from friends that the white candles are hard to see, I turn off my candle borders in settings; makes it super easy to see them then. I turn lines off as the fill does the job well enough and it seems cleaner in my eyes.
If you'd like to see this picture on your chart, it is Micro E-Mini S&P 500 Futures from July 10, 2022 @ 18:00 on the 1-min chart.
just now
Update 2:
- Added day trading time highlights
- Added ranging market indicator (This I'm still working on so use at your own discretion, it's intended purpose is to tell when the Donchian Channels are not going to give great signals and to use a ranging indicator instead)
- Added multi-timeframe trend screener (handy if you want to quickly see the trend direction (based on the Trend EMA you set) of several time frames without having to change charts). It will draw in the bottom right of the chart.
+ Donchian ChannelsThis version of Donchian Channels uses two source options so that one can create a channel using highs and lows rather than one or the other or closes. My thinking was that this would create a more accurate portrayal of price action (or at least contain the greatest scope of it) as seen through the lens of a Donchian Channel. This was actually part of the genesis of my idea around my Ultimate Moving Average.
Besides the single top and bottom plot for the DC's extremities, I've enabled the ability to create outer bands with a variable width that the user can adjust to their preference. I think it's quite nice. I use it in the DC in my other non-overlay indicators.
Besides this additional functionality, the indicator has options to plot lines between the basis and the upper and lower bands, so, basically, splitting the upper and lower channel in half.
There is no magic number to the lookback. I chose 233 as default because it's a fibonacci sequence number and I'm more interested in using the DC like a very long period bias indicator, and the longer lookback gives a much wider window (because highs and lows are so spread apart) with which other faster indicators (supertrend, shorter period moving averages, etc.) can work without making the screen a clutter.
The color of the basis may also be made relevant to higher timeframe information. What I mean by this is that you can set it so that the basis of the current timeframe is colored based on the candle close of the higher timeframe of your choosing. If you're looking at an hourly chart, and you set the color to Daily, the basis will be colored based on the candle close (above or below the basis) of the previous day. If the previous daily close was above the basis, that positive color will be reflected in the basis, even if the current hourly candle closes are below the hourly basis. This could potentially be useful for setting a higher timeframe directional bias and reacting off price crossing the lower timeframe basis (or whatever your trigger for entering a trade might be). This is also optional in my Ultimate Moving Average indicator.
You can also set the entire indicator to whatever time frame you want if you want to see where the actual basis, or other levels are on that higher timeframe.
Further additions include fibonacci retracement levels. These are calculated off the high and the low of the Donchian Channels themselves.
You will see that there are only three retracement levels (.786, .705, .382), one of which is not a fib level, but what some people call the 'OTE,' or optimal trade entry. If you want more info on the OTE just web search it. So, why no .618 or .236? Reason being that the .618 overlaps the .382, and the .236 is extremely close to the .786. This sounds confusing, but the retracement levels I'm using are derived from the high and low, so it was unnecessary to have all five levels from each. I could have just calculated from the high, or just from the low, and used all the levels, but I chose to just calculate three levels from the high and three from the low because that gives a sort of mirror image balance, and that appeals to me, and the utility of the indicator is the same.
The plot lines are all colored, and I've filled certain zones between them. There is a center zone filled between both .382 levels, and an upper and lower zone filled between the .786 and either the high or the low.
If you like the colored zones, but don't like the plots because they cause screen compression, turn off the plots under the "style" tab.
There are alerts for candle closes across every line.
I should state that, regarding the fibs, obviously the length of the Channels is going to affect to what levels price retraces to. A shorter lookback means you will see more changes in highs and lows, and therefore retraces are often going to be full retraces within the bands unless price is trending hard. A longer lookback means you will see smaller retraces. Using this in conjunction with key high timeframe levels and/or a moving average can give great confidence in a trade entry. Additionally, if you have a short bias it may help in finding levels or entering a trade on a pullback. It could also be good for trade targets. But again, the lookback you choose for this indicator is going to dictate its use in the system you're building or already have. A 9 EMA and a 200 EMA, while fundamentally the same, are going to be used somewhat differently while doing your chart analysis.
Additional images below.
Same image as main, but with supertrend and my +UMA to help with chart analysis.
Image with the fib stuff turned on.
Zoomed out image with the same.
Shorter lookback period.
Zoomed in image of shorter lookback.

Double Donchian, Double Keltner, no-overlayThis is rather an educational script on how you can put multiple channels on the chart in a relatively non-confusing manner. Because it can be done doesn't mean you should do it (especially as a beginner). However, you might want to use maybe two.
Normally, TradingView would put them all over each other causing chart to lose readability. By a few clever conditions, higher timeframe KC does draw on the chart only if it is outside lower timeframe KC. Lower timeframe Donchian is 99,5% outside both Keltner Channels, and it will not show if it overlaps at any point. Higher TF Donchian ale two lines but no background.
Keltner channel 1 uses original settings
Keltner channel 2 uses TradingView default settings
Donchian 1 uses TradingView default
Donchian 2 uses 60 periods used by Turtles if I remember it correct
Have a great trade!

Donchian Trend SignalsThe Donchian Trend Signals is an indicator developed to help traders identify the current trend direction and potential liquidity grabs.
The usage of the indicator is very simple, on the chart you'll see a modified version of the classic and popular Donchian channel, calculated using the closing prices, that changes the color of the average middle line to indicate the direction of the current trend. The indicator also colors the candlestick.
Using the option "Complex Mode" will give your indicator additional data by changing the calculation method. These changes make the lines become the average between different lengths of the same Donchian channel formula.
Additionally, the indicator plots on the chart some buy or sell signals, displayed as diamonds above or below the candles. The signals are calculated to find potential liquidity grabs using the wicks, the true range of the candles, and the volume compared to his average value.

Donchian Channels Trending Breakout StrategyThis script looks for two entry signals. Long is when the previous breakout of the donchian channels was a low, price is above the input EMA, current price is equal or higher than the upper band and we're not in a position yet. Short is the other way around, so previous breakout of the donchian channels was a high, price is below the input EMA, current price is equal or lower than the lower band.
I haven't found a script that does take the previous highs and lows into consideration. Works for any markets in any conditions because the stop loss and profit targets are based on the upper and lower band of the donchian channels, which means the stop loss and profit targets move with the trend.
For more details see the script itself, I wrote a ton of comments.

Donchian Quest Research// =================================
Trend following strategy.
// =================================
Strategy uses two channels. One channel - for opening trades. Second channel - for closing.
Channel is similar to Donchian channel, but uses Close prices (not High/Low). That helps don't react to wicks of volatile candles (“stop hunting”). In most cases openings occur earlier than in Donchian channel. Closings occur only for real breakout.
// =================================
Strategy waits for beginning of trend - when price breakout of channel. Default length of both channels = 50 candles.
Conditions of trading:
- Open Long: If last Close = max Close for 50 closes.
- Close Long: If last Close = min Close for 50 closes.
- Open Short: If last Close = min Close for 50 closes.
- Close Short: If last Close = max Close for 50 closes.
// =================================
Color of lines:
- black - channel for opening trade.
- red - channel for closing trade.
- yellow - entry price.
- fuchsia - stoploss and breakeven.
- vertical green - go Long.
- vertical red - go Short.
- vertical gray - close in end, don't trade anymore.
// =================================
Order size calculated with ATR and volatility.
You can't trade 1 contract in BTC and 1 contract in XRP - for example. They have different price and volatility, so 1 contract BTC not equal 1 contract XRP.
Script uses universal calculation for every market. It is based on:
- Risk - USD sum you ready to loss in one trade. It calculated as percent of Equity.
- ATR indicator - measurement of volatility.
With default setting your stoploss = 0.5 percent of equity:
- If initial capital is 1000 USD and used parameter "Permit stop" - loss will be 5 USD (0.5 % of equity).
- If your Equity rises to 2000 USD and used parameter "Permit stop"- loss will be 10 USD (0.5 % of Equity).
// =================================
This Risk works only if you enable “Permit stop” parameter in Settings.
If this parameter disabled - strategy works as reversal strategy:
⁃ If close Long - channel border works as stoploss and momentarily go Short.
⁃ If close Short - channel border works as stoploss and momentarily go Long.
Channel borders changed dynamically. So sometime your loss will be greater than ‘Risk %’. Sometime - less than ‘Risk %’.
If this parameter enabled - maximum loss always equal to 'Risk %'. This parameter also include breakeven: if profit % = Risk %, then move stoploss to entry price.
// =================================
Like all trend following strategies - it works only in trend conditions. If no trend - slowly bleeding. There is no special additional indicator to filter trend/notrend. You need to trade every signal of strategy.
Strategy gives many losses:
⁃ 30 % of trades will close with profit.
⁃ 70 % of trades will close with loss.
⁃ But profit from 30% will be much greater than loss from 70 %.
Your task - patiently wait for it and don't use risky setting for position sizing.
// =================================
Recommended timeframe - Daily.
// =================================
Trend can vary in lengths. Selecting length of channels determine which trend you will be hunting:
⁃ 20/10 - from several days to several weeks.
⁃ 20/20 or 50/20 - from several weeks to several months.
⁃ 50/50 or 100/50 or 100/100 - from several months to several years.
// =================================
Inputs (Settings):
- Length: length of channel for trade opening/closing. You can choose 20/10, 20/20, 50/20, 50/50, 100/50, 100/100. Default value: 50/50.
- Permit Long / Permit short: Longs are most profitable for this strategy. You can disable Shorts and enable Longs only. Default value: permit all directions.
- Risk % of Equity: for position sizing used Equity percent. Don't use values greater than 5 % - it's risky. Default value: 0.5%.
⁃ ATR multiplier: this multiplier moves stoploss up or down. Big multiplier = small size of order, small profit, stoploss far from entry, low chance of stoploss. Small multiplier = big size of order, big profit, stop near entry, high chance of stoploss. Default value: 2.
- ATR length: number of candles to calculate ATR indicator. It used for order size and stoploss. Default value: 20.
- Close in end - to close active trade in the end (and don't trade anymore) or leave it open. You can see difference in Strategy Tester. Default value: don’t close.
- Permit stop: use stop or go reversal. Default value: without stop, reversal strategy.
// =================================
Properties (Settings):
- Initial capital - 1000 USD.
- Script don't uses 'Order size' - you need to change 'Risk %' in Inputs instead.
- Script don't uses 'Pyramiding'.
- 'Commission' 0.055 % and 'Slippage' 0 - this parameters are for crypto exchanges with perpetual contracts (for example Bybit). If use on other markets - set it accordingly to your exchange parameters.
// =================================
Big dataset used for chart - 'BITCOIN ALL TIME HISTORY INDEX'. It gives enough trades to understand logic of script. It have several good trends.
// =================================

Donchian Channel with Range AdditionA Donchian Channel with additional zones at places where its range is smaller than a set amount of atr. Thus it kind of combines with Keltner Channel qualities. Purpose is to set a stop loss wide enough to avoid shaking out of a position. The example chart shows a Philips day chart, where I opened position on 16 juli at 37,50 and set the stop loss at low border level 35,60, on 23 juli was an earnings rapport, the wick of the candle shows that quotes went very low, obviously smart traders had to fill a huge order and hunted for stops, triggering my stop closing the position. next days quotes went a lot better, so I missed the fun. The Donchian Channel was too narrow because quotes had ranged in the previous weeks. If I had placed my stop on the additional low, setting it 5 atr below the high border, my stop would have been safe.

Cloud Donchian + Keltner + Bollinger**XAUUSD M1 - Upper, Middle & Lower Combination Clouds**
This indicator combines three widely used volatility channels — Donchian, Keltner, and Bollinger Bands — into a single, clear cloud overlay optimized for the XAUUSD 1-minute chart.
**What it does:**
- Calculates upper, middle, and lower volatility zones by combining the three channels.
- The **Upper Cloud** shows the potential upper price boundary based on the highest highs of the combined indicators.
- The **Lower Cloud** shows the potential lower price boundary from the lowest lows of the combined indicators.
- The **Middle Cloud** fills the area between the upper cloud’s bottom and lower cloud’s top, colored dynamically: green for rising trends and red for falling trends.
- Visible lines highlight the upper and lower cloud boundaries for precise reference.
**Why it’s useful:**
- Helps traders identify support and resistance zones based on multiple volatility measures.
- The dynamic middle cloud coloring provides intuitive visual cues on trend direction and strength.
- Designed specifically for scalpers and short-term traders focused on fast-moving gold markets (XAUUSD, 1-minute timeframe).
- Fully customizable input parameters allow users to adjust channel lengths and sensitivities to fit their trading style.
**Inputs:**
- Donchian channel length
- Keltner channel EMA length and ATR multiplier
- Bollinger Bands length and multiplier
- Customizable cloud colors and line colors
**Usage notes:**
- This is a tool to support decision-making — it should be used in conjunction with other analysis techniques.
- It does not provide explicit buy or sell signals but highlights key volatility zones and trend shifts.
- Performance depends on market conditions; backtest results do not guarantee future outcomes.
- The indicator is open-source and configurable to fit individual preferences.
**Important:**
- No guaranteed profits — trade responsibly.
- Always combine this tool with sound risk management.

Donchian SARCombination of Donchian channels and sar. The donchian channels provides simple and easy data of support and resistances and SAR tells the price trend
Donchian Breakout StrategyThis strategy buys when the Donchian Channel is broken to the upside and uses the lower Donchian Channel line as a trailing stop. You can also choose to use a moving average as a filter to keep you out of trades that are counter trend.
You can also configure which dates you want to backtest, so you can see how this behaves over specific time frames and market cycles.

Donchian Channel Trend Intensity [DW]This is an experimental study designed to analyze trend intensity using two Donchian Channels.
The DCTI curve is calculated by comparing the differences between Donchian highs and lows over a major an minor period, and expressing them as a positive and negative percentage.
The curve is then smoothed with an exponential moving average to provide a signal line.
Custom bar colors included with two coloring methods to choose from.

Donchian Anchored Vwap + HandoffsIn this script I try to incorporate Brian Shannon's Anchored VWAP hand off system into an automated initial anchoring system using Donchian Highs and Lows.
I have also added an average of all the hand-off vwaps.
Higher values in "Donchain Lookback" will display longer term sentiment and vice versa.
*Credit to trader dysrupt for their 'Anchored VWAP Hand-off' script
Donchian Channels %I enjoy Donchian Channels for identifying trends. However, I hate having them on my chart. They are next to impossible to interpret at a glance. This script converts DCs to a % making a useful oscillator. The horizontal lines on the chart correspond to the Fib retracements below 50%. There are many ways to trade using this script and it works on any time frame. Moving average crosses are worth your attention, particularly, the 34 period MA (purple line). Enjoy and happy trading.
Donchian Channels (Close)This indicator shows Donchian Channels based on close prices only. Additionally, a box with the bands and the center line for the last bar can be shown.
The center line, the bands and the box can be hidden independently.
Four periods are being shown at the moment, but the indicator is easily extensible with copy and paste.

Adaptive Donchian ChannelThis is Slight modified version of Donchian channel. Only change here is, channels update only when there is breakout. If price keeps ranging within channel, it will not contract based on new highest and lowest range.
This can be used for identifying powerful breakouts post long consolidation and filter out fakeouts.
Donchian Channel StrategyLong and Short entries based on the Donchian Channel indicator. The entry can be set to Higher High/Lower Low or the basis line.

Volume Weighted Donchian ChannelsDonchian channels weighted with volume, they are now closer to the price and can cross it.

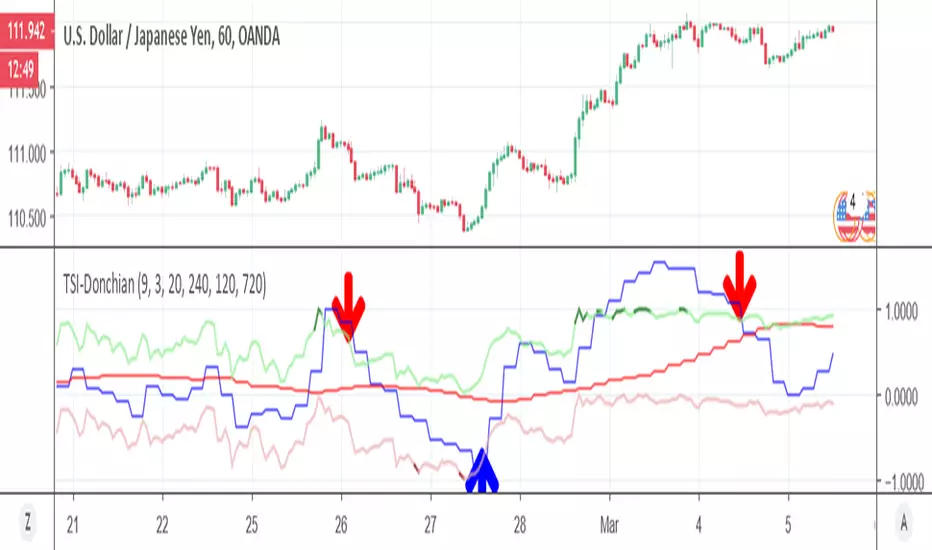
TSI-DonchianHere it a TSI with MTF function , together with Donchian high and low channel
the best entry and exit are shown in arrow