CM_Donchian Channels V5NOTE: this indicator was created by @ChrisMoody. I found it really useful, so I upgraded it from v3 to v5
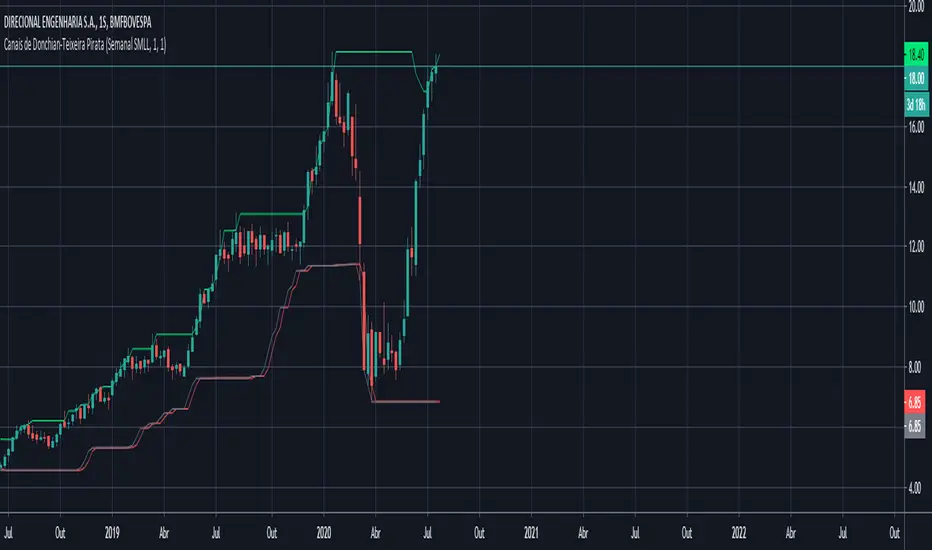
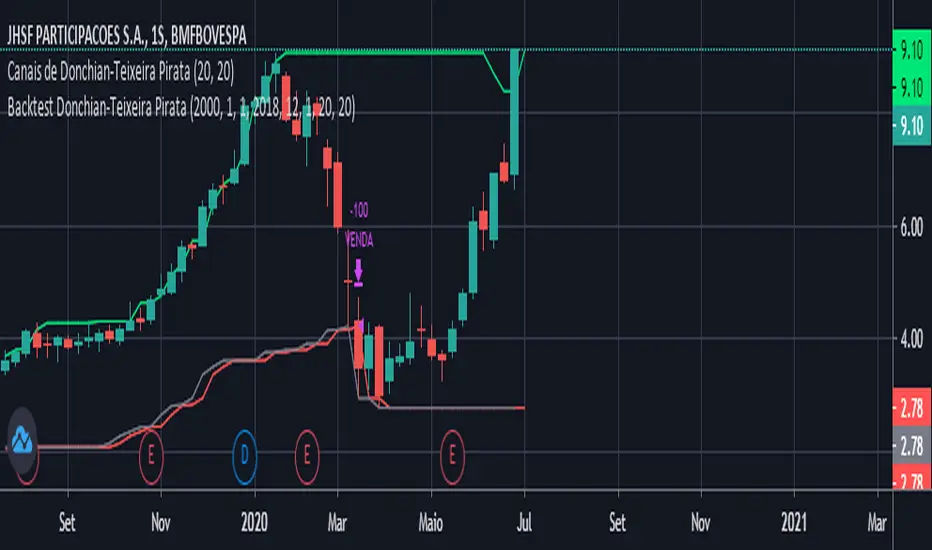
This Indicator replicates the Donchian Channels, but with Alerts Capability
You can set up an alert for when the price breaks above the upper band or when the price breaks below the lower band
It will display respectively a green upward arrow or a red downward arrow
It is possible to change the length of the Indicator
Original Post:
Индикатор Pine Script®