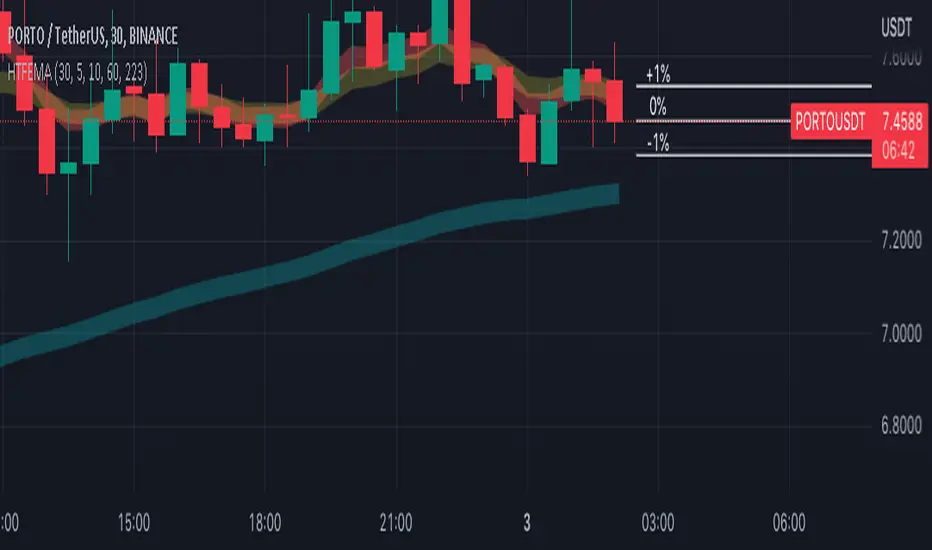
Medium EMA Cross for Binary OptionsThis is a rework of one of Chris Moody's EMA scripts, but made useful for binary options trading. The color of the indicator is the direction of the trade you should take immediately after the bar closes. This is ideal for 5 minute charts. Overlays are based on EMA crossovers. This is dead simple - green overlay = CALL, red overlay = PUT.
Поиск скриптов по запросу "ema"
9 EMA Trend-Flow StrategyThis strategy avoids trading inside the noise and waits for Bitcoin to "coil up" before exploding.
1. Chart Setup
Timeframe: 5 Minutes
Bollinger Bands: Length 20, Standard Deviation 2 (Default).
RSI (Relative Strength Index): Length 14.
EMA (Exponential Moving Average): Length 200 (Trend Filter).
2. The Rules
Long Setup (Buy)
The Trend Filter: Price must be above the 200 EMA.
The Squeeze: The Bollinger Bands must visually contract (narrow), indicating volatility is dying down.
The Trigger: A 5m candle closes strongly above the Upper Bollinger Band.
Confirmation: RSI must be rising and above 50 (but ideally not yet "pegged" at 90+).
Short Setup (Sell)
The Trend Filter: Price must be below the 200 EMA.
The Squeeze: The Bollinger Bands contract.
The Trigger: A 5m candle closes strongly below the Lower Bollinger Band.
Confirmation: RSI must be falling and below 50.
Execution Guide
Entry Technique
Don't enter immediately when the candle touches the band. Wait for the candle close.
Why? Bitcoin frequently "wicks" through bands to trap traders (fakeouts) before reversing. A solid close outside the band confirms momentum.
Exit Strategy (Take Profit)
Target 1 (Conservative): Close 50% of the position when price expands to a fixed risk-reward ratio (e.g., 1.5R).
Target 2 (Runner): Keep the remaining position open as long as price "walks the band" (stays outside or touching the outer band). Close the rest when a candle finally closes back inside the Bollinger Bands.
Stop Loss
Placement: Place your Stop Loss (SL) slightly below the Middle Band (the 20 SMA) at the time of entry.
Trailing: As the price moves in your favor, move your SL to trail the Middle Band.
EMA 5/9 Angle + Candle Strength (SL=Open, TP=RR)EMA 5 / EMA 9 cross
Cross must have ~30° angle (approximated using slope → atan)
Entry candle must be bullish/bearish and also be Normal / 2nd Most / Most based on body-size percentile
Entry = close of signal candle
SL = open of signal candle
TP = 1:2 RR (editable input)
3 EMA Crossover (Text Color Customizable) - Fixed3 Ema crossover 9/15/21
it will generate buy and sell signal on crossover.
EMA Channel EMA Channel
All EMAs in single indicator
Customizable inputs
Clean color scheme
Works for any timeframe
Ideal for trend, pullback & momentum trading
THAIT Moving Averages Tight within # ATR EMA SMA convergence
THAIT(tight) indicator is a powerful tool for identifying moving average convergence in price action. This indicator plots four user-defined moving averages (EMA or SMA). It highlights moments when the MAs converge within a user specified number of ATRs, adjusted by the 14-period ATR, signaling potential trend shifts or consolidation.
A convergence is flagged when MA1 is the maximum, the spread between MAs is tight, and the price is above MA1, excluding cases where the longest MA (MA4) is the highest. The indicator alerts and visually marks convergence zones with a shaded green background, making it ideal for traders seeking precise entry or exit points.
Santhosh VWAP + 3 EMA + Buy Sell AlertI have combined VWAP and EMA , along with this generated buy and sell alert based on ATR . Best for Scalping
Multi-Timeframe 20 EMA PackMultiple 20 EMA's, each for a different time frame but all on the same chart.
This will help you make sure that the 20EMA has been crossed on all time frames before taking action.
EMAs + Golden/Death Cross con Flechas
Emas crossing. Death Cross and Golden Cross. Emas of 50, 100, and 200. Editable. Recommended time frame: 30 minutes.
EMA 8 & 21 crossover change EMA 8 & 21 crossover change Indicator This custom TradingView indicator highlights trend shifts by changing candle colors when the 8 EMA crosses the 21 EMA. Bullish crossovers turn candles different color, while bearish crossovers turns different as well—making it easy to visually identify emerging trends and momentum shifts in real time.
HKM - Renko Emulator with EMA TrendThis is a Renko based Emulator to plot on any chart type which prints the box as printed on a Renko charts and is a Non-Repaint version. You can use either Traditional or ATR Method on current chart Timeframe. Option to plot an EMA Line is provided with Trend indication.
Adaptative EMAThis script prints different EMA if I am on a intraday timeframe or a daily or higher timeframe by using one indicator only.
It helps me to bring confluences for my price action strategy.
Smooth EMA/DEMA/TEMA/EHMA (SEMA)This is my attempt at smoothing the exponential moving average any its cousins. I literally just smoothed the source and alpha and this is what we got. I really like this because you get a nice smooth yet fast acting moving average that works better than a traditional simple moving average. This script also included directional alerts.
Smooth EMA
Smooth DEMA
Smooth TEMA
Smooth EHMA
The Hummingbird - MA Ribbon by Joe (EMA, SMA, SMMA, WMA, VWMA)Tired of having to add multiple moving average indicators to your chart? Well, stop doing that. No, really. Listen. Adding duplicate indicators is totally not cool. And, it won't go over well at the next HOA meeting if you keep doing it.
Here's the sweet moving average ribbon you've been waiting for (with 1-10 moving average lines!). It will make your charts look much cooler 😎. And you'll gain the respect of all your neighbors if you add it to your charts.
In all seriousness, this is a slimmed-down version of my other super-awesome script with a stupid name, "Joe's Ultimate MA Ribbon (w/ Crossover Triggers)."
Basically, I removed the crossover signals from it and changed the name to a much superior name, "The Hummingbird."
Yeah. Right on. So, if you don't want or need the crossover signals, go right on humming with "The Hummingbird."
Enjoy, friends. 🍻
If you still want the original ribbon with crossover signals, get it here .
Options:
Show/Hide MA Lines: Only show the lines you wanna see. No more. No less.
MA Type (can be different for each line!): EMA , SMA , SMMA (RMA), WMA , VWMA
MA Source (for each line): open, close, high, low, hl2 , hlc3, ohlc4, hlcc4
MA Length (for each line): any number between 1 and 4999
Line Colors: Ooh, pretty.
Refracted EMARefracted EMA is a price based indicator with bands that is built on moving average.
The price range between the bands directly depends on relationship of Average True Range to Moving Average. This gives us very valuable variable constant that changes with the market moves.
So the bands expand and contract due to changes in volatility of the market, which makes this tool very flexible exposing psychological levels.
Ichimoku Cloud with EMAThis is a standard Ichimoku Cloud indicator that uses the exponential moving average (EMA) instead of the Tenkan and Kijun Sen.
It provides similar signals as the original but just looks nicer in my opinion.
EMA Slope/Angle OscillatorEMA Slope/Angle Oscillator, Multiple Moving Average Oscillator, Multiple type
Moving Averages HMA,EMA,WMA,SMA, VWMA,VWAP provided.
The angle is calculated between the Slow MA and Fast MA and the difference between the angle is plotted as Histogram.
Additionally Buy Sell Signals are plotted as green and red Dots.
its very easy to judge the movement of price Bearish/Bullish.
Bearish if price below 0 line
Bullish if price above 0 line
Zero crossing is Moving Average Crossover.
Trend Filter is provided to filter opposite signals.
Angle Threshold is provided to filter low angle false signals.
Dead zone is plotted around Zero Line. Trades can be taken after Threshold angle or Dead zone is crossed
Its interesting to see how different Moving Averages move along with price Action.
Phase-Accumulation Adaptive EMA w/ Expanded Source Types [Loxx]Phase-Accumulation Adaptive EMA w/ Expanded Source Types is a Phase Accumulation Adaptive Exponential Moving Average with Loxx's Expanded Source Types. This indicator is meant to better capture trend movements using dominant cycle inputs. Alerts are included.
What is Phase Accumulation?
The phase accumulation method of computing the dominant cycle is perhaps the easiest to comprehend. In this technique, we measure the phase at each sample by taking the arctangent of the ratio of the quadrature component to the in-phase component. A delta phase is generated by taking the difference of the phase between successive samples. At each sample we can then look backwards, adding up the delta phases.When the sum of the delta phases reaches 360 degrees, we must have passed through one full cycle, on average.The process is repeated for each new sample.
The phase accumulation method of cycle measurement always uses one full cycle’s worth of historical data.This is both an advantage and a disadvantage.The advantage is the lag in obtaining the answer scales directly with the cycle period.That is, the measurement of a short cycle period has less lag than the measurement of a longer cycle period. However, the number of samples used in making the measurement means the averaging period is variable with cycle period. longer averaging reduces the noise level compared to the signal.Therefore, shorter cycle periods necessarily have a higher out- put signal-to-noise ratio.
Included:
-Toggle on/off bar coloring
-Alerts
SMA EMA Bands [CraftyChaos]This indicator creates bands for SMA and EMA averages and adds an average of the two with the idea that price often touches one of them at support and resistance levels. Saves indicator space by combining all into one indicator


