[3Commas] DCA Bot TesterDCA Bot Tester
🔷What it does: A tool designed to simulate the behavior of a Dollar Cost Averaging (DCA) strategy based on input signals from a source indicator. Additionally, it enables you to send activation signals to 3Commas Bots via TradingView webhooks.
🔷Who is it for: This tool is ideal for those who want a visual representation and strategy report of how a DCA Bot would perform under specific conditions. By adjusting the parameters, you can assess whether the strategy aligns with your risk/reward expectations before implementation, helping you save time and protect your capital.
🔷How does it work: The tool leverages a pyramiding function to simulate price averaging, mimicking how a DCA Bot operates. It calculates volume-based averaging and, upon reaching the target, closes the positions. Conversely, if the target isn't reached, a Stop Loss is triggered, potentially resulting in significant losses if improperly configured.
🔷Why It’s Unique
Easy visualization of DCA Bot entry and exit points according to user preferences.
DCA Bot Summary table same as the one shown in the new 3Commas interface.
Use plots from other indicators as Entry Trigger Source, with a small modification of the code.
Option to Review message format before sending Signals to 3Commas. Compatibility with Multi-Pair, and futures contract pairs.
Option to filter signals by session and day according to the user’s timezone.
👉 Before continuing with the explanation of the tool, please take a few minutes to read this information, paying special attention to the risks of using DCA strategies.
DCA Bot: What is it, how does it work, and what are its advantages and risks?
A DCA Bot is an automated tool designed to simplify and optimize your trading operations, particularly in cryptocurrencies. Based on the concept of Dollar Cost Averaging (DCA) , this bot implements scaled strategies that allow you to distribute your investments intelligently. The key lies in dividing your capital into multiple orders, known as base orders and safety orders, which are executed at different price levels depending on market conditions.
These bots are highly customizable, meaning you can adapt them to your goals and trading style, whether you're operating Long (expecting a price increase) or Short (expecting a price decrease). Their primary purpose is to reduce the impact of entries that move against the estimated direction and ensure you achieve a more favorable average price.
🔸 Key Features of DCA Bots
Customizable configuration: DCA bots allow you to adjust the size of your initial investment, the number of safety orders, and the price levels at which these orders execute. These orders can be equal or incremental, depending on your risk tolerance.
Scaled safety orders: If the asset's price moves against your position, the bot executes safety orders at strategic levels to average your entry price and increase your chances of closing in profit.
Automatic Take Profit: When the predefined profit level is reached, the bot closes the position, ensuring net gains by averaging all entries made using the DCA strategy.
Stop Loss option: To protect your capital, you can set a stop loss level that limits losses if the market moves drastically against your position.
Flexibility: Bots can integrate with 3Commas technical indicators or external signals from TradingView, allowing you to trade in any trend, whether bullish or bearish.
Support for multiple assets: You can trade cryptocurrency pairs and exchanges compatible with 3Commas, offering a wide range of possibilities to diversify your strategies.
✅ Advantages of DCA Bots
Time-saving automation: DCA bots eliminate the need for constant market monitoring, executing your trades automatically and efficiently based on predefined settings.
Favorable averages in volatile markets: By averaging your entries, the bot can offer more competitive prices even under adverse market conditions. This increases your chances of recovering a position and closing it profitably.
Advanced capital management: With customizable settings, you can adjust the size of base and safety orders to optimize capital usage and reduce risk.
Additional protection: The ability to set a stop loss ensures your losses are limited, safeguarding your capital in extreme scenarios.
⚠️ Risks of Using a DCA Bot
Requires significant capital: Safety orders can accumulate quickly if the price moves against your position. This issue is compounded if increasing amounts are used for safety orders, which can immobilize large portions of capital in adverse markets.
Markets lacking clear direction: During consolidation periods or erratic movements, the bot may generate unrealized losses and make position recovery difficult.
Opportunity cost: Investing in an asset that doesn't show favorable behavior can prevent you from seizing opportunities in other markets.
Emotional pressure: Large investments in advanced stages of the DCA strategy can cause stress, especially if an asset takes too long to reach your take profit level.
Dependence on market recovery: DCA assumes that the price will eventually move in your favor, which does not always happen, especially in assets without solid fundamentals.
📖 Key Considerations for Effectively Using a DCA Bot
Use small amounts for your base and safety orders: Setting small initial orders not only limits capital usage but also allows you to manage multiple bots simultaneously, maximizing portfolio diversification.
Capital management: Define a clear budget and never risk more than you are willing to lose. This is essential for maintaining sustainable operations.
Select assets with strong fundamentals: Apply DCA to assets you understand and that have solid fundamentals and a proven historical growth record. Additionally, analyze each cryptocurrency's fundamentals: What problem does it solve? Does it have a clear use case? Is it viable in the long term? These questions will help you make more informed decisions.
Diversification: Do not concentrate all your capital on a single asset or strategy. Spread your risk across multiple bots or assets.
Monitor regularly: While bots are automated and eliminate the need to monitor the market constantly, it is essential to monitor the bots themselves to ensure they are performing as expected. This includes reviewing their performance and making adjustments if market conditions change. Remember, the goal is to automate trades, but active bot management is crucial to avoid surprises.
A DCA Bot is a powerful tool for traders looking to automate their strategies and reduce the impact of market fluctuations. However, like any tool, its success depends on how it is configured and used. By applying solid capital management principles, carefully selecting assets, and using small amounts in your orders, you can maximize its potential and minimize risks.
🔷FEATURES & HOW TO USE
🔸Strategy: Here you must select the type of signal you are going to analyze and send signals to the DCA Bot, either Long for buy signals or Short for sell signals. This must match the Bot created in 3Commas.
🔸Add a Source Indicator for Entry Triggers
Tradingview allows us to use indicator plots as a source in other indicators, we will use this functionality so that the buy or sell signals of an indicator are processed by the DCA Bot Tester.
In this EXAMPLE we will use a simple strategy that uses a Donchian Channel (DC) and an Exponential Moving Average (EMA).
Trigger to buy or long signal will be when: the price closes above the previous upper level and the average of the upper and lower level (basis) is greater than the EMA.
Trigger sell or short signal will be when: the price closes below the previous lower level and the average of the upper and lower level (basis) is less than the EMA.
trigger_buy = ta.crossover (close,upper ) and basis > ema and barstate.isconfirmed
trigger_sell = ta.crossunder(close,lower ) and basis < ema and barstate.isconfirmed
Then we create the plots that will be used as input source in the DCA Bot Tester indicator.
When a buy condition is given the plot "🟢 Trigger Buy" will have a value of 1 otherwise it will remain at 0.
When a sell condition is given the plot "🔴 Trigger Sell" will have a value of -1 otherwise it will remain at 0.
plot(trigger_buy ? 1 : 0 , '🟢 Trigger Buy' , color = na, display = display.data_window)
plot(trigger_sell? -1 : 0 , '🔴 Trigger Sell', color = na, display = display.data_window)
Here you have the complete code so you can use it and do tests. Basically you just have to define the buy or sell conditions of your preferred indicator or strategy and then create the plots with the same format that will be used in DCA Bot Tester.
//@version=6
indicator(title="Simple Strategy Example", overlay= false)
// Indicator and Signal Triggers
length = input.int(10, title = "DC Length" , display = display.none)
length_ema = input.int(50, title = "EMA Length", display = display.none)
lower = ta.lowest (length)
upper = ta.highest(length)
ema = ta.ema (close, length_ema)
basis = math.avg (upper, lower)
plot(basis, "Basis", color = color.orange, display = display.all-display.status_line)
plot(upper, "Upper", color = color.blue , display = display.all-display.status_line)
plot(lower, "Lower", color = color.blue , display = display.all-display.status_line)
plot(ema , "EMA" , color = color.red , display = display.all-display.status_line)
candlecol = open < close ? color.teal : color.red
plotcandle(open, high, low, close, title='Candles', color = candlecol, wickcolor = candlecol, bordercolor = candlecol, display = display.pane)
trigger_buy = ta.crossover (close,upper ) and basis > ema and barstate.isconfirmed
trigger_sell = ta.crossunder(close,lower ) and basis < ema and barstate.isconfirmed
plotshape(trigger_buy ?close:na, title="Label Buy" , style=shape.labelup , location= location.belowbar, color=color.green, text="B", textcolor=color.white, display=display.pane)
plotshape(trigger_sell?close:na, title="Label Sell", style=shape.labeldown, location= location.abovebar, color=color.red , text="S", textcolor=color.white, display=display.pane)
// ――――――――――――――――――――――――――――――――――――――――――――――――――――――――――――――――――――――――――――――――――――――――――――――――――――――――――――――――――――
// 👇 Plots to be used in the DCA Bot Indicator as source triggers.
// ――――――――――――――――――――――――――――――――――――――――――――――――――――――――――――――――――――――――――――――――――――――――――――――――――――――――――――――――――――
plot(trigger_buy ? 1 : 0 , '🟢 Trigger Buy' , color = na, display = display.data_window)
plot(trigger_sell? -1 : 0 , '🔴 Trigger Sell', color = na, display = display.data_window)
To use the example code
Open the Pine Editor, paste the code and then click Add to chart.
Then in the Plot Entry Trigger Source option, we will select 🟢 Trigger Buy, as the plot that will give us the buy signals when it is worth 1, otherwise for the sell signals you must change the value to -1 in the Plot Entry Trigger Value and remember to change the strategy mode to Short.
🔸DCA Settings: Here you need to configure the DCA values of the strategy, you can see the meaning of each value in the Settings Section. Once you are satisfied with the tests configure the 3Commas DCA Bot with the same values so that the Summary Table matches the 3Commas Table. Pay close attention to the Total Volume that the Bot will use, according to the amount of Safety Orders you are going to execute, and that all the values in the table adapt to your risk tolerance.
🔸DCA Bot Deal Start: Once you create the Bot in 3Commas with the same settings it will give you a Deal Start Message, you must copy and paste it in this section, verify that it is the same in the summary table, this is used to be sent through tradingview alerts to the Bot and it can process the signals.
🔸DCA Bot Multi-Pair: A Multi-Pair Bot allows you to manage several pairs with a single bot, but you must specify which pair it will run on. You must activate it if you want to use the signals in a DCA Bot Multi-pair. In the text box you must enter (using the 3Commas format) the symbol for each pair before you create the alert so that the bot understands which pair to work on.
In the following image we would be configuring the indicator to send a signal to activate the bot in the BTCUSDT pair using the given format it would be USDT_BTC, but if we wanted to send a signal in another pair we must change the pair in the chart and also in the configuration, an example with ETHUSDT would be USDT_ETH. After this we could create the alert, and the Mult-Pair Bot would detect it correctly.
🔸Strategy Tester Filters: This is useful if you want to test the strategy's result on a certain time window, the indicator will only enter this range. If disabled it will use all historical data available on the chart. If you are going to use the tool to send signals, make sure to disable the Use Custom Test Period. If you want the entries to only run at a certain time and day, in that case make sure that the timezone matches the one you are using in the chart.
🔸Properties: Adjust your initial capital and exchange commission appropriately to achieve realistic results.
🔸Create alerts to trigger the DCA Bot
Check that the message is the same as the one indicated by the DCA Bot.
In the case of Multi-Pair, enable the option to add the symbol with the correct format.
When creating an alert, select Any alert() function call.
Enter the any name of the alert.
Open the Notifications tab and enable Webhook URL
Paste Webhook URL provided by 3Commas looking in the section How to use TradingView custom signals.
Done, alerts will be sent with the correct format automatically to 3Commas.
🔷 INDICATOR SETTINGS
🔸3Commas DCA Bot Settings
Strategy: Select the direction of the strategy to test Long or Short, this must be the same as the Bot created in 3Commas, so that the signals are processed properly.
DCA Bot Deal Start: Copy and paste the message for the deal start signal of the DCA Bot you created in 3Commas. This is the message that will be sent with the alert to the Bot, you must verify that it is the same as the 3Commas bot so that it can process properly so that it executes and starts the trade.
DCA Bot Multi-Pair: A Multi-Pair Bot allows you to manage several pairs with a single bot, but you must specify which pair it will run on.
DCA Bot Summary Table: Here you can activate the display of table as well as change the size, position, text color and background color.
🔸Source Indicator Settings
Plot Entry Trigger Source: Select a Plot for Entries of the Source Indicator. This refers to the Long or Short entry signal that the indicator will use as BO (Base Order).
Plot Entry Trigger Value: Value of the Source Indicator to Deal Start Condition Trigger. The default value is 1, this means that when a signal is given for example Long in the source indicator, we will use 1 or for Short -1 if there is no signal it will be 0 so it will not execute any entry, please review the example code and adjust the indicator you are going to use in the same way.
🔸DCA Settings
Base Order: The Base Order is the first order the bot will create when starting a new deal.
Safety Order: Enter the amount of funds your safety orders will use to average the cost of the asset being traded.Safety orders are also known as Dollar Cost Averaging and help when prices move in the opposite direction to your bot's take profit target.
Safety Orders Deviation %: Enter the percentage difference in price to create the first Safety Order. All Safety Orders are calculated from the price the initial Base Order was filled on the exchange account.
Safety Orders Max Count: This is the total number of Safety Orders the bot is allowed to use per deal that is opened. All Safety Orders created by the bot are placed as Limit Orders on the exchange's order book.
Safety Orders Volume Scale: The Safety Order Volume Scale is used to multiply the amount of funds used by the last Safety Order that was created. Using a larger amount of funds for Safety Orders allows your bot to be more aggressive at Dollar Cost Averaging the price of the asset being traded.
Safety Orders Step Scale: The Safety Order Step Scale is used to multiply the Price Deviation percentage used by the last Safety Order placed on the exchange account. Using a larger value here will reduce the amount of Safety Orders your bot will require to cover a larger move in price in the opposite direction to the active deal's take profit target.
Take Profit %: The Take Profit section offers tools for flexible management of target parameters: automatic profit upon reaching one or more target levels in percentage.
Stop Loss % | Use SL: To enable Stop Loss, please check the "Use SL" box. This is the percentage that price needs to move in the opposite direction to close the deal at a loss. This must be greater than the sum of the deviations from the safety orders.
🔸Strategy Tester Filters
Use Custom Test Period: When enabled signals only works in the selected time window.. If disabled it will use all historical data available on the chart.
Test Start and End: Once the Custom Test Period is enabled, here you select the start and end date that you want to analyze.
Session Filter | Days | Background: Here you can choose a time zone in which signals will be sent or your strategy will be tested, as well as the days and a background of it. It is important that you use the same timezone as your chart so that it matches.
👨🏻💻💭 If this tool helps you, don’t forget to give it a boost! Feel free to share in the comments how you're using it or if you have any questions.
_________________________________________________________________
The information and publications within the 3Commas TradingView account are not meant to be and do not constitute financial, investment, trading, or other types of advice or recommendations supplied or endorsed by 3Commas and any of the parties acting on behalf of 3Commas, including its employees, contractors, ambassadors, etc.
Поиск скриптов по запросу "ema"

Gold Scalping Strategy with Precise EntriesThe Gold Scalping Strategy with Precise Entries is designed to take advantage of short-term price movements in the gold market (XAU/USD). This strategy uses a combination of technical indicators and chart patterns to identify precise buy and sell opportunities during times of consolidation and trend continuation.
Key Elements of the Strategy:
Exponential Moving Averages (EMAs):
50 EMA: Used as the shorter-term moving average to detect the recent price trend.
200 EMA: Used as the longer-term moving average to determine the overall market trend.
Trend Identification:
A bullish trend is identified when the 50 EMA is above the 200 EMA.
A bearish trend is identified when the 50 EMA is below the 200 EMA.
Average True Range (ATR):
ATR (14) is used to calculate the market's volatility and to set a dynamic stop loss based on recent price movements. Higher ATR values indicate higher volatility.
ATR helps define a suitable stop-loss distance from the entry point.
Relative Strength Index (RSI):
RSI (14) is used as a momentum oscillator to detect overbought or oversold conditions.
However, in this strategy, the RSI is primarily used as a consolidation filter to look for neutral zones (between 45 and 55), which may indicate a potential breakout or trend continuation after a consolidation phase.
Engulfing Patterns:
Bullish Engulfing: A bullish signal is generated when the current candle fully engulfs the previous bearish candle, indicating potential upward momentum.
Bearish Engulfing: A bearish signal is generated when the current candle fully engulfs the previous bullish candle, signaling potential downward momentum.
Precise Entry Conditions:
Long (Buy):
The 50 EMA is above the 200 EMA (bullish trend).
The RSI is between 45 and 55 (neutral/consolidation zone).
A bullish engulfing pattern occurs.
The price closes above the 50 EMA.
Short (Sell):
The 50 EMA is below the 200 EMA (bearish trend).
The RSI is between 45 and 55 (neutral/consolidation zone).
A bearish engulfing pattern occurs.
The price closes below the 50 EMA.
Take Profit and Stop Loss:
Take Profit: A fixed 20-pip target (where 1 pip = 0.10 movement in gold) is used for each trade.
Stop Loss: The stop-loss is dynamically set based on the ATR, ensuring that it adapts to current market volatility.
Visual Signals:
Buy and sell signals are visually plotted on the chart using green and red labels, indicating precise points of entry.
Advantages of This Strategy:
Trend Alignment: The strategy ensures that trades are taken in the direction of the overall trend, as indicated by the 50 and 200 EMAs.
Volatility Adaptation: The use of ATR allows the stop loss to adapt to the current market conditions, reducing the risk of premature exits in volatile markets.
Precise Entries: The combination of engulfing patterns and the neutral RSI zone provides a high-probability entry signal that captures momentum after consolidation.
Quick Scalping: With a fixed 20-pip profit target, the strategy is designed to capture small price movements quickly, which is ideal for scalping.
This strategy can be applied to lower timeframes (such as 1-minute, 5-minute, or 15-minute charts) for frequent trade opportunities in gold trading, making it suitable for day traders or scalpers. However, proper risk management should always be used due to the inherent volatility of gold.

Adaptive SMI Ergodic StrategyThe Adaptive SMI Ergodic Strategy aims to capture the momentum and direction of a financial asset by leveraging the Stochastic Momentum Index Indicator (SMI) in an ergodic form. The strategy uses two lengths for the SMI, a shorter and a longer one, and an Exponential Moving Average (EMA) to serve as the signal line. Additionally, the strategy incorporates customizable overbought and oversold thresholds to improve the probability of successful trade execution.
How It Works:
Long Entry: A long position is taken when the ergodic SMI crosses over the EMA signal line, and both the SMI and EMA are below the oversold threshold.
Short Entry: A short position is initiated when the ergodic SMI crosses under the EMA signal line, and both the SMI and EMA are above the overbought threshold.
The strategy plots the SMI in yellow and the EMA signal line in purple. Horizontal lines indicate the overbought and oversold thresholds, and a colored background helps in visually identifying these zones.
Parameters:
Long Length: The length of the long EMA in SMI calculation.
Short Length: The length of the short EMA in SMI calculation.
Signal Line Length: The length for the EMA serving as the signal line.
Oversold: Customizable threshold for the oversold condition.
Overbought: Customizable threshold for the overbought condition.
Historical Context: The SMI Indicator
The Stochastic Momentum Index (SMI) was developed by William Blau in the early 1990s as an enhancement to traditional stochastic oscillators. The SMI provides a range of values like a traditional stochastic, but it differs in that it calculates the distance of the current close relative to the median of the high/low range, as opposed to the close relative to the low. As a result, the SMI is less erratic and more responsive, offering a clearer picture of market trends.
In recent years, the SMI has been adapted into ergodic forms to facilitate smoother data analysis, reduce lag, and improve trading accuracy. The Adaptive SMI Ergodic Strategy leverages these modern enhancements to offer a more robust, customizable trading strategy that aligns with various market conditions.

EMR Strategy [H1 Backtesting]EMR Strategy base on EMA, MACD and RSI to supply signal on time frame H1.
Details of Rule as below:
===
1.EMA
+ Time frame: H1
+ Periods: 25, 100 (~ EMA 25 H4), 600 (~ EMA 25 D1)
===
2.MACD
+ Time frame: H1
+ Periods: 12,26,9
===
3.RSI
+ Time frame: H1
+ Periods: 14
===
4.Trading Rule
4.1.Long Position
+ MACD>0 and RSI>50 and close price moving above EMA 25
+ Close price crossed EMA 100 or crossed EMA 600 at the first time
4.2.Short Position
+ MACD<0 and RSI<50 and close price moving below EMA 25
+ Close price crossed EMA 100 or crossed EMA 600 at the first time
===
5.Money Management
+ This strategy concentrate into winrate.
+ So use trailing stop to protect your profits.
+ And use stoploss to avoid big loss on trades.

TRSI STRATEGYThis strategy is based on our very first indicator TRSI .
Which is at the same time made of TRIX, RSI and EMA indicators.
Use TRSI to see how the strategy and indicator behaves on your chart.
Make sure to use the same values on strategy and indicator options.
Entry conditions
Buy and sell signals are generated when TRSI's lines cross above and below 60 and 40 line levels.
Buy - TRSI line crosses over its EMA line above 60 horzontal line
Sell - TRSI line crosses under its EMA line below 40 horzontal line
Close position when lines cross in backwards direction
Recommendet timeframe - 60 min.
Default values (for BTC):
TRIX - 14
RSI - 6
EMA -6
Top line - 60
Bottom line - 40
Supplementary indicators
In options menu of the strategy you may switch on two EMA and bollinger bands indicators to
make extra decision while analysign your chart. Useful if you have limitation on indicator quantity on the chart.
Repaint
The strategy doesn't use lookehead and time security functions.
The entries are generated on confirmation of bar close.
------------------------------------------------------------------------------------------------------------------------------------------
Данная стратегия основана на одном из наших первых индикаторов TRSI ,
который в свою очередь был сделан из трех других индикаторов TRIX, RSI, EMA.
Используйте TRSI на графике чтобы визуально понять как индикатор и стратегия ведут себя.
Используйте одинаковые параметры в индикаторе и в стратегии.
Вход в позицию
Сигналы на покупку и продажу генерируются при пересечении линий TRSI над и под уровнями 60 и 40.
Покупка - линия TRSI пересекает сверху вниз свою EMA над уровнем 60.
Продажа - линия TRSI пересекает снизу верх свою EMA под уровнем 40.
Закрытие позиции при обратном пересечении линий.
Рекомендуемый таймфрейм - 60 минут.
Настройки по умолчанию (для BTC):
TRIX - 14
RSI - 6
EMA -6
Top line - 60
Bottom line - 40
Дополнительные индикаторы
В настройках стратегии можно включить две EMA и полосы боллинджера для дополнительного анализа
при принятии решения входа в позицию. Полезно если у вас ограничение на количество одновременных индикаторов на графике.
Репэйнт
В стратегии не использованы lookahead и временные security функции, которые могут привести к репэйнту.
Входы в позицию генерируются по подтверждению закрытия бара.

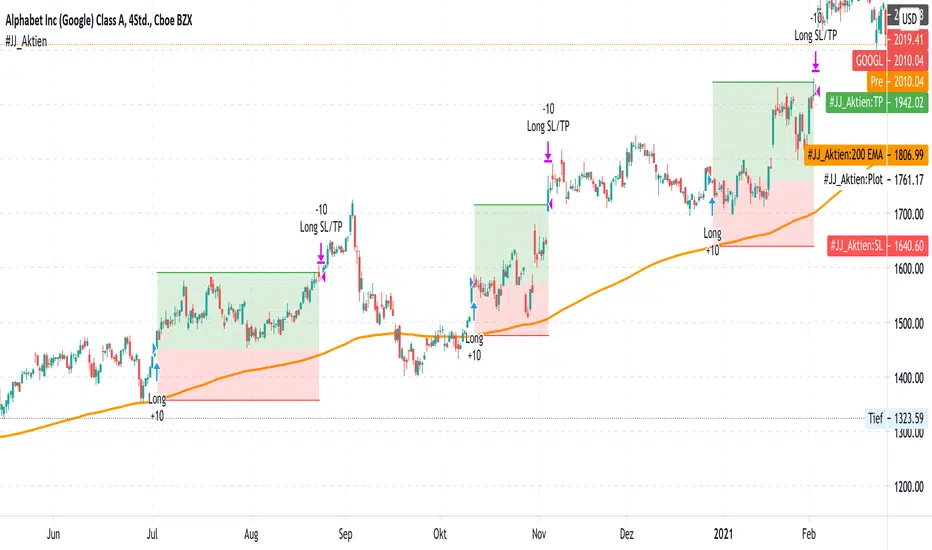
#JJ_Shares Trend Follower
-----------------
Hey there!
There are many reasons why this strategy has worked quite well over the past few years.
A very simple strategy in itself. The basis of this indicator is the trend following approach. "The trend is your friend." This strategy is based on individual separate indicators. A total of three EMA's (10.50 & 200) & the ATR are combined. The largest EMA shows the basic trend direction and thus also the preferred trade direction. The two smaller EMAs are used for the timing of the entrances at the intersection. The stop levels are placed with the help of the ATR and the large EMA. Profit areas are determined using a risk calculation.
Exact entry points can be identified using the indicator. In addition, a take profit is visualized based on a 3:1 CRV . The stop loss results from a long-term EMA .
Example for NASDAQ:GOOGL ! But can be used for all other trend following stocks!
The indicator can be used on all timeframes. However, the performance is significantly better in higher timeframes. In addition, the display can be adjusted using the options.
That's all. Due to the technical chart background, the strategy can be used without further chart analysis.
Attention: Before opening a position, always first check whether there is any strong news. In these cases it is better to be on the safe side.
Attention: With this strategy a SL is provided as standard. However, the risk must always be carefully calculated.
Past results do not guarantee future profits!
Use the link below to get access to this indicator or PM us to get access.
--------------------------------------------------------------------------------------------------------------
--------------------------------------------------------------------------------------------------------------
-----------------
Willkommen!
Es gibt viele Gründe, warum sich diese Strategie in den letzten Jahren ganz gut bewährt hat.
Eine sehr einfache Strategie für sich. Grundlage dieses Indikators ist der Trendfolgeansatz. "The trend is your friend." Diese Strategie basiert auf einzelnen seperaten Indikatoren. Insgesamt werden drei EMA's (10,50 & 200) & die ATR kombiniert. Der größte EMA zeigt die grundsätzliche Trendrichtung und somit auch die bevorzugte Traderichtung. Die beiden kleineren EMA werden bei Kreuzung für das Timing der Einstiege verwendet. Mit Hilfe der ATR und des großen EMA werden die Stop Level platziert. Gewinnzonen werden über eine Risikoberechnung ermittelt.
Anhand des Indikators können genaue Einstiege erkannt werden. Zusätzlich wird aufgrund eines 3:1 CRV ein Take Profit visualisiert. Der Stop Loss ergibt sich über einen langfristigen EMA .
Beispiel für NASDAQ:GOOGL ! Kann aber für alle weiteren Trendfolge Aktien verwendet werden!
Der Indikator kann auf allen Timeframes angewendet werden. Allerdings ist der Performance in höheren Timeframes deutlich besser. Zusätzlich kann die Anzeige über die Optionen angepasst werden.
Das ist alles. Aufgrund des charttechnischen Hintergrunds kann die Strategie ohne weitere Chartanalyse verwendet werden.
Achtung: Vor dem Öffnen einer Position immer zuerst prüfen ob starke News anstehen. In diesen Fällen lieber auf Nummer sicher gehen.
Achtung: Bei dieser Strategie ist standardmäßig ein SL vorgesehen. Das Risiko muss aber immer gut kalkuliert werden.
Vergangene Ergebnisse garantieren keine zukünftigen Gewinne!
Verwenden Sie den folgenden Link, um Zugriff auf diesen Indikator zu erhalten oder schreibe uns eine PM um Zugriff zu erhalten.
KAMA Strategy - Kaufman's Adaptive Moving AverageThis strategy combines Kaufman's Adaptive Moving Average for entry with optional KAMA, PSAR, and Trailing ATR stops for exits.
Kaufman's Adaptive Moving Average is, in my opinion, a gem among the plethora of indicators. It is underrated considering it offers a solution that intuitively makes a lot of sense. When I first read about it, it was a real 'aha!' moment. Look at the top, pink line. Notice how during trending times it follows the trend quickly and closely, but during choppy, non-trending periods, the KAMA stays absolutely flat? Interesting! To trade with it, we simply follow the direction the KAMA is pointing. Is it up? Go long. Is it down? Go short. Is it flat? Hold on.
How does it manage to quickly follow real trends like a fast EMA but ignore choppy conditions that would whipsaw a fast EMA back and forth? It analyses whether recent price moves are significant relative to recent noise and then adapts the length of the EMA window accordingly. If price movement is big compared to the recent noise, the EMA window gets smaller. If price movement is relatively small or average compared to the recent noise, the EMA window gets bigger. In practice it means:
The KAMA would be flat if a 20 point upwards move occurred during a period that has had, on average, regular 20 point moves BUT
the KAMA would point up if a 20 point move occurred during a period that has, on average, had moves of only around 5 points.
In other words, it's a slow EMA during choppy flat / quiet flat periods, and a fast EMA as soon as significant volatility occurs. Perfect!
-----
The Strategy
The strategy is more than just a KAMA indicator. It contains:
KAMA exit (optional)
ATR trailing stop loss exit (optional)
PSAR stop loss exit (optional)
KAMA filter for entry and exits
All features are adjustable in the strategy settings
The Technical Details:
Check out the strategy's 'Inputs' panel. The buy and sell signals are based on the 'KAMA 1' there.
KAMA 1: Length -- 14 is the default. This is the length of the window the KAMA looks back over. In this instance, it c
KAMA 1: Fast KAMA Length -- 2 is the default. This is the tightest the EMA length is allowed to get. It will tend towards this length when volatility is high.
KAMA 1: Slow KAMA Length -- 20 is the default. This is the biggest the EMA length is allowed to get. It will tend towards this length when volatility is low.
KAMA Filter
The strategy buys when the KAMA begins to point up and sells when the KAMA points down. Generally, the KAMA is very good at filtering out the noise itself - it will go flat during noisy/choppy periods. But to add another layer of safety, its author, Perry Kaufman, proposed a KAMA filter. It works by taking the standard deviation of returns over the length of the the 'KAMA 1: Length' I mentioned above and multiplying it by an 'Entry Filter' (1 by default) and 'Exit Filter' (0.5 by default). The entry condition to go long is that the KAMA is pointing up and and it moved up more than 1 x St. Dev. of Returns. The exit condition is when the KAMA is pointing down and it moved down by more than 0.5 x St. Dev. of Returns.
Thanks
Thanks to ChuckBanger, cheatcountry, millerrh, and racer8 for parts of the code. I was able to build upon their good work.
-----
I hope this strategy is helpful to you.
Do you have any thoughts, ideas, or questions? Let me know in the comments or send me a message! I'd be glad to help you out.
If you need an indicator or strategy to be built or customised for you, let me know! I'll be glad to help and it'll probably be cheaper than you think!

Tilson T3 and MavilimW Triple Combined StrategyInspired by truly greatful Kivanç Ozbilgic (www.tradingview.com).
The strategy tries to combined three different moving average strategies into one.
Strategies covered are:
1. Tillson T3 Moving Average Strategy
Developed by Tim Tillson, the T3 Moving Average is considered superior to traditional moving averages as it is smoother, more responsive and thus performs better in ranging market conditions as well. However, it bears the disadvantage of overshooting the price as it attempts to realign itself to current market conditions.
It incorporates a smoothing technique which allows it to plot curves more gradual than ordinary moving averages and with a smaller lag. Its smoothness is derived from the fact that it is a weighted sum of a single EMA, double EMA, triple EMA and so on. When a trend is formed, the price action will stay above or below the trend during most of its progression and will hardly be touched by any swings. Thus, a confirmed penetration of the T3 MA and the lack of a following reversal often indicates the end of a trend. Here is what the calculation looks like:
T3 = c1*e6 + c2*e5 + c3*e4 + c4*e3, where:
– e1 = EMA (Close, Period)
– e2 = EMA (e1, Period)
– e3 = EMA (e2, Period)
– e4 = EMA (e3, Period)
– e5 = EMA (e4, Period)
– e6 = EMA (e5, Period)
– a is the volume factor, default value is 0.7 but 0.618 can also be used
– c1 = – a^3
– c2 = 3*a^2 + 3*a^3
– c3 = – 6*a^2 – 3*a – 3*a^3
– c4 = 1 + 3*a + a^3 + 3*a^2
T3 MovingThe T3 Moving Average generally produces entry signals similar to other moving averages and thus is traded largely in the same manner.
Strategy for Tillson T3 is if the close crossovers T3 line and for at least five bars the close was under the T3
2. Tillson T3 Fibonacci Cross
Kivanc Ozbilgic added a second T3 line with a volume factor of 0.618 (Fibonacci Ratio) and length of 3 (fibonacci number) which can be added by selecting the T3 Fibonacci Strategy input box.
Strategy for Tillson T3 Fibo is when the Fibo Line crossover the T3 it gives long signal vice versa.
3. MavilimW
MavilimW is originally a support and resistance indicator based on fibonacci injected weighted moving averages.
Strategy for MavilimW is is if the close crossovers T3 line and for at least five bars the close was under the T3
Hope you enjoy

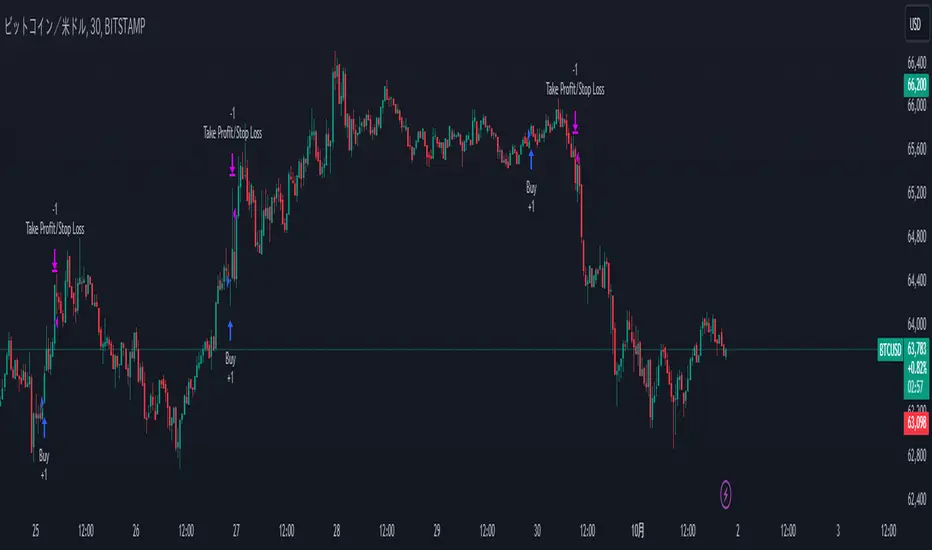
CryptoTraderX.EMA.RainbowThe strategy is called EMA Rainbow and from a technical point of view it is extremely easy. All this because it uses only one indicator, which is the exponential moving average (EMA). Word “Rainbow”, signals that we will use several different settings of this indicator but don’t worry it is very simple.
The Rainbow EMA strategy uses three exponential moving average EMAs:
6-period moving average (EMA 6)
14-period moving average (EMA 14)
26-period moving average (EMA 26)
long :crossover ema 6 and 26
short: crossunder ema 6 and 26

Master Trend Strategy - by jake_thebossMaster Trend Strategy
This strategy combines multiple technical indicators to identify high-probability trend entries across all asset classes.
Core Signal Logic:
Entry triggered when EMA 4 crosses above/below EMA 5
Confirmation required from RSI (>50 for long, <50 for short)
Price must be above/below key moving averages: EMA 21, SMA 50, EMA 55, EMA 89, and EMA 750
Additional confirmation from Stochastic (>52 bullish, <48 bearish) or EMA 89 breakout or VWAP cross
Key Features:
VWAP filter: Only takes bullish signals above VWAP and bearish signals below VWAP
Optional pyramiding: Allows multiple entries in the same direction (up to 200 orders)
Individual stop loss and take profit management for each pyramid level
Time filter: Customizable trading hours with timezone offset
Risk management: Adjustable stop loss (default 0.3%) and take profit (default 0.6%)
Visualization:
Entry, stop loss, and take profit levels drawn as horizontal lines
Customizable signal markers (triangles) for bull/bear entries
Optional EMA overlay display
The strategy is designed for trend-following on lower timeframes, with strict multi-indicator confirmation to filter out false signals.

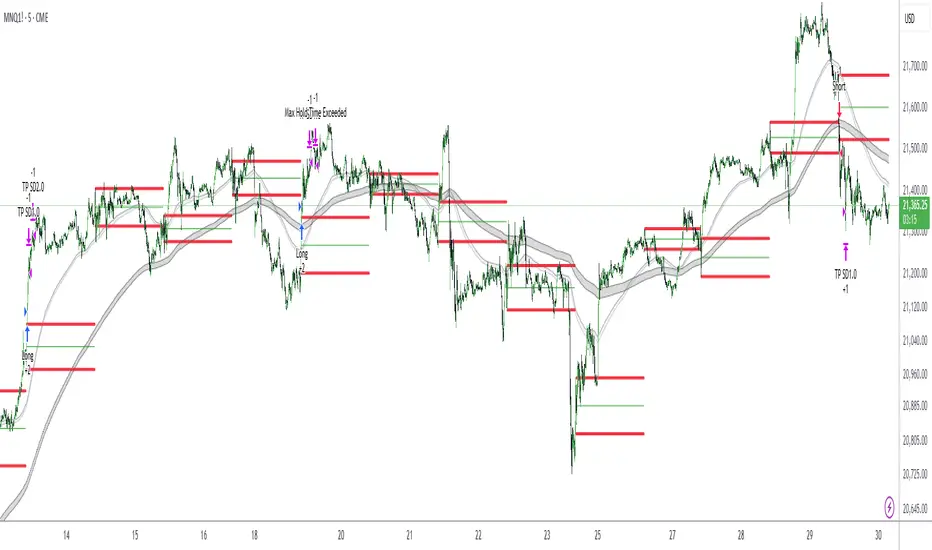
Antony.N4A -NQ ORB Quartile Str v6.3Antony.N4A – NQ ORB Quartile Strategy v6.3
A precision-engineered intraday breakout system built for the Nasdaq futures market, combining the Opening Range Breakout (ORB) logic with dynamic standard deviation targets, structural filters, and multi-layer risk management.
🧠 Key Features
Opening Range Breakout (ORB):
Automatically defines a breakout window (default: 09:30–09:45) and triggers entries when price breaks the high or low of that range.
Standard Deviation Profit Targets:
Supports SD0.5, SD1.0, SD1.5, and SD2.0 targets relative to the ORB range.
EMA Filtering (200-period):
Filters trades based on EMA direction and price position to validate breakout direction and avoid false entries.
Range Filtering:
Detects directional bias and volatility trends using smoothed range logic.
Momentum Triggering:
Validates breakout momentum and allows entries when directional momentum is positive and increasing.
⚙️ User Inputs
ORB Settings: Timeframe, session, and timezone customization
Entry Window: Define when trades are allowed to trigger
Day Filters: Enable/disable trading by weekday
SD Targets: Configure exit % and active levels (SD0.5 – SD2.0)
EMA Filter & Sensitivity
Cross Filter (Anti-chop logic)
Range Filter Parameters
Visual Toggles: ORB range, SD levels, EMA clouds
🎯 Trade Management Rules
Entry:
Triggered at the close of a 5-minute candle confirming a breakout of the ORB range.
Stop Loss:
Defined by structural invalidation (quartile boundaries & mid-range buffers).
Take Profit Strategy:
75% closed at SD1.0 level
Remaining 25% trailed to further SD2 target
SL is moved to breakeven after partial exit
Execution Controls:
No pyramiding
No re-entries (cooldown enforced)
🔧 Trading Modes
✅ Safe Mode
EMA Filter: Enabled
EMA Sensitivity: 19
Range Filter: Disabled
Ideal for conservative setups and reduced noise environments
🔥 Aggressive Mode
EMA Filter: Enabled
EMA Sensitivity: 5
Range Filter: Disabled
Suited for high-frequency setups and faster breakouts
📊 Backtest Performance (7-Month Sample)
Safe Mode:
Win Rate: 66%
Total Trades: 29
Net PnL: +21.79R (~$4,357 with R = $200)
Max Red Days: 3
Max Drawdown: -$663
Best Month: +9R, Worst Month: -2R
Aggressive Mode:
Win Rate: 63%
Total Trades: 52
Net PnL: +30R (~$6,080)
Max Red Days: 6
Max Drawdown: -$1,357
Best Month: +12R, Worst Month: -3.2R
👨💻 Developed by Antony.N4A
This tool is crafted for strategic intraday traders, system developers, and backtesters.
For access, customization, or licensing options, contact the developer directly.
Protected script. Redistribution or reuse without permission is prohibited.
AI Volume StrategyAI Volume Strategy detects significant volume spikes and combines them with trend direction and candlestick color to generate buy and sell signals. The strategy uses an Exponential Moving Average (EMA) of volume to identify abnormal volume spikes that may indicate strong market activity. Additionally, it uses a 50-period EMA of price to filter the trend and decide on entry direction.
Key Features:
Volume Spike Detection: The strategy detects when the current volume exceeds the EMA of volume by a user-defined multiplier, signaling abnormal increases in market activity.
Trend Direction Filter: The strategy uses a 50-period EMA of price to determine the market trend. Buy signals are generated when the price is above the EMA (uptrend), and sell signals are generated when the price is below the EMA (downtrend).
Candle Color Filter: The strategy generates a buy signal only when the current candle is bullish (green) and a sell signal only when the current candle is bearish (red).
Exit after X Bars: The strategy automatically closes the position after a specified number of bars (default is 5 bars), but the exit condition can be adjusted based on user preference, timeframe, and backtesting results. The default exit is after 5 bars, but users can set it to 1 bar or any other number depending on their preferences and strategy.
Signals:
Buy Signal: Generated when a volume spike occurs, the trend is upward, and the current candle is bullish.
Sell Signal: Generated when a volume spike occurs, the trend is downward, and the current candle is bearish.
Alerts:
Buy Alert: Alerts the user when a buy signal is triggered.
Sell Alert: Alerts the user when a sell signal is triggered.
Visualization:
Buy Signal: A green label appears below the bar when the buy conditions are met.
Sell Signal: A red label appears above the bar when the sell conditions are met.
Volume EMA: Optionally, the Volume EMA line can be plotted on the chart to visualize volume trends.
This strategy helps traders identify potential entry points based on increased volume activity while considering trend direction and candlestick patterns. With the ability to adjust the exit condition, users can fine-tune the strategy to their specific needs and backtest results.

[SHORT ONLY] Consecutive Bars Above MA Strategy█ STRATEGY DESCRIPTION
The "Consecutive Bars Above MA Strategy" is a contrarian trading system aimed at exploiting overextended bullish moves in stocks and ETFs. It monitors the number of consecutive bars that close above a chosen short-term moving average (which can be either a Simple Moving Average or an Exponential Moving Average). Once the count reaches a preset threshold and the current bar’s close exceeds the previous bar’s high within a designated trading window, a short entry is initiated. An optional EMA filter further refines entries by requiring that the current close is below the 200-period EMA, helping to ensure that trades are taken in a bearish environment.
█ HOW ARE THE CONSECUTIVE BULLISH COUNTS CALCULATED?
The strategy utilizes a counter variable, `bullCount`, to track consecutive bullish bars based on their relation to the short-term moving average. Here’s how the count is determined:
Initialize the Counter
The counter is initialized at the start:
var int bullCount = na
Bullish Bar Detection
For each bar, if the close is above the selected moving average (either SMA or EMA, based on user input), the counter is incremented:
bullCount := close > signalMa ? (na(bullCount) ? 1 : bullCount + 1) : 0
Reset on Non-Bullish Condition
If the close does not exceed the moving average, the counter resets to zero, indicating a break in the consecutive bullish streak.
█ SIGNAL GENERATION
1. SHORT ENTRY
A short signal is generated when:
The number of consecutive bullish bars (i.e., bars closing above the short-term MA) meets or exceeds the defined threshold (default: 3).
The current bar’s close is higher than the previous bar’s high.
The signal occurs within the specified trading window (between Start Time and End Time).
Additionally, if the EMA filter is enabled, the entry is only executed when the current close is below the 200-period EMA.
2. EXIT CONDITION
An exit signal is triggered when the current close falls below the previous bar’s low, prompting the strategy to close the short position.
█ ADDITIONAL SETTINGS
Threshold: The number of consecutive bullish bars required to trigger a short entry (default is 3).
Trading Window: The Start Time and End Time inputs define when the strategy is active.
Moving Average Settings: Choose between SMA and EMA, and set the MA length (default is 5), which is used to assess each bar’s bullish condition.
EMA Filter (Optional): When enabled, this filter requires that the current close is below the 200-period EMA, supporting entries in a downtrend.
█ PERFORMANCE OVERVIEW
This strategy is designed for stocks and ETFs and can be applied across various timeframes.
It seeks to capture mean reversion by shorting after a series of bullish bars suggests an overextended move.
The approach employs a contrarian short entry by waiting for a breakout (close > previous high) following consecutive bullish bars.
The adjustable moving average settings and optional EMA filter allow for further optimization based on market conditions.
Comprehensive backtesting is recommended to fine-tune the threshold, moving average parameters, and filter settings for optimal performance.

XAUUSD Trend Strategy### Description of the XAUUSD Trading Strategy with Pine Script
This strategy is designed to trade gold (**XAUUSD**) using proven technical analysis principles. It combines key indicators such as **Exponential Moving Averages (EMA)**, the **Relative Strength Index (RSI)**, and **Bollinger Bands** to identify trading opportunities in trending market conditions.
---
#### Objective:
To maximize profits by identifying trend-aligned entry points while minimizing risks through well-defined Stop Loss and Take Profit levels.
---
### How It Works
1. **Indicators Used:**
- **Exponential Moving Averages (EMA):** Tracks short-term and long-term trends to confirm market direction.
- **Relative Strength Index (RSI):** Detects overbought or oversold conditions for potential reversals or trend continuation.
- **Bollinger Bands:** Measures volatility to identify breakout or reversion points.
2. **Entry Rules:**
- **Long (Buy):** Triggered when:
- The short-term EMA crosses above the long-term EMA (bullish trend confirmation).
- RSI exits oversold territory (<30), signaling buying momentum.
- The price breaks above the upper Bollinger Band, indicating a strong trend.
- **Short (Sell):** Triggered when:
- The short-term EMA crosses below the long-term EMA (bearish trend confirmation).
- RSI exits overbought territory (>70), signaling selling momentum.
- The price breaks below the lower Bollinger Band, indicating a strong downtrend.
3. **Risk Management:**
- **Stop Loss:** Automatically calculated based on a percentage of equity risk (customizable via inputs).
- **Take Profit:** Defined using a risk-to-reward ratio, ensuring consistent profitability when trades succeed.
4. **Visualization:**
- The chart displays the EMAs, Bollinger Bands, and entry/exit points for clear analysis.
---
### Key Features:
- **Customizable Parameters:** You can adjust EMAs, RSI thresholds, Bollinger Band settings, and risk levels to suit your trading style.
- **Alerts:** Automatic alerts for potential trade setups.
- **Backtesting-Ready:** Easily test historical performance on TradingView.
---
This strategy is ideal for gold traders looking for a systematic, rule-based approach to trading trends with minimal emotional interference.

Trend Confirmation and ASO-based StrategyStrategy Name: Trend Confirmation with EMA, ASO, and ATR Bands Auto-Trading
Purpose:
This strategy aims to enhance trend confirmation and entry point precision by combining multiple technical indicators. Specifically, it uses the 200 EMA for trend confirmation, the Average Sentiment Oscillator (ASO) to capture market sentiment, and ATR bands for risk management. This provides a comprehensive approach to capturing trade opportunities. The strategy emphasizes trend-following trades, reducing noise while keeping risk management simple.
Uniqueness and Usefulness:
Uniqueness:
This strategy stands out because it integrates multiple elements that complement each other for increased effectiveness and originality. Instead of relying on a single indicator, it generates more accurate trading signals by allowing each indicator to work synergistically.
200 EMA: Used to confirm the long-term trend, providing clarity on the trend direction and ensuring trades align with the dominant market trend.
Average Sentiment Oscillator (ASO): Measures market sentiment based on the crossover between the bull and bear lines. Signals are generated only when ASO detects a trend shift, filtering out price fluctuations and noise.
ATR Bands: Evaluates market volatility and sets stop-loss levels upon entry. By using ATR bands, the strategy supports traders in maintaining a fixed stop-loss for risk management.
Each component analyzes the market from a different perspective, and together, they generate reliable signals for trend-following trades. These indicators are not simply combined but are clearly defined in their roles to improve signal quality.
Usefulness:
This strategy is suitable for medium to long-term traders who focus on trend-following. It emphasizes entry during the early stages of a trend and focuses on risk management by offering reliable signals with minimal noise. The combination of ASO and ATR bands allows traders to assess market volatility while setting take profit levels based on a risk-reward ratio. This helps avoid overreacting to short-term price fluctuations and supports sustainable trading practices.
Entry Conditions:
Long Entry:
Condition: Price is above the 200 EMA, and the ASO bull line crosses above the bear line while also exceeding the 50 level.
Signal: A buy signal is generated, indicating the start of an uptrend.
Short Entry:
Condition: Price is below the 200 EMA, and the ASO bear line crosses above the bull line while also exceeding the 50 level.
Signal: A sell signal is generated, indicating the start of a downtrend.
Exit Conditions:
Exit Strategy:
While this strategy automates both entries and exits, it is recommended that traders manually manage their positions for risk control when necessary. The stop-loss is set based on ATR bands at the time of entry, and a take-profit is set with a risk-reward ratio of 1:1.5.
Risk Management:
This strategy incorporates a fixed stop-loss mechanism, where the stop-loss is set at entry based on the ATR band value. Once set, the stop-loss remains fixed, ensuring that trades stay within a predetermined risk range. The take-profit is based on a risk-reward ratio of 1:1.5, increasing the potential reward relative to the risk.
Account Size: ¥100,000
Commissions and Slippage: Assumed commission of 94 pips per trade and slippage of 1 pip.
Risk per Trade: 10% of account equity (adjustable based on risk tolerance).
Configurable Options:
ASO Period: Period setting for the Average Sentiment Oscillator (default is 32).
ATR Multiplier: Multiplier for ATR band calculation (default is 2.0).
EMA Period: Settings for the 200 EMA.
Signal Display Control: Option to toggle entry signal visibility on or off.
Adequate Sample Size:
To verify the effectiveness of this strategy, it is recommended to conduct extensive backtesting over a long period, covering different market conditions, including both high and low volatility environments.
Credits:
Acknowledgments:
This strategy integrates technical approaches based on the Average Sentiment Oscillator, 200 EMA, and ATR bands, drawing insights from the broader trading community.
Clean Chart Description:
Chart Appearance:
This strategy maintains a clean chart display by offering a toggle to switch the visibility of the ASO, EMA, and entry signals on or off. This helps reduce visual clutter and enhances effective trend analysis.
Addressing the House Rule Violations:
Omissions and Unrealistic Claims:
This strategy makes no exaggerated claims or guarantees about performance. All signals are provided for educational purposes, and it is emphasized that past performance does not guarantee future results. Proper risk management is essential, and the importance of this is highlighted throughout the strategy.
Post-Open Long Strategy with ATR-based Stop Loss and Take ProfitThe "Post-Open Long Strategy with ATR-Based Stop Loss and Take Profit" is designed to identify buying opportunities after the German and US markets open. It combines various technical indicators to filter entry signals, focusing on breakout moments following price lateralization periods.
Key Components and Their Interaction:
Bollinger Bands (BB):
Description: Uses BB with a 14-period length and standard deviation multiplier of 1.5, creating narrower bands for lower timeframes.
Role in the Strategy: Identifies low volatility phases (lateralization). The lateralization condition is met when the price is near the simple moving average of the BB, suggesting an imminent increase in volatility.
Exponential Moving Averages (EMA):
10-period EMA: Quickly detects short-term trend direction.
200-period EMA: Filters long-term trends, ensuring entries occur in a bullish market.
Interaction: Positions are entered only if the price is above both EMAs, indicating a consolidated positive trend.
Relative Strength Index (RSI):
Description: 7-period RSI with a threshold above 30.
Role in the Strategy: Confirms the market is not oversold, supporting the validity of the buy signal.
Average Directional Index (ADX):
Description: 7-period ADX with 7-period smoothing and a threshold above 10.
Role in the Strategy: Assesses trend strength. An ADX above 10 indicates sufficient momentum to justify entry.
Average True Range (ATR) for Dynamic Stop Loss and Take Profit:
Description: 14-period ATR with multipliers of 2.0 for Stop Loss and 4.0 for Take Profit.
Role in the Strategy: Adjusts exit levels based on current volatility, enhancing risk management.
Resistance Identification and Breakout:
Description: Analyzes the highs of the last 20 candles to identify resistance levels with at least two touches.
Role in the Strategy: A breakout above this level signals a potential continuation of the bullish trend.
Time Filters and Market Conditions:
Trading Hours: Operates only during the opening of the German market (8:00 - 12:00) and US market (15:30 - 19:00).
Panic Candle: The current candle must close negative, leveraging potential emotional reactions in the market.
Avoiding Entry During Pullbacks:
Description: Checks that the two previous candles are not both bearish.
Role in the Strategy: Avoids entering during a potential pullback, improving trade success probability.
Post-Open Long Strategy with ATR-Based Stop Loss and Take Profit
The "Post-Open Long Strategy with ATR-Based Stop Loss and Take Profit" is designed to identify buying opportunities after the German and US markets open. It combines various technical indicators to filter entry signals, focusing on breakout moments following price lateralization periods.
Key Components and Their Interaction:
Bollinger Bands (BB):
Description: Uses BB with a 14-period length and standard deviation multiplier of 1.5, creating narrower bands for lower timeframes.
Role in the Strategy: Identifies low volatility phases (lateralization). The lateralization condition is met when the price is near the simple moving average of the BB, suggesting an imminent increase in volatility.
Exponential Moving Averages (EMA):
10-period EMA: Quickly detects short-term trend direction.
200-period EMA: Filters long-term trends, ensuring entries occur in a bullish market.
Interaction: Positions are entered only if the price is above both EMAs, indicating a consolidated positive trend.
Relative Strength Index (RSI):
Description: 7-period RSI with a threshold above 30.
Role in the Strategy: Confirms the market is not oversold, supporting the validity of the buy signal.
Average Directional Index (ADX):
Description: 7-period ADX with 7-period smoothing and a threshold above 10.
Role in the Strategy: Assesses trend strength. An ADX above 10 indicates sufficient momentum to justify entry.
Average True Range (ATR) for Dynamic Stop Loss and Take Profit:
Description: 14-period ATR with multipliers of 2.0 for Stop Loss and 4.0 for Take Profit.
Role in the Strategy: Adjusts exit levels based on current volatility, enhancing risk management.
Resistance Identification and Breakout:
Description: Analyzes the highs of the last 20 candles to identify resistance levels with at least two touches.
Role in the Strategy: A breakout above this level signals a potential continuation of the bullish trend.
Time Filters and Market Conditions:
Trading Hours: Operates only during the opening of the German market (8:00 - 12:00) and US market (15:30 - 19:00).
Panic Candle: The current candle must close negative, leveraging potential emotional reactions in the market.
Avoiding Entry During Pullbacks:
Description: Checks that the two previous candles are not both bearish.
Role in the Strategy: Avoids entering during a potential pullback, improving trade success probability.
Entry and Exit Conditions:
Long Entry:
The price breaks above the identified resistance.
The market is in a lateralization phase with low volatility.
The price is above the 10 and 200-period EMAs.
RSI is above 30, and ADX is above 10.
No short-term downtrend is detected.
The last two candles are not both bearish.
The current candle is a "panic candle" (negative close).
Order Execution: The order is executed at the close of the candle that meets all conditions.
Exit from Position:
Dynamic Stop Loss: Set at 2 times the ATR below the entry price.
Dynamic Take Profit: Set at 4 times the ATR above the entry price.
The position is automatically closed upon reaching the Stop Loss or Take Profit.
How to Use the Strategy:
Application on Volatile Instruments:
Ideal for financial instruments that show significant volatility during the target market opening hours, such as indices or major forex pairs.
Recommended Timeframes:
Intraday timeframes, such as 5 or 15 minutes, to capture significant post-open moves.
Parameter Customization:
The default parameters are optimized but can be adjusted based on individual preferences and the instrument analyzed.
Backtesting and Optimization:
Backtesting is recommended to evaluate performance and make adjustments if necessary.
Risk Management:
Ensure position sizing respects risk management rules, avoiding risking more than 1-2% of capital per trade.
Originality and Benefits of the Strategy:
Unique Combination of Indicators: Integrates various technical metrics to filter signals, reducing false positives.
Volatility Adaptability: The use of ATR for Stop Loss and Take Profit allows the strategy to adapt to real-time market conditions.
Focus on Post-Lateralization Breakout: Aims to capitalize on significant moves following consolidation periods, often associated with strong directional trends.
Important Notes:
Commissions and Slippage: Include commissions and slippage in settings for more realistic simulations.
Capital Size: Use a realistic trading capital for the average user.
Number of Trades: Ensure backtesting covers a sufficient number of trades to validate the strategy (ideally more than 100 trades).
Warning: Past results do not guarantee future performance. The strategy should be used as part of a comprehensive trading approach.
With this strategy, traders can identify and exploit specific market opportunities supported by a robust set of technical indicators and filters, potentially enhancing their trading decisions during key times of the day.

Soheil PKO's 5 min Hitman Scalp - 3MA + Laguerre RSI + ADX [Pt]Someone sent me this strategy found on YouTube. It is Soheil PKO's "The Best and Most Profitable Scalping Strategy" Best way to find out is to code it =)
This strategy uses Moving Average Ribbon, Laguerre RSI, and ADX. This script only displays the MA ribbon, you will need to add Laguerre RSI and ADX separately.
Long Entry Criteria:
- 16 EMA > 48 EMA > 200 SMA
- Laguerre RSI > 80
- ADX > 20
Long Exit Criterion:
- 16 EMA < 48 EMA
Short Entry Criteria:
- 16 EMA < 48 EMA < 200 SMA
- Laguerre RSI < 20
- ADX > 20
Short Exit Criterion:
- 16 EMA > 48 EMA
As mentioned in the video, risk management is very important, especially for scalping strategies. Therefore, I've added option for setting Stop Loss and Price Target in the options for you guys to play with.
All parameters are configurable.
Enjoy~~

Webhook Starter Kit [HullBuster]
Introduction
This is an open source strategy which provides a framework for webhook enabled projects. It is designed to work out-of-the-box on any instrument triggering on an intraday bar interval. This is a full featured script with an emphasis on actual trading at a brokerage through the TradingView alert mechanism and without requiring browser plugins.
The source code is written in a self documenting style with clearly defined sections. The sections “communicate” with each other through state variables making it easy for the strategy to evolve and improve. This is an excellent place for Pine Language beginners to start their strategy building journey. The script exhibits many Pine Language features which will certainly ad power to your script building abilities.
This script employs a basic trend follow strategy utilizing a forward pyramiding technique. Trend detection is implemented through the use of two higher time frame series. The market entry setup is a Simple Moving Average crossover. Positions exit by passing through conditional take profit logic. The script creates ten indicators including a Zscore oscillator to measure support and resistance levels. The indicator parameters are exposed through 47 strategy inputs segregated into seven sections. All of the inputs are equipped with detailed tool tips to help you get started.
To improve the transition from simulation to execution, strategy.entry and strategy.exit calls show enhanced message text with embedded keywords that are combined with the TradingView placeholders at alert time. Thereby, enabling a single JSON message to generate multiple execution events. This is genius stuff from the Pine Language development team. Really excellent work!
This document provides a sample alert message that can be applied to this script with relatively little modification. Without altering the code, the strategy inputs can alter the behavior to generate thousands of orders or simply a few dozen. It can be applied to crypto, stocks or forex instruments. A good way to look at this script is as a webhook lab that can aid in the development of your own endpoint processor, impress your co-workers and have hours of fun.
By no means is a webhook required or even necessary to benefit from this script. The setups, exits, trend detection, pyramids and DCA algorithms can be easily replaced with more sophisticated versions. The modular design of the script logic allows you to incrementally learn and advance this script into a functional trading system that you can be proud of.
Design
This is a trend following strategy that enters long above the trend line and short below. There are five trend lines that are visible by default but can be turned off in Section 7. Identified, in frequency order, as follows:
1. - EMA in the chart time frame. Intended to track price pressure. Configured in Section 3.
2. - ALMA in the higher time frame specified in Section 2 Signal Line Period.
3. - Linear Regression in the higher time frame specified in Section 2 Signal Line Period.
4. - Linear Regression in the higher time frame specified in Section 2 Signal Line Period.
5. - DEMA in the higher time frame specified in Section 2 Trend Line Period.
The Blue, Green and Orange lines are signal lines are on the same time frame. The time frame selected should be at least five times greater than the chart time frame. The Purple line represents the trend line for which prices above the line suggest a rising market and prices below a falling market. The time frame selected for the trend should be at least five times greater than the signal lines.
Three oscillators are created as follows:
1. Stochastic - In the chart time frame. Used to enter forward pyramids.
2. Stochastic - In the Trend period. Used to detect exit conditions.
3. Zscore - In the Signal period. Used to detect exit conditions.
The Stochastics are configured identically other than the time frame. The period is set in Section 2.
Two Simple Moving Averages provide the trade entry conditions in the form of a crossover. Crossing up is a long entry and down is a short. This is in fact the same setup you get when you select a basic strategy from the Pine editor. The crossovers are configured in Section 3. You can see where the crosses are occurring by enabling Show Entry Regions in Section 7.
The script has the capacity for pyramids and DCA. Forward pyramids are enabled by setting the Pyramid properties tab with a non zero value. In this case add on trades will enter the market on dips above the position open price. This process will continue until the trade exits. Downward pyramids are available in Crypto and Range mode only. In this case add on trades are placed below the entry price in the drawdown space until the stop is hit. To enable downward pyramids set the Pyramid Minimum Span In Section 1 to a non zero value.
This implementation of Dollar Cost Averaging (DCA) triggers off consecutive losses. Each loss in a run increments a sequence number. The position size is increased as a multiple of this sequence. When the position eventually closes at a profit the sequence is reset. DCA is enabled by setting the Maximum DCA Increments In Section 1 to a non zero value.
It should be noted that the pyramid and DCA features are implemented using a rudimentary design and as such do not perform with the precision of my invite only scripts. They are intended as a feature to stress test your webhook endpoint. As is, you will need to buttress the logic for it to be part of an automated trading system. It is for this reason that I did not apply a Martingale algorithm to this pyramid implementation. But, hey, it’s an open source script so there is plenty of room for learning and your own experimentation.
How does it work
The overall behavior of the script is governed by the Trading Mode selection in Section 1. It is the very first input so you should think about what behavior you intend for this strategy at the onset of the configuration. As previously discussed, this script is designed to be a trend follower. The trend being defined as where the purple line is predominately heading. In BiDir mode, SMA crossovers above the purple line will open long positions and crosses below the line will open short. If pyramiding is enabled add on trades will accumulate on dips above the entry price. The value applied to the Minimum Profit input in Section 1 establishes the threshold for a profitable exit. This is not a hard number exit. The conditional exit logic must be satisfied in order to permit the trade to close. This is where the effort put into the indicator calibration is realized. There are four ways the trade can exit at a profit:
1. Natural exit. When the blue line crosses the green line the trade will close. For a long position the blue line must cross under the green line (downward). For a short the blue must cross over the green (upward).
2. Alma / Linear Regression event. The distance the blue line is from the green and the relative speed the cross is experiencing determines this event. The activation thresholds are set in Section 6 and relies on the period and length set in Section 2. A long position will exit on an upward thrust which exceeds the activation threshold. A short will exit on a downward thrust.
3. Exponential event. The distance the yellow line is from the blue and the relative speed the cross is experiencing determines this event. The activation thresholds are set in Section 3 and relies on the period and length set in the same section.
4. Stochastic event. The purple line stochastic is used to measure overbought and over sold levels with regard to position exits. Signal line positions combined with a reading over 80 signals a long profit exit. Similarly, readings below 20 signal a short profit exit.
Another, optional, way to exit a position is by Bale Out. You can enable this feature in Section 1. This is a handy way to reduce the risk when carrying a large pyramid stack. Instead of waiting for the entire position to recover we exit early (bale out) as soon as the profit value has doubled.
There are lots of ways to implement a bale out but the method I used here provides a succinct example. Feel free to improve on it if you like. To see where the Bale Outs occur, enable Show Bale Outs in Section 7. Red labels are rendered below each exit point on the chart.
There are seven selectable Trading Modes available from the drop down in Section 1:
1. Long - Uses the strategy.risk.allow_entry_in to execute long only trades. You will still see shorts on the chart.
2. Short - Uses the strategy.risk.allow_entry_in to execute short only trades. You will still see long trades on the chart.
3. BiDir - This mode is for margin trading with a stop. If a long position was initiated above the trend line and the price has now fallen below the trend, the position will be reversed after the stop is hit. Forward pyramiding is available in this mode if you set the Pyramiding value in the Properties tab. DCA can also be activated.
4. Flip Flop - This is a bidirectional trading mode that automatically reverses on a trend line crossover. This is distinctively different from BiDir since you will get a reversal even without a stop which is advantageous in non-margin trading.
5. Crypto - This mode is for crypto trading where you are buying the coins outright. In this case you likely want to accumulate coins on a crash. Especially, when all the news outlets are talking about the end of Bitcoin and you see nice deep valleys on the chart. Certainly, under these conditions, the market will be well below the purple line. No margin so you can’t go short. Downward pyramids are enabled for Crypto mode when two conditions are met. First the Pyramiding value in the Properties tab must be non zero. Second the Pyramid Minimum Span in Section 1 must be non zero.
6. Range - This is a counter trend trading mode. Longs are entered below the purple trend line and shorts above. Useful when you want to test your webhook in a market where the trend line is bisecting the signal line series. Remember that this strategy is a trend follower. It’s going to get chopped out in a range bound market. By turning on the Range mode you will at least see profitable trades while stuck in the range. However, when the market eventually picks a direction, this mode will sustain losses. This range trading mode is a rudimentary implementation that will need a lot of improvement if you want to create a reliable switch hitter (trend/range combo).
7. No Trade. Useful when setting up the trend lines and the entry and exit is not important.
Once in the trade, long or short, the script tests the exit condition on every bar. If not a profitable exit then it checks if a pyramid is required. As mentioned earlier, the entry setups are quite primitive. Although they can easily be replaced by more sophisticated algorithms, what I really wanted to show is the diminished role of the position entry in the overall life of the trade. Professional traders spend much more time on the management of the trade beyond the market entry. While your trade entry is important, you can get in almost anywhere and still land a profitable exit.
If DCA is enabled, the size of the position will increase in response to consecutive losses. The number of times the position can increase is limited by the number set in Maximum DCA Increments of Section 1. Once the position breaks the losing streak the trade size will return the default quantity set in the Properties tab. It should be noted that the Initial Capital amount set in the Properties tab does not affect the simulation in the same way as a real account. In reality, running out of money will certainly halt trading. In fact, your account would be frozen long before the last penny was committed to a trade. On the other hand, TradingView will keep running the simulation until the current bar even if your funds have been technically depleted.
Entry and exit use the strategy.entry and strategy.exit calls respectfully. The alert_message parameter has special keywords that the endpoint expects to properly calculate position size and message sequence. The alert message will embed these keywords in the JSON object through the {{strategy.order.alert_message}} placeholder. You should use whatever keywords are expected from the endpoint you intend to webhook in to.
Webhook Integration
The TradingView alerts dialog provides a way to connect your script to an external system which could actually execute your trade. This is a fantastic feature that enables you to separate the data feed and technical analysis from the execution and reporting systems. Using this feature it is possible to create a fully automated trading system entirely on the cloud. Of course, there is some work to get it all going in a reliable fashion. Being a strategy type script place holders such as {{strategy.position_size}} can be embedded in the alert message text. There are more than 10 variables which can write internal script values into the message for delivery to the specified endpoint.
Entry and exit use the strategy.entry and strategy.exit calls respectfully. The alert_message parameter has special keywords that my endpoint expects to properly calculate position size and message sequence. The alert message will embed these keywords in the JSON object through the {{strategy.order.alert_message}} placeholder. You should use whatever keywords are expected from the endpoint you intend to webhook in to.
Here is an excerpt of the fields I use in my webhook signal:
"broker_id": "kraken",
"account_id": "XXX XXXX XXXX XXXX",
"symbol_id": "XMRUSD",
"action": "{{strategy.order.action}}",
"strategy": "{{strategy.order.id}}",
"lots": "{{strategy.order.contracts}}",
"price": "{{strategy.order.price}}",
"comment": "{{strategy.order.alert_message}}",
"timestamp": "{{time}}"
Though TradingView does a great job in dispatching your alert this feature does come with a few idiosyncrasies. Namely, a single transaction call in your script may cause multiple transmissions to the endpoint. If you are using placeholders each message describes part of the transaction sequence. A good example is closing a pyramid stack. Although the script makes a single strategy.close() call, the endpoint actually receives a close message for each pyramid trade. The broker, on the other hand, only requires a single close. The incongruity of this situation is exacerbated by the possibility of messages being received out of sequence. Depending on the type of order designated in the message, a close or a reversal. This could have a disastrous effect on your live account. This broker simulator has no idea what is actually going on at your real account. Its just doing the job of running the simulation and sending out the computed results. If your TradingView simulation falls out of alignment with the actual trading account lots of really bad things could happen. Like your script thinks your are currently long but the account is actually short. Reversals from this point forward will always be wrong with no one the wiser. Human intervention will be required to restore congruence. But how does anyone find out this is occurring? In closed systems engineering this is known as entropy. In practice your webhook logic should be robust enough to detect these conditions. Be generous with the placeholder usage and give the webhook code plenty of information to compare states. Both issuer and receiver. Don’t blindly commit incoming signals without verifying system integrity.
Setup
The following steps provide a very brief set of instructions that will get you started on your first configuration. After you’ve gone through the process a couple of times, you won’t need these anymore. It’s really a simple script after all. I have several example configurations that I used to create the performance charts shown. I can share them with you if you like. Of course, if you’ve modified the code then these steps are probably obsolete.
There are 47 inputs divided into seven sections. For the most part, the configuration process is designed to flow from top to bottom. Handy, tool tips are available on every field to help get you through the initial setup.
Step 1. Input the Base Currency and Order Size in the Properties tab. Set the Pyramiding value to zero.
Step 2. Select the Trading Mode you intend to test with from the drop down in Section 1. I usually select No Trade until I’ve setup all of the trend lines, profit and stop levels.
Step 3. Put in your Minimum Profit and Stop Loss in the first section. This is in pips or currency basis points (chart right side scale). Remember that the profit is taken as a conditional exit not a fixed limit. The actual profit taken will almost always be greater than the amount specified. The stop loss, on the other hand, is indeed a hard number which is executed by the TradingView broker simulator when the threshold is breached.
Step 4. Apply the appropriate value to the Tick Scalar field in Section 1. This value is used to remove the pipette from the price. You can enable the Summary Report in Section 7 to see the TradingView minimum tick size of the current chart.
Step 5. Apply the appropriate Price Normalizer value in Section 1. This value is used to normalize the instrument price for differential calculations. Basically, we want to increase the magnitude to significant digits to make the numbers more meaningful in comparisons. Though I have used many normalization techniques, I have always found this method to provide a simple and lightweight solution for less demanding applications. Most of the time the default value will be sufficient. The Tick Scalar and Price Normalizer value work together within a single calculation so changing either will affect all delta result values.
Step 6. Turn on the trend line plots in Section 7. Then configure Section 2. Try to get the plots to show you what’s really happening not what you want to happen. The most important is the purple trend line. Select an interval and length that seem to identify where prices tend to go during non-consolidation periods. Remember that a natural exit is when the blue crosses the green line.
Step 7. Enable Show Event Regions in Section 7. Then adjust Section 6. Blue background fills are spikes and red fills are plunging prices. These measurements should be hard to come by so you should see relatively few fills on the chart if you’ve set this up as intended. Section 6 includes the Zscore oscillator the state of which combines with the signal lines to detect statistically significant price movement. The Zscore is a zero based calculation with positive and negative magnitude readings. You want to input a reasonably large number slightly below the maximum amplitude seen on the chart. Both rise and fall inputs are entered as a positive real number. You can easily use my code to create a separate indicator if you want to see it in action. The default value is sufficient for most configurations.
Step 8. Turn off Show Event Regions and enable Show Entry Regions in Section 7. Then adjust Section 3. This section contains two parts. The entry setup crossovers and EMA events. Adjust the crossovers first. That is the Fast Cross Length and Slow Cross Length. The frequency of your trades will be shown as blue and red fills. There should be a lot. Then turn off Show Event Regions and enable Display EMA Peaks. Adjust all the fields that have the word EMA. This is actually the yellow line on the chart. The blue and red fills should show much less than the crossovers but more than event fills shown in Step 7.
Step 9. Change the Trading Mode to BiDir if you selected No Trades previously. Look on the chart and see where the trades are occurring. Make adjustments to the Minimum Profit and Stop Offset in Section 1 if necessary. Wider profits and stops reduce the trade frequency.
Step 10. Go to Section 4 and 5 and make fine tuning adjustments to the long and short side.
Example Settings
To reproduce the performance shown on the chart please use the following configuration: (Bitcoin on the Kraken exchange)
1. Select XBTUSD Kraken as the chart symbol.
2. On the properties tab set the Order Size to: 0.01 Bitcoin
3. On the properties tab set the Pyramiding to: 12
4. In Section 1: Select “Crypto” for the Trading Model
5. In Section 1: Input 2000 for the Minimum Profit
6. In Section 1: Input 0 for the Stop Offset (No Stop)
7. In Section 1: Input 10 for the Tick Scalar
8. In Section 1: Input 1000 for the Price Normalizer
9. In Section 1: Input 2000 for the Pyramid Minimum Span
10. In Section 1: Check mark the Position Bale Out
11. In Section 2: Input 60 for the Signal Line Period
12. In Section 2: Input 1440 for the Trend Line Period
13. In Section 2: Input 5 for the Fast Alma Length
14. In Section 2: Input 22 for the Fast LinReg Length
15. In Section 2: Input 100 for the Slow LinReg Length
16. In Section 2: Input 90 for the Trend Line Length
17. In Section 2: Input 14 Stochastic Length
18. In Section 3: Input 9 Fast Cross Length
19. In Section 3: Input 24 Slow Cross Length
20. In Section 3: Input 8 Fast EMA Length
21. In Section 3: Input 10 Fast EMA Rise NetChg
22. In Section 3: Input 1 Fast EMA Rise ROC
23. In Section 3: Input 10 Fast EMA Fall NetChg
24. In Section 3: Input 1 Fast EMA Fall ROC
25. In Section 4: Check mark the Long Natural Exit
26. In Section 4: Check mark the Long Signal Exit
27. In Section 4: Check mark the Long Price Event Exit
28. In Section 4: Check mark the Long Stochastic Exit
29. In Section 5: Check mark the Short Natural Exit
30. In Section 5: Check mark the Short Signal Exit
31. In Section 5: Check mark the Short Price Event Exit
32. In Section 5: Check mark the Short Stochastic Exit
33. In Section 6: Input 120 Rise Event NetChg
34. In Section 6: Input 1 Rise Event ROC
35. In Section 6: Input 5 Min Above Zero ZScore
36. In Section 6: Input 120 Fall Event NetChg
37. In Section 6: Input 1 Fall Event ROC
38. In Section 6: Input 5 Min Below Zero ZScore
In this configuration we are trading in long only mode and have enabled downward pyramiding. The purple trend line is based on the day (1440) period. The length is set at 90 days so it’s going to take a while for the trend line to alter course should this symbol decide to node dive for a prolonged amount of time. Your trades will still go long under those circumstances. Since downward accumulation is enabled, your position size will grow on the way down.
The performance example is Bitcoin so we assume the trader is buying coins outright. That being the case we don’t need a stop since we will never receive a margin call. New buy signals will be generated when the price exceeds the magnitude and speed defined by the Event Net Change and Rate of Change.
Feel free to PM me with any questions related to this script. Thank you and happy trading!
CFTC RULE 4.41
These results are based on simulated or hypothetical performance results that have certain inherent limitations. Unlike the results shown in an actual performance record, these results do not represent actual trading. Also, because these trades have not actually been executed, these results may have under-or over-compensated for the impact, if any, of certain market factors, such as lack of liquidity. Simulated or hypothetical trading programs in general are also subject to the fact that they are designed with the benefit of hindsight. No representation is being made that any account will or is likely to achieve profits or losses similar to these being shown.

Heikin Ashi Wick Strategy
🔥 Heikin Ashi Wick Momentum Strategy
“Trade momentum decay before the trend breaks.
>> FOCUS ON WICKS, NOT ONLY CANDLE COLOR<<
What Makes This Different (Traffic Driver)
✔ Uses Heikin Ashi wicks (almost nobody does this correctly)
✔ Captures trend continuation, not breakouts
✔ Exits before momentum collapse, not after
✔ Non-repainting
✔ Clean charts, instant readability
This Strategy Is REALLY Trading
This is a Heikin Ashi momentum-decay system:
• Enters when trend is strong but not euphoric
• Exits when:
o Trend stops probing higher
o Sellers gain relative strength
It avoids:
• Chasing strong breakout candles
• Holding through momentum rollovers
Candle Type Used: Heikin Ashi (manually calculated)
NOTE: The script does not use regular candles.
It reconstructs Heikin Ashi (HA) candles from raw OHLC:
• HA Close = average of open, high, low, close
• HA Open = midpoint of prior HA candle (smoothed)
• HA High / Low = extremes of HA open/close vs real high/low
➡️ This filters noise and emphasizes trend structure and momentum.
Strengths
✅ Works well in strong, smooth trends
✅ Very clean logic (no indicators)
✅ Non-repainting
✅ Early exits protect capital
Best Use
This works best on:
• Daily timeframe
• Strong trend ETFs / megacaps
o QQQ
o SPY
o NVDA, MSFT, AAPL
• When combined with:
o EMA 21 trend filter (your preference)
o Market regime filter (e.g., above 50/200 SMA)
o Rising 10 EMA and 20 EMA
________________________________________
8️⃣ Weaknesses (Important)
⚠️ No stop loss (only structure-based exits)
⚠️ Can exit too early in explosive trends
⚠️ Will chop in sideways markets
⚠️ No volatility filter (ATR, EMA, regime)
How to Avoid the Weaknesses — Summary
Turn the setup from a concept into a robust strategy by adding these controls:
1. Trade Only Trends
o Require price above EMA-21 (optionally EMA-21 > EMA-50)
o Eliminates chop and sideways markets
2. Improve Exits (Avoid Leaving Winners Too Early)
o Partial exit when upper wick disappears
o Full exit only when lower wick dominates
o Optional: require 2 consecutive exit candles
3. Add Risk Protection
o Use a volatility stop: ~1.5× ATR(14) below entry or below HA swing low
o Protects against gaps and sudden reversals
4. Filter Weak Signals
o Require meaningful wick size (≈30–40% of candle range)
o Avoids low-quality indecision candles
5. Avoid Bad Volatility
o Skip entries when ATR is expanding aggressively
o Focus on calmer, controllable trends
6. Limit Time in Trade
o Add a max bars hold (e.g., 10–15 bars on daily)
o Prevents capital getting stuck in fading trends
⚠️ Educational use only. Not financial advice. Trading involves risk and losses can exceed expectations. Past performance does not guarantee future results. Use at your own risk.

ChronoPulse MS-MACD Resonance StrategyChronoPulse MS-MACD Resonance Strategy
A systematic trading strategy that combines higher-timeframe market structure analysis with dual MACD momentum confirmation, ATR-based risk management, and real-time quality assurance monitoring.
Core Principles
The strategy operates on the principle of multi-timeframe confluence, requiring agreement between:
Market structure breaks (CHOCH/BOS) on a higher timeframe
Dual MACD momentum confirmation (classic and crypto-tuned profiles)
Trend alignment via directional EMAs
Volatility and volume filters
Quality score composite threshold
Strategy Components
Market Structure Engine : Detects Break of Structure (BOS) and Change of Character (CHOCH) events using confirmed pivots on a configurable higher timeframe. Default structure timeframe is 240 minutes (4H).
Dual MACD Fusion : Requires agreement between two MACD configurations:
Classic MACD: 12/26/9 (default)
Fusion MACD: 8/21/5 (default, optimized for crypto volatility)
Both must agree on direction before trade execution. This can be disabled to use single MACD confirmation.
Trend Alignment : Uses two EMAs for directional bias:
Directional EMA: 55 periods (default)
Execution Trend Guide: 34 periods (default)
Both must align with trade direction.
ATR Risk Management : All risk parameters are expressed in ATR multiples:
Stop Loss: 1.5 × ATR (default)
Take Profit: 3.0 × ATR (default)
Trail Activation: 1.0 × ATR profit required (default)
Trail Distance: 1.5 × ATR behind price (default)
Volume Surge Filter : Optional gate requiring current volume to exceed a multiple of the volume SMA. Default threshold is 1.4× the 20-period volume SMA.
Quality Score Gate : Composite score (0-1) combining:
Structure alignment (0.0-1.0)
Momentum strength (0.0-1.0)
Trend alignment (0.0-1.0)
ATR volatility score (0.0-1.0)
Volume intensity (0.0-1.0)
Default threshold: 0.62. Trades only execute when quality score exceeds this threshold.
Execution Discipline : Trade budgeting system:
Maximum trades per session: 6 (default)
Cooldown bars between entries: 5 (default)
Quality Assurance Console : Real-time monitoring panel displaying:
Structure status (pass/fail)
Momentum confirmation (pass/fail)
Volatility readiness (pass/fail)
Quality score (pass/fail)
Discipline compliance (pass/fail)
Performance metrics (win rate, profit factor)
Net PnL
Certification requires: Win Rate ≥ 40%, Profit Factor ≥ 1.4, Minimum 25 closed trades, and positive net profit.
Integrity Suite : Optional validation panel that audits:
Configuration sanity checks
ATR data readiness
EMA hierarchy validity
Performance realism checks
Strategy Settings
strategy(
title="ChronoPulse MS-MACD Resonance Strategy",
shorttitle="ChronPulse",
overlay=true,
max_labels_count=500,
max_lines_count=500,
initial_capital=100000,
currency=currency.USD,
pyramiding=0,
commission_type=strategy.commission.percent,
commission_value=0.015,
slippage=2,
default_qty_type=strategy.percent_of_equity,
default_qty_value=2.0,
calc_on_order_fills=true,
calc_on_every_tick=true,
process_orders_on_close=true
)
Key Input Parameters
Structure Timeframe : 240 (4H) - Higher timeframe for structure analysis
Structure Pivot Left/Right : 3/3 - Pivot confirmation periods
Structure Break Buffer : 0.15% - Buffer for structure break confirmation
MACD Fast/Slow/Signal : 12/26/9 - Classic MACD parameters
Fusion MACD Fast/Slow/Signal : 8/21/5 - Crypto-tuned MACD parameters
Directional EMA Length : 55 - Primary trend filter
Execution Trend Guide : 34 - Secondary trend filter
ATR Length : 14 - ATR calculation period
ATR Stop Multiplier : 1.5 - Stop loss in ATR units
ATR Target Multiplier : 3.0 - Take profit in ATR units
Trail Activation : 1.0 ATR - Profit required before trailing
Trail Distance : 1.5 ATR - Distance behind price
Volume Threshold : 1.4× - Volume surge multiplier
Quality Threshold : 0.62 - Minimum quality score (0-1)
Max Trades Per Session : 6 - Daily trade limit
Cooldown Bars : 5 - Bars between entries
Win-Rate Target : 40% - Minimum for QA certification
Profit Factor Target : 1.4 - Minimum for QA certification
Minimum Trades for QA : 25 - Required closed trades
Signal Generation Logic
A trade signal is generated when ALL of the following conditions are met:
Higher timeframe structure shows bullish (CHOCH/BOS) or bearish structure break
Both MACD profiles agree on direction (if fusion enabled)
Price is above both EMAs for longs (below for shorts)
ATR data is ready and above minimum threshold
Volume exceeds threshold × SMA (if volume gate enabled)
Quality score ≥ quality threshold
Trade budget available (under max trades per day)
Cooldown period satisfied
Risk Management
Stop loss and take profit are set immediately on entry
Trailing stop activates after 1.0 ATR of profit
Trailing stop maintains 1.5 ATR distance behind highest profit point
Position sizing uses 2% of equity per trade (default)
No pyramiding (single position per direction)
Limitations and Considerations
The strategy requires sufficient historical data for higher timeframe structure analysis
Quality gate may filter out many potential trades, reducing trade frequency
Performance metrics are based on historical backtesting and do not guarantee future results
Commission and slippage assumptions (0.015% + 2 ticks) may vary by broker
The strategy is optimized for trending markets with clear structure breaks
Choppy or ranging markets may produce false signals
Crypto markets may require different parameter tuning than traditional assets
Optimization Notes
The strategy includes several parameters that can be tuned for different market conditions:
Quality Threshold : Lower values (0.50-0.60) allow more trades but may reduce average quality. Higher values (0.70+) are more selective but may miss opportunities.
Structure Timeframe : Use 240 (4H) for intraday trading, Daily for swing trading, Weekly for position trading
Volume Gate : Disable for low-liquidity pairs or when volume data is unreliable
Dual MACD Fusion : Disable for mean-reverting markets where single MACD may be more responsive
Trade Discipline : Adjust max trades and cooldown based on your risk tolerance and market volatility
Non-Repainting Guarantee
All higher timeframe data requests use lookahead=barmerge.lookahead_off to prevent repainting. Pivot detection waits for full confirmation before registering structure breaks. All visual elements (tables, labels) update only on closed bars.
Alerts
Three alert conditions are available:
ChronoPulse Long Setup : Fires when all long entry conditions are met
ChronoPulse Short Setup : Fires when all short entry conditions are met
ChronoPulse QA Certification : Fires when Quality Assurance console reaches CERTIFIED status
Configure alerts with "Once Per Bar Close" delivery to match the non-repainting design.
Visual Elements
Structure Labels : CHOCH↑, CHOCH↓, BOS↑, BOS↓ markers on structure breaks
Directional EMA : Orange line showing trend bias
Trailing Stop Lines : Green (long) and red (short) trailing stop levels
Dashboard Panel : Real-time status display (structure, MACD, ATR, quality, PnL)
QA Console : Quality assurance monitoring panel
Integrity Suite Panel : Optional validation status display
Recommended Usage
Forward test with paper trading before live deployment
Monitor the QA console until it reaches CERTIFIED status
Adjust parameters based on your specific market and timeframe
Respect the trade discipline limits to avoid over-trading
Review quality scores and adjust threshold if needed
Use appropriate commission and slippage settings for your broker
Technical Implementation
The strategy uses Pine Script v6 with the following key features:
Multi-timeframe data requests with lookahead protection
Confirmed pivot detection for structure analysis
Dynamic trailing stop management
Real-time quality score calculation
Trade budgeting and cooldown enforcement
Comprehensive dashboard and monitoring panels
All source code is open and available for review and modification.
Disclaimer
This script is for educational and informational purposes only. It is not intended as financial, investment, or trading advice. Past performance does not guarantee future results. Trading involves substantial risk of loss and is not suitable for all investors. Always conduct your own research and consult with a qualified financial advisor before making any trading decisions. The author and TradingView are not responsible for any losses incurred from using this strategy.

Dual MTF Confirmed Trend Strategy (5m Entry / 15m MACD & RSI) v1That is a detailed Dual Multi-Timeframe (MTF) Confirmed Trend Strategy written in Pine Script for TradingView. The core idea of this strategy is to only take entry signals on a faster timeframe (5-minute) when the trend is strongly confirmed on a slower, higher timeframe (15-minute). This aims to reduce false signals and trade in the direction of the dominant trend. Here is an explanation of how the strategy works, broken down by section:
1. 5-Minute Entry Filters 🚀This section calculates several indicators on the current 5-minute chart to identify potential trade setups. A position is only considered if all 5-minute conditions align.
Supertrend: A trend-following indicator based on Average True Range (ATR).
Long Condition: The closing price must be above the Supertrend line.
Short Condition: The closing price must be below the Supertrend line.
Gann Hi-Lo (GHL): A trend indicator using Simple Moving Averages (SMA) of the high and low prices. GHL Line: Switches between the SMA of the Highs and the SMA of the Lows based on price action.
Long Condition: The closing price must be above the GHL line.
Short Condition: The closing price must be below the GHL line.
Exponential Moving Averages (EMAs): It uses a 50-period EMA and a 100-period EMA to confirm the short-term trend direction.
Long Condition: The closing price must be above both the 50 EMA and the 100 EMA.
Short Condition: The closing price must be below both the 50 EMA and the 100 EMA.
2. 15-Minute MTF Confirmation Filters ⏳This is the crucial step where the strategy verifies the trend on the slower, 15-minute timeframe using the request security function. This step acts as a gatekeeper to ensure the 5-minute trade aligns with the larger trend.
MACD Histogram (12, 26, 9): The difference between the MACD Line and the Signal Line.
Long Confirmation: The 15m MACD Histogram must be greater than 0 (MACD line is above the Signal line, indicating bullish momentum).
Short Confirmation: The 15m MACD Histogram must be less than 0 (MACD line is below the Signal line, indicating bearish momentum).
RSI (Relative Strength Index) (14): A momentum oscillator. The 50 level is often used to determine the general market trend.
Long Confirmation: The 15m RSI must be greater than 50 (indicating stronger bullish momentum).
Short Confirmation: The 15m RSI must be less than 50 (indicating stronger bearish momentum).
The Total 15m Confirmation is only true if both the MACD and the RSI confirmation signals align.
3. Trade Orders (Entry Logic) ⚖️
The strategy only executes a trade when the 5-minute entry conditions are met AND the 15-minute confirmation conditions are met.
Final Long Condition:
5m Conditions (Supertrend, GHL, EMA alignment) AND
15m Confirmation (MACD Hist > 0 AND RSI > 50)
Final Short Condition:
5m Conditions (Supertrend, GHL, EMA alignment) AND
15m Confirmation (MACD Hist < 0 AND RSI < 50)
When a trade signal is generated, the strategy:
Closes any opposite position (e.g., closes a "Short" trade if a "Long" signal appears).
Enters the new position (e.g., enters a "Long" trade).
This is designed as a reversal strategy where a new entry automatically closes the previous opposing trade.
In Summary
The strategy operates on a principle of Trend Alignment:
5-Minute Chart: Is used for Signal Timing (when exactly to enter the market).
15-Minute Chart: Is used for Trend Validation (is the overall market momentum supporting the signal?).
It's an attempt to capture short-term moves (5m signals) that are backed by strong medium-term momentum (15m confirmation), thereby aiming for higher probability trades.
This is not investment advice; it is recommended to perform optimization and backtesting for the assets intended for implementation.

VWolf – Apex GateOverview
VWolf – Apex Gate is a trend-continuation system that blends a Pivot-weighted Supertrend (PVT ST) with an optional **Normal Supertrend** trigger, all **gated by a 200-EMA directional filter. The strategy’s risk controls are volatility-aware—**stops and targets scale by ATR**, and quantity is computed from a fixed **% risk per trade**. Clear **Backtest / Forwardtest** modes with date windows let you validate on segmented datasets before committing to live use.
Recommended Use
- **Markets:** High-liquidity instruments (indices, large-cap equities, liquid FX and major crypto pairs) where trends and pullbacks are clean.
- **Timeframes:** 15m–1h for active intraday; 4h–1D for swing. Lower timeframes may benefit from stricter EMA gating and slightly wider ATR stops.
- **Workflow:**
1. Start with **Backtest** to set baseline ATR/EMA parameters.
2. Move to **Forwardtest** to confirm generalization.
3. Consider walk-forward or multi-symbol rotation to assess robustness.
Strengths & Precautions
Strengths
- **Dual engine** (PVT ST + Normal ST) improves signal quality; the **EMA gate** screens counter-trend noise.
- **ATR-native** stops/targets standardize risk across regimes/instruments.
- **Capital-proportional sizing** preserves account geometry and smooths drawdowns.
- **Clear test segmentation** supports objective evaluation.
Precautions
- **Whipsaw risk** in tight ranges: widen ATR multipliers, enable the EMA gate, or require co-confirmation.
- **Supertrend-anchored stops** can expand in volatility spikes; ensure **% risk** remains within tolerance.
- **One-position policy** avoids stacking risk but forgoes scaling into strong trends; advanced users may prefer add-on frameworks outside this baseline.
Conclusion
VWolf – Apex Gate seeks to enter shortly after **regime flips**, demanding alignment between a **pivot-aware Supertrend** and (optionally) a **classic Supertrend**, while an **EMA gate** enforces directional discipline. With **ATR-driven** stops/targets and **fixed-fraction** sizing, the system adapts naturally to changing volatility. Use the **Backtest** window to dial ranges and the **Forwardtest** window to prove durability on unseen data. For best results, tailor ATR multipliers and the EMA gate to your instrument’s structure and your personal drawdown tolerance.

Braid Filter StrategyThis strategy is like a sophisticated set of traffic lights and speed limit signs for trading. It only allows a trade when multiple indicators line up to confirm a strong move, giving it its "Braid Filter" name—it weaves together several conditions.
The strategy is set up to use 100% of your account equity (your trading funds) on a trade and does not "pyramid" (it won't add to an existing trade).
1. The Main Trend Check (The Traffic Lights)
The strategy uses three main filters that must agree before it considers a trade.
A. The "Chad Filter" (Direction & Strength)
This is the heart of the strategy, a custom combination of three different Moving AveragesThese averages have fast, medium, and slow settings (3, 7, and 14 periods).
Go Green (Buy Signal): The fastest average is higher than the medium average, AND the three averages are sufficiently separated (not tangled up, which indicates a strong move).
Go Red (Sell Signal): The medium average is higher than the fastest average, AND the three averages are sufficiently separated.
Neutral (Wait): If the averages are tangled or the separation isn't strong enough.
Key Trigger: A primary condition for a signal is when the Chad Filter changes color (e.g., from Red/Grey to Green).
B. The EMA Trend Bars (Secondary Confirmation)
This is a simpler, longer-term filter using a 34-period Exponential Moving Average (EMA). It checks if the current candle's average price is above or below this EMA.
Green Bars: The price is above the 34 EMA (Bullish Trend).
Red Bars: The price is below the 34 EMA (Bearish Trend).
Trades only happen if the signal direction matches the bar color. For a Buy, the bar must be Green. For a Sell, the bar must be Red.
C. ADX/DI Filter (The Speed Limit Sign)
This uses the Average Directional Index (ADX) and Directional Movement Indicators (DI) to check if a trend is actually in motion and getting stronger.
Must-Have Conditions:
The ADX value must be above 20 (meaning there is a trend, not just random movement).
The ADX line must be rising (meaning the trend is accelerating/getting stronger).
The strategy will only trade when the trend is strong and building momentum.
2. The Trading Action (Entry and Exit)
When all three filters (Chad Filter color change, EMA Trend Bar color, and ADX strength/slope) align, the strategy issues a signal, but it doesn't enter immediately.
Entry Strategy (The "Wait-for-Confirmation" Approach):
When a Buy Signal appears, the strategy sets a "Buy Stop" order at the signal candle's closing price.
It then waits for up to 3 candles (Candles Valid for Entry). The price must move up and hit that Buy Stop price within those 3 candles to confirm the move and enter the trade.
A Sell Signal works the same way but uses a "Sell Stop" at the closing price, waiting for the price to drop and hit it.
Risk Management (Stop Loss and Take Profit):
Stop Loss: To manage risk, the strategy finds a recent significant low (for a Buy) or high (for a Sell) over the last 20 candles and places the Stop Loss there. This is a logical place where the current move would be considered "broken" if the price reaches it.
Take Profit: It uses a fixed Risk:Reward Ratio (set to 1.5 by default). This means the potential profit (Take Profit distance) is $1.50 for every $1.00 of risk (Stop Loss distance).
3. Additional Controls
Time Filter: You can choose to only allow trades during specific hours of the day.
Visuals: It shows a small triangle on the chart where the signal happens and colors the background to reflect the Chad Filter's trend (Green/Red/Grey) and the candle bars to show the EMA trend (Lime/Red).
🎯 Summary of the Strategy's Goal
This strategy is designed to capture strong, confirmed momentum moves. It uses a fast, custom indicator ("Chad Filter") to detect the start of a new move, confirms that move with a slower trend filter (34 EMA), and then validates the move's strength with the ADX. By waiting a few candles for the price to hit the entry level, it aims to avoid false signals.
