Perfect Price-Anchored % Fib Grid This indicator generates support and resistance levels anchored to a fixed price of your choice.
You can also specify a percentage for the indicator to calculate potential highs and lows.
Commonly used values are 3.5% or 7%, as well as smaller decimal versions like 0.35% or 0.7%, depending on the volatility you expect.
In addition, the indicator can highlight potential stop-run levels in multiples of 27 — ranging from 0 up to 243. This automatically places the 243 GB range directly onto your chart.
The tool is versatile and can be applied not only to equities, but also to ES futures and Forex markets.
Поиск скриптов по запросу "fib"

ORB with Fib Levels - TradingbrockOpening Range (OR) Indicator Overview
This TradingView indicator analyzes and displays the Opening Range - a popular day trading concept that tracks price movement during the first 30-60 minutes of the trading session.
Core Functionality:
Opening Range Detection: By default, it monitors the 9:30-10:00 AM ET period and tracks the highest high and lowest low during this time frame, creating upper and lower boundaries.
Fibonacci Retracement Levels: Inside the opening range, it displays five key Fibonacci levels:
0.236 (23.6% - shallow retracement)
0.382 (38.2% - standard retracement)
0.500 (50% - halfway point)
0.618 (61.8% - golden ratio)
0.786 (78.6% - deep retracement)
Extension Levels: The indicator projects additional levels beyond the opening range:
1x extension above/below the range
2x extension levels that only appear when price breaks the first extension
Trading Applications:
Support & Resistance: The opening range high/low often act as key levels throughout the trading day
Breakout Trading: Many traders watch for price to break above or below the opening range
Mean Reversion: The Fibonacci levels within the range can serve as potential reversal points
Risk Management: Helps define clear levels for stop losses and profit targets
The indicator essentially gives traders a framework to understand how price is behaving relative to the early session's established range, which often sets the tone for the entire trading day.

Indicator 102#M3indicator based on Daily and weekly fib Level. Initial Breakout and breakdowns have been denoted as well

ORB with Golden Zone FIB targets, Any Timeframe by TenAMTraderDescription:
This indicator is designed to help traders identify key price levels using Fibonacci extensions and retracements based on the Opening Range Breakout (ORB). The levels are visualized as “Golden Zones”, which can serve as potential targets for trades.
Features:
Customizable ORB Timeframe: By default, the ORB is set from 9:30 AM to 9:45 AM EST, but any timeframe can be configured in the settings to fit your trading style.
Golden Zones as Targets: Fibonacci levels are intended to be used as potential profit-taking zones or areas to monitor for reversals, providing a structured framework for intraday and swing trading.
Adjustable Chart Settings: Color-coded levels make it easy to interpret at a glance, and all lines can be customized for personal preference.
Versatile Application: The indicator works across any timeframe, enabling traders to analyze both intraday and multi-day price action.
How to Use:
Ensure Regular Trading Hours (RTH) is enabled on your chart for accurate level calculation.
Observe price action near Golden Zones: a confirmed breakout may indicate continuation, while a pullback could signal a reversal opportunity.
Use the Golden Zones as reference targets for managing risk and planning exits.
Adjust the ORB timeframe and display settings to match your preferred trading style.
Legal Disclosure:
This indicator is provided for educational purposes only and is not financial advice. Trading carries a substantial risk of loss. Users should always perform their own analysis and consult a licensed financial professional before making any trading decisions. Past performance is not indicative of future results.

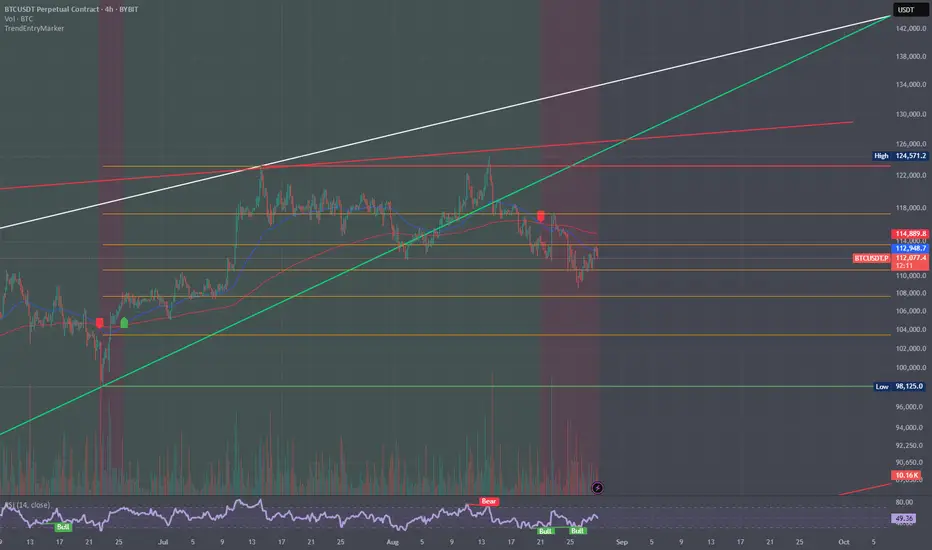
Trend and Entry Marker with MA, Supports, Fib, and Trend LinesJust a little indicator I made when I was bored ...
Helps you find entries for trades!
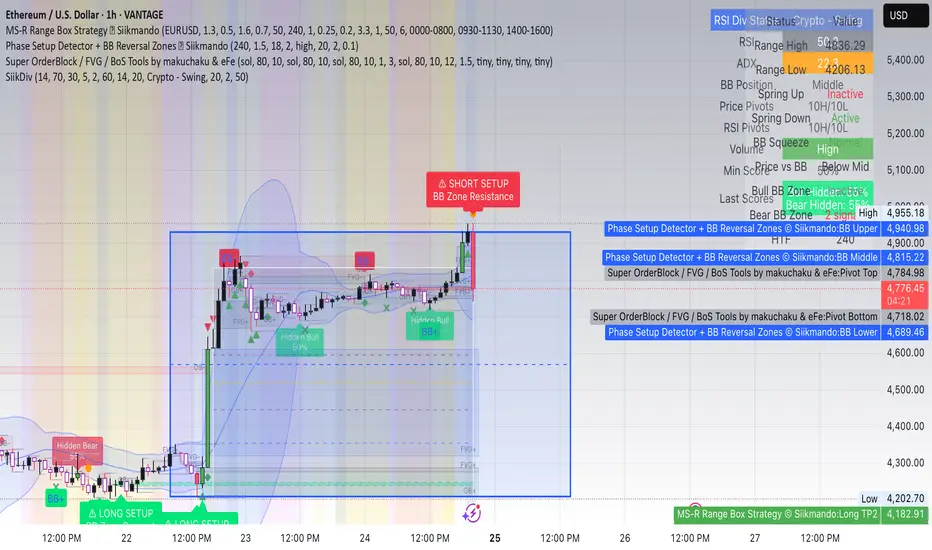
SiikmandoPhase Setup Detector + BB Reversal Zones © — Designed by Siikmando
The Phase Setup Detector is a professional-grade trading framework built to identify market phases, spring/retest setups, and risk-to-reward ranges with precision. By integrating Bollinger Band Reversal Zones, the system highlights points of volatility contraction (squeezes), expansions, and reversal signals at the outer bands—adding powerful confluence to Wyckoff-style phase transitions.
Key features:
Detects impulse & corrective phases with body-to-wick logic.
Marks spring/retest events for high-probability entries.
Dynamically builds range boxes, fib levels, and R:R zones.
Integrates Bollinger Band Squeeze/Expansion/Reversal Zones for confirmation.
Supports multi-timeframe analysis and volume/momentum filters.
Includes alerts & dashboard table for real-time trade decisions.
This tool is optimized for intraday and swing traders seeking structured setups, visual clarity, and actionable alerts, while remaining lightweight and efficient on TradingView.
EMA + Dynamic Fib TradeNestDescription:
This custom indicator combines Exponential Moving Averages (EMA) and Ichimoku to provide a momentum and trend-based framework for day trading.
9 EMA and 21 EMA are used to identify short-term momentum shifts. A bullish signal occurs when the 9 EMA crosses above the 21 EMA, suggesting potential call opportunities, while a bearish signal occurs when the 9 EMA crosses below the 21 EMA, suggesting potential put opportunities.
50 EMA is included as an additional trend filter to help confirm overall market direction.
Ichimoku is plotted as a forward-looking dynamic support/resistance level. It behaves similarly to a Fibonacci retracement level, offering context for where price may find support or rejection. Ichimoku also helps determine whether current price action is aligned with a bullish or bearish trend environment.
By combining EMA crossovers with Ichimoku levels, this indicator provides a simple yet powerful method for identifying momentum entries and gauging the strength of price action relative to dynamic support/resistance.


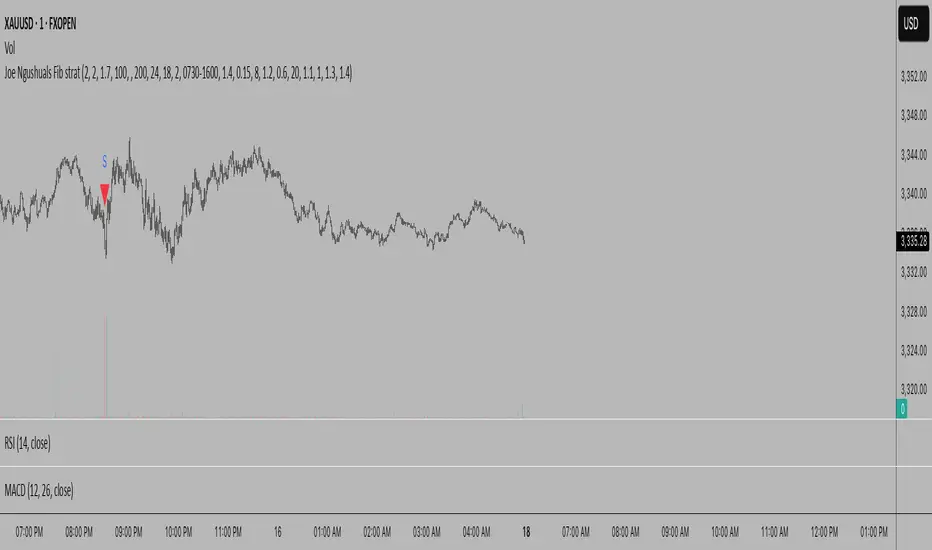
Joe Ngushuals Fib stratThis tool is the ideal choice for developing effective Futures trading strategies. It provides you with precise entry points that indicate the optimal times to buy or sell. With an impressive win rate of 90%, it significantly enhances your chances of success in the market
Triple Pivot Fib Levels Multi-Timeframe# 📈 Triple Pivot Fibonacci Levels Multi-Timeframe
## 🎯 Description
Advanced indicator that displays **three independent Fibonacci level sets** across different timeframes, enabling identification of **confluence zones** and key levels for multi-temporal trading strategies.
## ✨ Key Features
- **🔵 Fibonacci 1**: Primary analysis (default: Daily)
- **🟠 Fibonacci 2**: Intermediate analysis (default: 1H)
- **🟢 Fibonacci 3**: Complementary analysis (default: 4H)
## 📊 Included Levels
**Retracements**: 0%, 38.2%, 50%, 61.8%, 79%, 89%, 100%
**Extensions**: 112%, 127%, 162%
## ⚙️ Features
✅ **Multi-timeframe**: Each Fibonacci uses pivots from different timeframes
✅ **Full customization**: Colors, line thickness, label positioning
✅ **Alert system**: Notifications when price touches levels
✅ **Invert Fibonacci**: For bullish or bearish trends
✅ **Countdown**: Timer for current candle close
✅ **Memory optimization**: Automatic deletion of previous elements
## 🎨 Customization Options
- Colors and styles for each Fibonacci set
- Label positioning (right/left/both)
- Adjustable alert sensitivity
- Configurable pivot timeframes
## 💡 Strategic Usage
Perfect for identifying:
- **Confluence zones** between different timeframes
- **Multi-temporal support/resistance** levels
- **Precise entry/exit points**
- **Price targets** for take profits
## 🚀 Ideal For
- Swing Trading
- Multi-timeframe Day Trading
- Advanced Technical Analysis
- Fibonacci Confluence Strategies
---
*Complete indicator for traders who want to harness the power of Fibonacci levels across multiple time dimensions.*

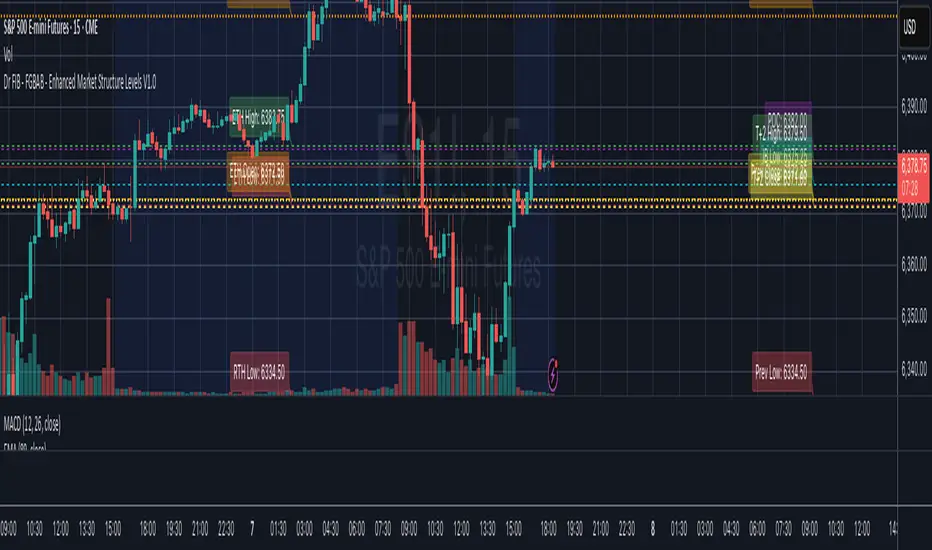
Dr FIB - FGBAB - Enhanced Market Structure Levels V1.0Based on Market Profile Auction Theory this indicator will provide you will key levels that will help you tailor your trading and structure the market movements properly.
This indicator will provide the following information on the chart in any time frame you select and for any instrument including Futures, Stocks and Crypto.
The levels will be provided as fully configurable horizontal lines including the following data:
- Regular trading hours HIGH, LOW and OPEN.
- Extended Trading Hours HIGH, LOW, OPEN.
- Previous Day HIGH, LOW, CLOSE.
- T+2 Settlement HIGH, LOW and CLOSE.
- Point of Control (POC).
- Initial Balance HIGH and LOW. (1st hour RTH Open).
As price tend to re-visit well know price areas, you will find this indicator very useful for day to day trading.
Dr. Fib - FGBAB - Open Range Breakout for Indexes v2.0 *** EXCLUSIVELY FOR INDEXES ***
This Open Range Breakout Indicator (ORB) helps your discretionary trading when looking for breakouts on the 15 mins range; and you can use it on small time frames to time your entries with more precision.
This indicator helps your discretionary trading by allowing visual settings that helps discretionary trades to make faster decisions.
It will provide you will the following on-screen information:
- ORB HIGH and LOW: The Open Range Breakout set by the input parameters, for example the first 15 mins RTH Open from 9:30 to 6:45.-
- ORB MID: The ORB mid point for reference, generally the price tends to return and bounce from the 50% ORB.
Reward to Risk posible targets for LONG and SHORT trades: This will provide target value references, it is based on the ORB Risk from high to low, you have 1:1, 2:1, 3:1 and 4:1 possible targets in both directions.
Reference table:
The reference table is a visual setting for you to have at first sight important information before considering getting into the trade:
- ORB HIGH and LOW.
- Risk in points.
- Risk in USD.
- Amount of contracts considering the MaxRisk input parameter you select.
- The current LIVE R:R based on the entry, if price is abobe ORB High it will simulate a LONG position is price is below the ORB Low it will simulate a SHORT position,
- The LIVE profit simulation based on the above.
- MaxRunUP, the highest equity the trade simulation has produced.
Direction: The current trade direction simulation based on the ORB HIGH or ORB LOW.
This new version (2.0) will provide historical ORB's and Target in the chart so you can use for future references and past performance analysis.
Keep in mind this indicator is a "gauge" a visual help for discretionary traders that like to trade Open Range Breakout strategy.
It will reset the ORB at RTH Close and build a new ORB at next RTH calendar day based in the ORB time you have selected by the input parameters.
Please feel free to use in your own trading at your own discretion.

Dr. Fib - FGBAB - Open Range Breakout for Stocks V1.0This Open Range Breakout Indicator (ORB) helps your discretionary trading when looking for breakouts on the 15 mins range.
This indicator helps your discretionary trading by allowing visual settings that helps discretionary trades to make faster decisions.
It will provide you will the following on-screen information:
- ORB HIGH and LOW: The Open Range Breakout set by the input parameters, for example the first 15 mins RTH Open from 9:30 to 6:45.-
- ORB MID: The ORB mid point for reference, generally the price tends to return and bounce from the 50% ORB.
Reward to Risk posible targets for LONG and SHORT trades: This will provide target value references, it is based on the ORB Risk from high to low, you have 1:1, 2:1, 3:1 and 4:1 possible targets in both directions.
Reference table:
The reference table is a visual setting for you to have at first sight important information before considering getting into the trade:
- ORB HIGH and LOW.
- Risk in points.
- Risk in USD.
- Amount of shares considering the MaxRisk input parameter you select.
- The current LIVE R:R based on the entry, if price is abobe ORB High it will simulate a LONG position is price is below the ORB Low it will simulate a SHORT position,
- The LIVE profit simulation based on the above.
- MaxRunUP, the highest equity the trade simulation has produced.
Direction: The current trade direction simulation based on the ORB HIGH or ORB LOW.
Keep in mind this indicator is a "gauge" a visual help for discretionary traders that like to trade Open Range Breakout strategy.
It will reset the ORB at RTH Close and build a new ORB at next calendar day based in the ORB time you have selected by the input parameters.
Please feel free to use in your own trading at your discretion.

Confluence Indicator: Fib, MACD, SMA 50/200This is a scalping indicator best used on the 1hour and 15min charts

TargetsLevels. ATR fib magic. Works on any index or stock. Must have extended hours turned on.
Generally breaking above/below blue lines can indicate a target of above or below levels.

MJBFX-Strategy (Futures Optimized)The MJBFX-Strategy is a complete market mapping tool designed to give traders a clear view of liquidity, session dynamics, and premium/discount levels. It loads automatically on any chart, fully optimized for futures and forex trading.
🔑 Key Features
Asian Session Range
Highlights the previous Asian session with a shaded box
Fixed until London open for precise reference
VWAP from Asian Session
Plots the VWAP of the previous Asian session
Dynamic fair value benchmark for intraday trading
Liquidity Sweeps (Optimized)
Detects sweeps of the Asian session high/low
Shown only on 30m, 1h, and 4h charts to reduce noise
Clean, minimal labels for clarity
Automatic Fibonacci Zone
Draws a shaded retracement zone (38.2%–61.8%) of the Asian range
Transparent fill makes it easy to read price action
Killzones
Highlights London (07:00–10:00) and New York (13:00–16:00) killzones
Semi-opaque shading to keep charts clean
Auto Trade Box (Risk/Reward)
On sweep confirmation, plots a 2R target box
Auto stop loss and take profit levels based on futures tick size
🎯 Why Use It?
The MJBFX-Strategy removes the need for manual drawing.It automatically maps:
Session highs and lows
Liquidity sweeps
VWAP and fib retracement zones
Key killzones
Perfect for session-based intraday trading in both futures and forex.
⚡ No manual settings required.Just load it onto your chart for an instant institutional view of the market.

Level System DTWelcome to Level System This is a automated Tradeing Level system that uses Divergence Fibs TMC Pivots and Fractal calculations to gives traders support and resistance levels on all time frames... This has been built by DrZayas and DrTrade.. There will be future updates Please Enjoy and let us know if you have any issues

Auto Fib Extension with alert (golden rentry zone)Ideal for:
Traders who want an objective, auto-updating Fibonacci framework to identify potential continuation, or reaction zones after significant highs. The “Golden zone” highlights an area of particular interest for bounces, reactions, or consolidations. Once, price renters the Golden zone, 40% of the time, it will lead to 1.68 and 2.68 levels, making 80 to 200% once all time high is broken!!
This script automatically detects major swing points (all-time high and following swing low) using the last 1 year or 6 months of data, then draws Fibonacci retracement and extension levels from the all-time high (ATH) down to the lowest low after that high.
What it does:
Detects All-Time High (ATH) within your chosen lookback window (default: 1 year, falls back to 6 months if insufficient bars).
Finds the lowest low after ATH within the lookback period (ensures swing low always comes after swing high).
Plots Fibonacci retracement levels (0, 0.236, 0.382, 0.5, 0.618, 0.786, 1) from ATH to the swing low.
Issues an alert if price enters the Golden zone (between 0.236 and 0.382).

Quantum Dip Hunter | AlphaNattQuantum Dip Hunter | AlphaNatt
🎯 Overview
The Quantum Dip Hunter is an advanced technical indicator designed to identify high-probability buying opportunities when price temporarily dips below dynamic support levels. Unlike simple oversold indicators, this system uses a sophisticated quality scoring algorithm to filter out low-quality dips and highlight only the best entry points.
"Buy the dip" - but only the right dips. Not all dips are created equal.
⚡ Key Features
5 Detection Methods: Choose from Dynamic, Fibonacci, Volatility, Volume Profile, or Hybrid modes
Quality Scoring System: Each dip is scored from 0-100% based on multiple factors
Smart Filtering: Only signals above your quality threshold are displayed
Visual Effects: Glow, Pulse, and Wave animations for the support line
Risk Management: Automatic stop-loss and take-profit calculations
Real-time Statistics: Live dashboard showing current market conditions
📊 How It Works
The indicator calculates a dynamic support line using your selected method
When price dips below this line, it evaluates the dip quality
Quality score is calculated based on: trend alignment (30%), volume (20%), RSI (20%), momentum (15%), and dip depth (15%)
If the score exceeds your minimum threshold, a buy signal arrow appears
Stop-loss and take-profit levels are automatically calculated and displayed
🚀 Detection Methods Explained
Dynamic Support
Adapts to recent price action
Best for: Trending markets
Uses ATR-adjusted lowest points
Fibonacci Support
Based on 61.8% and 78.6% retracement levels
Best for: Pullbacks in strong trends
Automatically switches between fib levels
Volatility Support
Uses Bollinger Band methodology
Best for: Range-bound markets
Adapts to changing volatility
Volume Profile Support
Finds high-volume price levels
Best for: Identifying institutional support
Updates dynamically as volume accumulates
Hybrid Mode
Combines all methods for maximum accuracy
Best for: All market conditions
Takes the most conservative support level
⚙️ Key Settings
Dip Detection Engine
Detection Method: Choose your preferred support calculation
Sensitivity: Higher = more sensitive to price movements (0.5-3.0)
Lookback Period: How far back to analyze (20-200 bars)
Dip Depth %: Minimum dip size to consider (0.5-10%)
Quality Filters
Trend Filter: Only buy dips in uptrends when enabled
Minimum Dip Score: Quality threshold for signals (0-100%)
Trend Strength: Required trend score when filter is on
📈 Trading Strategies
Conservative Approach
Use Dynamic method with Trend Filter ON
Set minimum score to 80%
Risk:Reward ratio of 2:1 or higher
Best for: Swing trading
Aggressive Approach
Use Hybrid method with Trend Filter OFF
Set minimum score to 60%
Risk:Reward ratio of 1:1
Best for: Day trading
Scalping Setup
Use Volatility method
Set sensitivity to 2.0+
Focus on Target 1 only
Best for: Quick trades
🎨 Visual Customization
Color Themes:
Neon: Bright cyan/magenta for dark backgrounds
Ocean: Cool blues and teals
Solar: Warm yellows and oranges
Matrix: Classic green terminal look
Gradient: Smooth color transitions
Line Styles:
Solid: Clean, simple line
Glow: Adds depth with glow effect
Pulse: Animated breathing effect
Wave: Oscillating wave pattern
💡 Pro Tips
Start with the Trend Filter ON to avoid catching falling knives
Higher quality scores (80%+) have better win rates but fewer signals
Use Volume Profile method near major support/resistance levels
Combine with your favorite momentum indicator for confirmation
The pulse animation can help draw attention to key levels
⚠️ Important Notes
This indicator identifies potential entries, not guaranteed profits
Always use proper risk management
Works best on liquid instruments with good volume
Backtest your settings before live trading
Not financial advice - use at your own risk
📊 Statistics Panel
The live statistics panel shows:
Current detection method
Support level value
Trend direction
Distance from support
Current signal status
🤝 Support
Created by AlphaNatt
For questions or suggestions, please comment below!
Happy dip hunting! 🎯
Not financial advice, always do your own research

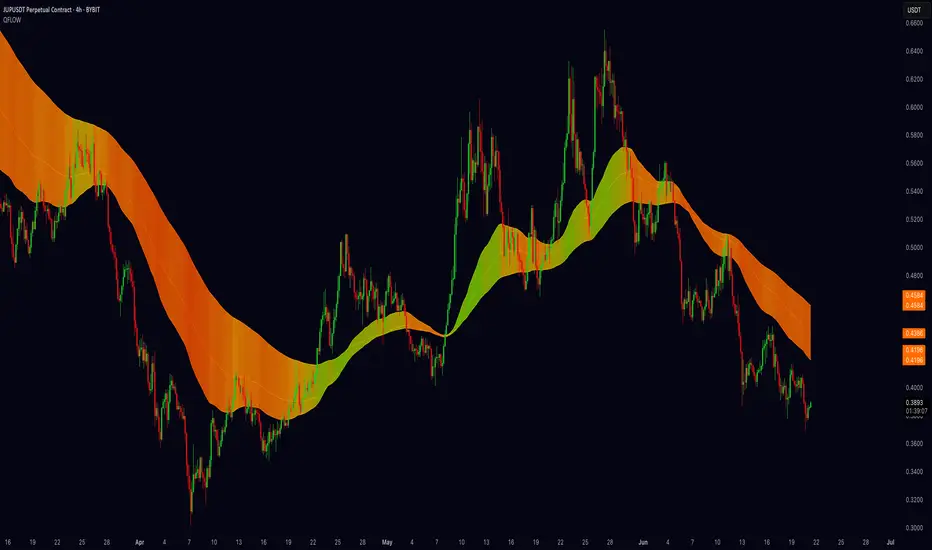
Quantum Fibonacci Flow
Quantum Fib Ribbon (QFLOW)
📖 How It Works
A three-band ribbon built from Fibonacci-scaled moving averages, filled and colored to reflect current momentum strength and direction.
Green when bullish flow is strong, red when bearish flow dominates, and orange in between to highlight slowing momentum.
⚙️ Key Controls
* Base Length: Adjusts the ribbon’s overall lookback.
* Ribbon Opacity: How solid or translucent the fill appears.
* Momentum Scale & Exponent: Fine-tune how sensitively the ribbon reacts to price speed versus volatility.
* Override Threshold: Determines at what momentum level the ribbon “snaps” to full green or red.
🚨 Over-Extension Logic
When price extends significantly above or below the ribbon, it often signals exhaustion.
The first return to the ribbon after such an extension frequently acts as strong support or resistance — offering high-probability trade setups.
🔺 Optional Trade Signals
Enable the over-extension alert to mark these key areas:
* A green triangle shows price extended below the ribbon, then retested → potential long.
* A red triangle shows price extended above, then retested → potential short.
🎯 How to Trade
• Breakout-Retest Setup: Watch for over-extended price moves. The first comeback to the ribbon often marks key levels of interest for a reversal or continuation.
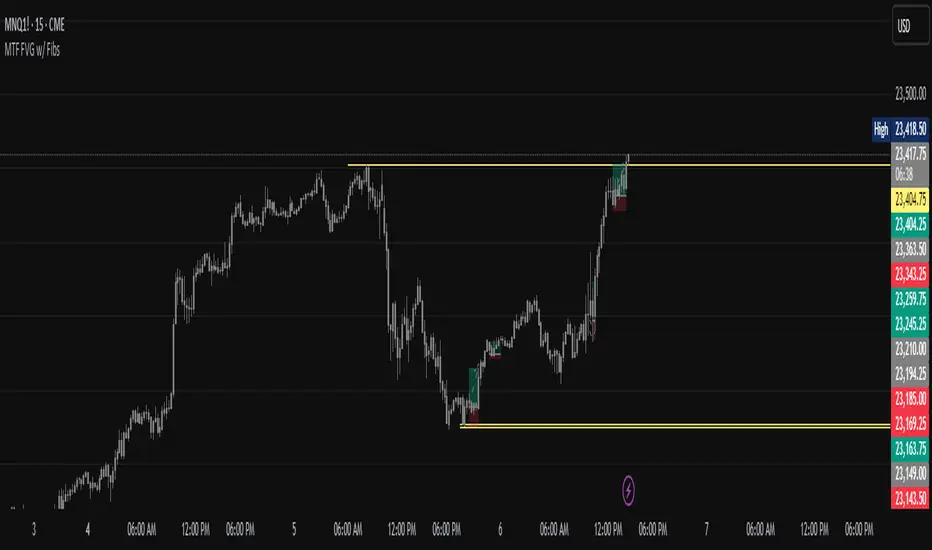
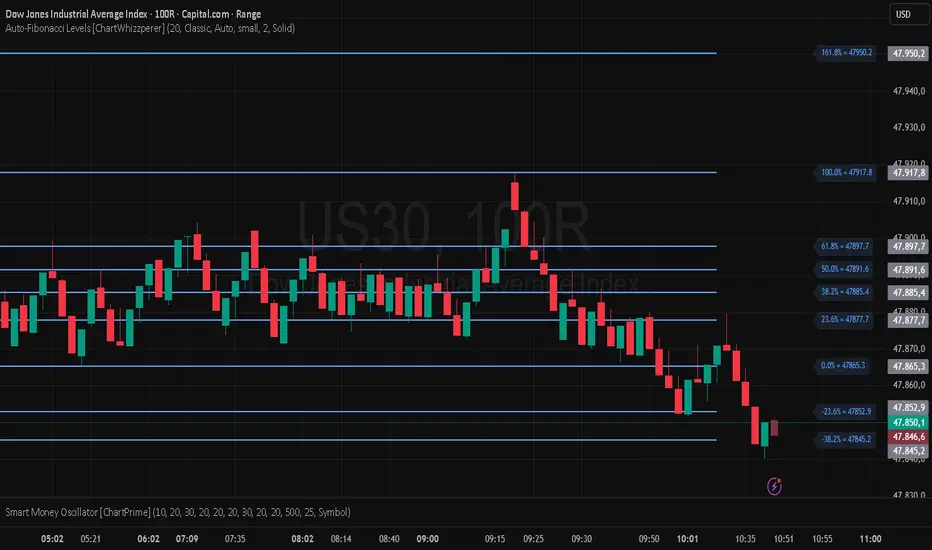
Auto-Fibonacci Levels [ChartWhizzperer]Auto-Fibonacci Levels
Discover one of the most elegant and flexible Fibonacci indicators for TradingView – fully automatic, tastefully understated, and built entirely in Pine Script V6.
Key Features:
- Automatically detects the most recent swing high and swing low.
- Plots Fibonacci retracement levels and extensions (including 161.8%, 261.8%) perfectly aligned
to the prevailing trend.
- Distinctive, dashed lines with crystal-clear price labels right at the price scale
for maximum clarity.
- Line length and label offset are fully customisable for your charting preference.
- Absolutely no repainting: Only confirmed swings are used for reliable signals.
- Parameter: "Swing Detection Length"
The “Swing Detection Length” parameter determines how many bars must appear to the left and right of a potential high or low for it to be recognised as a significant swing point.
- Higher values make the script less sensitive (only major turning points are detected).
- Lower values make it more responsive to minor fluctuations (more fibs, more signals).
For best results, adjust this setting according to your preferred timeframe and trading style.
Pro Tip:
Fibonacci levels refresh automatically whenever a new swing is confirmed.
Ideal for price action enthusiasts and Fibonacci purists alike.
Licence:
// Licence: CC BY-NC-SA 4.0 – Non-commercial use only, attribution required.
// © ChartWhizzperer
Volume VA with POC Based Percent DeviationsThis is a slightly different take on my previous version that plotted fibonacci retracement levels based on the POC to value area high/low.
This indicator is also based on the volume value area that plots developing POC, VAH, and VAL as well as historical levels. However, instead of plotting fib levels, this script automatically projects percentage deviation levels from the current POC. This can help identify potential overextensions, target areas, or mean-reversion setups.
Knowing where price is and the change in price relative to areas of interest can help identify true value and market imbalances. Hence the name VALUE AREA :)
The percent deviation levels are dynamically plotted in relation to the developing POC. As POC shifts so do the % levels.
Gradient Value Area Fill: Instead of a static color, the Value Area is filled with a dynamic gradient. The adjustable color and transparency shift is based on the current price's distance from the POC, giving you an intuitive feel for where price is relative to the POC.
Enjoy!
"May the fourth leaf bring you extra luck!" 🍀
