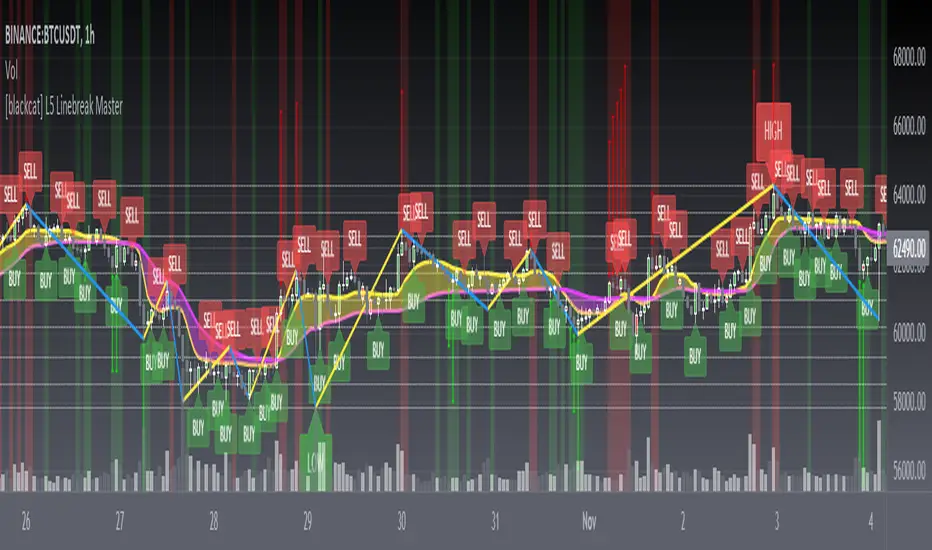
[blackcat] L5 Linebreak MasterLevel: 5
Background
Like many people in the Tradingview community, I have been studying how to apply Line Break Chart to backtesting and live trading for long. However, as we all know, the official Tradingview Line Break Chart is not recommended for backtesting because it will lead to unrealistic backtesting results. So, I thought about developing a Line Break Chart that can be used for backtesting and trading. This "L5 Linebreak Master" is one of them that I am introducing today.
This indicator is based on OHLC data, because this kind of chart can be used for reliable backtesting and live trading in Tradingview. Therefore, the Linebreak Master in this script can actually coexist with the standard Japanese candlestick chart, but the trend reversal information it prompts is based on a principle similar to Line Break Chart. When the two can coexist and produce trading signals at the same time, this is really a very interesting invention.
Function
Linebreak charts were developed in Japan and popularized here by Steve Nisson in his book Beyond Candlesticks. The purpose of linebreak charts is to filter out market noise and give a clear indication of the current trend and trend reversals. As you may know, sometimes determining the current trend can be difficult due to market price movement that consolidates, and a trend reversal can be just as difficult. The green and red bars are called lines. Notice that whenever we have consecutive green lines, each line has a higher close than the previous one; when we have consecutive red lines each line has a lower close than the previous line.
First of all, this Linebreak chart can coexist in the main chart with the Japanese candlestick chart. However, many parts may be overlapped with Japanese candle stick to see it clearly. My recommendation is that users can click "Settings" of main chart and turn off default candle chart.
Secondly, this Linebreak chart can be used for backtesting strategies, because it is essentially OHLC data. And the absolute values of the price is based on the original OHLC data. The certainty of the trend reversal is relatively high. It can be compared with Japanese candlesticks on the timeline.
Finally, this Linebreak chart is embedded with a Linebreak intrinsic trading strategy, which can be used to locate entry points through red and green labels. This strategy supports Tradingview alerts. You can get "LONG" or "SHORT" trading reminders by creating alerts. In order to obtain a clear market structure, Zen Stroke (Autolength ZigZag ), Zen Kiss (Special Moving Averages), Fibnacci Retracement Golden Levels, Unique Fibnacci Time windows and Dynamic Fibonicci support and resistance arrows can be checked to be superimposed and displayed on the main chart to facilitate understanding of the temporal and spatial position of prices in the market.
A trading system based on linebreak charts must must have all entries and exits based on the close or open of a line. The two key values of a linebreak chart are the linebreak number and the underlying time interval. We can construct linebreak charts based on daily, weekly, 5 minute, hourly, any time frame. This allows us to adapt it for day trading or swing trading systems. I developped an inheret linebreak strategy with labels facilitate you to locate trend reversals.
Indicator Set
Linebreak Master Chart (新价图)
Zen Stroke (Auto ZigZag , 自动画缠论笔)
Zen Kiss Moving Averages (缠论均线)
Fibnacci Retracement Golden Levels (半对数-黄金分割线)
Unique Fibnacci Time windows (独创的斐波那契时间窗口)
Dynamic Fibonicci support and resistance arrows (动态斐波那契支撑和阻力箭头)
Inputs
Source Type: Open, High, Low, Close, Hl2, Hlc3, Lx, Vwapc, Vwaplx, Vwaphl2 (Case Sensitive)
Returns source input selection variant, default to "Close" if blank or typo.
Open --> open
High --> High
Low --> Low
Close --> Close
Hl2 --> hl2
Hlc3 --> hlc3
Lx --> Lao Xu 1949 Median Price
Vwapc --> vwap based on close
Vwaplx --> vwap based on Lao Xu 1949 Median Price
Vwaphl2 --> vwap based on hl2
Show Zen Stroke --> True as default
Show Fib Space based on Semi-LOG --> True as default
Zen Fractals Lookback Period --> 377 as default
Key Signal
Bars
Green bars for up trend
Red bars for down trend
Labels
Green labels for buy/long.
Red labels for sell/short.
Zen Stroke ( ZigZag )
Green line section for up stroke
Red line section for down stroke
Moving Averages
Yellow for fast line
Fuchsia for slow line
Pros and Cons
Suitable for discretionary trading and bots via alerts. However, only well selected trading pair and time frame can guarantee bot works.
Intuitive and effective, the output signal is more reliable after multi-indicator resonance
Remarks
My fourth L5 indicator published
Closed-source
Invite-only
How to get it?
500 Tradingview Coins Per Monthly Subscription
5000 Tradingview Coins Per Yearly Subscription
Поиск скриптов по запросу "fib"
(FireflyTA) COG AverageCOG Average
COG stands for Center of Gravity. This indicator is an average of multiple COGs based on different sets of timeframes. To get the single COGs this average is based on, use the Market Flow COG (Overlay) indicator.
COG Average is primarily a support and resistance indicator. It can also be used to identify trend and trend changes as well imminent breakouts.
----------------------
About "Center of Gravity"
The COG is an entity that is pulling price back to it frequently (this is why it is called Center of Gravity ) as the law of mean reversion dictates. Mean reversion can be loosely broken up into mean reversion on multiple timeframes, and the COGs are included for ULT (ultra low, 15-60m), L (low, 1h-4h), M (medium, 6h-12H) and H (higher, 1D+) timeframes. As this entity is a new development in TA there is still a lack of scientific evidence that it is reliable. However, if you look at the charts, you will notice that price action will respect this entity and circle around it on the appropriate timeframes most of the time.
The COG is similar to a Bollinger Band , it is using volatility as its main component. However, COGs are aggregated entities looking at more timeframes at the same time, so besides the Time X Volatility perspective that is provided by Bollinger Bands , this entity adds a third dimension by looking at multiple timeframes. The COG is the mean of all the BBs that are included in the calculation, which can be a large number. This makes a COG a meta-analytic entity that is more sensitive to market price action.
The COG helps you in identifying how far and for how long price has been overextended to one side beyond the means. In theory, the probabilities increase dramatically to see a mean reversion to the COG. Watching price interacting with the COG should make clear that the correlations are significant, however there might be differences based on the markets used. The COGs have primarily been tested with the BTCUSD market and for crypto in general.
A way to trade based on COGs is to look for weakness (if price is above the COG) or strength (if price is below the COG) in price action while it is approaching S&R.; If signs of accumulation or distribution arise, and the distance to the COG is meaningful (as well as being maintained for a few candles), it can provide additional backing for your long/short scalping and swing trading ideas. I'd recommend to always use the COG in combination with your knowledge on price action.
By using all COGs at the same time for ULTF, LTF , MTF and HTF you can get a feeling for where price is in the context overall market flow.
----------------------
Deviation Bands
The Deviation Bands are fib-based deviations of the COG. When this module is enabled, the deviation bands are plotted around the COG. The deviations can be adjusted manually as well by changing the values in the indicator UI. The main purpose of these bands is to identify the structure of price movements in relation to the COG distance, i.e. analyzing how long price can maintain levels in an area >X or

Support and ResistanceThis indicator shows three types of support and resistance lines: Horizontal, Parallel (using linear regression) and Fibonacci Retracement. Lines can be adjusted or turned on and off in settings. A great tool for setting up entries, exits and locating pivot points.

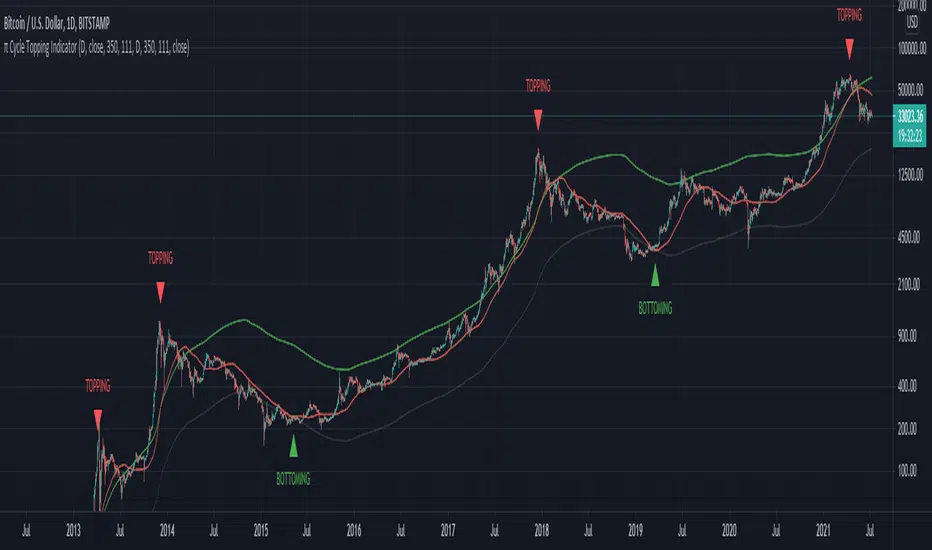
π Cycle Market Tops & Bottoms Performante IndicatorWhy is it called the Pi Cycle Tops & Bottoms Indicator?
When the 111-Day moving average crosses over the (350-Day moving average X 2), we've seen the price come to a key top or bottom within the Bitcoin market for the past 3 cycles.
350 divided by 111 is very close to π - hence the name the Pie cycle!
Yes, we are selecting arbitrary numbers initially, but through the use of proper back-testing, we are able to find key cycle shifts using mathematical numbers (fibs, Pi, etc)
We use this topping & bottoming signal when things look overbought over oversold within the market.
The "topping" label turns on as soon as we see the 111-Day moving average cross above the 350-Day moving average.
The "bottoming" signal turns on as soon as we see the 111-day moving average cross below the 350-Day moving average.
This indicator should only be used on the daily timeframe!
Historically speaking, we've seen this indicator become impressively accurate.
Intraday Trading ZonesThis script can help in intraday trading. It can plot
1. Previous day high, low and close.
2. Intraday Fibonacci levels
3. Big Round Numbers
3. CPR (Central Pivot Range)
4. VWAP

Average EnvelopeA script to calculate a support / resistance level which acts as either a bounce level or a flip level. This is rather a macro play guide than a day trade tool.
The average is calculated by taking into account monthly/weekly/daily highs and average them out.
The script also paints fib levels based on the values of the upper and the lower band.
While this was designed with a cryptocurrency market in mind (no 'close' values per-se) it holds with traditional markets as well.

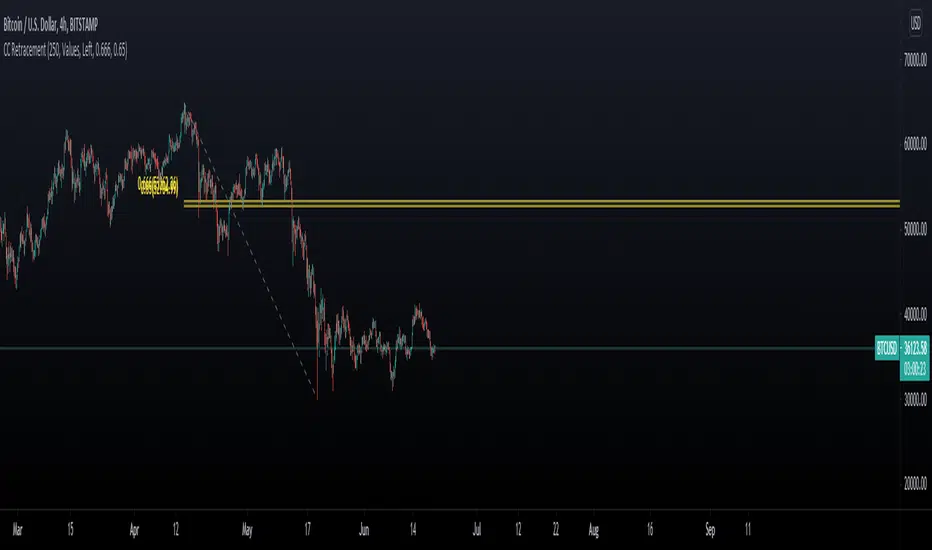
Chart Champions CC Pocket 0.65 -0.666 Fib levels or commonly know as the CC pocket
Marks Strong Support/Ressitance, Use with conflunce.
Lookback Length is adjustable
Let me know any suggestions or ideas which could help improve
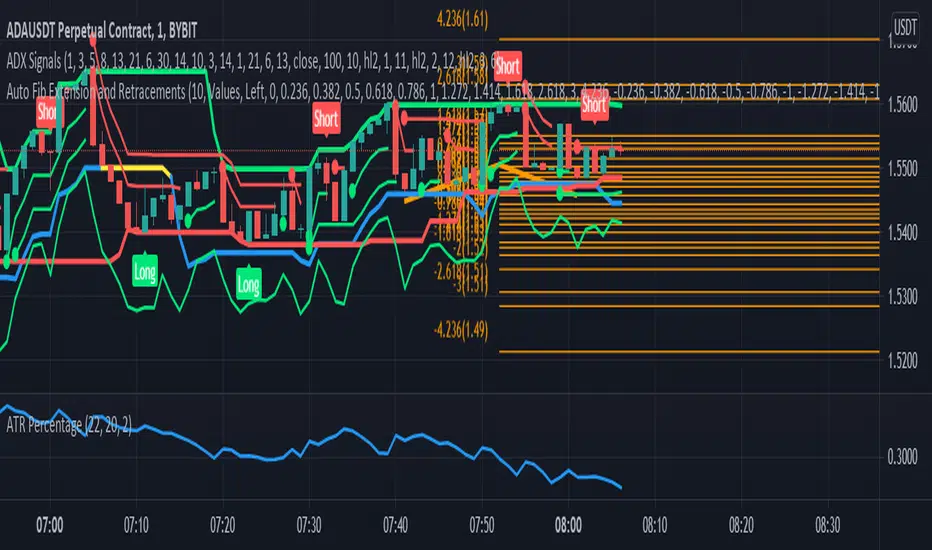
Auto Fib Extension and RetracementsThis script is used for plotting the Fibonacci support and resistance levels. Compared to other ones, the changes to this script are that you can choose what color should all the lines be and that it doesn't change the chart's size, meaning that it won't shrink the chart so that all the levels can be seen. If you have any suggestions, I'm open to anything.
Also, if you could give a like/comment or if you could follow me, that would do my day. Thank you all and enjoy!
V1=PRICE ACTION (INVITE ONLY SCRIPT)
Hello Traders,
Here i bring you my first Price Action Atr based Indictor combined with fib entry and exit trailing levels with minimum risk and maximum profit , as we must have seen at times as we enter the trend reverse and hits our stoploss . Keeping that in mind as i too stuggled and made losses so i decided and focused more on minimizing the stoploss and only on confirmation Long or Short trade is been initiated along with trailing Stoploss as explaned in the images below , why should we give market our money ;) as we are here to make money :D .. There is no holy grail as Stoploss wont be hit but yes it will be way less and all alerts are based on candle close ... Trend Screener is added too which will tell you about the trend .. One can use this on any chart and any timeframe and its very good for scalping too . Vwap and Baseline is added too just incase you want to enter trend manually ... Better results are on 15m and above . Hope you guys will like it and comment if you have any doubts..
-----------------
Disclaimer
Copyright by FaizanNawazz.
The information contained in my scripts/indicators/strategies/ideas does not constitute financial advice or a solicitation to buy or sell any securities of any type. I will not accept liability for any loss or damage, including without limitation any loss of profit, which may arise directly or indirectly from the use of or reliance on such information.
All investments involve risk, and the past performance of a security, industry, sector, market, financial product, trading strategy, or individual’s trading does not guarantee future results or returns. Investors are fully responsible for any investment decisions they make. Such decisions should be based solely on an evaluation of their financial circumstances, investment objectives, risk tolerance, and liquidity needs.
My scripts/indicators are only for educational purposes!
Happy Trading!

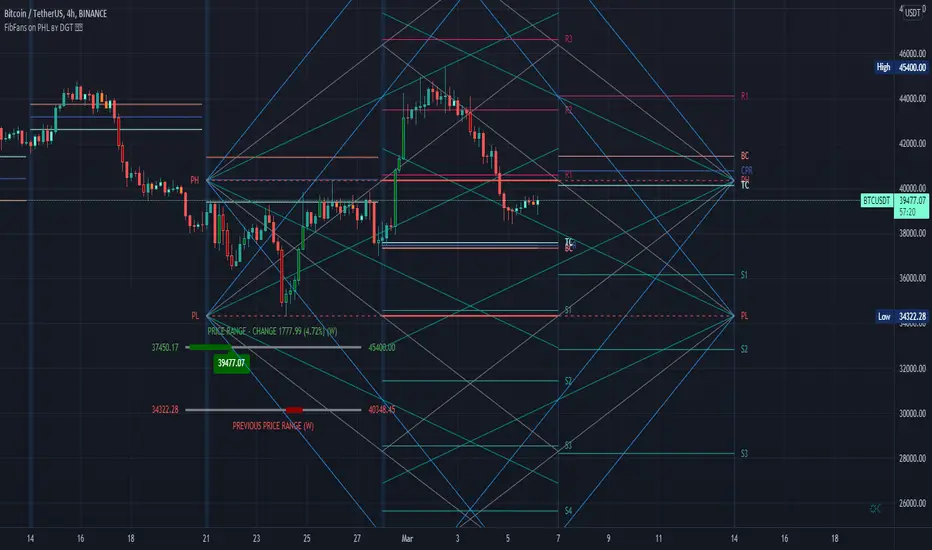
FibFans on Previous HTF HL [FaizanNawaz] by DGTFibonacci Fans application on top of Previous Higher TimeFrame High and Low. Idea owner is @faizannawaz1, special thanks to him for both the idea and tesing the application
WARNING : Study includes plottings in the future, and due to temporal gaps in non 7/24 markets such as weekends, holidays etc plotting of the fans will move to the open session (the effect will be observed on Friday and Monday). With crypto no any side affect will be observed.
More about Fibonacci Fans, how to apply fibonacci fans and automated fibonacci speed and resistance fans study
Adiitonally the study includes some addons, such as
Central Pivot Range and Traditional Pivot Points
Volume Weighted Colored Bars
Price Range Meter - Horizontal HTF Candle
Disclaimer :
Trading success is all about following your trading strategy and the indicators should fit within your trading strategy, and not to be traded upon solely
The script is for informational and educational purposes only. Use of the script does not constitute professional and/or financial advice. You alone have the sole responsibility of evaluating the script output and risks associated with the use of the script. In exchange for using the script, you agree not to hold dgtrd TradingView user liable for any possible claim for damages arising from any decision you make based on use of the script
IC Options °Turn the Dashboard on or off
°Turn the Signal Bars on or off
°Turn the Buy & Sell Signals on or off
°Turn the Fibonacci Retracement Tool on or off
The Dashboard information is best used for confirmation and informational purposes
-above 9 ema is bullish, below 9 ema is bearish trend
This script allows user input, you can add or remove built in dashboard, color bars(inform you of when the price action is above or below the midpoint of the Void Lines), long short signals(can be used to find optimal entries and exits for trades on any time frame. Smaller time frames are best for scalping. Longer time frames are best for longer swing trades. This paired with 9,21,34 ema can produced profitable trades!), auto Fibonacci retracement(allows you to plot perfect Fib Lines every time.)
-thanks for allow the following above being public domain from lemon:lemon:

(FireflyTA) Algo Score MTFAlgo Score MTF
The Algo Score MTF is a meta-analytic oscillator telling you about the technical market strength . It is analyzing a variety of different indicators and metrics to come up with a score that gives you an impression on whether the medium timeframes have fuel to go higher or if it's running out and the risk increases to see corrective price action.
----------------------
About Technical Market Strength
Algo measures the technical strength with a score between -10 and 10 . A bullish or bearish technical market strength shows a high correlation with bullish or bearish PA soon after the score reaches the significant levels deviating from 0. However, optimal treshold values (meaning the score after which the strength can be considered bullish or bearish) vary depending on the market looked at. For BTCUSD, the default values used can be seen as reference. If you want to apply Algo to other markets, you will have to calibrate the tresholds yourself.
It is important to know that market strength is the fuel to drive price higher or lower, but it is not the trigger. The trend is of superior importance. So when price is in a strong uptrend (in this case on the MTF), and the score reaches a value of -4 or lower (which can be considered bearish), it can still take a while for the trend to shift because of the strong momentum. The score in this case can be used as an indicator to show you times when it is wise to take profits / de-risk or take extra care in your risk management in general.
----------------------
Indicators used
All the indicators mentioned are calculated separately and weighted by the significance value you can customize in the indicator UI. It is also possible to (1) deactivate certain indicators and (2) force them as required, so that a signal in the oscillator only occurs when the indicator(s) that is/are required support the thesis (bullish vs. bearish).
Daily VWAP
MTF Trend
Traditional Bollinger Bands
RSI
MTF RSI Divergence
Stoch RSI
Ichimoku Cloud
Fib Retracement Levels
MACD
TTM Squeeze
Moneyflow
Custom Levels you can define (3 categories: Major, medium, minor)
For some indicators, there are specific settings to customize how they contribute to the overall score (i.e. MACD cross vs. shift vs. trending phase). It is also important to know that Algo fetches the indicator data from multiple timeframes, thereby adding reliability to the overall results.
----------------------
Algo Custom Logic
Algo is using my custom logic on when a certain indicator can be interpreted as bullish or bearish in the MTF horizon. If you want to find out about the reliability of certain indicators, I recommend disabling all the indicators except for the one you want to examine, and then see how the score reacts to price action.
----------------------
Timeframes
Due to script limitations, this version can only analyze the medium timeframes . It is best used with charts 2H+, it works on some 90m as well but ceases to work at 1H and below . It is also not compatible with higher timeframes . Upon using the same settings on the same ticker with different timeframes, you will see that the score shows a minor variance. This is because data is consolidated to match the timeframe, so it ultimately leads to minor differences. Find out for yourself what timeframe is the best to use with which market and which settings.
----------------------
How to Use
I'm going to add tooltips for the settings in the indicator UI with upcoming updates, so it becomes more clear on how to set Algo up properly. To prevent a loss of your customized settings, write them down somewhere in case a script update reverts the settings back to default.
You can find in-depth tutorials on how to use this indicator by browsing the links and resources in my signature.

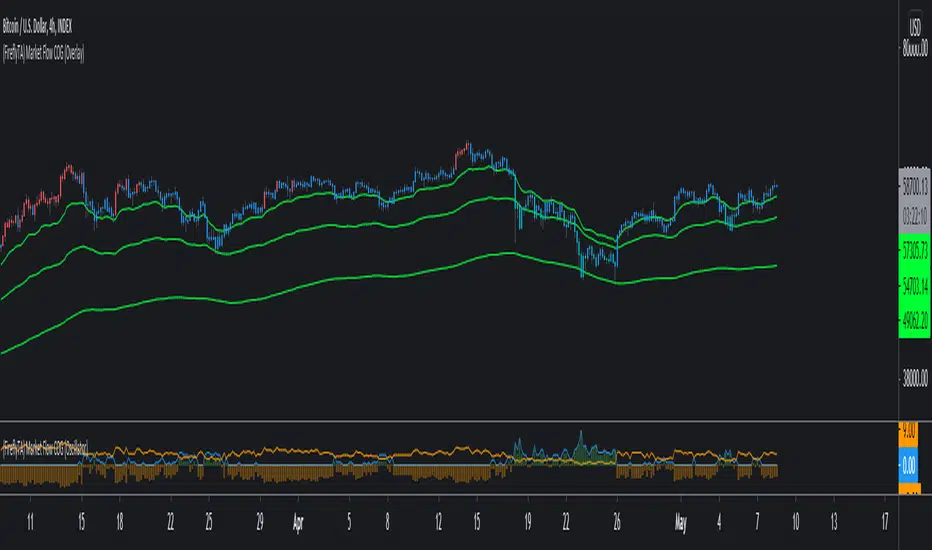
(FireflyTA) Market Flow COG (Overlay)Market Flow COG (Overlay)
Market Flow COG in the "Overlay" version offers you a variety of modules to do analysis on the market flow . I'm using my own definition of market flow since I'm actively doing scientific research on that topic and developing concepts and tools around it.
This indicator is best used together with Market Flow COG (Oscillator) , which is also public.
----------------------
About Market Flow
The market flow is a concept describing the directional force driving price movement that a market experiences based on term-specific (short-, mid- and long-term) momentum as well as dynamic range support and resistance.
In a strong uptrend for example, market flow is upwards, so dynamic range S&R; (i.e. Bollinger Bands) is flowing upwards, too. This is increasing the probability to see continuation after dips. In a shifting trend, it is possible to observe market flow still continuing upwards, because the the flow is only changing slowly. Momentum takes a while to run out and exert pressure into the other direction. This phenomenon can be observed on all timeframes in high-volume markets, even more so on the higher timeframes.
Given the complex nature of market flow , there is still a lack of tools available to properly examine it and to derive appropriate trading decisions.
----------------------
About Market Flow COG
This indicator allows you to look at various different aspects to market flow . Additional ones might be added in future updates. In this first release, the following are included. Browse the update notes below for further modules added later.
Center of Gravity (COG)
Deviation Bands
Trend EMAs
----------------------
About "Center of Gravity"
The COG is an entity that is pulling price back to it frequently (this is why it is called Center of Gravity) as the law of mean reversion dictates. Mean reversion can be loosely broken up into mean reversion on multiple timeframes, and the COGs are included for ULT (ultra low, 15-60m), L (low, 1h-4h), M (medium, 6h-12H) and H (higher, 1D+) timeframes. As this entity is a new development in TA there is still a lack of scientific evidence that it is reliable. However, if you look at the charts, you will notice that price action will respect this entity and circle around it on the appropriate timeframes most of the time.
The COG is similar to a Bollinger Band, it is using volatility as its main component. However, COGs are aggregated entities looking at more timeframes at the same time, so besides the Time X Volatility perspective that is provided by Bollinger Bands, this entity adds a third dimension by looking at multiple timeframes. The COG is the mean of all the BBs that are included in the calculation, which can be a large number. This makes a COG a meta-analytic entity that is more sensitive to market price action.
The COG helps you in identifying how far and for how long price has been overextended to one side beyond the means. In theory, the probabilities increase dramatically to see a mean reversion to the COG. Watching price interacting with the COG should make clear that the correlations are significant, however there might be differences based on the markets used. The COGs have primarily been tested with the BTCUSD market and for crypto in general.
A way to trade based on COGs is to look for weakness (if price is above the COG) or strength (if price is below the COG) in price action while it is approaching S&R.; If signs of accumulation or distribution arise, and the distance to the COG is meaningful (as well as being maintained for a few candles), it can provide additional backing for your long/short scalping and swing trading ideas. I'd recommend to always use the COG in combination with your knowledge on price action.
By using all COGs at the same time for ULTF, LTF, MTF and HTF you can get a feeling for where price is in the context overall market flow .
----------------------
Deviation Bands
The Deviation Bands are fib-based deviations of the COG that is chosen with the 'mode' setting (i.e. LTF). When this module is enabled, the deviation bands are plotted around the COG of that timeframe mode. The deviations can be adjusted manually as well by changing the values in the indicator UI. The main purpose of these bands is to identify the structure of price movements in relation to the COG distance, i.e. analyzing how long price can maintain levels in an area >X or
Multiple Timeframe Fib Bollinger Bands - can be used for 3commas*** This idea is based on Bollingers Bands Fibonacci ratios by Shizaru ()
** This will look less chaotic if you don't have all four time frames on at once! I left them on for the demo picture just to show them all simultaneously working.
This is the basis for most of my bot ideas - indicators from longer chart time frames laid over short time frame charts. What I mean by this is that I like the responsiveness of a 1m chart but indicators from a 1h or 4h chart. There are obviously downsides to doing this or everyone would do it, but I have consistently gotten top results using this method. This is a study, so not a strategy yet but you can use this with 3commas if you convert it to a strategy using band crossover/under points as buy and sell triggers.
That is super easy; just follow this excellent guide here which should work for this script:
kodify.net
It's not super hard if you know a little Pine but if you need help hit me up and we can figure something out.
This script by default has 15m, 30m, 1h and 4h settings that are configurable via the gear icon. You can enable or disable any time frame, change the color, etc. I will probably add accurate line labels, custom time frames and adjustable transparency soon.
It's advisable to use higher time frame indicator on a lower time frame chart, but not the other way around. I would use these indicators on a 1m chart but not a 1d chart, for example.
Have fun and I hope you get some use out of this! I use it for context more than bots but it is definitely possible to use it with both.

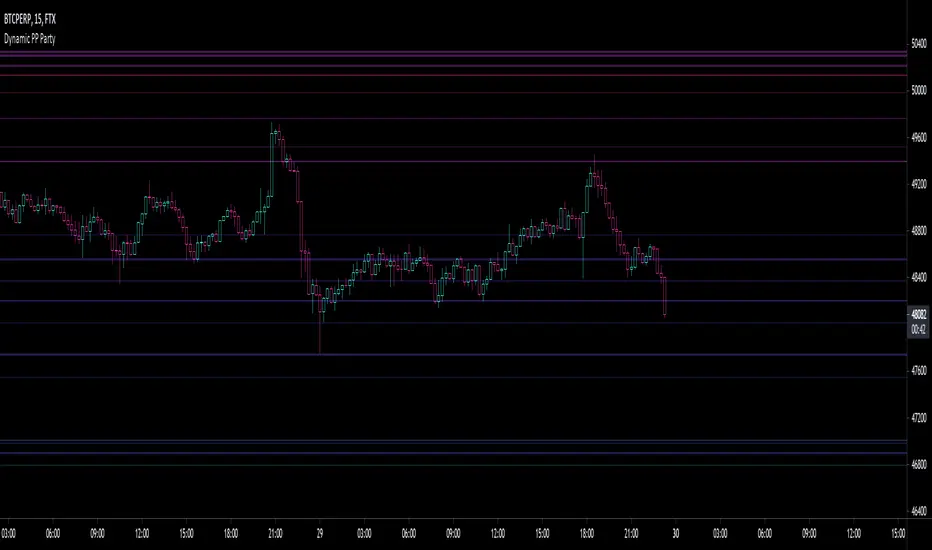
Fibonacci PP Party LTMulti-timeframe fibonacci pivot point analysis with 38.2%, 61.8% and 100% retracement levels.
Select and agglomerate different fib timeframes on your single timeframe chart fren .
The following scopes made available and stackable to your heart's desire (toggle on or off timeframes within settings):
1 Month
3 Week
2 Week
1 Week
5 Day
4 Day
3 Day
2 Day
1 Day
Go ahead, hit up that 1m & keep major support and resistance levels in plain view.
Rid your self of narrow scope , ya dope.
Warning: slow performance due to enormous heaps of timeframes hitting the dome.
Let me know where the errors are.
Make Money
Ya dummy
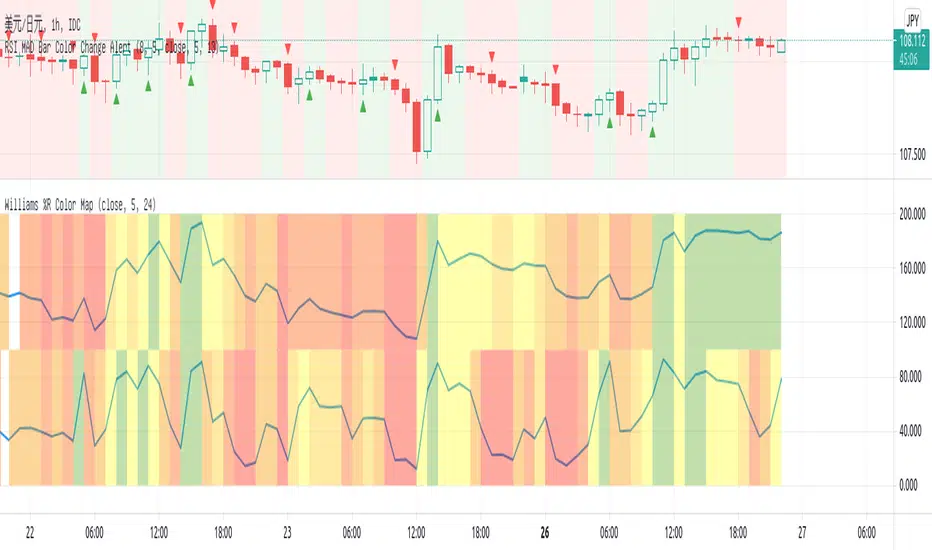
Williams %R Color MapThis script is used to have a quick view for my triple screen trading system.
I use it in 1 hour chart so that the higher timeframe is 5-hour and daily.
Visual for the current price on which fib area of 5-hour and daily chart.
Heisenberg's Uncertainty BandsHeisenberg's Uncertainty Bands:
This is a volatility indicator to determine and visualize the uncertainty in a securities' price.
In quantum mechanics, the uncertainty principle (also known as Heisenberg's uncertainty principle) is any of a variety of mathematical inequalities asserting a fundamental limit to the accuracy with which the values for certain pairs of physical quantities of a particle, such as position, x, and momentum, p, can be predicted from initial conditions.
It plots a Kalman filter average of the bars inside a higher timeframe bar, to attempt to find the most frequent price in that bar's timespan. To plot what is effectively a MA using POC (IvanLabrie's code, credits to the author).
It derives momentum from relative momentum, yielding results more sensitive to changes.
Then it uses Heisenberg's uncertainty principle to find an uncertainty range, and uses it as the channel distance from the POC MA, meaning price is likely to fluctuate within that range.
Since uncertainty must be greater than h/2, adding fib levels will make it a useful indicator. Essentially they are pseudo-Fibonacci Bollinger Bands, which uses a different calculation.
Benefits:
Prices fluctuate, and it can be helpful to visualize price as a range, rather than a single point or line. This visualization can help in managing risk, determining entries and exits, and prevent losing one's position due to price fluctuations during a trend.
If we use a particle model, the uncertainty principle dictates that it is impossible to predict the price within a range. This is a good model for risk management!
Usage:
There are 5 Fibonacci ratio outer bands that can be turned on or off according to user's preference.
Recommended that the length inputs should be increased in higher timeframes, to visualize trends, shorter timeframes should have lower lengths.
GLHF
- DPT

NVME Vanquisher X"Enter with precision, focus on the mission, dismiss the indecision, support NVME's vision" ~ That is what the Vanquisher X will provide.
One may ask, what is so unique about it compared to other algorithms?
We have our own calculation module and strategy that uses other indicators and maths to determine the next location of the trend and with our algorithm you can have full customisation of all the features we have. You can change the overall colour scheme of every single plot within the indicator, you can change the algorithms sensitivity and scalar to as many different numbers as possible, there are helpful drawings, trend confirming drawings, pullback drawings, pair mark-ups, custom dashboards and much more. Our settings panel is also simple and easy to use providing you with different appropriately named subsections for each feature and there are tooltips to let you know what each tab or input does. So, traders if that doesn't get you hooked then keeping reading!
Traders commonly struggle to decide whether or not to enter a trade, hold a trade, stop a trade or take profit and that is what makes us different. You stop when you see the opposite signal or a change in candle colour, you can follow our automatic TP and SL levels for trade goals and you enter when a signal meets your analysis.
NVME Vanquisher X is to be used as confluence with your analysis or trading style and should not in anyway shape or form be used as a indication to buy or sell just because the signal says so, it is there to give you a higher chance of having a high probability trade though past results is not indicative of future results and getting access doesn't mean you will become a millionaire in a day as it is not a get rich quick indicator so it won't guarantee 100% success.
What is your goal?
Our goal is to give you traders an edge in trading, whether it be for stocks, indices, cryptos, forex, commodities, futures and altcoins, all assets are supported and we want to make the best of every trader with NVME.
Recommended Timeframes:
15 Minutes, 1 Hour, 4 Hour with our settings of 2 or 3 sensitivity and 144 on the algo scalar.
Does it support all chart types?
Yes, all charts supported, however we recommend Heikin-Ashi as an optimal choice for trading but if you are already experienced with something else then you can use that :)
Screenshots:
Features:
/Trend Confirming Drawings:
-200 EMA (Added so that free users don't have to waste 1 indicator space)
-Trend Cloud (Colour switches from negative to positive depending on the trend and the cloud has a low fill opacity)
-Confirmation Highlight (Highlights the background with a positive or negative colour depending on the trend identified)
-Following Highlight (Unique highlighting to the background that shows either a positive or negative colour based on the trend however it doesn't identify ranging markets)
//Combinations//
-TC+EMA, EMA+Highlight, Cloud+Highlight, FH+EMA, FH+CLOUD, All v1 (EMA+CLOUD+CH), All v2 (EMA+CLOUD+FH)
/Helpful Drawings:
-Predictive Channel (Using candle maths, this will plot a price following linear regression channel that can be useful for breakout trading or using as support and resistance)
-Predictive S/R (Using candle maths and validation, this will plot support and resistance zones across the market to show you different areas where price could reject or reverse)
-Predictive Trend-Lines (Using candle maths and EMA, this will plot a trend-line in the direction of the trend and this can be useful for breakout trading or following the trend)
-Predictive Supply and Demand Highlight (Using other indicators, this will plot a highlight filled plot that will outline areas of supply and demand, which can be useful for support and resistance trading)
-Previous Order Blocks (Using candle maths, validation and confirmation latency, this will plot filled in squares of potential orders blocks from the past so they can be used for future reference in analysis)
-Predictive ZigZag (Using candle maths, this will plot a price following line that forms a zig zag pattern to show if the market is going in a higher high and higher low formation or lower low and lower high formation)
-Predictive Pivot-Points (Using candle maths and higher-timeframe data, this will plot pivot zones up to support 5 and resistance 5 with midpoints for every section there is)
/Pullback Drawings:
-EMA Pullback (Added so that free users don't have to waste 1 indicator space)
-Bollinger Heatbands (Using the Bollinger Bands indicator, we have created a price following support and resistance heat-map that shows you the whereabouts of the dynamic support and resistance that is indicator based)
-EMA+HB (This combines the ema and the heatbands)
-Fib Retracements (This feature will automatically plot a fibonacci retracement based off predictive market data and our own optimal settings so that you don't need to change them)
/Pair Mark-Ups:
-Weekly Info (This will show you the previous lows and high of the weekly candle and using an ATR, we have added potential reversal zones in those areas and we have a midpoint too)
-Daily Info (Same as the weekly info but for the daily timeframe)
-4 Hr Info (Same as the weekly info but for the 4 hourly timeframe)
/Colour Schemes:
-Default (Strong green, dark purple, strong red)
-Blue and Orange
-Strawberry and Lime
-Apple and Mango
-Orange Passionfruit
-Rhubarb and Custard
-Black and White
-Forest Greens
-Galaxy
-No Colour Scheme (removes the preset colours so they are the same as your TradingView bar settings)
-Show ATR TP and SL levels (This will plot 4 lines, 3 lines are the take profit levels, and the 4th line is the stop loss line, since it is atr based it may fluctuate the distance between each line indicating possible liquidity)
/Dashboard Settings
-High (Will place the dashboard's Y position to follow the high of the price)
-Middle (Will place the dashboard's Y position to the difference of the lowest low and highest high)
-Forced Middle (Will place the dashboard's Y position to the difference of the lowest low further back and highest high further back)
-Low (Will place the dashboard's Y position to follow the low of the price)
-No Dashboard (Deletes the dashboard from the charts)
-Dashboard's X position (Input field, this will change the X value, the higher it is the further away it is from price and the lower it is the closer the dashboard is towards price)
/Dashboard W/R Goals:
-Adaptive (Randomly chooses a strategy follow, can be highly inaccurate, and when price hits tp 1 it will add a win and if it hits sl it will count as a loss)
-5 Pips to 5 Pips (This will change the calculator to only add values for this set condition and this won't be strategy based but instead signal based)
-5 Pips to 10 Pips (1:2 Risk Reward)
-10 Pips to 20 Pips (1:2 Risk Reward, Higher Stop and TP)
-10 Pips to 30 Pips (1:3 Risk Reward, Higher Stop and TP)
-20 Pips to 40 Pips (1:2 Risk Reward, Higher Stop and TP)
/Dashboard Add-ons:
-MTF Trends (This will add more text onto the dashboard and this will show you the trends of the higher timeframes)
-EMA (This will show you the EMA trends on the dashboard)
-VWMA (This will show you the VWMA trends on the dashboard)
-HMA (This will show you the HMA trends on the dashboard)
-Text Colour (This is a colour input and this allows you to change the colour of the dashboard to anything you like)
/Customisable Alerts:
-Buy Alerts (This will allow buy alerts to be sent through any TradingView notifications)
-Sell Alerts (This will allow sell alerts to be sent through any TradingView notifications)
-Range to Uptrend (May be buggy, this will send an alert if the colour goes from undecided to an uptrend colour (positive colour))
-Range to Downtrend (May be buggy, this will send an alert if the colour goes from undecided to a downtrend colour (negative colour))
-Previous Bullish Order Block (This will send an alert if a previous bullish order block has been printed to help with your analysis)
-Previous Bearish Order Block (This will send an alert if a previous bearish order block has been printed to help with your analysis)

TV Community AlgoTV Community Algo is a free TradingView script that I designed from the ground to benefit the traders of this community. It has plenty of features that you will enjoy, and I have included documentation for how to use this below!
Settings:
Basic:
Turn the Void Lines on or off
Turn the Dashboard on or off
Turn the Signal Bars on or off
Turn the Support & Resistance Lines on or off
Turn the EMA 8 and EMA 200 on or off
Turn the Buy & Sell Signals on or off
Turn the Fibonacci Retracement Tool on or off
Style:
Change the Dashboard's distance from the price action
Change the Dashboard's Color and Transparency
Change the Dashboard Text Color
Change the Fibonacci Deviation
Make the Fibonacci Retracement Tool reverse
Make the Fibonacci Lines extend left, right, both directions, or none
Turn Fibonacci Prices on or off
Turn Fibonacci Levels on or off and change between percent or value
Change Fibonacci Label Position from the left or the right
Usage:
This algo has many uses including but not limited to:
Finding entries and exits using the EMA 8 and EMA 200 crossovers
Using the Void Lines to identify bounces or reversals
Using the Signal Bars to identify trend and confirmation for entries and exits
Using the Dashboard information for confirmation and informational purposes
In the images below, I give a few examples of the many uses of the TV Community Algo!
VOID LINES
The Void Lines are very helpful when it comes to identifying reversals.
TV COMMUNITY ALGO DASHBOARD
The Dashboard is filled with useful information that all traders can benefit from!
SIGNAL BARS
The colored candles known as Signal Bars inform you of when the price action is above or below the midpoint of the Void Lines.
AUTO SUPPORT & RESISTANCE LINES
These lines help traders find accurate levels of support & resistance on all time frames, and the lines change color depending on if the price is above or below them.
EMA 8 AND 200
The EMA 8 and EMA 200 crossovers can be used as entry and exit signals.
BUY & SELL SIGNALS
The BUY & SELL signals can be used to find optimal entries and exits for trades on any time frame. Smaller time frames are best for scalping, while larger time frames are more suited for longer trades. When combined with the EMA lines and Dashboard information, these signals can produce incredibly profitable trades.
AUTO FIBONACCI RETRACEMENT TOOL
The Auto Fibonacci Retracement Tool allows you to plot perfect Fib Lines every time.
Conclusion:
I truly hope that the TV Community Algo benefits the TradingView community and that you all find some value in it. I worked very hard on this product and I would love to see it put to good use.
with love,
-Lemon 🍋
This work is licensed under a Attribution-NonCommercial-ShareAlike 4.0 International (CC BY-NC-SA 4.0) creativecommons.org


iTradeAIMS | The Purple MagicThe Magic Purple Line
To put it very simply, the Magic Purple Line is the Trend Line that I use for my trading.
It is a Trend line based on Trading Chaos.
Yes, it is the Red Line of the Bill Williams Alligator but...
It is the Red Line of the 5 times higher time frame
This means you will ALWAYS be in tune with the trend of the higher time frame.
that's very simple.
I arrived at this indicator by using some fractal geometric math logic.
The Redline of Bill Williams Alligator Indicator is calculated by using 8-period smooth moving average with a shift of 5 periods to the right.
Multiply 8 by 5 = 40
Multiple 5 by 5 = 25
But to get it Fractal Geometrically correct, I converted it into the Nearest Fib Numbers.
et voila, you have the Magic Purple Line
How to calculate The Magic Purple Line:
Plot a 34 Smooth Moving Average with 21 Shift
I used it like this.
I take entries using AIMS The Box indicator. I want the box to be always above the purple line for my buy orders and vice versa for shorts
E.g. Tesla Entries Marked on this chart.
Note that all entries are marked as Buy Orders because the price is above the purple line.
Hope this helps improve your trading.
If you like it, please hit the LIIKE button and Follow iTradeAIMS 🎈🎉

Auto Fibonacci ComboA combination of Fibonacci indicators including:
1- Moving Auto-calculated Fibo Retracement Levels
2- Dynamic Auto-calculated Fibo Extension Levels
3- Adjustable Auto-calculated Fibo Time Zones
4- ّFlexible Fibo Moving Averages Ribbon
The ribbon consists of 10 moving averages of selected source for different Fibonacci numbers count of bars which could be colorized for a better trend observation. Also the type of the moving averages could be picked up from 6 different types which are:
- SMA (Simple Moving Average)
- EMA (Exponential Moving Average)
- HMA (Hull Moving Average)
- LSMA (Least Squares Moving Average)
- TMA (Triangular Moving Average)
- MAEMA (My Personalized Momentum Adjusted EMA)
I think the latter one makes a nice conjunction with Fibonacci retracements.
Feel free to test the set and send me your thoughts.

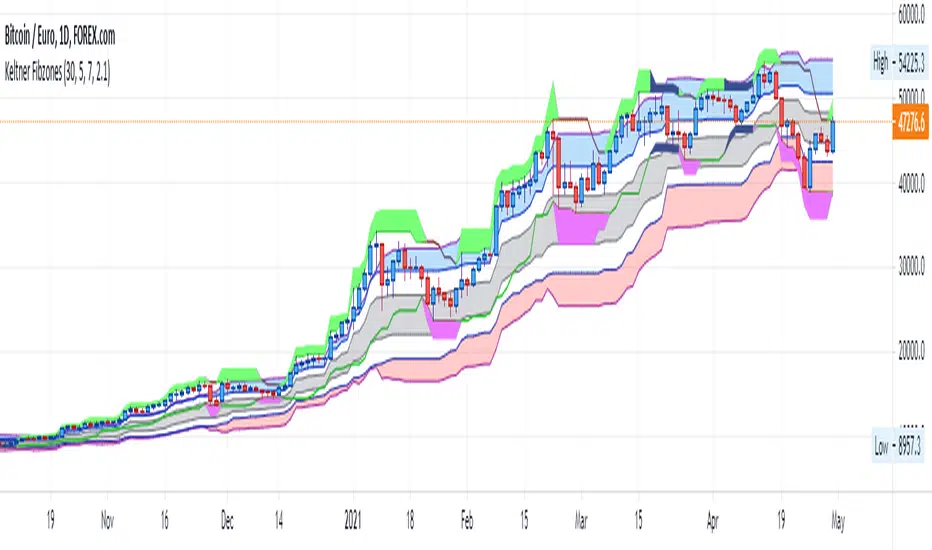
Keltner FibzonesKeltner Channel with Fibonacci Zones which uses properties of a Donchian Channel.
This script is a variation of the Fibonacci Zone script and the Donchian Fibonacci Trading Tool which I published earlier. A Keltner Channel gives more useful information to the trader than a Donchian Channel, because it provides a depiction of “normal range” and shows “outside normalcy” situations. Fibonacci lines provide a way to see if the market is trending up or down, while moving inside the channel, because in cases where the Fibonacci lines function as resistance, the trend is down, whereas when these turn out to be supports the trend is up.
Example of use:
If after a rally up - in which candles moves outside the channel - these return into the channel, this means a “new normal”. If the fibs turn out to give support, one may assume that this is a temporary sideways movement in which a flag is formed, after which following rally up may happen. With rally down the opposite is true. Top and bottom situations show a change in the way the market uses the fiblines.
The middle line of the Donchian Channel is used as the middle line of the Keltner channel, in stead of the sma in the classic channel. Default for calculation is 2 x Average True Range above and below this line. Default for the periods of the channel is 20 periods, because this allows the candles to go outside the channel. If you shorten this, all happens inside the channel.