Noya Alpha - Venus Planetary LinesOne of W.D. Gann's most powerful planetary tools was the Gann Planetary Lines. These convert planetary angles to price in order to determine areas of support and resistance. Like many of W.D. Gann's other tools, these can be very very accurate with the right settings but requires user input and tuning to refine the lines to fit each individual asset's price action.
Inputs:
Radix: Default is 1. This represents the price/angle scale, adjust this in multiplies of 2 for best results. Negative and decimal values are supported and encouraged for use as well.
Angle Divisions (stdsplit): The amount each major angle is split.
Number of Lines: Number of Plots to draw.
Featured are also crossovers for when the planet moves across each major area into a new constellation.
Поиск скриптов по запросу "gann"
Noya Alpha - Mercury Planetary LinesOne of W.D. Gann's most powerful planetary tools was the Gann Planetary Lines. These convert planetary angles to price in order to determine areas of support and resistance. Like many of W.D. Gann's other tools, these can be very very accurate with the right settings but requires user input and tuning to refine the lines to fit each individual asset's price action.
Inputs:
Radix: Default is 1. This represents the price/angle scale, adjust this in multiplies of 2 for best results. Negative and decimal values are supported and encouraged for use as well.
Angle Divisions (stdsplit): The amount each major angle is split.
Number of Lines: Number of Plots to draw.
Featured are also crossovers for when the planet moves across each major area into a new constellation.

Noya Alpha - Jupiter Planetary LinesOne of W.D. Gann's most powerful planetary tools was the Gann Planetary Lines. These convert planetary angles to price in order to determine areas of support and resistance . Like many of W.D. Gann's other tools, these can be very very accurate with the right settings but requires user input and tuning to refine the lines to fit each individual asset's price action.
Inputs:
Radix: Default is 1. This represents the price/angle scale, adjust this in multiplies of 2 for best results. Negative and decimal values are supported and encouraged for use as well.
Angle Divisions (stdsplit): The amount each major angle is split.
Number of Lines : Number of Plots to draw.
Featured are also crossovers for when the planet moves across each major area into a new constellation.

Bonfire 2021 by CaptBlackBeardSee original (balanced scale) chart here:
See a local price version squared to the start of this cycle.
Published chart is focusing on the squaring feature of Bonfire.
Updates to Pinescript have allowed some additional options that allow a better experience.
If you are unfamiliar with squaring price and time or finding 1:1 ratios , you should look into the subject along with the (45 degree) concept creator (W.D. Gann).
Squaring price/time is just the very first steps in setting up your Bonfire chart.
Once you have properly scaled the chart to your liking -> Right Click the scale on the left -> Click Lock Scale to preserve the price time squaring .
Here you see just how natural the price is to 45 degrees. Now adding additional drawings such as Gann and Fibonacci tools along with symmetry based geometry are a breeze.
Once you have your chart setup, there are endless possibilities in building your prediction models.
Again, this is just the first step and showing one feature of Bonfire. There's arguably more powerful and unique features included with the next layer of advanced indicators once zoomed in.
I'm working hard to build and release a website, forum, detailed information, guides and videos for all of Bonfire's features as well as my other indictors so stay tuned.
Just a few of the advantages of Bonfire squaring
Unique square offsets and settings capture common time pivots and price level ratios that help you to align price/time 1:1 (from major pivots or the event of your choice ).
When the price is square you have a greater chance of being accurate with trend predictions, targets, price levels, Gann tools and geometry.
When the price and trends are truly square you have built-in confluence for your current system and indicators.
One factor not considered by most is the massive variable of scaling charts. Finding 45 degrees is just your opinion unless you scale a chart properly. Using a static square is not enough.
Many people find that having a structured and consistent method for visualizing an asset helps them understand the state of the asset faster but also provides a stable way to compare assets quickly.
Aside from finding the true 45 degree trends,90 degree pivots, 0 degree levels, you can use the corners, midlines, and tangents from any and all squares to add some very powerful trendlines and pivots.
This is the newest version of Bonfire with updates to make it easier to customize and adjust inputs/settings to your preference. The key is to allow adjustments while maintaining the core Bonfire parameters.
Some new features:
-Lightmode and Darkmode switch. * Recommend a plain white or black background.
-More Bonfire specific built-in sizing options
-Display options = Squares Only | Indicators Only | Both
-User preferances = Square line thickness

Intraday LevelsDear Investor / Trader,
Intraday Levels is a script to identify the intraday levels. This script is only for intraday purpose.
I am using previous day's closing price and volatility to calculate the next day's range/levels, this script is calculates the levels using Gann angles and volatility principles .
If the instrument opens gap-up or gap-down then the OPEN price is used to calculate the next day's range.
This script will only work in low timeframes. This script will not plot levels in higher timeframes from 30 minutes onwards.
Suggested time frame:
Intraday trading
- 5 Min or 15 Min
How to use?
If you are price and action trader then trading can be done from any plotted level based on the price action principles or candlestick patterns. Otherwise according to GANN principle you can be done trading as per the direction given by the indicator.
Additional / Unique –
Besides Gann angles and volatility calculation we will get VWAP and EMA’s. Some many traders are using EMA’s and VWAP as an additional confirmation factor which increase their wining probabilities. So there is no need to add additional indicators for VWAP & EMA’S.

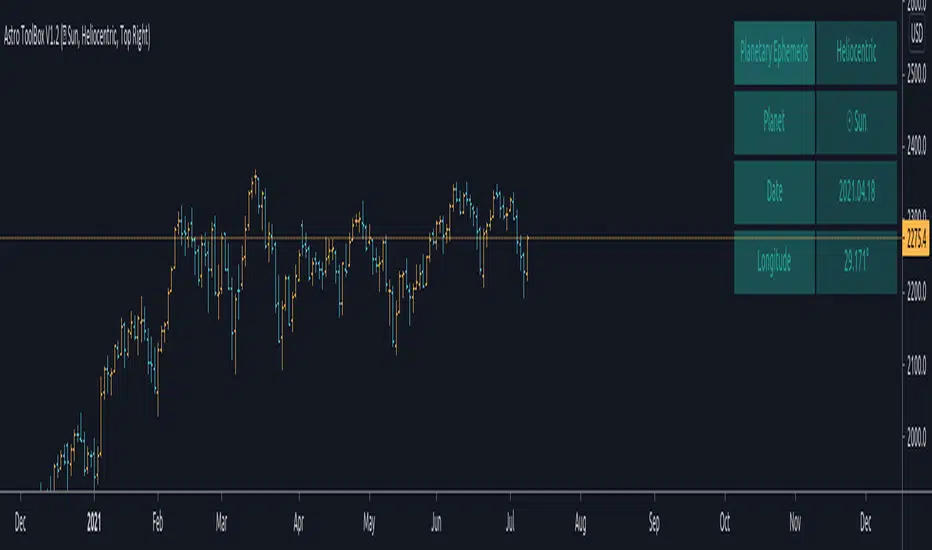
Astraea: Plantary Line Indicator (BennuQuants.net]BennuQuants presents:
Astrea: The Planetary Longitudinal Indicator
DOCUMENTATION: bennuquants.net
"Astraea is our version Gann’s planetary line indicator, and shows the longitude of a given planet. These lines can be used as harmonic pivot points. This is the first and only astro trading instrument available on TradingView at this time.
As a disclaimer, this is one of the most intensive indicators and areas we have found to in TA. We cannot determine the probability of success with any of these systems, but are providing the framework with which to find profitable systems. This system has been back tested against other experts and works in the same manner, bringing Astrotrading to TradingView for the first time."
This indicator was created from replicating and improving upon Gann based techniques which were somewhat hidden in nearly 1000 pages of writing and text. We strongly recommend reading the books found at the back of the documenation.
If you want a 7-day free trial, please join the Discord. There will also be a new channel available to astro-traders who are interested in learning more about Gann and harmonic trading. The asking price for the indicator currently is $100. If you have financial issues or a proposal, please feel free to reach out. If the quantity is an issue and you wish to make a charitable donation, that is also an option.
Legal Disclaimer: By using this indicator you agree that BennuQuants is not liable for any losses that may occur while trading financial assets. Trading is a risky endeavor and losses may occur. Your decisions are your own.
You are entitled to a copy of Astraea as long as TradingView as a platform exists. If for any unseen reason the hosting account is banned, we will restore access as soon as possible. If you are transferring TradingView accounts, we will work with you to assist the transition process.
More information can be found here: bennuquants.net

Gold Levels MTF
// ────────────────────────────────────────────────────────────────────────────────
// GOLD LEVELS MTF - COMPLETE INDICATOR DESCRIPTION
// ────────────────────────────────────────────────────────────────────────────────
//
// DESCRIPTION:
// Gold Levels MTF is a professional technical indicator that analyzes asset price
// movement and displays support and resistance levels from all timeframes (Daily,
// Weekly, Monthly) using the Murray Math method based on Gann theory.
//
// MAIN FEATURES:
// 1. Multi-timeframe analysis - displays levels from Daily, Weekly, and Monthly timeframes
// 2. Automatic Murray Math level calculation (9 levels: 0/8 to 8/8)
// 3. Visual indication of level strength through colors and line styles
// 4. Level labels for easy identification
// 5. Automatic recalculation when volatility changes
//
// LEVEL TYPES:
//
// Extreme Overshoot (0/8 and 8/8) - Red color, solid line
// Final support/resistance. After price breaks through these levels, the indicator
// automatically recalculates and sets new levels.
//
// Overshoot (1/8 and 7/8) - Orange color, dotted line
// Weak level. If price has moved too far and stops near this level, it will reverse
// quickly. If it doesn't stop, it will continue moving.
//
// SUP/RES (2/8 and 6/8) - Blue color, solid line
// Strongest support and resistance levels. Provide the strongest resistance and
// support. Key levels for trading.
//
// Stop & Reverse (3/8 and 5/8) - Yellow color, dotted line
// Weak level. If price has moved too far and stops near this level, it will reverse
// quickly in the opposite direction.
//
// PIVOT (4/8) - Purple color, solid line
// Main support/resistance level. Provides the strongest resistance/support. This is
// the best level for new buy or sell entries.
//
// HOW TO USE:
//
// 1. SETTINGS:
// - Enable/disable desired timeframes (Daily, Weekly, Monthly)
// - Enable level labels for easy identification
// - Adjust line thickness to your preference
//
// 2. TRADING:
// - PIVOT (4/8) - main level for position entry
// - SUP/RES (2/8, 6/8) - strong levels for placing stop-losses and take-profits
// - Extreme Overshoot (0/8, 8/8) - levels for identifying trend reversal
// - Use combination of levels from different timeframes to confirm signals
//
// 3. INTERPRETATION:
// - Price above PIVOT - potentially bullish trend
// - Price below PIVOT - potentially bearish trend
// - Bounce from SUP/RES levels - strong signal for entry
// - Breakthrough of Extreme Overshoot - possible trend change
//
// ADVANTAGES:
// - High accuracy in determining support and resistance levels
// - Multi-timeframe analysis for better understanding of the overall picture
// - Automatic recalculation when market conditions change
// - Visual indication of level strength
// - Easy to use and interpret
//
// TECHNICAL DETAILS:
// - Calculation method based on Gann theory and Murray mathematics
// - Octave is calculated as a power of two from the price range
// - Levels are divided into 8 equal parts (0/8 to 8/8)
// - Previous period data is used for calculation stability
//

BUY/SELL JorgeChutoFXThis indicator is ideal for:
• Identifying trend reversals with precision
• Confirming entries and exits in trend-following strategies
• Visualizing key breakouts above or below the Gann line
• Use in scalping, intraday trading, or swing trading
Includes:
✔ Gann High-Low line with automatic color change
✔ BUY/SELL text signals at key reversal points
✔ Adjustable text size
✔ Signals only on confirmed candle close
✔ No repainting
Use this indicator as a supportive tool. It does not guarantee results. Trading in financial markets involves risk.

✨ Time × Price Complete Square — XAUUSD 3min✨ Time × Price — XAUUSD 3min
🧩 Overview
The Time × Price indicator visualizes the relationship between price movement and time cycles to help identify potential confluence zones.
By detecting pivot points (swing highs and lows) and applying a geometric cycle structure inspired by the Square of 9 / Gann methodology, it highlights where price and time harmonize.
This tool is designed for traders who want to observe market rhythm and cyclical symmetry rather than simple trend signals.
⚙️ Features
Automatic pivot detection (adjustable sensitivity)
Dynamic Time × Price rings showing cycle evolution
🟦 Blue → new cycle starts
🟨 Yellow → equilibrium phase
🟥 Red → cycle completion
Optional alert when a cycle completes
Time and price axis guides for clearer confluence visualization
🔍 Parameters
Parameter Description
pivotLen Length for detecting swing points. Higher values smooth out smaller fluctuations.
baseCycle Base cycle period that defines the ring spacing.
alertOn Enables or disables alert on cycle completion.
💡 How to Use
Apply on XAU/USD 3-minute to 15-minute charts for optimal responsiveness.
Observe when a new blue ring forms — it marks the start of a new cycle.
As rings shift toward red, a time-price cycle is approaching completion.
Combine with RSI, MACD, or momentum indicators to confirm possible reversals near ring intersections.
Use alerts to monitor key cycle completions automatically.
⚠️ Disclaimer
This script is for educational and analytical purposes only.
It does not provide financial advice or trade recommendations.
All trading decisions should be made at your own discretion and risk.
🧠 Concept
The concept is based on the idea that “time and price resonance drives market turning points.”
By adapting Gann-style time-price geometry to intraday timeframes, the indicator provides a visual structure to interpret rhythm and balance in market motion.
✅ Compliant with TradingView House Rules
No investment or profitability claims
No use of third-party or proprietary code
Transparent explanation of features and logic
Educational purpose clearly stated

Murrey Math SMA up to 32s Murrey Math SMA up to 32s is a highly advanced Pine Script v5 indicator that combines Murrey Math Lines (MML) with a customizable moving average (MA) — including a non-repainting Rolling VWAP (RVWAP) — and dynamic color-coded support/resistance bands up to 1/32 subdivisions. It projects octave-based geometric price levels (like Gann) centered on your chosen MA, with adaptive scaling, angle-based trend coloring, and absolute/extended MML bands. Includes 1/8, 1/16, and 1/32 grid lines, shaded zones, labels, and a live increment display.Core FeaturesFeature
Description
MA Types
SMA, VWMA, VWAP, Period VWAP, RVWAP (rolling VWAP over fixed or adaptive time window)
Murrey Math Grid
Auto-scaled 0/8 to 8/8 + extensions (±3/8), with 1/16 & 1/32 subdivisions
Dynamic Coloring
Bands colored by MA slope angle (bullish/bearish) or absolute MML shift
RVWAP Engine
Non-repainting volume-weighted average over user-defined or adaptive time steps
Wick Filtering
Optional ignore wicks for cleaner MML framing
Resolution Support
Works with higher timeframe data via request.security()
Key Use Cases Use Case
How to Use
1. Precision Support & Resistance
Treat 4/8 (mid) as pivot, 0/8 & 8/8 as extremes. Price often reverses or accelerates at these levels.
2. Mean Reversion Trades
Buy near 0/8–1/8 (oversold), sell near 7/8–8/8 (overbought) when MA is flat or sloping mildly.
3. Trend Continuation
When MA angle > threshold and price breaks 5/8, expect move to 8/8. Confirm with volume.
4. Breakout Entries
Watch for close beyond 8/8 or 0/8 + MA angle steep → strong momentum breakout.
5. Scalping with 1/32 Grid
Use 1/32 lines as micro-targets in ranging markets or after news spikes.
6. Volume-Weighted Fair Value
RVWAP = true average price paid over time → anchor for institutional fair value.
Visual Layout (MA-Centered)
+3/8 ───┐
+2/8 ───┤ ← Strong resistance
+1/8 ───┤
8/8 ███┤ ← Overbought (red zone)
7/8 ───┤
6/8 ███┤
5/8 ───┤
4/8 ███┤ ← Midline (pivot)
3/8 ───┤
2/8 ███┤
1/8 ───┤
0/8 ███┤ ← Oversold (green zone)
-1/8 ───┤
-2/8 ───┤
-3/8 ───┘
Shaded: 0/8–1/8 (buy), 7/8–8/8 (sell), 3/8–5/8 (neutral/consolidation)
MA Line: Orange (RVWAP) or hidden
Labels: Bottom, 1/4, Mid, 3/4, Top (offset to the right)
Table: Shows current Increment size
Best For Swing & scalp traders on stocks, forex, crypto
Volume-based strategies (RVWAP shines in high-volume moves)
Gann/Murrey Math enthusiasts wanting automation + modern MA anchoring

MM-Auto SQ9 V1.0MM-Auto SQ9 V1.0 — Automatic Square-of-9 levels from a selected pivot (Bottom/Top). Choose base shape or Custom Angle, optional half-angles, cycles, and full color/style control.
Disclaimer: Educational purposes only — not financial advice.
**What it is**
A visual Gann Square-of-9 level engine. It projects horizontal SQ9 price levels from a single pivot using root/square transforms, with selectable geometric bases (90°/60°/72°/120°/45°) or a **Custom Angle**, optional **Sub-Angles (half-angles)**, multi-cycle expansion, full styling control, and a **draggable 0-line** pivot.
**Key features**
* **Draggable 0-line:** Drag the pivot line on the chart and drop it on any swing high/low — no need to type the reference price. Levels recalc instantly.
* **Bottom/Top modes** for projection direction.
* **Shapes or Custom Angle** (Square/Octagon/Hexagon/Triangle/Pentagon or your own).
* **Sub-Angles (½)** with separate style/color.
* **Cycles** to extend the grid.
* **Clean UI**: labels (size/distance), line thickness/style/colors, pivot line style.
**Inputs (quick guide)**
Pivot Price • Pivot Type (Bottom/Top) • Space Multiplier • Geometric Shape / Custom Angle Value • Number of Cycles • Show Sub-Angles & Line Style • Colors & Line Thickness • Labels (on/size/distance).
**Workflow**
1. Drag the **0-line** to your pivot (any swing high/low) or set **Pivot Price** and **Bottom/Top**.
2. Pick shape or **Custom Angle**; increase **Cycles** if needed.
3. Tune **Space Multiplier** to align levels with historical reactions.
4. (Optional) Enable **Sub-Angles** for finer structure.
5. Observe **bounce / break / retest** around levels and combine with your system.
**Pro tips**
* Use a **structural swing** as pivot.
* Reduce clutter by lowering cycles or disabling sub-angles.
* Pair with **market structure / volume / ATR / fractals** for decision support.
* Adjust label size/distance to keep charts clean.
**Troubleshooting (dragging)**
If the 0-line doesn’t move, ensure drawings are **unlocked** and “Move drawings” is enabled in chart settings.
**Disclaimer & Rights**
Educational purposes only — **not financial advice**.
Script programmed by **Mohammad Murad (MM)**.
© 2025 **Mohammad Murad**. **All rights reserved.** No unauthorized copying, distribution, or resale.
## 🇸🇦/🇸🇾 الوصف العربي
**ما هو المؤشّر؟**
محرّك مستويات جان **Square-of-9** يعرض مستويات سعرية أفقية من **Pivot** واحد باستخدام تحويل الجذر/التربيع، مع اختيار شكل زاوي جاهز (90°/60°/72°/120°/45°) أو **زاوية مخصّصة**، وخيار **أنصاف الزوايا**، ودورات متعددة، وتحكّم كامل بالمظهر، وميزة **سحب خط الصفر** لتغيير المحور بسرعة.
**أهم الميزات**
* **سحب خط الصفر:** اسحب خط الـ0 (Pivot) وضعه على أي قاع/قمة — بدون إدخال السعر يدويًا. تُعاد الحسابات فورًا.
* وضعا **Bottom/Top** لتحديد اتجاه الإسقاط.
* **أشكال جاهزة أو زاوية مخصّصة**.
* **أنصاف الزوايا (½)** بنمط/لون مستقلين.
* **الدورات (Cycles)** لتوسعة الشبكة.
* **تحكّم بصري كامل**: عناوين بحجم/مسافة، سماكة/نمط/ألوان الخطوط، ونمط خط المحور.
**الإعدادات باختصار**
Pivot Price • Pivot Type (Bottom/Top) • Space Multiplier • Geometric Shape / Custom Angle • Number of Cycles • Sub-Angles & Line Style • الألوان والسماكات • إعدادات العناوين (إظهار/حجم/مسافة).
**طريقة الاستخدام**
1. اسحب **خط الصفر** إلى القاع/القمة المطلوبة أو حدّد **Pivot Price** واختر **Bottom/Top**.
2. اختر الشكل أو **زاوية مخصّصة**؛ وفعّل **Cycles** إذا لزم.
3. عدّل **Space Multiplier** حتى ترى احتراماً تاريخياً للمستويات.
4. (اختياري) فعّل **أنصاف الزوايا** للدقة.
5. راقب **الارتداد/الاختراق/إعادة الاختبار** وادمجها مع نظامك.
**نصائح**
* اختر Pivot بنيوي واضح (Swing).
* لتقليل الزحمة: خفّض الدورات أو عطّل أنصاف الزوايا.
* دمجها مع **بنية السوق/الفوليوم/ATR/الفراكتلات** يدعم القرار.
* تحكّم بحجم/مسافة العناوين للحفاظ على نظافة الشارت.
**حلّ مشكلة السحب**
إذا ما تحرّك خط الصفر: تأكّد أن الرسومات **غير مقفولة** وأن خيار تحريك الرسومات مفعّل في إعدادات الشارت.
**إخلاء مسؤولية وحقوق**
لأغراض تعليمية فقط — **ليست نصيحة مالية**.
السكربت مبرمج بواسطة **Mohammad Murad (MM)**.
© 2025 **Mohammad Murad**. **جميع الحقوق محفوظة.** يُمنع النسخ/التوزيع/البيع دون إذن.
#Gann #SquareOf9 #SQ9 #Angles #CustomAngle #SupportResistance #PineScript #TradingView

通貨強弱メーター [DoN]This indicator is a tool that applies the Gann trend analysis method to multiple currency pairs, extracts the individual strength and weakness of each currency, and scores them. It helps you understand at a glance which currencies are being bought and which are being sold across the entire market. This allows you, for example, to identify the pair of the "strongest currency" and the "weakest currency" and utilize this as reference information when formulating your trading strategy.
このインジケーターは、Gann トレンド分析手法を複数の通貨ペアに適用し、そこから各通貨単体の強弱を抽出してスコア化するツールです。市場全体でどの通貨が買われていて、どの通貨が売られているのかを一目で把握するのに役立ちます。これにより、例えば「最も強い通貨」と「最も弱い通貨」のペアを見つけ出し、トレード戦略を立てる際の参考情報として活用できます。

Wolfe Wave Auto+ManualWolfe Wave Auto+Manual Indicator
Description
The "Wolfe Wave Auto+Manual" indicator is a powerful tool for identifying and analyzing Wolfe Wave patterns on TradingView charts. It supports both automatic pattern detection based on Gann pivots and manual point configuration for precise pattern construction. This indicator is ideal for traders looking to leverage Wolfe Waves to predict market reversals and set take-profit targets.
The indicator displays the pattern with lines, zones (Sweet Zone), and labels, offering three take-profit calculation methods: ETA (intersection of lines 1-3 and 2-4), Line 1-4 (projection of the 1-4 trendline), and Flat (Point 4 price level). Users can customize visualization and calculations, including support for linear and logarithmic price scales.
Key Features
Auto and Manual Modes: Choose between automatic pattern detection using pivots or manual input of points 1-5.
Flexible Take-Profit Options: Supports three TP methods (ETA, Line 1-4, Flat) with customizable line and label colors.
Logarithmic Scale Support: Accurate calculations for charts with linear or logarithmic price scales.
Customizable Visualization: Enable/disable pattern lines, display the Sweet Zone, and show point labels positioned on the outer edges of the pattern for better readability.
Gann Pivots: Auto mode uses pivot detection for precise identification of key points.
User-Friendly Settings: All parameters include tooltips for easy configuration.
How to Use
Add the Indicator:
Find "Wolfe Wave Auto+Manual" in the TradingView indicator library and add it to your chart.
Select Mode:
Auto: The indicator automatically detects patterns based on pivots. Adjust "Swing Length" and "Pivot Offset" to control sensitivity.
Manual: Specify the time and price for points 1-5 in the settings to build a specific pattern.
Customize Visualization:
Enable/disable pattern lines using "Show Pattern Lines."
Adjust pivot and take-profit colors in their respective setting groups.
Choose Price Scale:
Set "Price Scale" to "Linear" or "Logarithmic" based on your chart type.
Configure Take-Profits:
Enable desired TP methods (ETA, Line 1-4, Flat) and customize their colors.
Use "TP Decimal Precision" to control the precision of displayed prices.
Analyze the Pattern:
Look for entry points near Point 5, using the Sweet Zone as a confirmation area.
Use TP levels to set profit targets.
Recommendations
Timeframes: The indicator works on all timeframes, but Auto mode is recommended for H1 and higher for more reliable pivots.
Instruments: Suitable for stocks, forex, cryptocurrencies, and other assets. Use logarithmic scale for long-term charts with high volatility.
Additional Filters: Combine with RSI, MACD, or support/resistance levels to enhance signal accuracy.
Testing: Experiment with "Swing Length" in Auto mode to optimize pattern detection for your trading style.
Notes
Ensure prices in Manual mode are positive when using logarithmic scale to avoid errors.
Disable "Show Pattern Lines" to focus on labels and TP levels for a cleaner chart.
Verify settings when switching between linear and logarithmic scales.
The "Wolfe Wave Auto+Manual" indicator is a versatile addition to your trading toolkit, helping you identify high-probability reversal patterns and plan trades with clear profit targets. Try it today to elevate your market analysis!
Индикатор "Wolfe Wave Auto+Manual"
Описание
Индикатор "Wolfe Wave Auto+Manual" — мощный инструмент для выявления и анализа паттернов волн Вульфа на графиках TradingView. Этот индикатор поддерживает как автоматическое обнаружение паттернов на основе пивотов Ганна, так и ручную настройку точек для точного построения. Он идеально подходит для трейдеров, которые хотят использовать волны Вульфа для прогнозирования разворотов рынка и определения целей тейк-профита.
Индикатор отображает паттерн с линиями, зонами (Sweet Zone) и метками, а также предлагает три метода расчёта тейк-профита: ETA (пересечение линий 1-3 и 2-4), Line 1-4 (проекция линии 1-4) и Flat (уровень точки 4). Пользователь может гибко настраивать визуализацию и расчёты, включая поддержку линейной и логарифмической шкал цен.
Ключевые особенности
Автоматический и ручной режимы: Выбирайте между автоматическим обнаружением паттернов на основе пивотов или ручным заданием точек 1-5.
Гибкие настройки тейк-профита: Поддержка трёх методов TP (ETA, Line 1-4, Flat) с настраиваемыми цветами линий и меток.
Поддержка логарифмической шкалы: Корректные расчёты для графиков с линейной или логарифмической шкалой цен.
Настраиваемая визуализация: Включайте/отключайте линии паттерна, отображайте Sweet Zone и метки точек, расположенные на внешних углах конструкции для лучшей читаемости.
Пивоты Ганна: В автоматическом режиме используются пивоты для точного определения ключевых точек.
Интуитивные настройки: Все параметры сопровождаются всплывающими подсказками для удобства.
Как использовать
Добавьте индикатор:
Найдите "Wolfe Wave Auto+Manual" в библиотеке индикаторов TradingView и добавьте на график.
Выберите режим:
Auto: Индикатор автоматически определяет паттерны на основе пивотов. Настройте "Swing Length" и "Pivot Offset" для контроля чувствительности.
Manual: Задайте время и цену для точек 1-5 в настройках для построения конкретного паттерна.
Настройте визуализацию:
Включите/отключите линии паттерна через "Show Pattern Lines".
Настройте цвета пивотов и тейк-профитов в соответствующих группах настроек.
Выберите шкалу цен:
Установите "Price Scale" в "Linear" или "Logarithmic" в зависимости от типа графика.
Настройте тейк-профиты:
Включите нужные методы TP (ETA, Line 1-4, Flat) и настройте их цвета.
Используйте "TP Decimal Precision" для контроля точности отображаемых цен.
Анализируйте паттерн:
Ищите точки входа вблизи точки 5, используя Sweet Zone как зону подтверждения.
Ориентируйтесь на уровни TP для фиксации прибыли.
Рекомендации
Таймфреймы: Индикатор работает на любых таймфреймах, но для Auto-режима рекомендуется использовать таймфреймы от H1 и выше для более надёжных пивотов.
Инструменты: Подходит для акций, форекса, криптовалют и других активов. Для долгосрочных графиков с высокой волатильностью используйте логарифмическую шкалу.
Дополнительные фильтры: Комбинируйте с индикаторами RSI, MACD или уровнями поддержки/сопротивления для повышения точности сигналов.
Тестирование: Протестируйте настройки в Auto-режиме с разными значениями "Swing Length" для оптимизации обнаружения паттернов.
Примечания
Убедитесь, что цены в Manual-режиме положительные при использовании логарифмической шкалы, чтобы избежать ошибок.
Для отключения линий паттерна используйте настройку "Show Pattern Lines", чтобы сосредоточиться на метках и уровнях TP.
Регулярно проверяйте настройки при переключении между линейной и логарифмической шкалами.
Этот индикатор станет отличным дополнением к вашей торговой стратегии, помогая выявлять высоковероятные разворотные паттерны и планировать сделки с чёткими целями прибыли. Попробуйте "Wolfe Wave Auto+Manual" и улучшите свой анализ рынка!
Murrey Math Lines v6Murrey Math Lines v6
This is not just another Murrey Math indicator. It's a complete, ground-up modernization of the classic concept, rebuilt with the latest Pine Script features for unparalleled performance, accuracy, and usability. While preserving the core mathematical genius of T.H. Murrey's system, this version introduces a suite of modern tools designed for today's trader.
What are Murrey Math Lines?
Murrey Math Lines (MML) are a powerful system of support and resistance based on geometric formulas developed by T.H. Murrey. As a derivation of W.D. Gann's observations, Murrey's geometry simplifies Gann's theories into a more accessible application. The core principle is that price action tends to trend and retrace in 1/8th intervals.
These intervals create a "trading octave" with distinct levels, each having its own characteristic behavior:
& - Ultimate Resistance & Support: These lines are the hardest to break. They represent the top and bottom of the expected price range and are prime areas for reversals.
- Major Pivot: This is the most significant level, offering the strongest support and resistance within the octave. Price has a high probability of stopping and reversing here.
& - Strong Pivot/Reversal: These are strong, secondary pivot points where price often struggles to pass through.
& - The Trading Range: The price tends to consolidate between these two lines about 50% of the time. A decisive break outside this range often signals the start of a new trend.
& - Weak Support/Resistance: These levels are weaker, but when price moves too quickly towards them, they can act as initial stopping points or areas for a minor reversal.
& - Extended Octave: These lines show extreme overbought and oversold conditions beyond the primary 0/8 to 8/8 octave.
Modern Enhancements in This Version
Session-Locked Precision: Anchor the Murrey Lines to the start of a specific trading session (e.g., NYSE open). The levels remain constant for the entire session, providing a stable and reliable framework for your daily analysis.
Visual Trading & Reversal Zones: Instead of just lines, this indicator can fill the key trading range (3/8 to 5/8) and reversal zones (0/8-1/8 & 7/8-8/8) with color, giving you an instant visual reference of market sentiment.
Dynamic "Closest Price" Labels: Declutter your chart! The indicator can intelligently display only the label for the Murrey level closest to the current price, keeping your view clean while providing critical information at a glance.
Integrated Alert System: Never miss a key level touch again. Set up alerts for when the price approaches major lines, the trading range, or all lines, customized to your trading style.
Advanced Pine Script Engine: Built on a modern codebase using User-Defined Types and dynamic drawing objects (line, box, label). This ensures the indicator is fast, efficient, and non-repainting, even on lower timeframes.
Intuitive User Interface: Settings are neatly organized into collapsible groups with clear tooltips, making it incredibly easy to customize every aspect of the indicator, from calculation parameters to colors.
A Note on Accuracy
Some of the other Murrey Math indicators on TradingView use different formulas and therefore produce varying results. This version has been carefully checked against MML indicators on other professional platforms to ensure its calculations are accurate and reliable.
Credits
This indicator is a complete overhaul and modernization of the original "MM Lines " script. Full credit for the original calculation logic and concept goes to its author, JRL_6.

Radial Root AngleDescription:
Radial Root Angle is a precision geometric tool that calculates the angular trajectory of any price leg using a square-rooted price compression model. By selecting two anchor points on a move (typically swing low to swing high or vice versa), the tool computes the true angle of the leg in degrees.
Important Notes:
On low-priced assets or instruments with tight price ranges, the output angle may appear very small, with multiple decimal places.
This is a natural result of square-rooted price compression applied over time, especially when volatility is low.
In such cases, you may choose to round, scale, or interpret the angle proportionally when comparing across other legs or instruments.
Use Cases:
Identify price compression, trend exhaustion, or swing energy
Compare angular velocity across legs, assets, or timeframes
Integrate with Gann tools, harmonic cycles, or radial timing models
Build square-outs, circular projections, or geometry-based entries
Ideal For:
Traders exploring:
Gann angles and time/price geometry
Square root and harmonic market models
Sacred or astro-geometric analysis
Energetic mapping of price structure

Physics CandlesPhysics Candles embed volume and motion physics directly onto price candles or market internals according to the cyclic pattern of financial securities. The indicator works on both real-time “ticks” and historical data using statistical modeling to highlight when these values, like volume or momentum, is unusual or relatively high for some periodic window in time. Each candle is made out of one or more sub-candles that each contain their own information of motion, which converts to the color and transparency, or brightness, of that particular candle segment. The segments extend throughout the entire candle, both body and wicks, and Thick Wicks can be implemented to see the color coding better. This candle segmentation allows you to see if all the volume or energy is evenly distributed throughout the candle or highly contained in one small portion of it, and how intense these values are compared to similar time periods without going to lower time frames. Candle segmentation can also change a trader’s perspective on how valuable the information is. A “low” volume candle, for instance, could signify high value short-term stopping volume if the volume is all concentrated in one segment.
The Candles are flexible. The physics information embedded on the candles need not be from the same price security or market internal as the chart when using the Physics Source option, and multiple Candles can be overlayed together. You could embed stock price Candles with market volume, market price Candles with stock momentum, market structure with internal acceleration, stock price with stock force, etc. My particular use case is scalping the SPX futures market (ES), whose price action is also dictated by the volume action in the associated cash market, or SPY, as well as a host of other securities. Physics allows you to embed the ES volume on the SPY price action, or the SPY volume on the ES price action, or you can combine them both by overlaying two Candle streams and increasing the Number of Overlays option to two. That option decreases the transparency levels of your coloring scheme so that overlaying multiple Candles converges toward the same visual color intensity as if you had one. The Candle and Physics Sources allows for both Symbols and Spreads to visualize Candle physics from a single ticker or some mathematical transformation of tickers.
Due to certain TradingView programming restrictions, each Candle can only be made out of a maximum of 8 candle segments, or an “8-bit” resolution. Since limits are just an opportunity to go beyond, the user has the option to stack multiple Candle indicators together to further increase the candle resolution. If you don’t want to see the Candles for some particular period of the day, you can hide them, or use the hiding feature to have multiple Candles calibrated to show multiple parts of the trading day. Securities tend to have low volume after hours with sharp spikes at the open or close. Multiple Candles can be used for multiple parts of the trading day to accommodate these different cycles in volume.
The Candles do not need be associated with the nominal security listed on the TV chart. The Candle Source allows the user to look at AAPL Candles, for instance, while on a TSLA or SPY chart, each with their respective volume actions integrated into the candles, for instance, to allow the user to see multiple security price and volume correlation on a single chart.
The physics information currently embeddable on Candles are volume or time, velocity, momentum, acceleration, force, and kinetic energy. In order to apply equations of motion containing a mass variable to financial securities, some analogous value for mass must be assumed. Traders often regard volume or time as inextricable variables to a securities price that can indicate the direction and strength of a move. Since mass is the inextricable variable to calculating the momentum, force, or kinetic energy of motion, the user has the option to assume either time or volume is analogous to mass. Volume may be a better option for mass as it is not strictly dependent on the speed of a security, whereas time is.
Data transformations and outlier statistics are used to color code the intensity of the physics for each candle segment relative to past periodic behavior. A million shares during pre-market or a million shares during noontime may be more intense signals than a typical million shares traded at the open, and should have more intense color signals. To account for a specific cyclic behavior in the market, the user can specify the Window and Cycle Time Frames. The Window Time Frame splits up a Cycle into windows, samples and aggregates the statistics for each window, then compares the current physics values against past values in the same window. Intraday traders may benefit from using a Daily Cycle with a 30-minute Window Time Frame and 1-minute Sample Time Frame. These settings sample and compare the physics of 1-minute candles within the current 30-minute window to the same 30-minute window statistics for all past trading days, up until the data limit imposed by TradingView, or until the Data Collection Start Date specified in the settings. Longer-term traders may benefit from using a Monthly Cycle with a Weekly Time Frame, or a Yearly Cycle with a Quarterly Time Frame.
Multiple statistics and data transformation methods are available to convey relative intensity in different ways for different trading signals. Physics Candles allows for both Normal and Log-Normal assumptions in the physics distribution. The data can then be transformed by Linear, Logarithmic, Z-Score, or Power-Law scoring, where scoring simply assigns an intensity to the relative physics value of each candle segment based on some mathematical transformation. Z-scoring often renders adequate detection by scoring the segment value, such as volume or momentum, according to the mean and standard deviation of the data set in each window of the cycle. Logarithmic or power-law transformation with a gamma below 1 decreases the disparity between intensities so more less-important signals will show up, whereas the power-law transformation with gamma values above 1 increases the disparity between intensities, so less more-important signals will show up. These scores are then converted to color and transparency between the Min Score and the Max Score Cutoffs. The Auto-Normalization feature can automatically pick these cutoffs specific to each window based on the mean and standard deviation of the data set, or the user can manually set them. Physics was developed with novices in mind so that most users could calibrate their own settings by plotting the candle segment distributions directly on the chart and fiddling with the settings to see how different cutoffs capture different portions of the distribution and affect the relative color intensities differently. Security distributions are often skewed with fat-tails, known as kurtosis, where high-volume segments for example, have a higher-probabilities than expected for a normal distribution. These distribution are really log-normal, so that taking the logarithm leads to a standard bell-shaped distribution. Taking the Z-score of the Log-Normal distribution could make the most statistical sense, but color sensitivity is a discretionary preference.
Background Philosophy
This indicator was developed to study and trade the physics of motion in financial securities from a visually intuitive perspective. Newton’s laws of motion are loosely applied to financial motion:
“A body remains at rest, or in motion at a constant speed in a straight line, unless acted upon by a force”.
Financial securities remain at rest, or in motion at constant speed up or down, unless acted upon by the force of traders exchanging securities.
“When a body is acted upon by a force, the time rate of change of its momentum equals the force”.
Momentum is the product of mass and velocity, and force is the product of mass and acceleration. Traders render force on the security through the mass of their trading activity and the acceleration of price movement.
“If two bodies exert forces on each other, these forces have the same magnitude but opposite directions.”
Force arises from the interaction of traders, buyers and sellers. One body of motion, traders’ capitalization, exerts an equal and opposite force on another body of motion, the financial security. A securities movement arises at the expense of a buyer or seller’s capitalization.
Volume
The premise of this indicator assumes that volume, v, is an analogous means of measuring physical mass, m. This premise allows the application of the equations of motion to the movement of financial securities. We know from E=mc^2 that mass has energy. Energy can be used to create motion as kinetic energy. Taking a simple hypothetical example, the interaction of one short seller looking to cover lower and one buyer looking to sell higher exchange shares in a security at an agreed upon price to create volume or mass, and therefore, potential energy. Eventually the short seller will actively cover and buy the security from the previous buyer, moving the security higher, or the buyer will actively sell to the short seller, moving the security lower. The potential energy inherent in the initial consolidation or trading activity between buy and seller is now converted to kinetic energy on the subsequent trading activity that moves the securities price. The more potential energy that is created in the consolidation, the more kinetic energy there is to move price. This is why point and figure traders are said to give price targets based on the level of volatility or size of a consolidation range, or why Gann traders square price and time, as time is roughly proportional to mass and trading activity. The build-up of potential energy between short sellers and buyers in GME or TSLA led to their explosive moves beyond their standard fundamental valuations.
Position
Position, p, is simply the price or value of a financial security or market internal.
Time
Time, t, is another means of measuring mass to discover price behavior beyond the time snapshots that simple candle charts provide. We know from E=mc^2 that time is related to rest mass and energy given the speed of light, c, where time ≈ distance * sqrt(mass/E). This relation can also be derived from F=ma. The more mass there is, the longer it takes to compute the physics of a system. The more energy there is, the shorter it takes to compute the physics of a system. Similarly, more time is required to build a “resting” low-volatility trading consolidation with more mass. More energy added to that trading consolidation by competing buyers and sellers decreases the time it takes to build that same mass. Time is also related to price through velocity.
Velocity = (p(t1) – p(t0)) / p(t0)
Velocity, v, is the relative percent change of a securities price, p, over a period of time, t0 to t1. The period of time is between subsequent candles, and since time is constant between candles within the same timeframe, it is not used to calculate velocity or acceleration. Price moves faster with higher velocity, and slower with slower velocity, over the same fixed period of time. The product of velocity and mass gives momentum.
Momentum = mv
This indicator uses physics definition of momentum, not finance’s. In finance, momentum is defined as the amount of change in a securities price, either relative or absolute. This is definition is unfortunate, pun intended, since a one dollar move in a security from a thousand shares traded between a few traders has the exact same “momentum” as a one dollar move from millions of shares traded between hundreds of traders with everything else equal. If momentum is related to the energy of the move, momentum should consider both the level of activity in a price move, and the amount of that price move. If we equate mass to volume to account for the level of trading activity and use physics definition of momentum as the product of mass and velocity, this revised definition now gives a thousand-times more momentum to a one-dollar price move that has a thousand-times more volume behind it. If you want to use finance’s volume-less definition of momentum, use velocity in this indicator.
Acceleration = v(t1) – v(t0)
Acceleration, a, is the difference between velocities over some period of time, t0 to t1. Positive acceleration is necessary to increase a securities speed in the positive direction, while negative acceleration is necessary to decrease it. Acceleration is related to force by mass.
Force = ma
Force is required to change the speed of a securities valuation. Price movements with considerable force have considerably more impact on future direction. A change in direction requires force.
Kinetic Energy = 0.5mv^2
Kinetic energy is the energy that a financial security gains from the change in its velocity by force. The built-up of potential energy in trading consolidations can be converted to kinetic energy on a breakout from the consolidation.
Cycle Theory and Relativity
Just as the physics of motion is relative to a point of reference, so too should the physics of financial securities be relative to a point of reference. An object moving at a 100 mph towards another object moving in the same direction at 100 mph will not appear to be moving relative to each other, nor will they collide, but from an outsider observer, the objects are going 100 mph and will collide with significant impact if they run into a stationary object relative to the observer. Similarly, trading with a hundred thousand shares at the open when the average volume is a couple million may have a much smaller impact on the price compared to trading a hundred thousand shares pre-market when the average volume is ten thousand shares. The point of reference used in this indicator is the average statistics collected for a given Window Time Frame for every Cycle Time Frame. The physics values are normalized relative to these statistics.
Examples
The main chart of this publication shows the Force Candles for the SPY. An intense force candle is observed pre-market that implicates the directional overtone of the day. The assumption that direction should follow force arises from physical observation. If a large object is accelerating intensely in a particular direction, it may be fair to assume that the object continues its direction for the time being unless acted upon by another force.
The second example shows a similar Force Candle for the SPY that counters the assumption made in the first example and emphasizes the importance of both motion and context. While it’s fair to assume that a heavy highly accelerating object should continue its course, if that object runs into an obstacle, say a brick wall, it’s course may deviate. This example shows SPY running into the 50% retracement wall from the low of Mar 2020, a significant support level noted in literature. The example also conveys Gann’s idea of “lost motion”, where the SPY penetrated the 50% price but did not break through it. A brick wall is not one atom thick and price support is not one tick thick. An object can penetrate only one layer of a wall and not go through it.
The third example shows how Volume Candles can be used to identify scalping opportunities on the SPY and conveys why price behavior is as important as motion and context. It doesn’t take a brick wall to impede direction if you know that the person driving the car tends to forget to feed the cats before they leave. In the chart below, the SPY breaks down to a confluence of the 5-day SMA, 20-day SMA, and an important daily trendline (not shown) after the bullish bounce from the 50% retracement days earlier. High volume candles on the SMA signify stopping volume that reverse price direction. The character of the day changes. Bulls become more aggressive than bears with higher volume on upswings and resistance, whiles bears take on a defensive position with lower volume on downswings and support. High volume stopping candles are seen after rallies, and can tell you when to take profit, get out of a position, or go short. The character change can indicate that its relatively safe to re-enter bullish positions on many major supports, especially given the overarching bullish theme from the large reaction off the 50% retracement level.
The last example emphasizes the importance of relativity. The Volume Candles in the chart below are brightest pre-market even though the open has much higher volume since the pre-market activity is much higher compared to past pre-markets than the open is compared to past opens. Pre-market behavior is a good indicator for the character of the day. These bullish Volume Candles are some of the brightest seen since the bounce off the 50% retracement and indicates that bulls are making a relatively greater attempt to bring the SPY higher at the start of the day.
Infrequently Asked Questions
Where do I start?
The default settings are what I use to scalp the SPY throughout most of the extended trading day, on a one-minute chart using SPY volume. I also overlay another Candle set containing ES future volume on the SPY price structure by setting the Physics Source to ES1! and the Number of Overlays setting to 2 for each Candle stream in order to account for pre- and post-market trading activity better. Since the closing volume is exponential-like up until the end of the regular trading day, adding additional Candle streams with a tighter Window Time Frame (e.g., 2-5 minute) in the last 15 minutes of trading can be beneficial. The Hide feature can allow you to set certain intraday timeframes to hide one Candle set in order to show another Candle set during that time.
How crazy can you get with this indicator?
I hope you can answer this question better. One interesting use case is embedding the velocity of market volume onto an internal market structure. The PCTABOVEVWAP.US is a market statistic that indicates the percent of securities above their VWAP among US stocks and is helpful for determining short term trends in the US market. When securities are rising above their VWAP, the average long is up on the day and a rising PCTABOVEVWAP.US can be viewed as more bullish. When securities are falling below their VWAP, the average short is up on the day and a falling PCTABOVEVWAP.US can be viewed as more bearish. (UPVOL.US - DNVOL.US) / TVOL.US is a “spread” symbol, in TV parlance, that indicates the decimal percent difference between advancing volume and declining volume in the US market, showing the relative flow of volume between stocks that are up on the day, and stocks that are down on the day. Setting PCTABOVEVWAP.US in the Candle Source, (UPVOL.US - DNVOL.US) / TVOL.US in the Physics Source, and selecting the Physics to Velocity will embed the relative velocity of the spread symbol onto the PCTABOVEVWAP.US candles. This can be helpful in seeing short term trends in the US market that have an increasing amount of volume behind them compared to other trends. The chart below shows Volume Candles (top) and these Spread Candles (bottom). The first top at 9:30 and second top at 10:30, the high of the day, break down when the spread candles light up, showing a high velocity volume transfer from up stocks to down stocks.
How do I plot the indicator distribution and why should I even care?
The distribution is visually helpful in seeing how different normalization settings effect the distribution of candle segments. It is also helpful in seeing what physics intensities you want to ignore or show by segmenting part of the distribution within the Min and Max Cutoff values. The intensity of color is proportional to the physics value between the Min and Max Cutoff values, which correspond to the Min and Max Colors in your color scheme. Any physics value outside these Min and Max Cutoffs will be the same as the Min and Max Colors.
Select the Print Windows feature to show the window numbers according to the Cycle Time Frame and Window Time Frame settings. The window numbers are labeled at the start of each window and are candle width in size, so you may need to zoom into to see them. Selecting the Plot Window feature and input the window number of interest to shows the distribution of physics values for that particular window along with some statistics.
A log-normal volume distribution of segmented z-scores is shown below for 30-minute opening of the SPY. The Min and Max Cutoff at the top of the graph contain the part of the distribution whose intensities will be linearly color-coded between the Min and Max Colors of the color scheme. The part of the distribution below the Min Cutoff will be treated as lowest quality signals and set to the Min Color, while the few segments above the Max Cutoff will be treated as the highest quality signals and set to the Max Color.
What do I do if I don’t see anything?
Troubleshooting issues with this indicator can involve checking for error messages shown near the indicator name on the chart or using the Data Validation section to evaluate the statistics and normalization cutoffs. For example, if the Plot Window number is set to a window number that doesn’t exist, an error message will tell you and you won’t see any candles. You can use the Print Windows option to show windows that do exist for you current settings. The auto-normalization cutoff values may be inappropriate for your particular use case and literally cut the candles out of the chart. Try changing the chart time frame to see if they are appropriate for your cycle, sample and window time frames. If you get a “Timeframe passed to the request.security_lower_tf() function must be lower than the timeframe of the main chart” error, this means that the chart timeframe should be increased above the sample time frame. If you get a “Symbol resolve error”, ensure that you have correct symbol or spread in the Candle or Physics Source.
How do I see a relative physics values without cycles?
Set the Window Time Frame to be equal to the Cycle Time Frame. This will aggregate all the statistics into one bucket and show the physics values, such as volume, relative to all the past volumes that TV will allow.
How do I see candles without segmentation?
Segmentation can be very helpful in one context or annoying in another. Segmentation can be removed by setting the candle resolution value to 1.
Notes
I have yet to find a trading platform that consistently provides accurate real-time volume and pricing information, lacking adequate end-user data validation or quality control. I can provide plenty of examples of real-time volume counts or prices provided by TradingView and other platforms that were significantly off from what they should have been when comparing against the exchanges own data, and later retroactively corrected or not corrected at all. Since no indicator can work accurately with inaccurate data, please use at your own discretion.
The first version is a beta version. Debugging and validating code in Pine script is difficult without proper unit testing. Please report any bugs with enough information to reproduce them and indicate why they are important. I also encourage you to export the data from TradingView and verify the calculations for your particular use case.
The indicator works on real-time updates that occur at a higher frequency than the candle time frame, which TV incorrectly refers to as ticks. They use this terminology inaccurately as updates are really aggregated tick data that can take place at different prices and may not accurately reflect the real tick price action. Consequently, this inaccuracy also impacts the real-time segmentation accuracy to some degree. TV does not provide a means of retaining “tick” information, so the higher granularity of information seen real-time will be lost on a disconnect.
TV does not provide time and sales information. The volume and price information collected using the Sample Time Frame is intraday, which provides only part of the picture. Intraday volume is generally 50 to 80% of the end of day volume. Consequently, the daily+ OHLC prices are intraday, and may differ significantly from exchanged settled OHLC prices.
The Cycle and Window Time Frames refer to calendar days and time, not trading days or time. For example, the first window week of a monthly cycle is the first seven days of the month, not the first Monday through Friday of trading for the month.
Chart Time Frames that are higher than the Window Time Frames average the normalized physics for price action that occurred within a given Candle segment. It does not average price action that did not occur.
One of the main performance bottleneck in TradingView’s Pine Script is client-side drawing and plotting. The performance of this indicator can be increased by lowering the resolution (the number of sub-candles this indicator plots), getting a faster computer, or increasing the performance of your computer like plugging your laptop in and eliminating unnecessary processes.
The statistical integrity of this indicator relies on the number of samples collected per sample window in a given cycle. Higher sample counts can be obtained by increasing the chart time frame or upgrading the TradingView plan for a higher bar count. While increasing the chart time frame doesn’t increase the visual number of bars plotted on the chart, it does increase the number of bars that can be pulled at a lower time frame, up to 100,000.
Due to a limitation in Pine Scripts request_lower_tf() function, using a spread symbol will only work for regular trading hours, not extended trading hours.
Ideally, velocity or momentum should be calculated between candle closes. To eliminate the need to deal with price gaps that would lead to an incorrect statistical distributions, momentum is calculated between candle open and closes as a percent change of the price or value, which should not be an issue for most liquid securities.

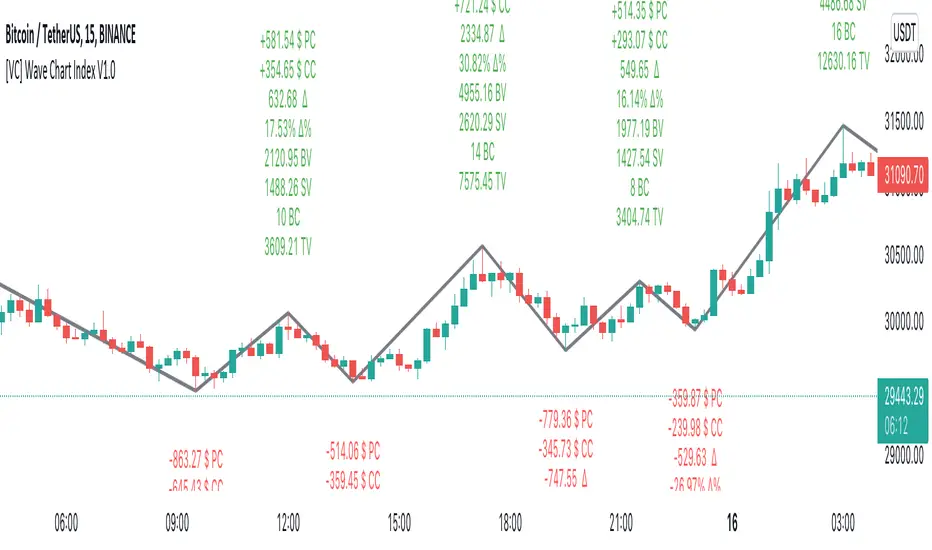
[VC] Wave Chart Index V1.0V.C Wave Chart Index
Richard D. Wyckoff created the first wave chart, and he instructed students to think in waves. He was an early 20th-century pioneer in the technical approach to studying the stock market and is considered one of the five "titans" of technical analysis, along with Dow, Gann, Elliott and Merrill.
V.C Wave Chart Index is the most comprehensive version of Wyckoff's theory. It is used to measure the strength & weakness of each market move by comparative data analysis. It draws waves on the chart based on Gann Swing theory. At the end of each wave, a label shows all the cumulative data & information of the wave.
With the help of this indicator, You can measure each swing or high/low movement of the market by comparing it with previous high/low price movements. The comparison can be made by using the following data of each wave.
Price Change
Volume Change
Delta Change
Delta % Change
Buy Volume
Sell Volume
Time Spent (Bar Counter)
V.C Wave Chart Index is not only an indicator but itself a unique & comprehensive tool kit to measure & compare each move of the market. This tool enables you to see deep inside each movement of the market. It allows you to observe the nitty-gritty data of each wave at the micro-level with your nacked eyes. With the help of Delta & (C.C) Close to Close Price Change, it is now easy to apply effort & result and cause & effect theory to your analysis. (total volume, buy volume, sell volume & delta % can also be used for comparative analysis)
V.C Wave Chart Index Properties
Price Change or (P.C): Shows the price Change of the Wave
Buy Volume (B.V): Shows the Cumulative Buy Volume of the Wave
Sell Volume (S.V): Shows the Cumulative Sell Volume of the Wave
Delta Volume (∆): Shows the Cumulative Buy - Sell Volume of the Wave
Delta % ∆ : Shows the Cumulative Delta % of the wave
Total Volume (T.V): Shows the Cumulative Total Volume of the Wave
Bar Count (B.C): Shows how much time it took to Complete the Wave
Swing Price: Shows the Reversal Price of the Wave
V.C Wave Chart Index Settings & Inputs Explained
Sensitivity (%): This input helps you adjust to the wave's steepness. 0.001 is my recommended value for all time frames.
Cumulation: This input helps you to control the length & formation of the wave: ( the fewer values = more wave formations & vice versa)
Wave Color: Allow you to change the color of the wave
Draw to Latest Candle: Allow you to show/hide the latest or real-time wave & data.
Divisor: Allow you to divide extensive numeric data into small numbers to read it easily.
Align Text: Allow you to align the text.
Size Text: Allow you to change the size of the text.
Display Toal Delta: Allow you to show or hide total Delta (∆).
Display Percentage Delta (%): Allow you to show or hide Delta (∆) %.
Color Wave Buy: Allow you to change the color.
Color Wave Sell: Allow you to change the color.
Display Total Volume (T.V): Allow you to show/hide total volume
Display Buy Volume (B.V): Allow you to show/hide buy volume
Display Sell Volume (S.V): Allow you to show/hide sell volume
Display Swing Price: Allow you to show/hide swing price
Display Swing Price Change (P.C): Allow you to show/hide price change
Display Close to Close Price Change (C.C): Allow you to show/hide close to close price changes. (previous wave close to current wave close) (recommended for comparative analysis)
P.C Format: Allow you to select the price formate
C.C Format: Allow you to select the price formate
Display Bar Counter (B.C): Allow you to show/hide the bar counter
Comparative Data Analysis Example in the light of Effort & Result Theory
A short explanation of the above analysis
On Wave A , the close to close price change (C.C) is $354 . (its the distance of price that price travelled from the low of the previous wave)
and price travelled this distance with 632 Delta (Delta is an effort which is used to travel the price)
On Wave B , close to close price change (C.C) is -$359 , almost the same distance as the previous wave. But for this distance price used 47% more Delta than the last wave. ( previous Delta is 632 , but current Delta is 931 that is 47% extra)
It indicates that sellers have put more effort in Wave B than Wave A . However, they got similar results as the previous wave. In other words
More Effort & Less Result = Reversal Sign
(that's why in the above example price reversed from a support level)
* Notice that Wave B is also on a key support area/level. And on key support or resistance area, this kind of comparative analysis can give an extra edge in your analysis.
Disclaimer Note:
V.C Wave Chart Index is not a BUY/SELL signal based indicator or a holy grail trading system.
It is purely Volume, Delta and comparative analysis based indicator. Before applying this indicator to your analysis, you should know about V.S.A, Volume, Delta & Spread.
Some basic understanding of Sir Richerd Wyckoff's Theory can also be helpful.
Trading Sign
<< Trading Sign Documents >> (Revision: 1193)
This is a guide for trading timing.
It is not a guarantee of profit.
The Trading Sign script displays a combination of SMAs, trendlines, channel lines, etc., but this combination part is not the core of the script.
These are all about finding resistance and support prices and creating an array.
The concept of this script is to draw the lines automatically by the program, not by discretion, and to show Buy and Sell signs in order to establish a stable trading rule.
'N Theory' is applied to the automatically drawn trendlines.
Interval Multiple:
Specifies the trade interval in multiples.
If you decrease the multiple, the number of trades will increase and the trades will be short term.
If you increase the multiple, the number of trades will decrease and you will be trading in the medium term.
Adjust according to the market atmosphere and your own trading interval.
MA(Fast)(Midd)(Slow):
Specify the SMA period.
Depending on this setting, the trade timing will change.
N Length:
This is the period of time to search for the starting point of a trend line, etc. in the past.
- (Example) When N Length = 100
- The bar position obtained by searching for the lowest price in the 100-bar period is set to Low1.
- The bar position obtained by searching for the highest price in the period up to Low1 is called High1.
- The bar position obtained by searching for the lowest price in the period up to High1 is called Low2.
- The bar position obtained by searching for the highest price in the period up to Low2 is called High2.
- Since the line connecting Low1, High1, Low2, and High2 resembles the shape of N, it is called N Length.
- A trend line is drawn by connecting Low1-Low2 and High1-High2.
- Channel lines are also drawn based on this.
Target Band Multiple:
This is the standard deviation multiple that is used as a guide for the target price for profit booking.
Predict one future:
Specifies whether the trendline, Gann Fan, is calculated using the most recent bar or one previous bar.
Usually, it is calculated with one previous bar to confirm the breakout.
This is used to predict the next day's trade after the market closes.
Show TradingSign:
Toggles between showing and hiding the trading sign.
Show TradingZone:
Toggles between showing and hiding the trading range.
Show TrendLine:
Toggles between showing and hiding the trendline.
See also the explanation of N Length.
Show ChannelLine:
Toggles between showing and hiding the channel line.
Channels are drawn based on the trendline.
+(Channel Multiple):
Allows you to specify an interval based on the slope of the trendline.
The specified range is -3.0 to +3.0.
Normally, the interval is equal (0.25, 0.50, 0.75, 1.00).
It can be set to Fibonacci (0.382, 0.500, 0.618, 1.000) or
It can also be used as an extension (1.0, 1.382, 1.500, 1.618).
Show AngleLine:
Toggles between showing and hiding the Gann Fan.
Plan Range Offset:
This is the number of ticks to extend from resistance and support prices.
Losscut can be adjusted.
Loose TrendLine:
Toggles the rule for drawing trend lines.
Plan Position (Top/Bottom)(Left/Right):
Specifies the display position of the Plan table.
Alert Freq on Bar close:
Toggles the timing of alert notifications.
(True: Alert will be sent after the bar is closed.)
(False: Notify the first time a condition is met)
Alert on *:
Notifies you when to buy or sell.
After setting this, you need to set up the alert dialog in TradingView.
Thank you very much.

QuadropocketJe vous présente Quadropocket ( Script avec config par default pour cross Leverage ) a vous d'adaptez vos leviez ou vos holds
Il ce compose de :
- Retracement Gann pour s'adapter plus facilement au grosse réactions de marché comparé au fibonacci qui sont plus adapté a des mouvement de vagues , a cela est adapté du LSMA pour l'indication claire et net de la tendance lors du cross .
- Oscillateur de prix moyen pondéré en fonction du volume .
- ATR 14 pour calculer la tendance de la journée par rapport a la volatilité en cas de changement de tendance ou cassure Resistance/Support .
- RSX de Jurik pour évitez les bruit de mèches du RSI qui n'ont pas leurs place dans une stratégie de tendance .
- RSX-D pour les safe stop en petites UTs .
- BULL BEAR power trend en suppléments pour les confirmations de changements de tendance , ou confirmations de tendance .
- Indice d'agitation (CHOP) pour voir si les loups sont agités et si le scalp en vos le coup compte tenu de la volatilité , pour une compréhension de l'indicateur ; les valeurs plus élevées indiquent une consolidation, tandis que les valeurs moins élevées indiquent des tendances directionnelles .
-Slow Stochastic pour les entrée en tendance .
- Confiance du marché par rapport a la journée précédentes 0 = manque de confiance du marché , 100 = confiance en ce marché (volumes de transactions constant) .
- Bandes de Bollinger .
- Pivots courts(200 périodes ) , moyens(500 périodes ) , longs thermes (1400 périodes ) .
- Jurik MA pour éviter les bruits et les décalages temporaires des MA qui peuvent nous faire perdre un temps précieux sur un retournement de tendance .
- Volume Delta pour le calcul de l'offre et la demande suivant les zones de distributions .
- Klinger Volume pour déterminer la tendance haussière ou baissière des prix en intraday produit par la pression des acheteurs ou vendeurs et retenir les points haut/bas .
- Moyennes mobiles 55/200/400/800/1200 .
- Ichimoku spécial crypto 20-60-120-30 .
- Nuage Supertrend double setup (2-44 4-144) pour les invalidations (3-10 6-10) pour les entrées .
Tout cela accompagné d'un label pour un aperçu du trade en un coup d'œil
Tout compléments ou back testing que ce soit BTCUSDT / ETHUSDT est toujours le bienvenue
===================================================================================================================
Note: Testé avec différentes UT en PaperTrading avant tout trades en argent Réel
- Unité de temps préféré = m3
- Paires preféré = BTC_USDTPerp
===================================================================================================================
For english community
I present to you Quadropocket (Script with config by default for cross Leverage) to you to adapt your levies or your holds
It consists of:
- Retracement Gann to adapt more easily to large market reactions compared to fibonacci which are more adapted to wave movements, this is adapted from LSMA for the clear and clear indication of the trend during the cross.
- Volume weighted average price oscillator.
- ATR 14 to calculate the trend of the day in relation to the volatility in the event of a trend change or Resistance / Support breakout.
- Jurik's RSX to avoid the noise of RSI bits that have no place in a trend strategy.
Jurik RSX
- RSX-D for safe stops in small UTs.
RSX-D
- BULL BEAR power trend in supplements for confirmations of trend changes, or confirmations of trend.
Bull Bear Power Trend
- Agitation index (CHOP) to see if the wolves are agitated and if the scalp in your shot given the volatility, for an understanding of the indicator; higher values indicate consolidation, while lower values indicate directional trends.
-Slow Stochastic for entry into trend.
- Market confidence compared to the previous day 0 = lack of confidence in the market, 100 = confidence in this market (constant transaction volumes).
Excel Confidence%
- Bollinger bands.
- Short pivot (200 periods), medium (500 periods), long thermal baths (1400 periods).
- Jurik MA to avoid noise and temporary shifts in MA which can waste precious time on a trend reversal.
Jurik Moving Average
- Delta volume for the calculation of supply and demand according to the distribution zones.
- Klinger Volume to determine the upward or downward trend in intraday prices produced by pressure from buyers or sellers and retain high / low points.
- Moving averages 55/200/400/800/1200.
- Special crypto Ichimoku 20-60-120-30.
- Nuage Supertrend double setup (2-44 4-144) for invalidations (3-10 6-10) for entries.
All this accompanied by a label for an overview of the trade at a glance
Any additions or back testing whether BTCUSDT / ETHUSDT is always welcome
=================================================== =================================================== ===============
Note: Tested with different TUs in PaperTrading before any real money trades
- Preferred unit of time = m3
- Preferred pairs = BTC_USDTPerp
=================================================== =================================================== ===============
Planetary Aspects & Transits█ OVERVIEW
Planetary Aspects and Transits are commonly used by Astrology Traders and Gann Traders for various reasons. This script is designed to highlight these planetary aspects and transitions on your chart. You can select your favorite planet -including the sun and the moon- and also select the aspect that you would like to view and this script will highlight it on the chart. The aspects that are included to choose from are ( 0, 30, 45, 60, 72, 90, 120, 135, 144, 150, and 180 degrees ). You can also select the mode of these aspects and transits ( Heliocentric vs Geocentric ).
This script offers two running options :
1. Planet vs aspect : using this option you will be able to select a planet and an aspect and we will find/highlight all the transitions vs all the planets in that aspect.
2. Planet vs Planet : using this option you will be able to select two planet and a single aspect to view on the chart.
█ Future Plans and upgrades to this script may include :
1. Enhanced algorithm for a faster loading/processing script.
2. More future dates plotting.
And more! Feel free to contact me with any feature that you would like to see in this script
█ How to use :
1. Open the settings.
2. Choose the planet/planets, and the aspect.
3. Enable the option.
Give the script a few seconds and you should be set.
This script is coded as an addon to the Gann ToolBox package/scripts.

Retrograde Planets█ OVERVIEW
Retrograde Planets is a TradingView script that highlights the retrograde cycles for all the planets including : Mercury, Venus, Mars, Jupiter, Saturn, etc etc..
A lot of Time-Theory/Gann traders use these cycles to gauge volatility and trend of the market. This script can highlight all the previous retrograde cycles of any planet of your choice.
The settings are easy and simple, you will just need to select the planet and activate it from the setting. And of course, you can change the color of the highlighted area.
Retrograde Planets can also project the future retrograde cycles and highlights them for you a year in advance ( 365 days ).
█ Future Plans and upgrades to this script may include :
1. Advance labeling.
2. Statistics box.
And more! Feel free to contact me with any feature that you would like to see in this script
█ How to use :
1. Open the settings.
2. Choose the planet.
3. Enable the Cycles using the checkbox.
Give the script a few seconds and you should be set.
This script is coded as an addon to the Gann ToolBox package/scripts.

GSO + RSI + MACD + MFI + Bollinger BandsThis script uses a Gann Swing Oscillator , RSI , MACD , MFI and Bollinger Bands to generate long and short signals for cryptocurrencies on the 5 minute chart.
The Gann Swing Oscillator was inspired by HPotter's GSO.
This script is for educational purposes only. This script is NOT to be used as financial advice. I will not accept liability for any losses which may occur as a result of using this script.

Astro ToolBox V1Astro ToolBox V1 - v1.0
█ OVERVIEW
The Astro ToolBox is meant to be a complementary script to the Gann ToolBox package. This script aims to offer a data set that was very hard to obtain through TradingView. Mainly Ephemeris Data.
The current first version allows the user to select a date and a planet and gives them the Longitude, and the Latitude of that planet on the date choose.
There are differences when it comes to Heliocentric and Geocentric locations. This script also includes options to select between Heliocentric and Geocentric locations/angles.
This script took a lot of research and fine tuning to get all this data to this great platform. The script does a lot of calculations to obtain this data and come up with it within 1-2 arc seconds of accuracy.
█ Future Plans and upgrades to this script may include :
Planetary Retrograde auto plotting. ( hopefully within the next 2-3 weeks )
Planetary Aspects and Transits. ( next in line after the retrogrades )
Aspects and Transits based on a natal date of your choosing.
and hopefully more, if you have any suggestions please don't hesitate to contact me.
█ How to use :
Simply select the date that you would like to look up.
Then select the planet / cycle.
You will have a chance to choose between a Heliocentric or a geocentric ecliptic view.
Once you select what you need, you will find your data in the lower right-hand side of the screen.
It is always recommended to keep your chart set to "EXCHANGE TIME" rather than "UTC or any other"
and hopefully more, if you have any suggestions please don't hesitate to contact me.
█ Things to keep in mind :
1. The moon is only Geocentric.
2. No this data does not rely on an external API coming from a space agency or any observatory but it is all calculated through a series of formulas and calculation which is why it is always good enough but not a %100 accurate. I personally find it extremely useful for Trading if one is familiar with time/gann theory.