Volume Climax Reversal (VCR) — Catch Exhaustion Tops & BottomsNew! VCR spots exhaustion spikes at highs/lows using volume extremes + price action + VWAP context.
If you trade parabolic runners, indices, or mean-reversion edges, VCR helps you time the backside (shorts) and fade capitulation (longs) with clean, rule-based signals.
What it does
Detects volume climax: current volume > SMA(len) × multiplier and a new volume high in the lookback.
Confirms price context: makes a higher high (for tops) or lower low (for bottoms).
Filters with VWAP (optional): bearish signals only below VWAP, bullish signals only above VWAP.
Optional wick filter: requires an exhaustion wick > body to reduce chop.
Why traders like it
Clear entries: “VCR↓” (bearish) at exhaustion tops, “VCR↑” (bullish) at washout lows.
Fewer false signals: VWAP gating + wick filter focus on true climaxes.
Built-in alerts: set once, get notified on your phone/desktop when a setup appears.
How I trade it (simple playbook)
Bearish reversal (short / puts)
Wait for VCR↓ (exhaustion at/near HH).
Look for a lower high that fails to reclaim the signal candle high.
Enter on the break of that lower-high candle low.
Stop above the signal wick high.
Covers/targets: VWAP first; then 20–30% fade from the local top / prior demand.
Bullish reversal (long / calls)
Wait for VCR↑ (capitulation at/near LL).
Look for a higher low that holds above the signal candle low.
Enter on the break of the HL candle high.
Stop below the signal wick low.
Targets: VWAP first; then prior supply/MA bands.
Tip for small-cap/“Dux” style: VCR pairs perfectly with a gap + high USD-rotation scan. Let them blow off, then use VCR for the timing.
Inputs (tune to your market)
Volume SMA Length (default 20)
Volume Spike Multiplier (default 2.0)
Lookback High / Low (default 10 / 10)
Require VWAP confirmation? (on)
Use wick filter? (on)
Works on stocks, indices, futures, crypto.
Timeframes: 1–15m for day trading; 1h–4h–D for swing.
Alerts
Set one (or both) alerts and forget it:
Bearish Volume Climax — VCR↓
Bullish Volume Climax — VCR↑
You’ll get instant notifications when a qualified top/bottom prints.
Best practices
Don’t countertrend the first front-side ramp—wait for the VCR and a lower-high/higher-low.
Respect VWAP: it’s your first profit-taking and a bias filter.
Size small into volatility; widen stops in fast markets.
Combine with your watchlist filters (gap %, float/O/S, USD rotation, session timing).
What’s included
Clean visual signals (triangles + subtle background shading)
Session-anchored VWAP
Alert conditions that appear in TradingView’s alert menu
Sensible defaults + clear docs (this post)
FAQ
Q: Does it repaint?
No. VCR uses completed-bar data; signals print end-of-bar.
Q: Which markets?
Anything with volume: US equities, futures, crypto, indices.
Q: Can I use it for scalps?
Yes—1–5m with wick filter on and VWAP required works well.
Get more / upgrades
I’m iterating fast (MTF filter, heatmap panel, combined “one-alert” mode).
Want the pro template with dashboard & combined alerts? Message me on TV or DM / email you@domain.com
.
Risk Notice
This is educational research, not financial advice. Markets carry risk—always manage position size and use stops.
If this helped you, smash the 👍 and ⭐ — it really helps!
#volume #vwap #reversal #exhaustion #trendreversal #smallcaps #scalping #daytrading #swingtrading #stocks #futures #crypto #indicator
Поиск скриптов по запросу "heatmap"

300/200 EMA Spread HeatmapHighlights the difference between 300 and 200 EMA to indicated potential over extensions in breakout structures.

RSI Heatmap (≤35 Highlight)Highlights when RSI is less than or equal to 35 which can signal a potential reversal soon.

Directional Volume Cloud MTFThe Directional Volume Cloud MTF transforms raw volume into a visually intuitive cloud histogram that highlights directional bias and exhaustion zones.
🔍 Core Logic
- Volume bias is calculated using candle direction (bullish/bearish) and smoothed via EMA.
- Bias strength is normalized against average volume to produce a ratio from -1 to +1.
- Color and opacity dynamically reflect bias direction and strength — pale clouds indicate weak volume, while vivid clouds signal strong conviction.
Features
- Customizable bullish/bearish colors
- Dynamic opacity based on volume strength
- Declining volume signals for potential reversals
- Multi-timeframe bias overlay (e.g., daily bias on intraday chart)
📈 Use Cases
- Spot volume exhaustion before reversals
- Confirm breakout strength with bias intensity
- Compare short-term vs long-term volume pressure
Whether you're scalping intraday moves or validating swing setups, this cloud-based volume heatmap offers a clean, modular way to visualize market conviction.

Ichimoku MultiTF WillyArt v1.0.0What this indicator does
Ichimoku WillyArt turns the Ichimoku lines into angle-based momentum across multiple timeframes (W, D, 4H, 1H, 30m, 5m).
For each TF it computes the slope (angle in degrees) of:
Tenkan-sen
Kijun-sen
Senkou Span A
Senkou Span B
Angles are normalized so they’re comparable across assets and scales. You get a table with the angle per line and a quick emoji direction (↑, →, ↓), optional plots of the chosen line, and ready-to-use alerts.
Why angle?
Slope-as-degrees is an intuitive proxy for momentum/impulse:
Positive angle → line rising (bullish impulse).
Negative angle → line falling (bearish impulse).
Near zero → flat/indecisive.
Two normalization modes
ATR (default): slope / ATR. Robust across instruments; less sensitive to price level.
%Price: slope / price. More sensitive; can highlight subtle turns on low-volatility symbols.
Inputs you’ll actually care about
Timeframes: W, D, 4H, 1H, 30m, 5m (all fetched MTF, independent of chart TF).
Ichimoku lengths: Tenkan (9), Kijun (26), Span B (52) — standard defaults.
Bars for slope (ΔN): How many bars back the slope is measured. Higher = smoother, slower.
Threshold (°) for “strong”: Angle magnitude that qualifies as strong ↑/↓.
What you’ll see
Matrix/Table (top-right): For each TF, the angle (°) of Tenkan, Kijun, Span A, Span B + an emoji:
↑ above threshold, ↓ below −threshold, → in between.
Optional plots: Toggle “Plot angles” to visualize the chosen series’ angle across TFs.
Alerts included (ready to pick in “Create Alert”)
Sustained state: e.g., “Kijun 4H: strong ↑ angle” triggers while angle > threshold.
Threshold cross (one-shot): e.g., “Kijun 1H: upward threshold cross” fires on crossing.
Consensus (multi-TF): “Kijun consensus ↑ (D/4H/1H/30m/5m)” when all selected TFs align up (and the symmetric down case).
Messages are constant strings (TradingView requirement), so they compile cleanly. If you want dynamic text (current angle, threshold value, etc.), enable your own alert() calls—this script structure supports adding them.
How to use it (workflow)
Add to chart. No need to switch chart TF; the script pulls W/D/4H/1H/30m/5m internally.
Pick normalization. Start with ATR. Switch to %Price if you want more sensitivity.
Set ΔN & threshold.
Intraday momentum: try ΔN = 3–5 and threshold ≈ 4–8°.
Swing/position: ΔN = 5–9 and threshold ≈ 3–6° (with ATR).
Scan the table. Look for alignment (multiple TFs with ↑ or ↓ on Kijun/Spans).
Kijun + Span A up together → trending push.
Span B up/down → cloud baseline tilting (trend quality).
Turn on alerts that match your style: reactive cross for entries, sustained for trend follow, consensus to filter noise.
Reading tips
Kijun angle: great “trend backbone.” Strong ↑ on several TFs = higher-probability pullback buys.
Span A vs. Span B:
Span A reacts faster (momentum).
Span B is slower (structure).
When both tilt the same way, the cloud is genuinely rotating.
Mixed signals? Use higher TFs (W/D/4H) as bias, lower TFs (1H/30m/5m) for timing.
Good to know (limits & best practices)
Angles measure rate of change, not overbought/oversold. Combine with price structure and risk rules.
Extremely low volatility or illiquid symbols can produce tiny angles—%Price mode may help.
ΔN and thresholds are contextual: adapt per market (crypto vs FX vs equities).
Want me to bundle a “pro template” of alert presets (intraday / swing) and a heatmap color scale for the table? Happy to ship v2. 🚀

Historical Matrix Analyzer [PhenLabs]📊Historical Matrix Analyzer
Version: PineScriptv6
📌Description
The Historical Matrix Analyzer is an advanced probabilistic trading tool that transforms technical analysis into a data-driven decision support system. By creating a comprehensive 56-cell matrix that tracks every combination of RSI states and multi-indicator conditions, this indicator reveals which market patterns have historically led to profitable outcomes and which have not.
At its core, the indicator continuously monitors seven distinct RSI states (ranging from Extreme Oversold to Extreme Overbought) and eight unique indicator combinations (MACD direction, volume levels, and price momentum). For each of these 56 possible market states, the system calculates average forward returns, win rates, and occurrence counts based on your configurable lookback period. The result is a color-coded probability matrix that shows you exactly where you stand in the historical performance landscape.
The standout feature is the Current State Panel, which provides instant clarity on your active market conditions. This panel displays signal strength classifications (from Strong Bullish to Strong Bearish), the average return percentage for similar past occurrences, an estimated win rate using Bayesian smoothing to prevent small-sample distortions, and a confidence level indicator that warns you when insufficient data exists for reliable conclusions.
🚀Points of Innovation
Multi-dimensional state classification combining 7 RSI levels with 8 indicator combinations for 56 unique trackable market conditions
Bayesian win rate estimation with adjustable smoothing strength to provide stable probability estimates even with limited historical samples
Real-time active cell highlighting with “NOW” marker that visually connects current market conditions to their historical performance data
Configurable color intensity sensitivity allowing traders to adjust heat-map responsiveness from conservative to aggressive visual feedback
Dual-panel display system separating the comprehensive statistics matrix from an easy-to-read current state summary panel
Intelligent confidence scoring that automatically warns traders when occurrence counts fall below reliable thresholds
🔧Core Components
RSI State Classification: Segments RSI readings into 7 distinct zones (Extreme Oversold <20, Oversold 20-30, Weak 30-40, Neutral 40-60, Strong 60-70, Overbought 70-80, Extreme Overbought >80) to capture momentum extremes and transitions
Multi-Indicator Condition Tracking: Simultaneously monitors MACD crossover status (bullish/bearish), volume relative to moving average (high/low), and price direction (rising/falling) creating 8 binary-encoded combinations
Historical Data Storage Arrays: Maintains rolling lookback windows storing RSI states, indicator states, prices, and bar indices for precise forward-return calculations
Forward Performance Calculator: Measures price changes over configurable forward bar periods (1-20 bars) from each historical state, accumulating total returns and win counts per matrix cell
Bayesian Smoothing Engine: Applies statistical prior assumptions (default 50% win rate) weighted by user-defined strength parameter to stabilize estimated win rates when sample sizes are small
Dynamic Color Mapping System: Converts average returns into color-coded heat map with intensity adjusted by sensitivity parameter and transparency modified by confidence levels
🔥Key Features
56-Cell Probability Matrix: Comprehensive grid displaying every possible combination of RSI state and indicator condition, with each cell showing average return percentage, estimated win rate, and occurrence count for complete statistical visibility
Current State Info Panel: Dedicated display showing your exact position in the matrix with signal strength emoji indicators, numerical statistics, and color-coded confidence warnings for immediate situational awareness
Customizable Lookback Period: Adjustable historical window from 50 to 500 bars allowing traders to focus on recent market behavior or capture longer-term pattern stability across different market cycles
Configurable Forward Performance Window: Select target holding periods from 1 to 20 bars ahead to align probability calculations with your trading timeframe, whether day trading or swing trading
Visual Heat Mapping: Color-coded cells transition from red (bearish historical performance) through gray (neutral) to green (bullish performance) with intensity reflecting statistical significance and occurrence frequency
Intelligent Data Filtering: Minimum occurrence threshold (1-10) removes unreliable patterns with insufficient historical samples, displaying gray warning colors for low-confidence cells
Flexible Layout Options: Independent positioning of statistics matrix and info panel to any screen corner, accommodating different chart layouts and personal preferences
Tooltip Details: Hover over any matrix cell to see full RSI label, complete indicator status description, precise average return, estimated win rate, and total occurrence count
🎨Visualization
Statistics Matrix Table: A 9-column by 8-row grid with RSI states labeling vertical axis and indicator combinations on horizontal axis, using compact abbreviations (XOverS, OverB, MACD↑, Vol↓, P↑) for space efficiency
Active Cell Indicator: The current market state cell displays “⦿ NOW ⦿” in yellow text with enhanced color saturation to immediately draw attention to relevant historical performance
Signal Strength Visualization: Info panel uses emoji indicators (🔥 Strong Bullish, ✅ Bullish, ↗️ Weak Bullish, ➖ Neutral, ↘️ Weak Bearish, ⛔ Bearish, ❄️ Strong Bearish, ⚠️ Insufficient Data) for rapid interpretation
Histogram Plot: Below the price chart, a green/red histogram displays the current cell’s average return percentage, providing a time-series view of how historical performance changes as market conditions evolve
Color Intensity Scaling: Cell background transparency and saturation dynamically adjust based on both the magnitude of average returns and the occurrence count, ensuring visual emphasis on reliable patterns
Confidence Level Display: Info panel bottom row shows “High Confidence” (green), “Medium Confidence” (orange), or “Low Confidence” (red) based on occurrence counts relative to minimum threshold multipliers
📖Usage Guidelines
RSI Period
Default: 14
Range: 1 to unlimited
Description: Controls the lookback period for RSI momentum calculation. Standard 14-period provides widely-recognized overbought/oversold levels. Decrease for faster, more sensitive RSI reactions suitable for scalping. Increase (21, 28) for smoother, longer-term momentum assessment in swing trading. Changes affect how quickly the indicator moves between the 7 RSI state classifications.
MACD Fast Length
Default: 12
Range: 1 to unlimited
Description: Sets the faster exponential moving average for MACD calculation. Standard 12-period setting works well for daily charts and captures short-term momentum shifts. Decreasing creates more responsive MACD crossovers but increases false signals. Increasing smooths out noise but delays signal generation, affecting the bullish/bearish indicator state classification.
MACD Slow Length
Default: 26
Range: 1 to unlimited
Description: Defines the slower exponential moving average for MACD calculation. Traditional 26-period setting balances trend identification with responsiveness. Must be greater than Fast Length. Wider spread between fast and slow increases MACD sensitivity to trend changes, impacting the frequency of indicator state transitions in the matrix.
MACD Signal Length
Default: 9
Range: 1 to unlimited
Description: Smoothing period for the MACD signal line that triggers bullish/bearish state changes. Standard 9-period provides reliable crossover signals. Shorter values create more frequent state changes and earlier signals but with more whipsaws. Longer values produce more confirmed, stable signals but with increased lag in detecting momentum shifts.
Volume MA Period
Default: 20
Range: 1 to unlimited
Description: Lookback period for volume moving average used to classify volume as “high” or “low” in indicator state combinations. 20-period default captures typical monthly trading patterns. Shorter periods (10-15) make volume classification more reactive to recent spikes. Longer periods (30-50) require more sustained volume changes to trigger state classification shifts.
Statistics Lookback Period
Default: 200
Range: 50 to 500
Description: Number of historical bars used to calculate matrix statistics. 200 bars provides substantial data for reliable patterns while remaining responsive to regime changes. Lower values (50-100) emphasize recent market behavior and adapt quickly but may produce volatile statistics. Higher values (300-500) capture long-term patterns with stable statistics but slower adaptation to changing market dynamics.
Forward Performance Bars
Default: 5
Range: 1 to 20
Description: Number of bars ahead used to calculate forward returns from each historical state occurrence. 5-bar default suits intraday to short-term swing trading (5 hours on hourly charts, 1 week on daily charts). Lower values (1-3) target short-term momentum trades. Higher values (10-20) align with position trading and longer-term pattern exploitation.
Color Intensity Sensitivity
Default: 2.0
Range: 0.5 to 5.0, step 0.5
Description: Amplifies or dampens the color intensity response to average return magnitudes in the matrix heat map. 2.0 default provides balanced visual emphasis. Lower values (0.5-1.0) create subtle coloring requiring larger returns for full saturation, useful for volatile instruments. Higher values (3.0-5.0) produce vivid colors from smaller returns, highlighting subtle edges in range-bound markets.
Minimum Occurrences for Coloring
Default: 3
Range: 1 to 10
Description: Required minimum sample size before applying color-coded performance to matrix cells. Cells with fewer occurrences display gray “insufficient data” warning. 3-occurrence default filters out rare patterns. Lower threshold (1-2) shows more data but includes unreliable single-event statistics. Higher thresholds (5-10) ensure only well-established patterns receive visual emphasis.
Table Position
Default: top_right
Options: top_left, top_right, bottom_left, bottom_right
Description: Screen location for the 56-cell statistics matrix table. Position to avoid overlapping critical price action or other indicators on your chart. Consider chart orientation and candlestick density when selecting optimal placement.
Show Current State Panel
Default: true
Options: true, false
Description: Toggle visibility of the dedicated current state information panel. When enabled, displays signal strength, RSI value, indicator status, average return, estimated win rate, and confidence level for active market conditions. Disable to declutter charts when only the matrix table is needed.
Info Panel Position
Default: bottom_left
Options: top_left, top_right, bottom_left, bottom_right
Description: Screen location for the current state information panel (when enabled). Position independently from statistics matrix to optimize chart real estate. Typically placed opposite the matrix table for balanced visual layout.
Win Rate Smoothing Strength
Default: 5
Range: 1 to 20
Description: Controls Bayesian prior weighting for estimated win rate calculations. Acts as virtual sample size assuming 50% win rate baseline. Default 5 provides moderate smoothing preventing extreme win rate estimates from small samples. Lower values (1-3) reduce smoothing effect, allowing win rates to reflect raw data more directly. Higher values (10-20) increase conservatism, pulling win rate estimates toward 50% until substantial evidence accumulates.
✅Best Use Cases
Pattern-based discretionary trading where you want historical confirmation before entering setups that “look good” based on current technical alignment
Swing trading with holding periods matching your forward performance bar setting, using high-confidence bullish cells as entry filters
Risk assessment and position sizing, allocating larger size to trades originating from cells with strong positive average returns and high estimated win rates
Market regime identification by observing which RSI states and indicator combinations are currently producing the most reliable historical patterns
Backtesting validation by comparing your manual strategy signals against the historical performance of the corresponding matrix cells
Educational tool for developing intuition about which technical condition combinations have actually worked versus those that feel right but lack historical evidence
⚠️Limitations
Historical patterns do not guarantee future performance, especially during unprecedented market events or regime changes not represented in the lookback period
Small sample sizes (low occurrence counts) produce unreliable statistics despite Bayesian smoothing, requiring caution when acting on low-confidence cells
Matrix statistics lag behind rapidly changing market conditions, as the lookback period must accumulate new state occurrences before updating performance data
Forward return calculations use fixed bar periods that may not align with actual trade exit timing, support/resistance levels, or volatility-adjusted profit targets
💡What Makes This Unique
Multi-Dimensional State Space: Unlike single-indicator tools, simultaneously tracks 56 distinct market condition combinations providing granular pattern resolution unavailable in traditional technical analysis
Bayesian Statistical Rigor: Implements proper probabilistic smoothing to prevent overconfidence from limited data, a critical feature missing from most pattern recognition tools
Real-Time Contextual Feedback: The “NOW” marker and dedicated info panel instantly connect current market conditions to their historical performance profile, eliminating guesswork
Transparent Occurrence Counts: Displays sample sizes directly in each cell, allowing traders to judge statistical reliability themselves rather than hiding data quality issues
Fully Customizable Analysis Window: Complete control over lookback depth and forward return horizons lets traders align the tool precisely with their trading timeframe and strategy requirements
🔬How It Works
1. State Classification and Encoding
Each bar’s RSI value is evaluated and assigned to one of 7 discrete states based on threshold levels (0: <20, 1: 20-30, 2: 30-40, 3: 40-60, 4: 60-70, 5: 70-80, 6: >80)
Simultaneously, three binary conditions are evaluated: MACD line position relative to signal line, current volume relative to its moving average, and current close relative to previous close
These three binary conditions are combined into a single indicator state integer (0-7) using binary encoding, creating 8 possible indicator combinations
The RSI state and indicator state are stored together, defining one of 56 possible market condition cells in the matrix
2. Historical Data Accumulation
As each bar completes, the current state classification, closing price, and bar index are stored in rolling arrays maintained at the size specified by the lookback period
When the arrays reach capacity, the oldest data point is removed and the newest added, creating a sliding historical window
This continuous process builds a comprehensive database of past market conditions and their subsequent price movements
3. Forward Return Calculation and Statistics Update
On each bar, the indicator looks back through the stored historical data to find bars where sufficient forward bars exist to measure outcomes
For each historical occurrence, the price change from that bar to the bar N periods ahead (where N is the forward performance bars setting) is calculated as a percentage return
This percentage return is added to the cumulative return total for the specific matrix cell corresponding to that historical bar’s state classification
Occurrence counts are incremented, and wins are tallied for positive returns, building comprehensive statistics for each of the 56 cells
The Bayesian smoothing formula combines these raw statistics with prior assumptions (neutral 50% win rate) weighted by the smoothing strength parameter to produce estimated win rates that remain stable even with small samples
💡Note:
The Historical Matrix Analyzer is designed as a decision support tool, not a standalone trading system. Best results come from using it to validate discretionary trade ideas or filter systematic strategy signals. Always combine matrix insights with proper risk management, position sizing rules, and awareness of broader market context. The estimated win rate feature uses Bayesian statistics specifically to prevent false confidence from limited data, but no amount of smoothing can create reliable predictions from fundamentally insufficient sample sizes. Focus on high-confidence cells (green-colored confidence indicators) with occurrence counts well above your minimum threshold for the most actionable insights.


Tick-Based Delta Volume BubblesTICK-BASED DELTA VOLUME BUBBLES
OVERVIEW
A real-time order flow indicator that displays volume delta at the tick level, helping traders identify buying and selling pressure as it develops during live market hours. Unlike traditional volume delta indicators that rely on bar close data, this indicator captures actual tick-by-tick volume changes and directional bias, providing granular insight into market dynamics.
HOW IT WORKS
The indicator monitors live tick data during real-time trading by tracking volume increases between consecutive price updates. Each time volume increments, the script calculates the volume delta, determines price direction, assigns directional bias to the volume, and accumulates net delta for each bar.
This methodology is identical to the tick detection mechanism used in professional cumulative volume delta tools, ensuring accuracy and reliability.
FEATURES
Real-Time Tick Detection
- Captures genuine tick-by-tick volume flow using varip persistence
- Not estimated from OHLC data
- Processes actual market ticks as they occur
Adaptive Bubble Sizing
- Bubbles scale based on delta strength relative to a customizable moving average (default 20 bars)
- Highlights significant order flow imbalances
- Five size levels from tiny to huge
Dual Display Modes
- Normal Mode: Sized bubbles with optional volume labels positioned at bar midpoint
- Minimal Mode: Clean dots above/below bars for unobtrusive delta visualization
Flow Classification
- Aggressive Buy (bright green): Strong positive delta with greater than 1.2x strength
- Aggressive Sell (bright red): Strong negative delta with greater than 1.2x strength
- Passive Buy (light green): Moderate positive delta
- Passive Sell (light red): Moderate negative delta
Intensity Mode (Optional)
- Gray: Low intensity (less than 0.5x average)
- Blue: Medium intensity (0.5-1.0x average)
- Orange: High intensity (1.0-2.0x average)
- Red: Extreme intensity (greater than 2.0x average)
Smart Filtering
- Percentile-based filters (customizable) ensure only significant delta events are displayed
- Reduces chart clutter while highlighting important order flow
- Separate thresholds for bubble display and numeric labels
Data Collection Status
- Optional progress box in top-right corner
- Shows real-time bar collection progress
- Displays percentage completion and bars remaining
- Automatically hides when sufficient data is collected
Hide Until Ready Option
- Suppresses bubble display until the averaging period is complete
- Prevents misleading signals from incomplete data
- Default requires 20 bars before displaying bubbles
SETTINGS
Delta Average Length (1-200, default 20)
- Lookback period for calculating delta strength baseline
- Higher values = longer-term delta comparison
- Lower values = more sensitive to recent changes
Hide Bubbles Until Enough Data
- Prevents display until averaging period completes
- Ensures reliable delta strength calculations
Show Data Collection Status Box
- Displays progress indicator during initialization
- Can be disabled if you understand the warmup period
Minimal Mode
- Switches to simple dot display above/below bars
- Green dots above bars = positive delta
- Red dots below bars = negative delta
- Maintains color intensity or flow type classification
Show Bubbles
- Master toggle for bubble display
Bubble Volume Percentile (0-100, default 60)
- Minimum percentile rank required to display bubble
- Higher values = fewer, more significant bubbles
- Lower values = more bubbles displayed
Show Numbers in Bubbles
- Toggle delta value labels
- Only appears in normal mode
- Disabled automatically in minimal mode
Label Volume Percentile (0-100, default 90)
- Higher threshold for displaying numeric labels
- Typically set higher than bubble percentile
- Reduces label clutter on chart
Intensity Mode
- Switch from flow-type coloring to magnitude-based coloring
- Useful for identifying volume spikes regardless of direction
IMPORTANT NOTES
Real-Time Only: This indicator processes live tick data and does not provide historical analysis. It begins collecting data when added to a live chart.
Volume Required: Symbol must have volume data available. Will not function on symbols without volume (most forex pairs from retail brokers).
Initialization Period: Requires the specified number of bars (default 20) to calculate accurate delta strength. Use the "Hide Until Ready" option to prevent premature signals.
Market Hours: Only collects data during live market hours. Does not backfill historical data.
CREDITS
Tick detection methodology inspired by the Kioseff Trading Tick CVD indicator. This implementation adapts the same core tick-level volume delta calculation for bubble-style visualization and per-bar delta analysis.

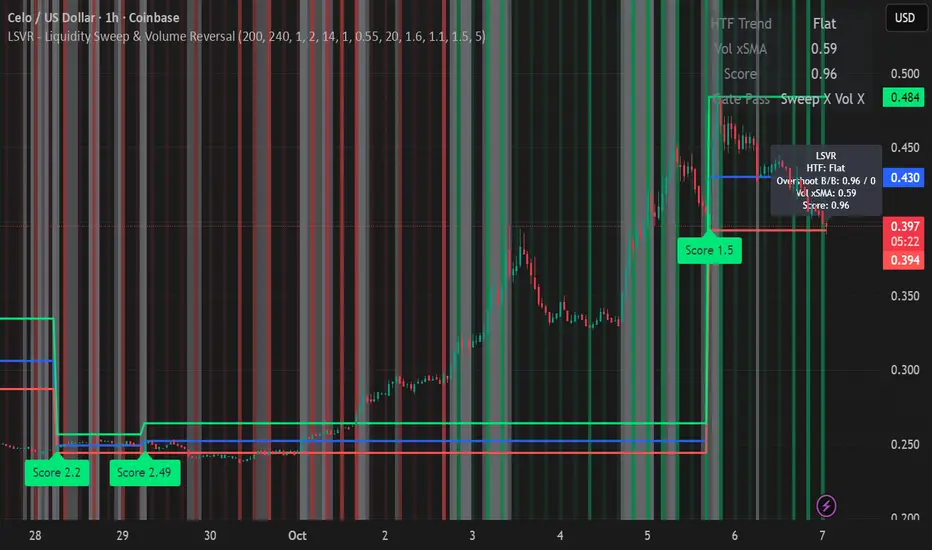
LSVR - Liquidity Sweep & Volume ReversalLSVR condenses a pro workflow into one visual overlay: Higher-Timeframe (HTF) Trend → Liquidity Sweep & Reclaim → Volume Confirmation. A signal only prints when all three gates align at bar close, and the chart shows everything you need—trend context, the sweep “trap” candle, and a projected Entry/SL/TP based on your chosen R multiple.
How it works
HTF Trend Filter: Projects a smoothed KAMA/EMA from a higher timeframe to the chart using a safe, lookahead-off request. Long signals are considered only above the HTF line; shorts only below.
Liquidity Sweep & Reclaim: Finds confirmed swing highs/lows, then detects an ATR-scaled overshoot through that swing followed by a reclaim (close back inside a configurable % of the bar range).
Volume Confirmation: Requires either a volume spike over Volume SMA × multiplier or optional OBV divergence. No participation = no signal.
Score: Each setup is scored: trend (0/1) + overshoot strength (0..1.5) + conviction (0/1). Signals fire only when the score ≥ Min Signal Score.
What you see
HTF Ribbon (subtle green/red backdrop) for bias.
Sweep Box on the signal candle (green = long, red = short).
Signal markers (“L” / “S”) with a small score label.
Projected lines that persist until the next signal: Entry (close), Stop (beyond swept swing), Target (R multiple).
Heatmap that intensifies when the score crosses your threshold.
Dashboard (top-right): HTF direction, Volume×SMA, current Score, gate pass status.
Tooltip on the last bar with quick stats.
Quick start
Apply to any liquid symbol and set HTF to ~3–6× your chart timeframe (e.g., 15m chart → 1H–4H).
Trade with the HTF trend: take L signals above the HTF line and S signals below it.
Entry = signal bar close, SL = beyond the swept swing, TP = your Projected Take-Profit (R).
Tighten or loosen selectivity with Min Signal Score, Reclaim %, Overshoot (ATR×), and Cooldown.
Recommended presets
Choppy/crypto 15m: minScore 1.25, reclaimPct 0.60–0.65, overshootATR 1.0–1.2, useOBVDiv=false, cooldown 8.
FX 5m / session trend: minScore 1.0–1.1, reclaimPct 0.50–0.55, overshootATR 0.8–1.0, useOBVDiv=true, cooldown 5.
Indices 1m (RTH): minScore 1.2, reclaimPct 0.55–0.60, useOBVDiv=false, cooldown 10.
Non-repainting by design
HTF values use lookahead_off with realtime offset.
Swings are confirmed pivots (no “forming” pivots).
Signals print at bar close only.
Notes
OBV divergence can add sensitivity on liquid markets; keep it off for stricter filtering.
Use Cooldown to avoid clustered sweeps.
This is an overlay/analysis tool, not financial advice. Test settings in Replay/Paper Trading before using live.
Macro Momentum – 4-Theme, Vol Target, RebalanceMacro Momentum — 4-Theme, Vol Target, Rebalance
Purpose. A macro-aware strategy that blends four economic “themes”—Business Cycle, Trade/USD, Monetary Policy, and Risk Sentiment—into a single, smoothed Composite signal. It then:
gates entries/exits with hysteresis bands,
enforces optional regime filters (200-day bias), and
sizes the position via volatility targeting with caps for long/short exposure.
It’s designed to run on any chart (index, ETF, futures, single stocks) while reading external macro proxies on a chosen Signal Timeframe.
How it works (high level)
Build four theme signals from robust macro proxies:
Business Cycle: XLI/XLU and Copper/Gold momentum, confirmed by the chart’s price vs a long SMA (default 200D).
Trade / USD: DXY momentum (sign-flipped so a rising USD is bearish for risk assets).
Monetary Policy: 10Y–2Y curve slope momentum and 10Y yield trend (steepening & falling 10Y = risk-on; rising 10Y = risk-off).
Risk Sentiment: VIX momentum (bearish if higher) and HYG/IEF momentum (bullish if credit outperforms duration).
Normalize & de-noise.
Optional Winsorization (MAD or stdev) clamps outliers over a lookback window.
Optional Z-score → tanh mapping compresses to ~ for stable weighting.
Theme lines are SMA-smoothed; the final Composite is LSMA-smoothed (linreg).
Decide direction with hysteresis.
Enter/hold long when Composite ≥ Entry Band; enter/hold short when Composite ≤ −Entry Band.
Exit bands are tighter than entry bands to avoid whipsaws.
Apply regime & direction constraints.
Optional Long-only above 200MA (chart symbol) and/or Short-only below 200MA.
Global Direction control (Long / Short / Both) and Invert switch.
Size via volatility targeting.
Realized close-to-close vol is annualized (choose 9-5 or 24/7 market profile).
Target exposure = TargetVol / RealizedVol, capped by Max Long/Max Short multipliers.
Quantity is computed from equity; futures are rounded to whole contracts.
Rebalance cadence & execution.
Trades are placed on Weekly / Monthly / Quarterly rebalance bars or when the sign of exposure flips.
Optional ATR stop/TP for single-stock style risk management.
Inputs you’ll actually tweak
General
Signal Timeframe: Where macro is sampled (e.g., D/W).
Rebalance Frequency: Weekly / Monthly / Quarterly.
ROC & SMA lengths: Defaults for theme momentum and the 200D regime filter.
Normalization: Z-score (tanh) on/off.
Winsorization
Toggle, lookback, multiplier, MAD vs Stdev.
Risk / Sizing
Target Annualized Vol & Realized Vol Lookback.
Direction (Long/Short/Both) and Invert.
Max long/short exposure caps.
Advanced Thresholds
Theme/Composite smoothing lengths.
Entry/Exit bands (hysteresis).
Regime / Execution
Long-only above 200MA, Short-only below 200MA.
Stops/TP (optional)
ATR length and SL/TP multiples.
Theme Weights
Per-theme scalars so you can push/pull emphasis (e.g., overweight Policy during rate cycles).
Macro Proxies
Symbols for each theme (XLI, XLU, HG1!, GC1!, DXY, US10Y, US02Y, VIX, HYG, IEF). Swap to alternatives as needed (e.g., UUP for DXY).
Signals & logic (under the hood)
Business Cycle = ½ ROC(XLI/XLU) + ½ ROC(Copper/Gold), then confirmed by (price > 200SMA ? +1 : −1).
Trade / USD = −ROC(DXY).
Monetary Policy = 0.6·ROC(10Y–2Y) − 0.4·ROC(10Y).
Risk Sentiment = −0.6·ROC(VIX) + 0.4·ROC(HYG/IEF).
Each theme → (optional Winsor) → (robust z or scaled ROC) → tanh → SMA smoothing.
Composite = weighted average → LSMA smoothing → compare to bands → dir ∈ {−1,0,+1}.
Rebalance & flips. Orders fire on your chosen cadence or when the sign of exposure changes.
Position size. exposure = clamp(TargetVol / realizedVol, maxLong/Short) × dir.
Note: The script also exposes Gross Exposure (% equity) and Signed Exposure (× equity) as diagnostics. These can help you audit how vol-targeting and caps translate into sizing over time.
Visuals & alerts
Composite line + columns (color/intensity reflect direction & strength).
Entry/Exit bands with green/red fills for quick polarity reads.
Hidden plots for each Theme if you want to show them.
Optional rebalance labels (direction, gross & signed exposure, σ).
Background heatmap keyed to Composite.
Alerts
Enter/Inc LONG when Composite crosses up (and on rebalance bars).
Enter/Inc SHORT when Composite crosses down (and on rebalance bars).
Exit to FLAT when Composite returns toward neutral (and on rebalance bars).
Practical tips
Start higher timeframes. Daily signals with Monthly rebalance are a good baseline; weekly signals with quarterly rebalances are even cleaner.
Tune Entry/Exit bands before anything else. Wider bands = fewer trades and less noise.
Weights reflect regime. If policy dominates markets, raise Monetary Policy weight; if credit stress drives moves, raise Risk Sentiment.
Proxies are swappable. Use UUP for USD, or futures-continuous symbols that match your data plan.
Futures vs ETFs. Quantity auto-rounds for futures; ETFs accept fractional shares. Check contract multipliers when interpreting exposure.
Caveats
Macro proxies can repaint at the selected signal timeframe as higher-TF bars form; that’s intentional for macro sampling, but test live.
Vol targeting assumes reasonably stationary realized vol over the lookback; if markets regime-shift, revisit volLook and targetVol.
If you disable normalization/winsorization, themes can become spikier; expect more hysteresis band crossings.
What to change first (quick start)
Set Signal Timeframe = D, Rebalance = Monthly, Z-score on, Winsor on (MAD).
Entry/Exit bands: 0.25 / 0.12 (defaults), then nudge until trade count and turnover feel right.
TargetVol: try 10% for diversified indices; lower for single stocks, higher for vol-sell strategies.
Leave weights = 1.0 until you’ve inspected the four theme lines; then tilt deliberately.

DynamoSent DynamoSent Pro+ — Professional Listing (Preview)
— Adaptive Macro Sentiment (v6)
— Export, Adaptive Lookback, Confidence, Boxes, Heatmap + Dynamic OB/OS
Preview / Experimental build. I’m actively refining this tool—your feedback is gold.
If you spot edge cases, want new presets, or have market-specific ideas, please comment or DM me on TradingView.
⸻
What it is
DynamoSent Pro+ is an adaptive, non-repainting macro sentiment engine that compresses VIX, DXY and a price-based activity proxy (e.g., SPX/sector ETF/your symbol) into a 0–100 sentiment line. It scales context by volatility (ATR%) and can self-calibrate with rolling quantile OB/OS. On top of that, it adds confidence scoring, a plain-English Context Coach, MTF agreement, exportable sentiment for other indicators, and a clean Light/Dark UI.
Why it’s different
• Adaptive lookback tracks regime changes: when volatility rises, we lengthen context; when it falls, we shorten—less whipsaw, more relevance.
• Dynamic OB/OS (quantiles) self-calibrates to each instrument’s distribution—no arbitrary 30/70 lines.
• MTF agreement + Confidence gate reduce false positives by highlighting alignment across timeframes.
• Exportable output: hidden plot “DynamoSent Export” can be selected as input.source in your other Pine scripts.
• Non-repainting rigor: all request.security() calls use lookahead_off + gaps_on; signals wait for bar close.
Key visuals
• Sentiment line (0–100), OB/OS zones (static or dynamic), optional TF1/TF2 overlays.
• Regime boxes (Overbought / Oversold / Neutral) that update live without repaint.
• Info Panel with confidence heat, regime, trend arrow, MTF readout, and Coach sentence.
• Session heat (Asia/EU/US) to match intraday behavior.
• Light/Dark theme switch in Inputs (auto-contrasted labels & headers).
⸻
How to use (examples & recipes)
1) EURUSD (swing / intraday blend)
• Preset: EURUSD 1H Swing
• Chart: 1H; TF1=1H, TF2=4H (default).
• Proxies: Defaults work (VIX=D, DXY=60, Proxy=D).
• Dynamic OB/OS: ON at 20/80; Confidence ≥ 55–60.
• Playbook:
• When sentiment crosses above 50 + margin with Δ ≥ signalK and MTF agreement ≥ 0.5, treat as trend breakout.
• In Oversold with rising Coach & TF agreement, take fade longs back toward mid-range.
• Alerts: Enable Breakout Long/Short and Fade; keep cooldown 8–12 bars.
2) SPY (daytrading)
• Preset: SPY 15m Daytrade; Chart: 15m.
• VIX (D) matters more; preset weights already favor it.
• Start with static 30/70; later try dynamic 25/75 for adaptive thresholds.
• Use Coach: in US session, when it says “Overbought + MTF agree → sell rallies / chase breakouts”, lean momentum-continuation after pullbacks.
3) BTCUSD (crypto, 24/7)
• Preset: BTCUSD 1H; Chart: 1H.
• DXY and BTC.D inform macro tone; keep Carry-forward ON to bridge sparse ticks.
• Prefer Dynamic OB/OS (15/85) for wider swings.
• Fade signals on weekend chop; Breakout when Confidence > 60 and MTF ≥ 1.0.
4) XAUUSD (gold, macro blend)
• Preset: XAUUSD 4H; Chart: 4H.
• Weights tilt to DXY and US10Y (handled by preset).
• Coach + MTF helps separate trend legs from news pops.
⸻
Best practices
• Theme: Switch Light/Dark in Inputs; the panel adapts contrast automatically.
• Export: In another script → Source → DynamoSent Pro+ → DynamoSent Export. Build your own filters/strategies atop the same sentiment.
• Dynamic vs Static OB/OS:
• Static 30/70: fast, universal baseline.
• Dynamic (quantiles): instrument-aware; use 20/80 (default) or 15/85 for choppy markets.
• Confidence gate: Start at 50–60% to filter noise; raise when you want only A-grade setups.
• Adaptive Lookback: Keep ON. For ultra-liquid indices, you can switch it OFF and set a fixed lookback.
⸻
Non-repainting & safety notes
• All request.security() calls use lookahead=barmerge.lookahead_off and gaps=barmerge.gaps_on.
• No forward references; signals & regime flips are confirmed on bar close.
• History-dependent funcs (ta.change, ta.percentile_linear_interpolation, etc.) are computed each bar (not conditionally).
• Adaptive lookback is clamped ≥ 1 to avoid lowest/highest errors.
• Missing-data warning triggers only when all proxies are NA for a streak; carry-forward can bridge small gaps without repaint.
⸻
Known limits & tips
• If a proxy symbol isn’t available on your plan/exchange, you’ll see the NA warning: choose a different symbol via Symbol Search, or keep Carry-forward ON (it defaults to neutral where needed).
• Intraday VIX is sparse—using Daily is intentional.
• Dynamic OB/OS needs enough history (see dynLenFloor). On short histories it gracefully falls back to static levels.
Thanks for trying the preview. Your comments drive the roadmap—presets, new proxies, extra alerts, and integrations.

Mongoose Global Conflict Risk Index v1Overview
The Mongoose Global Conflict Risk Index v1 is a multi-asset composite indicator designed to track the early pricing of geopolitical stress and potential conflict risk across global markets. By combining signals from safe havens, volatility indices, energy markets, and emerging market equities, the index provides a normalized 0–10 score with clear bias classifications (Neutral, Caution, Elevated, High, Shock).
This tool is not predictive of headlines but captures when markets are clustering around conflict-sensitive assets before events are widely recognized.
Methodology
The indicator calculates rolling rate-of-change z-scores for eight conflict-sensitive assets:
Gold (XAUUSD) – classic safe haven
US Dollar Index (DXY) – global reserve currency flows
VIX (Equity Volatility) – S&P 500 implied volatility
OVX (Crude Oil Volatility Index) – energy stress gauge
Crude Oil (CL1!) – WTI front contract
Natural Gas (NG1!) – energy security proxy, especially Europe
EEM (Emerging Markets ETF) – global risk capital flight
FXI (China ETF) – Asia/China proxy risk
Rules:
Safe havens and vol indices trigger when z-score > threshold.
Energy triggers when z-score > threshold.
Risk assets trigger when z-score < –threshold.
Each trigger is assigned a weight, summed, normalized, and scaled 0–10.
Bias classification:
0–2: Neutral
2–4: Caution
4–6: Elevated
6–8: High
8–10: Conflict Risk-On
How to Use
Timeframes:
Daily (1D) for strategic signals and early warnings.
4H for event shocks (missiles, sanctions, sudden escalations).
Weekly (1W) for sustained trends and macro build-ups.
What to Look For:
A single trigger (for example, Gold ON) may be noise.
A cluster of 2–3 triggers across Gold, USD, VIX, and Energy often marks early stress pricing.
Elevated readings (>4) = caution; High (>6) = rotation into havens; Shock (>8) = market conviction of conflict risk.
Practical Application:
Monitor as a heatmap of global stress.
Combine with fundamental or headline tracking.
Use alert conditions at ≥4, ≥6, ≥8 for systematic monitoring.
Notes
This indicator is for informational and educational purposes only.
It is not financial advice and should be used in conjunction with other analysis methods.

Info Panel (RSI, ADX, Volume,EMA, Delta)📊 Info Panel PRO — All-in-One Trader Dashboard
Simplify market analysis at a glance.
This powerful indicator displays key market metrics in a compact, customizable table directly overlaid on your chart — ideal for day trading, scalping, and swing trading strategies.
🔍 What’s Included:
✅ RSI (Relative Strength Index) — Measures overbought/oversold conditions.
✅ ADX (Average Directional Index) — Gauges trend strength (>25 = strong trend).
✅ Price vs 200 EMA on 4H timeframe — Strategic support/resistance level for multi-timeframe context.
✅ Current Bar Volume — Color-coded to reflect bullish/bearish sentiment.
✅ Volume Delta — Net buying/selling pressure on your chosen timeframe (default: 1 minute).
✅ CVD (Cumulative Volume Delta) — Daily running total of delta, resets each new trading day.
⚙️ Fully Customizable Settings:
Adjustable lengths for RSI, ADX, and EMA.
Select delta calculation timeframe — lower = more granular (e.g., “1” for 1-minute precision).
Table position: top/bottom left/right corners.
Color themes: Customize bullish, bearish, and neutral colors to match your style.
💡 Who Is This For?
Scalpers & Day Traders needing real-time market context without clutter.
Swing & Position Traders monitoring higher-timeframe structure and momentum.
Order Flow & Volume Analysts tracking buyer/seller imbalance via delta and CVD.
Beginners learning to read markets through consolidated, intuitive indicators.
🎯 Key Benefits:
✅ Clean, minimalist UI — stays out of your way while delivering critical data.
✅ Auto-formatting for large numbers (K, M, B) — easy readability.
✅ Visual cues (arrows, color coding) for instant decision-making.
✅ Works across all markets: Forex, Stocks, Crypto, Futures.
📌 How to Use:
Add the indicator to your chart.
Tweak settings to fit your trading style.
Monitor real-time updates — all essential metrics visible in one place.
Combine with other strategies (price action, S/R, VWAP) for signal confirmation.
📌 Pro Tip: For maximum edge, pair Info Panel PRO with liquidity zones, VWAP, or Market Profile tools.
📈 Trade smarter — let the market speak to you in clear, actionable terms.
Author:
Version: 1.0
Language: Pine Script v5
Overlay: Yes (draws directly on price chart)
😄
“If this indicator were a person, they’d be called ‘The One Who Knows Everything… But Never Gives Unsolicited Advice.’
…Unlike your ‘friend’ who yells ‘BUY!’ five minutes before the market crashes.”
“A good trader isn’t the one who predicts the market.
It’s the one who has everything on their chart — coffee optional.
…Want the next indicator? Comment ‘YES’ below — and I’ll build you ‘Smart Alert PRO’ or ‘Volume Sniper’ next.”
P.S. If this script saves even ONE trade — hit 👍.
If it saves TWO — comment “THANK YOU” 🙏
If it saves THREE — expect “Volume Heatmap PRO” next week 😉🔥

JL - Market HeatmapThis indicator plots a static table on your chart that displays any tickers you want and their % change on the day so far.
It updates in real time, changes color as it updates, and has several custom functions available for you:
1. Plot up to 12 tickers of your choice
2. Choose a layout with 1-4 rows
3. Display % Change or Not
4. Choose your font size (Tiny, Small, Normal, Large)
5. Up/Down Cell Colors (% change dependent)
6. Up/Down Text Colors (high contrast to your color choices)
The purpose of the indicator is to quickly measure a broad basket of market instruments to paint a more context-rich perspective of the chart you are looking at.
I hope this indicator can help you (and me) accomplish this task in a simple, clean, and seamless manner.
Thanks and enjoy - Jack

Squeeze Momentum Regression Clouds [SciQua]╭──────────────────────────────────────────────╮
☁️ Squeeze Momentum Regression Clouds
╰──────────────────────────────────────────────╯
🔍 Overview
The Squeeze Momentum Regression Clouds (SMRC) indicator is a powerful visual tool for identifying price compression , trend strength , and slope momentum using multiple layers of linear regression Clouds. Designed to extend the classic squeeze framework, this indicator captures the behavior of price through dynamic slope detection, percentile-based spread analytics, and an optional UI for trend inspection — across up to four customizable regression Clouds .
────────────────────────────────────────────────────────────
╭────────────────╮
⚙️ Core Features
╰────────────────╯
Up to 4 Regression Clouds – Each Cloud is created from a top and bottom linear regression line over a configurable lookback window.
Slope Detection Engine – Identifies whether each band is rising, falling, or flat based on slope-to-ATR thresholds.
Spread Compression Heatmap – Highlights compressed zones using yellow intensity, derived from historical spread analysis.
Composite Trend Scoring – Aggregates directional signals from each Cloud using your chosen weighting model.
Color-Coded Candles – Optional candle coloring reflects the real-time composite score.
UI Table – A toggleable info table shows slopes, compression levels, percentile ranks, and direction scores for each Cloud.
Gradient Cloud Styling – Apply gradient coloring from Cloud 1 to Cloud 4 for visual slope intensity.
Weight Aggregation Options – Use equal weighting, inverse-length weighting, or max pooling across Clouds to determine composite trend strength.
────────────────────────────────────────────────────────────
╭──────────────────────────────────────────╮
🧪 How to Use the Indicator
1. Understand Trend Bias with Cloud Colors
╰──────────────────────────────────────────╯
Each Cloud changes color based on its current slope:
Green indicates a rising trend.
Red indicates a falling trend.
Gray indicates a flat slope — often seen during chop or transitions.
Cloud 1 typically reflects short-term structure, while Cloud 4 represents long-term directional bias. Watch for multi-Cloud alignment — when all Clouds are green or red, the trend is strong. Divergence among Clouds often signals a potential shift.
────────────────────────────────────────────────────────────
╭───────────────────────────────────────────────╮
2. Use Compression Heat to Anticipate Breakouts
╰───────────────────────────────────────────────╯
The space between each Cloud’s top and bottom regression lines is measured, normalized, and analyzed over time. When this spread tightens relative to its history, the script highlights the band with a yellow compression glow .
This visual cue helps identify squeeze zones before volatility expands. If you see compression paired with a changing slope color (e.g., gray to green), this may indicate an impending breakout.
────────────────────────────────────────────────────────────
╭─────────────────────────────────╮
3. Leverage the Optional Table UI
╰─────────────────────────────────╯
The indicator includes a dynamic, floating table that displays real-time metrics per Cloud. These include:
Slope direction and value , with historical Min/Max reference.
Top and Bottom percentile ranks , showing how price sits within the Cloud range.
Current spread width , compared to its historical norms.
Composite score , which blends trend, slope, and compression for that Cloud.
You can customize the table’s position, theme, transparency, and whether to show a combined summary score in the header.
────────────────────────────────────────────────────────────
╭─────────────────────────────────────────────╮
4. Analyze Candle Color for Composite Signals
╰─────────────────────────────────────────────╯
When enabled, the indicator colors candles based on a weighted composite score. This score factors in:
The signed slope of each Cloud (up, down, or flat)
The percentile pressure from the top and bottom bands
The degree of spread compression
Expect green candles in bullish trend phases, red candles during bearish regimes, and gray candles in mixed or low-conviction zones.
Candle coloring provides a visual shorthand for market conditions , useful for intraday scanning or historical backtesting.
────────────────────────────────────────────────────────────
╭────────────────────────╮
🧰 Configuration Guidance
╰────────────────────────╯
To tailor the indicator to your strategy:
Use Cloud lengths like 21, 34, 55, and 89 for a balanced multi-timeframe view.
Adjust the slope threshold (default 0.05) to control how sensitive the trend coloring is.
Set the spread floor (e.g., 0.15) to tune when compression is detected and visualized.
Choose your weighting style : Inverse Length (favor faster bands), Equal, or Max Pooling (most aggressive).
Set composite weights to emphasize trend slope, percentile bias, or compression—depending on your market edge.
────────────────────────────────────────────────────────────
╭────────────────╮
✅ Best Practices
╰────────────────╯
Use aligned Cloud colors across all bands to confirm trend conviction.
Combine slope direction with compression glow for early breakout entry setups.
In choppy markets, watch for Clouds 1 and 2 turning flat while Clouds 3 and 4 remain directional — a sign of potential trend exhaustion or consolidation.
Keep the table enabled during backtesting to manually evaluate how each Cloud behaved during price turns and consolidations.
────────────────────────────────────────────────────────────
╭───────────────────────╮
📌 License & Usage Terms
╰───────────────────────╯
This script is provided under the Creative Commons Attribution-NonCommercial 4.0 International License .
✅ You are allowed to:
Use this script for personal or educational purposes
Study, learn, and adapt it for your own non-commercial strategies
❌ You are not allowed to:
Resell or redistribute the script without permission
Use it inside any paid product or service
Republish without giving clear attribution to the original author
For commercial licensing , private customization, or collaborations, please contact Joshua Danford directly.

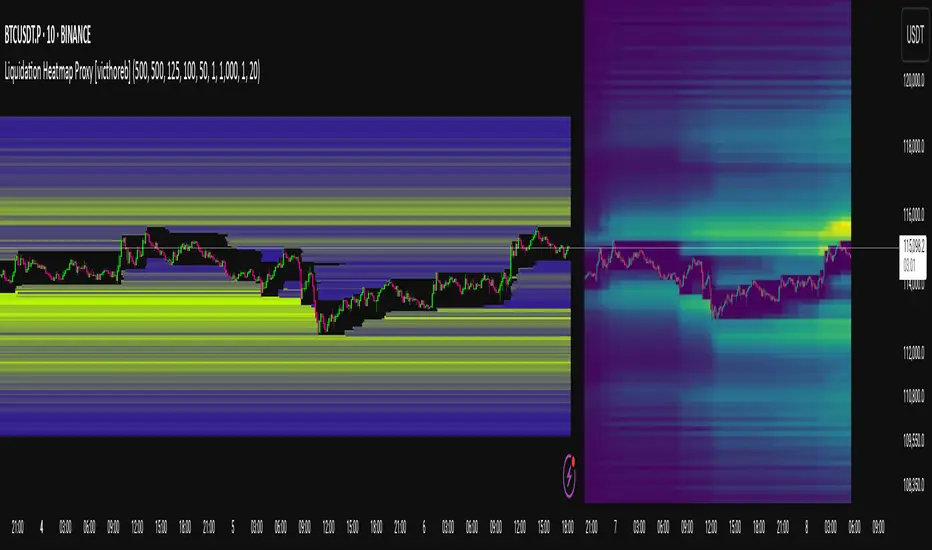
Liquidation Heatmap Proxy [victhoreb]Author: victhoreb
This script was inspired by the Coinglass indicator: www.coinglass.com
It divides each bar into subbars determined by the intrabar period. For each bar, it considers subbars with a positive OID (open interest delta) (if the user sets "Filter by Signal" to true, it only considers subbars with OID > 0 from a main bar that had a peak in open interest). In these subbars, it considers opened long/short positions based on the intrabar price movement and the dispersion factor (which becomes completely unnecessary if the user is using Intrabar Resolution in ticks; in this case, set the dispersion factor = 0).
After determining the opened long and short positions, it determines, based on the user-selected leverages, the liquidation level for each position. The width of each level is given by syminfo.mintick * scale. The script uses the intrabar OID from the previous step to store an estimate of the number of contracts to be liquidated at each level. This estimate is used to color the levels by order of magnitude.
If there is a subsequent increase in liquidations at a pre-existing level, the script accumulates the estimated number of contracts to be liquidated and repaints the level. A note about a visual limitation of the script is important: in Coinglass' version, when there is a subsequent increase in liquidations at a pre-existing level, Coinglass paints the level a brighter color ONLY from the moment of the increase—however, this script does not do this; it repaints the entire level with the brighter color. Note: While accurate, this script is only a proxy. Use at your own risk.
This script has alerts for when there is liquidation in the long or short direction.
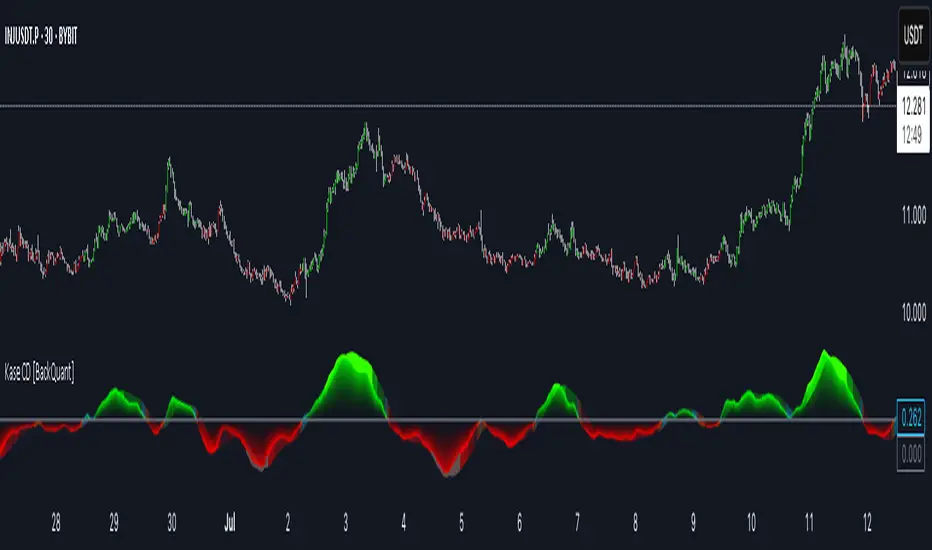
Kase Convergence Divergence [BackQuant]Kase Convergence Divergence
The Kase Convergence Divergence is a sophisticated oscillator designed to measure directional market strength through the lens of volatility-adjusted log return structures. Inspired by Cynthia Kase’s work on statistical momentum and price projection ranges, this unique indicator offers a hybrid framework that merges signal processing, multi-length sweep logic, and adaptive smoothing techniques.
Unlike traditional momentum oscillators like MACD or RSI, which rely on static moving average differences, KCD introduces a dual-process system combining:
Kase-style statistical range projection (via log returns and volatility),
A sweeping loop of lookback lengths for robustness,
First and second derivative modes to capture both velocity and acceleration of price movement.
Core Logic & Computation
The KCD calculation is centered on two volatility-normalized transforms:
KSDI Up: Measures how far the current high has moved relative to a past low, normalized by return volatility.
KSDI Down: Measures how far the current low has moved relative to a past high, also normalized.
For every length in a user-defined sweep range (e.g., 25–35), both KSDI_up and KSDI_dn are computed, and their maximum values across the loop are retained. The difference between these two max values produces the raw signal:
KPO (Kase Projection Oscillator): Measures directional skew.
KCD (Kase Convergence Divergence): Defined as KPO – MA(KPO) — similar in spirit to MACD but structurally different.
Users can choose to visualize either the first derivative (KPO) , or the second derivative (KCD) , depending on market conditions or strategy style.
Key Features
✅ Multi-Length Sweep Logic: Improves signal reliability by aggregating statistical range projections across a set of lookbacks.
✅ Advanced Smoothing Modes: Supports DEMA, HMA, TEMA, LINREG, WMA and more for dynamic adaptation.
✅ Dual Derivative Modes: Choose between speed (first derivative) or smoothness (second derivative) to fit your trading regime.
✅ Color-Encoded Signal Bands: Heatmap-style oscillator coloring enhances visual feedback on trend strength.
✅ Candlestick Painting: Optional bar coloring makes it easy to spot trend shifts on the main chart.
✅ Adaptive Fill Zones: Green and red fills between the oscillator and zero line help distinguish bullish and bearish regimes at a glance.
Practical Applications
📈 Trend Confirmation: Use KCD as a secondary confirmation layer after breakout or pullback entries.
📉 Momentum Shifts: Crossover and crossunder of the zero line highlight potential regime changes.
📊 Strategy Filters: Incorporate into algos to avoid trendless or mean-reverting environments.
🧪 Derivative Switching: Flip between KPO and KCD modes depending on whether you want to measure acceleration or deceleration of price flow.
Alerts & Signals
Two built-in alerts help you catch regime shifts in real time:
Long Signal: Triggered when the selected oscillator crosses above zero.
Short Signal: Triggered when it crosses below zero.
These events can be used to generate entries, exits, or trend validation cues in multi-layer systems.
Conclusion
The Kase Convergence Divergence goes beyond traditional oscillators by offering a volatility-normalized, derivative-aware signal engine with enhanced visual dynamics. Its sweeping architecture and dynamic fill logic make it especially powerful for identifying trending environments, filtering chop, and adding statistical rigor to your trading toolkit.
Whether you’re a discretionary trader seeking precision, or a quant looking to model more robust return structures, KCD offers a creative yet analytically grounded solution.
Uptrick: Universal Z-Score ValuationOverview
The Uptrick: Universal Z-Score Valuation is a tool designed to help traders spot when the market might be overreacting—whether that’s on the upside or the downside. It does this by combining the Z-scores of multiple key indicators into a single average, letting you see how far the current market conditions have stretched away from “normal.” This average is shown as a smooth line, supported by color-coded visuals, signal markers, optional background highlights, and a live breakdown table that shows the contribution of each indicator in real time. The focus here is on spotting potential reversals, not following trends. The indicator works well across all timeframes and asset classes, from fast intraday charts like the 1-minute and 5-minute, to higher timeframes such as the 4-hour, daily, or even weekly. Its universal design makes it suitable for any market — whether you're trading crypto, stocks, forex, or commodities.
Introduction
To understand what this indicator does, let’s start with the idea of a Z-score. In simple terms, a Z-score tells you how far a number is from the average of its recent history, measured in standard deviations. If the price of an asset is two standard deviations above its mean, that means it’s statistically “rare” or extended. That doesn’t guarantee a reversal—but it suggests the move is unusual enough to pay attention.
This concept isn’t new, but what this indicator does differently is apply the Z-score to a wide set of market signals—not just price. It looks at momentum, volatility, volume, risk-adjusted performance, and even institutional price baselines. Each of those indicators is normalized using Z-scores, and then they’re combined into one average. This gives you a single, easy-to-read line that summarizes whether the entire market is behaving abnormally. Instead of reacting to one indicator, you’re reacting to a statistically balanced blend.
Purpose
The goal of this script is to catch turning points—places where the market may be topping out or bottoming after becoming overstretched. It’s built for traders who want to fade sharp moves rather than follow trends. Think of moments when price explodes upward and starts pulling away from every moving average, volume spikes, volatility rises, and RSI shoots up. This tool is meant to spot those situations—not just when price is stretched, but when multiple different indicators agree that something is overdone.
Originality and Uniqueness
Most indicators that use Z-scores only apply them to one thing—price, RSI, or maybe Bollinger Bands. This one is different because it treats each indicator as a contributor to the full picture. You decide which ones to include, and the script averages them out. This makes the tool flexible but also deeply informative.
It doesn’t rely on complex or hidden math. It uses basic Z-score formulas, applies them to well-known indicators, and shows you the result. What makes it unique is the way it brings those signals together—statistically, visually, and interactively—so you can see what’s happening in the moment with full transparency. It’s not trying to be flashy or predictive. It’s just showing you when things have gone too far, too fast.
Inputs and Parameters
This indicator includes a wide range of configurable inputs, allowing users to customize which components are included in the Z-score average, how each indicator is calculated, and how results are displayed visually. Below is a detailed explanation of each input:
General Settings
Z-Score Lookback (default: 100): Number of bars used to calculate the mean and standard deviation for Z-score normalization. Larger values smooth the Z-scores; smaller values make them more reactive.
Bar Color Mode (default: None): Determines how bars are visually colored. Options include: None: No candle coloring applied. - Heat: Smooth gradient based on the Z-score value. - Latest Signal: Applies a solid color based on the most recent buy or sell signal
Boolean - General
Plot Universal Valuation Line (default: true): If enabled, plots the average Z-score (zAvg) line in the separate pane.
Show Signals (default: true): Displays labels ("𝓤𝓹" for buy, "𝓓𝓸𝔀𝓷" for sell) when zAvg crosses above or below user-defined thresholds.
Show Z-Score Table (default: true): Displays a live table listing each enabled indicator's Z-score and the current average.
Select Indicators
These toggles enable or disable each indicator from contributing to the Z-score average:
Use VWAP Z-Score (default: true)
Use Sortino Z-Score (default: true)
Use ROC Z-Score (default: true)
Use Price Z-Score (default: true)
Use MACD Histogram Z-Score (default: false)
Use Bollinger %B Z-Score (default: false)
Use Stochastic K Z-Score (default: false)
Use Volume Z-Score (default: false)
Use ATR Z-Score (default: false)
Use RSI Z-Score (default: false)
Use Omega Z-Score (default: true)
Use Sharpe Z-Score (default: true)
Only enabled indicators are included in the average. This modular design allows traders to tailor the signal mix to their preferences.
Indicator Lengths
These inputs control how each individual indicator is calculated:
MACD Fast Length (default: 12)
MACD Slow Length (default: 26)
MACD Signal Length (default: 9)
Bollinger Basis Length (default: 20): Used to compute the Bollinger %B.
Bollinger Deviation Multiplier (default: 2.0): Standard deviation multiplier for the Bollinger Band calculation.
Stochastic Length (default: 14)
ATR Length (default: 14)
RSI Length (default: 14)
ROC Length (default: 10)
Zones
These thresholds define key signal levels for the Z-score average:
Neutral Line Level (default: 0): Baseline for the average Z-score.
Bullish Zone Level (default: -1): Optional intermediate zone suggesting early bullish conditions.
Bearish Zone Level (default: 1): Optional intermediate zone suggesting early bearish conditions.
Z = +2 Line Level (default: 2): Primary threshold for bearish signals.
Z = +3 Line Level (default: 3): Extreme bearish warning level.
Z = -2 Line Level (default: -2): Primary threshold for bullish signals.
Z = -3 Line Level (default: -3): Extreme bullish warning level.
These zone levels are used to generate signals, fill background shading, and draw horizontal lines for visual reference.
Why These Indicators Were Merged
Each indicator in this script was chosen for a specific reason. They all measure something different but complementary.
The VWAP Z-score helps you see when price has moved far from the volume-weighted average, often used by institutions.
Sortino Ratio Z-score focuses only on downside risk, which is often more relevant to traders than overall volatility.
ROC Z-score shows how fast price is changing—strong momentum may burn out quickly.
Price Z-score is the raw measure of how far current price has moved from its mean.
RSI Z-score shows whether momentum itself is stretched.
MACD Histogram Z-score captures shifts in trend strength and acceleration.
%B (Bollinger) Z-score indicates how close price is to the upper or lower volatility envelope.
Stochastic K Z-score gives a sense of how high or low price is relative to its recent range.
Volume Z-score shows when trading activity is unusually high or low.
ATR Z-score gives a read on volatility, showing if price movement is expanding or contracting.
Sharpe Z-score measures reward-to-risk performance, useful for evaluating trend quality.
Omega Z-score looks at the ratio of good returns to bad ones, offering a more nuanced view of efficiency.
By normalizing each of these using Z-scores and averaging only the ones you turn on, the script creates a flexible, balanced view of the market’s statistical stretch.
Calculations
The core formula is the standard Z-score:
Z = (current value - average) / standard deviation
Every indicator uses this formula after it’s calculated using your chosen settings. For example, RSI is first calculated as usual, then its Z-score is calculated over your selected lookback period. The script does this for every indicator you enable. Then it averages those Z-scores together to create a single value: zAvg. That value is plotted and used to generate visual cues, signals, table values, background color changes, and candle coloring.
Sequence
Each selected indicator is calculated using your custom input lengths.
The Z-score of each indicator is computed using the shared lookback period.
All active Z-scores are added up and averaged.
The resulting zAvg value is plotted as a line.
Signal conditions check if zAvg crosses user-defined thresholds (default: ±2).
If enabled, the script plots buy/sell signal labels at those crossover points.
The candle color is updated using your selected mode (heatmap or signal-based).
If extreme Z-scores are reached, background highlighting is applied.
A live table updates with each individual Z-score so you know what’s driving the signal.
Features
This script isn’t just about stats—it’s about making them usable in real time. Every feature has a clear reason to exist, and they’re all there to give you a better read on market conditions.
1. Universal Z-Score Line
This is your primary reference. It reflects the average Z-score across all selected indicators. The line updates live and is color-coded to show how far it is from neutral. The further it gets from 0, the brighter the color becomes—cyan for deeply oversold conditions, magenta for overbought. This gives you instant feedback on how statistically “hot” or “cold” the market is, without needing to read any numbers.
2. Signal Labels (“𝓤𝓹” and “𝓓𝓸𝔀𝓷”)
When the average Z-score drops below your lower bound, you’ll see a "𝓤𝓹" label below the bar, suggesting potential bullish reversal conditions. When it rises above the upper bound, a "𝓓𝓸𝔀𝓷" label is shown above the bar—indicating possible bearish exhaustion. These labels are visually clear and minimal so they don’t clutter your chart. They're based on clear crossover logic and do not repaint.
3. Real-Time Z-Score Table
The table shows each indicator's individual Z-score and the final average. It updates every bar, giving you a transparent breakdown of what’s happening under the hood. If the market is showing an extreme average score, this table helps you pinpoint which indicators are contributing the most—so you’re not just guessing where the pressure is coming from.
4. Bar Coloring Modes
You can choose from three modes:
None: Keeps your candles clean and untouched.
Heat: Applies a smooth gradient color based on Z-score intensity. As conditions become more extreme, candle color transitions from neutral to either cyan (bullish pressure) or magenta (bearish pressure).
Latest Signal: Applies hard coloring based on the most recent signal—greenish for a buy, purple for a sell. This mode is great for tracking market state at a glance without relying on a gradient.
Every part of the candle is colored—body, wick, and border—for full visibility.
5. Background Highlighting
When zAvg enters an extreme zone (typically above +2 or below -2), the background shifts color to reflect the market’s intensity. These changes aren’t overwhelming—they’re light fills that act as ambient warnings, helping you stay aware of when price might be reaching a tipping point.
6. Customizable Zone Lines and Fills
You can define what counts as neutral, overbought, and oversold using manual inputs. Horizontal lines show your thresholds, and shaded regions highlight the most extreme zones (+2 to +3 and -2 to -3). These lines give you visual structure to understand where price currently stands in relation to your personal reversal model.
7. Modular Indicator Control
You don’t have to use all the indicators. You can enable or disable any of the 12 with a simple checkbox. This means you can build your own “blend” of market context—maybe you only care about RSI, price, and volume. Or maybe you want everything on. The script adapts accordingly, only averaging what you select.
8. Fully Customizable Sensitivity and Lengths
You can adjust the Z-score lookback length globally (default 100), and tweak individual indicator lengths separately. This lets you tune the indicator’s responsiveness to suit your trading style—slower for longer swings, faster for scalping.
9. Clean Integration with Any Chart Layout
All visual elements are designed to be informative without taking over your chart. The coloring is soft but clear, the labels are readable without being huge, and you can turn off any feature you don’t need. The indicator can work as a full dashboard or as a simple line with a couple of alerts—it’s up to you.
10. Precise, Real-Time Signal Logic
The crossover logic for signals is exact and only fires when the Z-score moves across your defined boundary. No estimation, no delay. Everything is calculated based on current and previous bar data, and nothing repaints or back-adjusts.
Conclusion
The Universal Z-Score Valuation indicator is a tool for traders who want a clear, unbiased way to detect overextension. Instead of relying on a single signal, you get a composite of several market perspectives—momentum, volatility, volume, and more—all standardized into a single view. The script gives you the freedom to control the logic, the visuals, and the components. Whether you use it as a confirmation tool or a primary signal source, it’s designed to give you clarity when markets become chaotic.
Disclaimer
This indicator is for research and educational use only. It does not constitute financial advice or guarantees of performance. All trading involves risk, and users should test any strategy thoroughly before applying it to live markets. Use this tool at your own discretion.

Liquidity Hunter HeatmapLiquidity Hunter (GPS Companion Tool)
Liquidity Hunter is a specialized script designed to help traders visualize and track potential liquidation zones, clusters, and imbalance traps in real-time. It is particularly useful for scalpers and short-term traders who rely on liquidity sweeps, stop hunts, and reversion plays.
This tool does not replicate open-source liquidation trackers. Instead, it uses a proprietary combination of volume surges, candle displacement, VWAP deviation, and high-timeframe wicks to infer areas of trapped traders and display them with clear, color-coded markers.
Key Features:
• Real-Time Liquidation Estimates: Detects where major stop losses (and potential liquidations) may have occurred, based on proprietary volume + price action logic.
• Cluster Strength Bubbles: Visual bubbles (scaled by cluster size) show where liquidations are stacking. Purple for bearish, white for bullish — intensity reflects strength.
• Pre-Liquidation Warning Zones: Highlights areas where price is likely to sweep liquidity before reversing, helping traders avoid chasing moves.
• Dollar-Based Labels (Optional): Displays the estimated value liquidated, helping traders size the significance of a move (e.g., $8.4M).
• Minimal Clutter Mode: Designed for intraday clarity — hides excess lines and uses bubbles, not shapes, for cleaner visualization.

Ultra VolumeVisualizes volume intensity using dynamic color gradients and percentile thresholds. Includes optional SMA, bar coloring, and adaptive liquidity boxes to highlight high- and low-volume zones in real time.
Introduction
The Ultra Volume indicator enhances volume analysis by categorizing volume bars into percentile-based intensity levels. It uses color-coded gradients to quickly identify periods of unusually high or low activity. The script also includes an optional simple moving average (SMA), bar coloring, and visual box overlays to highlight zones of significant liquidity shifts.
Detailed Description
.........
Volume Classification
Volume is segmented into five tiers: Extra High, High, Medium, Normal, and Low, using percentile ranks calculated over a dynamically adjusted historical window. This segmentation adapts based on the chart's timeframe – using 100 bars for daily and 1440/minutes for intraday – allowing for consistent behavior across resolutions.
.....
Color Gradients
Each volume bar is colored based on its percentile category, smoothly transitioning between thresholds for visual clarity. This makes it easy to spot volume spikes or droughts relative to recent history.
.....
Simple Moving Average (SMA)
An optional SMA can be plotted on top of the volume bars for trend comparison and baseline reference. Its length and color are fully customizable.
.....
Bar Coloring
You can optionally color the chart's candlesticks to reflect the same volume intensity as the histogram bars, reinforcing visual cues across the chart.
.....
Liquidity Boxes
Two adaptive box systems highlight zones of increased or decreased liquidity:
High Liquidity Boxes expand upward when price exceeds the previous box’s top.
Low Liquidity Boxes expand downward when price breaks the previous box’s bottom.
These boxes persist and auto-adjust over time unless reset, helping traders spot key zones of volume-driven price action.
.....
Box Indexing
A configurable index shift determines how far back in the chart the boxes originate. Setting this to 501 makes them "stick" to the candle where they were first created.
.....
Data Handling
A safety check ensures the script throws an error if volume data is unavailable (e.g., for some crypto or CFD symbols).
.........
Summary
Ultra Volume is a practical tool for traders who want more than just raw volume bars. With intelligent percentile-based classification, real-time adaptive liquidity zones, and fully customizable visual elements, it turns volume into a highly readable, actionable signal.

Anomalous Holonomy Field Theory🌌 Anomalous Holonomy Field Theory (AHFT) - Revolutionary Quantum Market Analysis
Where Theoretical Physics Meets Trading Reality
A Groundbreaking Synthesis of Differential Geometry, Quantum Field Theory, and Market Dynamics
🔬 THEORETICAL FOUNDATION - THE MATHEMATICS OF MARKET REALITY
The Anomalous Holonomy Field Theory represents an unprecedented fusion of advanced mathematical physics with practical market analysis. This isn't merely another indicator repackaging old concepts - it's a fundamentally new lens through which to view and understand market structure .
1. HOLONOMY GROUPS (Differential Geometry)
In differential geometry, holonomy measures how vectors change when parallel transported around closed loops in curved space. Applied to markets:
Mathematical Formula:
H = P exp(∮_C A_μ dx^μ)
Where:
P = Path ordering operator
A_μ = Market connection (price-volume gauge field)
C = Closed price path
Market Implementation:
The holonomy calculation measures how price "remembers" its journey through market space. When price returns to a previous level, the holonomy captures what has changed in the market's internal geometry. This reveals:
Hidden curvature in the market manifold
Topological obstructions to arbitrage
Geometric phase accumulated during price cycles
2. ANOMALY DETECTION (Quantum Field Theory)
Drawing from the Adler-Bell-Jackiw anomaly in quantum field theory:
Mathematical Formula:
∂_μ j^μ = (e²/16π²)F_μν F̃^μν
Where:
j^μ = Market current (order flow)
F_μν = Field strength tensor (volatility structure)
F̃^μν = Dual field strength
Market Application:
Anomalies represent symmetry breaking in market structure - moments when normal patterns fail and extraordinary opportunities arise. The system detects:
Spontaneous symmetry breaking (trend reversals)
Vacuum fluctuations (volatility clusters)
Non-perturbative effects (market crashes/melt-ups)
3. GAUGE THEORY (Theoretical Physics)
Markets exhibit gauge invariance - the fundamental physics remains unchanged under certain transformations:
Mathematical Formula:
A'_μ = A_μ + ∂_μΛ
This ensures our signals are gauge-invariant observables , immune to arbitrary market "coordinate changes" like gaps or reference point shifts.
4. TOPOLOGICAL DATA ANALYSIS
Using persistent homology and Morse theory:
Mathematical Formula:
β_k = dim(H_k(X))
Where β_k are the Betti numbers describing topological features that persist across scales.
🎯 REVOLUTIONARY SIGNAL CONFIGURATION
Signal Sensitivity (0.5-12.0, default 2.5)
Controls the responsiveness of holonomy field calculations to market conditions. This parameter directly affects the threshold for detecting quantum phase transitions in price action.
Optimization by Timeframe:
Scalping (1-5min): 1.5-3.0 for rapid signal generation
Day Trading (15min-1H): 2.5-5.0 for balanced sensitivity
Swing Trading (4H-1D): 5.0-8.0 for high-quality signals only
Score Amplifier (10-200, default 50)
Scales the raw holonomy field strength to produce meaningful signal values. Higher values amplify weak signals in low-volatility environments.
Signal Confirmation Toggle
When enabled, enforces additional technical filters (EMA and RSI alignment) to reduce false positives. Essential for conservative strategies.
Minimum Bars Between Signals (1-20, default 5)
Prevents overtrading by enforcing quantum decoherence time between signals. Higher values reduce whipsaws in choppy markets.
👑 ELITE EXECUTION SYSTEM
Execution Modes:
Conservative Mode:
Stricter signal criteria
Higher quality thresholds
Ideal for stable market conditions
Adaptive Mode:
Self-adjusting parameters
Balances signal frequency with quality
Recommended for most traders
Aggressive Mode:
Maximum signal sensitivity
Captures rapid market moves
Best for experienced traders in volatile conditions
Dynamic Position Sizing:
When enabled, the system scales position size based on:
Holonomy field strength
Current volatility regime
Recent performance metrics
Advanced Exit Management:
Implements trailing stops based on ATR and signal strength, with mode-specific multipliers for optimal profit capture.
🧠 ADAPTIVE INTELLIGENCE ENGINE
Self-Learning System:
The strategy analyzes recent trade outcomes and adjusts:
Risk multipliers based on win/loss ratios
Signal weights according to performance
Market regime detection for environmental adaptation
Learning Speed (0.05-0.3):
Controls adaptation rate. Higher values = faster learning but potentially unstable. Lower values = stable but slower adaptation.
Performance Window (20-100 trades):
Number of recent trades analyzed for adaptation. Longer windows provide stability, shorter windows increase responsiveness.
🎨 REVOLUTIONARY VISUAL SYSTEM
1. Holonomy Field Visualization
What it shows: Multi-layer quantum field bands representing market resonance zones
How to interpret:
Blue/Purple bands = Primary holonomy field (strongest resonance)
Band width = Field strength and volatility
Price within bands = Normal quantum state
Price breaking bands = Quantum phase transition
Trading application: Trade reversals at band extremes, breakouts on band violations with strong signals.
2. Quantum Portals
What they show: Entry signals with recursive depth patterns indicating momentum strength
How to interpret:
Upward triangles with portals = Long entry signals
Downward triangles with portals = Short entry signals
Portal depth = Signal strength and expected momentum
Color intensity = Probability of success
Trading application: Enter on portal appearance, with size proportional to portal depth.
3. Field Resonance Bands
What they show: Fibonacci-based harmonic price zones where quantum resonance occurs
How to interpret:
Dotted circles = Minor resonance levels
Solid circles = Major resonance levels
Color coding = Resonance strength
Trading application: Use as dynamic support/resistance, expect reactions at resonance zones.
4. Anomaly Detection Grid
What it shows: Fractal-based support/resistance with anomaly strength calculations
How to interpret:
Triple-layer lines = Major fractal levels with high anomaly probability
Labels show: Period (H8-H55), Price, and Anomaly strength (φ)
⚡ symbol = Extreme anomaly detected
● symbol = Strong anomaly
○ symbol = Normal conditions
Trading application: Expect major moves when price approaches high anomaly levels. Use for precise entry/exit timing.
5. Phase Space Flow
What it shows: Background heatmap revealing market topology and energy
How to interpret:
Dark background = Low market energy, range-bound
Purple glow = Building energy, trend developing
Bright intensity = High energy, strong directional move
Trading application: Trade aggressively in bright phases, reduce activity in dark phases.
📊 PROFESSIONAL DASHBOARD METRICS
Holonomy Field Strength (-100 to +100)
What it measures: The Wilson loop integral around price paths
>70: Strong positive curvature (bullish vortex)
<-70: Strong negative curvature (bearish collapse)
Near 0: Flat connection (range-bound)
Anomaly Level (0-100%)
What it measures: Quantum vacuum expectation deviation
>70%: Major anomaly (phase transition imminent)
30-70%: Moderate anomaly (elevated volatility)
<30%: Normal quantum fluctuations
Quantum State (-1, 0, +1)
What it measures: Market wave function collapse
+1: Bullish eigenstate |↑⟩
0: Superposition (uncertain)
-1: Bearish eigenstate |↓⟩
Signal Quality Ratings
LEGENDARY: All quantum fields aligned, maximum probability
EXCEPTIONAL: Strong holonomy with anomaly confirmation
STRONG: Good field strength, moderate anomaly
MODERATE: Decent signals, some uncertainty
WEAK: Minimal edge, high quantum noise
Performance Metrics
Win Rate: Rolling performance with emoji indicators
Daily P&L: Real-time profit tracking
Adaptive Risk: Current risk multiplier status
Market Regime: Bull/Bear classification
🏆 WHY THIS CHANGES EVERYTHING
Traditional technical analysis operates on 100-year-old principles - moving averages, support/resistance, and pattern recognition. These work because many traders use them, creating self-fulfilling prophecies.
AHFT transcends this limitation by analyzing markets through the lens of fundamental physics:
Markets have geometry - The holonomy calculations reveal this hidden structure
Price has memory - The geometric phase captures path-dependent effects
Anomalies are predictable - Quantum field theory identifies symmetry breaking
Everything is connected - Gauge theory unifies disparate market phenomena
This isn't just a new indicator - it's a new way of thinking about markets . Just as Einstein's relativity revolutionized physics beyond Newton's mechanics, AHFT revolutionizes technical analysis beyond traditional methods.
🔧 OPTIMAL SETTINGS FOR MNQ 10-MINUTE
For the Micro E-mini Nasdaq-100 on 10-minute timeframe:
Signal Sensitivity: 2.5-3.5
Score Amplifier: 50-70
Execution Mode: Adaptive
Min Bars Between: 3-5
Theme: Quantum Nebula or Dark Matter
💭 THE JOURNEY - FROM IMPOSSIBLE THEORY TO TRADING REALITY
Creating AHFT was a mathematical odyssey that pushed the boundaries of what's possible in Pine Script. The journey began with a seemingly impossible question: Could the profound mathematical structures of theoretical physics be translated into practical trading tools?
The Theoretical Challenge:
Months were spent diving deep into differential geometry textbooks, studying the works of Chern, Simons, and Witten. The mathematics of holonomy groups and gauge theory had never been applied to financial markets. Translating abstract mathematical concepts like parallel transport and fiber bundles into discrete price calculations required novel approaches and countless failed attempts.
The Computational Nightmare:
Pine Script wasn't designed for quantum field theory calculations. Implementing the Wilson loop integral, managing complex array structures for anomaly detection, and maintaining computational efficiency while calculating geometric phases pushed the language to its limits. There were moments when the entire project seemed impossible - the script would timeout, produce nonsensical results, or simply refuse to compile.
The Breakthrough Moments:
After countless sleepless nights and thousands of lines of code, breakthrough came through elegant simplifications. The realization that market anomalies follow patterns similar to quantum vacuum fluctuations led to the revolutionary anomaly detection system. The discovery that price paths exhibit holonomic memory unlocked the geometric phase calculations.
The Visual Revolution:
Creating visualizations that could represent 4-dimensional quantum fields on a 2D chart required innovative approaches. The multi-layer holonomy field, recursive quantum portals, and phase space flow representations went through dozens of iterations before achieving the perfect balance of beauty and functionality.
The Balancing Act:
Perhaps the greatest challenge was maintaining mathematical rigor while ensuring practical trading utility. Every formula had to be both theoretically sound and computationally efficient. Every visual had to be both aesthetically pleasing and information-rich.
The result is more than a strategy - it's a synthesis of pure mathematics and market reality that reveals the hidden order within apparent chaos.
📚 INTEGRATED DOCUMENTATION
Once applied to your chart, AHFT includes comprehensive tooltips on every input parameter. The source code contains detailed explanations of the mathematical theory, practical applications, and optimization guidelines. This published description provides the overview - the indicator itself is a complete educational resource.
⚠️ RISK DISCLAIMER
While AHFT employs advanced mathematical models derived from theoretical physics, markets remain inherently unpredictable. No mathematical model, regardless of sophistication, can guarantee future results. This strategy uses realistic commission ($0.62 per contract) and slippage (1 tick) in all calculations. Past performance does not guarantee future results. Always use appropriate risk management and never risk more than you can afford to lose.
🌟 CONCLUSION
The Anomalous Holonomy Field Theory represents a quantum leap in technical analysis - literally. By applying the profound insights of differential geometry, quantum field theory, and gauge theory to market analysis, AHFT reveals structure and opportunities invisible to traditional methods.
From the holonomy calculations that capture market memory to the anomaly detection that identifies phase transitions, from the adaptive intelligence that learns and evolves to the stunning visualizations that make the invisible visible, every component works in mathematical harmony.
This is more than a trading strategy. It's a new lens through which to view market reality.
Trade with the precision of physics. Trade with the power of mathematics. Trade with AHFT.
I hope this serves as a good replacement for Quantum Edge Pro - Adaptive AI until I'm able to fix it.
— Dskyz, Trade with insight. Trade with anticipation.

Langlands-Operadic Möbius Vortex (LOMV)Langlands-Operadic Möbius Vortex (LOMV)
Where Pure Mathematics Meets Market Reality
A Revolutionary Synthesis of Number Theory, Category Theory, and Market Dynamics
🎓 THEORETICAL FOUNDATION
The Langlands-Operadic Möbius Vortex represents a groundbreaking fusion of three profound mathematical frameworks that have never before been combined for market analysis:
The Langlands Program: Harmonic Analysis in Markets
Developed by Robert Langlands (Fields Medal recipient), the Langlands Program creates bridges between number theory, algebraic geometry, and harmonic analysis. In our indicator:
L-Function Implementation:
- Utilizes the Möbius function μ(n) for weighted price analysis
- Applies Riemann zeta function convergence principles
- Calculates quantum harmonic resonance between -2 and +2
- Measures deep mathematical patterns invisible to traditional analysis
The L-Function core calculation employs:
L_sum = Σ(return_val × μ(n) × n^(-s))
Where s is the critical strip parameter (0.5-2.5), controlling mathematical precision and signal smoothness.
Operadic Composition Theory: Multi-Strategy Democracy
Category theory and operads provide the mathematical framework for composing multiple trading strategies into a unified signal. This isn't simple averaging - it's mathematical composition using:
Strategy Composition Arity (2-5 strategies):
- Momentum analysis via RSI transformation
- Mean reversion through Bollinger Band mathematics
- Order Flow Polarity Index (revolutionary T3-smoothed volume analysis)
- Trend detection using Directional Movement
- Higher timeframe momentum confirmation
Agreement Threshold System: Democratic voting where strategies must reach consensus before signal generation. This prevents false signals during market uncertainty.
Möbius Function: Number Theory in Action
The Möbius function μ(n) forms the mathematical backbone:
- μ(n) = 1 if n is a square-free positive integer with even number of prime factors
- μ(n) = -1 if n is a square-free positive integer with odd number of prime factors
- μ(n) = 0 if n has a squared prime factor
This creates oscillating weights that reveal hidden market periodicities and harmonic structures.
🔧 COMPREHENSIVE INPUT SYSTEM
Langlands Program Parameters
Modular Level N (5-50, default 30):
Primary lookback for quantum harmonic analysis. Optimized by timeframe:
- Scalping (1-5min): 15-25
- Day Trading (15min-1H): 25-35
- Swing Trading (4H-1D): 35-50
- Asset-specific: Crypto 15-25, Stocks 30-40, Forex 35-45
L-Function Critical Strip (0.5-2.5, default 1.5):
Controls Riemann zeta convergence precision:
- Higher values: More stable, smoother signals
- Lower values: More reactive, catches quick moves
- High frequency: 0.8-1.2, Medium: 1.3-1.7, Low: 1.8-2.3
Frobenius Trace Period (5-50, default 21):
Galois representation lookback for price-volume correlation:
- Measures harmonic relationships in market flows
- Scalping: 8-15, Day Trading: 18-25, Swing: 25-40
HTF Multi-Scale Analysis:
Higher timeframe context prevents trading against major trends:
- Provides market bias and filters signals
- Improves win rates by 15-25% through trend alignment
Operadic Composition Parameters
Strategy Composition Arity (2-5, default 4):
Number of algorithms composed for final signal:
- Conservative: 4-5 strategies (higher confidence)
- Moderate: 3-4 strategies (balanced approach)
- Aggressive: 2-3 strategies (more frequent signals)
Category Agreement Threshold (2-5, default 3):
Democratic voting minimum for signal generation:
- Higher agreement: Fewer but higher quality signals
- Lower agreement: More signals, potential false positives
Swiss-Cheese Mixing (0.1-0.5, default 0.382):
Golden ratio φ⁻¹ based blending of trend factors:
- 0.382 is φ⁻¹, optimal for natural market fractals
- Higher values: Stronger trend following
- Lower values: More contrarian signals
OFPI Configuration:
- OFPI Length (5-30, default 14): Order Flow calculation period
- T3 Smoothing (3-10, default 5): Advanced exponential smoothing
- T3 Volume Factor (0.5-1.0, default 0.7): Smoothing aggressiveness control
Unified Scoring System
Component Weights (sum ≈ 1.0):
- L-Function Weight (0.1-0.5, default 0.3): Mathematical harmony emphasis
- Galois Rank Weight (0.1-0.5, default 0.2): Market structure complexity
- Operadic Weight (0.1-0.5, default 0.3): Multi-strategy consensus
- Correspondence Weight (0.1-0.5, default 0.2): Theory-practice alignment
Signal Threshold (0.5-10.0, default 5.0):
Quality filter producing:
- 8.0+: EXCEPTIONAL signals only
- 6.0-7.9: STRONG signals
- 4.0-5.9: MODERATE signals
- 2.0-3.9: WEAK signals
🎨 ADVANCED VISUAL SYSTEM
Multi-Dimensional Quantum Aura Bands
Five-layer resonance field showing market energy:
- Colors: Theme-matched gradients (Quantum purple, Holographic cyan, etc.)
- Expansion: Dynamic based on score intensity and volatility
- Function: Multi-timeframe support/resistance zones
Morphism Flow Portals
Category theory visualization showing market topology:
- Green/Cyan Portals: Bullish mathematical flow
- Red/Orange Portals: Bearish mathematical flow
- Size/Intensity: Proportional to signal strength
- Recursion Depth (1-8): Nested patterns for flow evolution
Fractal Grid System
Dynamic support/resistance with projected L-Scores:
- Multiple Timeframes: 10, 20, 30, 40, 50-period highs/lows
- Smart Spacing: Prevents level overlap using ATR-based minimum distance
- Projections: Estimated signal scores when price reaches levels
- Usage: Precise entry/exit timing with mathematical confirmation
Wick Pressure Analysis
Rejection level prediction using candle mathematics:
- Upper Wicks: Selling pressure zones (purple/red lines)
- Lower Wicks: Buying pressure zones (purple/green lines)
- Glow Intensity (1-8): Visual emphasis and line reach
- Application: Confluence with fractal grid creates high-probability zones
Regime Intensity Heatmap
Background coloring showing market energy:
- Black/Dark: Low activity, range-bound markets
- Purple Glow: Building momentum and trend development
- Bright Purple: High activity, strong directional moves
- Calculation: Combines trend, momentum, volatility, and score intensity
Six Professional Themes
- Quantum: Purple/violet for general trading and mathematical focus
- Holographic: Cyan/magenta optimized for cryptocurrency markets
- Crystalline: Blue/turquoise for conservative, stability-focused trading
- Plasma: Gold/magenta for high-energy volatility trading
- Cosmic Neon: Bright neon colors for maximum visibility and aggressive trading
📊 INSTITUTIONAL-GRADE DASHBOARD
Unified AI Score Section
- Total Score (-10 to +10): Primary decision metric
- >5: Strong bullish signals
- <-5: Strong bearish signals
- Quality ratings: EXCEPTIONAL > STRONG > MODERATE > WEAK
- Component Analysis: Individual L-Function, Galois, Operadic, and Correspondence contributions
Order Flow Analysis
Revolutionary OFPI integration:
- OFPI Value (-100% to +100%): Real buying vs selling pressure
- Visual Gauge: Horizontal bar chart showing flow intensity
- Momentum Status: SHIFTING, ACCELERATING, STRONG, MODERATE, or WEAK
- Trading Application: Flow shifts often precede major moves
Signal Performance Tracking
- Win Rate Monitoring: Real-time success percentage with emoji indicators
- Signal Count: Total signals generated for frequency analysis
- Current Position: LONG, SHORT, or NONE with P&L tracking
- Volatility Regime: HIGH, MEDIUM, or LOW classification
Market Structure Analysis
- Möbius Field Strength: Mathematical field oscillation intensity
- CHAOTIC: High complexity, use wider stops
- STRONG: Active field, normal position sizing
- MODERATE: Balanced conditions
- WEAK: Low activity, consider smaller positions
- HTF Trend: Higher timeframe bias (BULL/BEAR/NEUTRAL)
- Strategy Agreement: Multi-algorithm consensus level
Position Management
When in trades, displays:
- Entry Price: Original signal price
- Current P&L: Real-time percentage with risk level assessment
- Duration: Bars in trade for timing analysis
- Risk Level: HIGH/MEDIUM/LOW based on current exposure
🚀 SIGNAL GENERATION LOGIC
Balanced Long/Short Architecture
The indicator generates signals through multiple convergent pathways:
Long Entry Conditions:
- Score threshold breach with algorithmic agreement
- Strong bullish order flow (OFPI > 0.15) with positive composite signal
- Bullish pattern recognition with mathematical confirmation
- HTF trend alignment with momentum shifting
- Extreme bullish OFPI (>0.3) with any positive score
Short Entry Conditions:
- Score threshold breach with bearish agreement
- Strong bearish order flow (OFPI < -0.15) with negative composite signal
- Bearish pattern recognition with mathematical confirmation
- HTF trend alignment with momentum shifting
- Extreme bearish OFPI (<-0.3) with any negative score
Exit Logic:
- Score deterioration below continuation threshold
- Signal quality degradation
- Opposing order flow acceleration
- 10-bar minimum between signals prevents overtrading
⚙️ OPTIMIZATION GUIDELINES
Asset-Specific Settings
Cryptocurrency Trading:
- Modular Level: 15-25 (capture volatility)
- L-Function Precision: 0.8-1.3 (reactive to price swings)
- OFPI Length: 10-20 (fast correlation shifts)
- Cascade Levels: 5-7, Theme: Holographic
Stock Index Trading:
- Modular Level: 25-35 (balanced trending)
- L-Function Precision: 1.5-1.8 (stable patterns)
- OFPI Length: 14-20 (standard correlation)
- Cascade Levels: 4-5, Theme: Quantum
Forex Trading:
- Modular Level: 35-45 (smooth trends)
- L-Function Precision: 1.6-2.1 (high smoothing)
- OFPI Length: 18-25 (disable volume amplification)
- Cascade Levels: 3-4, Theme: Crystalline
Timeframe Optimization
Scalping (1-5 minute charts):
- Reduce all lookback parameters by 30-40%
- Increase L-Function precision for noise reduction
- Enable all visual elements for maximum information
- Use Small dashboard to save screen space
Day Trading (15 minute - 1 hour):
- Use default parameters as starting point
- Adjust based on market volatility
- Normal dashboard provides optimal information density
- Focus on OFPI momentum shifts for entries
Swing Trading (4 hour - Daily):
- Increase lookback parameters by 30-50%
- Higher L-Function precision for stability
- Large dashboard for comprehensive analysis
- Emphasize HTF trend alignment
🏆 ADVANCED TRADING STRATEGIES
The Mathematical Confluence Method
1. Wait for Fractal Grid level approach
2. Confirm with projected L-Score > threshold
3. Verify OFPI alignment with direction
4. Enter on portal signal with quality ≥ STRONG
5. Exit on score deterioration or opposing flow
The Regime Trading System
1. Monitor Aether Flow background intensity
2. Trade aggressively during bright purple periods
3. Reduce position size during dark periods
4. Use Möbius Field strength for stop placement
5. Align with HTF trend for maximum probability
The OFPI Momentum Strategy
1. Watch for momentum shifting detection
2. Confirm with accelerating flow in direction
3. Enter on immediate portal signal
4. Scale out at Fibonacci levels
5. Exit on flow deceleration or reversal
⚠️ RISK MANAGEMENT INTEGRATION
Mathematical Position Sizing
- Use Galois Rank for volatility-adjusted sizing
- Möbius Field strength determines stop width
- Fractal Dimension guides maximum exposure
- OFPI momentum affects entry timing
Signal Quality Filtering
- Trade only STRONG or EXCEPTIONAL quality signals
- Increase position size with higher agreement levels
- Reduce risk during CHAOTIC Möbius field periods
- Respect HTF trend alignment for directional bias
🔬 DEVELOPMENT JOURNEY
Creating the LOMV was an extraordinary mathematical undertaking that pushed the boundaries of what's possible in technical analysis. This indicator almost didn't happen. The theoretical complexity nearly proved insurmountable.
The Mathematical Challenge
Implementing the Langlands Program required deep research into:
- Number theory and the Möbius function
- Riemann zeta function convergence properties
- L-function analytical continuation
- Galois representations in finite fields
The mathematical literature spans decades of pure mathematics research, requiring translation from abstract theory to practical market application.
The Computational Complexity
Operadic composition theory demanded:
- Category theory implementation in Pine Script
- Multi-dimensional array management for strategy composition
- Real-time democratic voting algorithms
- Performance optimization for complex calculations
The Integration Breakthrough
Bringing together three disparate mathematical frameworks required:
- Novel approaches to signal weighting and combination
- Revolutionary Order Flow Polarity Index development
- Advanced T3 smoothing implementation
- Balanced signal generation preventing directional bias
Months of intensive research culminated in breakthrough moments when the mathematics finally aligned with market reality. The result is an indicator that reveals market structure invisible to conventional analysis while maintaining practical trading utility.
🎯 PRACTICAL IMPLEMENTATION
Getting Started
1. Apply indicator with default settings
2. Select appropriate theme for your markets
3. Observe dashboard metrics during different market conditions
4. Practice signal identification without trading
5. Gradually adjust parameters based on observations
Signal Confirmation Process
- Never trade on score alone - verify quality rating
- Confirm OFPI alignment with intended direction
- Check fractal grid level proximity for timing
- Ensure Möbius field strength supports position size
- Validate against HTF trend for bias confirmation
Performance Monitoring
- Track win rate in dashboard for strategy assessment
- Monitor component contributions for optimization
- Adjust threshold based on desired signal frequency
- Document performance across different market regimes
🌟 UNIQUE INNOVATIONS
1. First Integration of Langlands Program mathematics with practical trading
2. Revolutionary OFPI with T3 smoothing and momentum detection
3. Operadic Composition using category theory for signal democracy
4. Dynamic Fractal Grid with projected L-Score calculations
5. Multi-Dimensional Visualization through morphism flow portals
6. Regime-Adaptive Background showing market energy intensity
7. Balanced Signal Generation preventing directional bias
8. Professional Dashboard with institutional-grade metrics
📚 EDUCATIONAL VALUE
The LOMV serves as both a practical trading tool and an educational gateway to advanced mathematics. Traders gain exposure to:
- Pure mathematics applications in markets
- Category theory and operadic composition
- Number theory through Möbius function implementation
- Harmonic analysis via L-function calculations
- Advanced signal processing through T3 smoothing
⚖️ RESPONSIBLE USAGE
This indicator represents advanced mathematical research applied to market analysis. While the underlying mathematics are rigorously implemented, markets remain inherently unpredictable.
Key Principles:
- Use as part of comprehensive trading strategy
- Implement proper risk management at all times
- Backtest thoroughly before live implementation
- Understand that past performance does not guarantee future results
- Never risk more than you can afford to lose
The mathematics reveal deep market structure, but successful trading requires discipline, patience, and sound risk management beyond any indicator.
🔮 CONCLUSION
The Langlands-Operadic Möbius Vortex represents a quantum leap forward in technical analysis, bringing PhD-level pure mathematics to practical trading while maintaining visual elegance and usability.
From the harmonic analysis of the Langlands Program to the democratic composition of operadic theory, from the number-theoretic precision of the Möbius function to the revolutionary Order Flow Polarity Index, every component works in mathematical harmony to reveal the hidden order within market chaos.
This is more than an indicator - it's a mathematical lens that transforms how you see and understand market structure.
Trade with mathematical precision. Trade with the LOMV.
*"Mathematics is the language with which God has written the universe." - Galileo Galilei*
*In markets, as in nature, profound mathematical beauty underlies apparent chaos. The LOMV reveals this hidden order.*
— Dskyz, Trade with insight. Trade with anticipation.

Uptrick: Z-Trend BandsOverview
Uptrick: Z-Trend Bands is a Pine Script overlay crafted to capture high-probability mean-reversion opportunities. It dynamically plots upper and lower statistical bands around an EMA baseline by converting price deviations into z-scores. Once price moves outside these bands and then reenters, the indicator verifies that momentum is genuinely reversing via an EMA-smoothed RSI slope. Signal memory ensures only one entry per momentum swing, and traders receive clear, real-time feedback through customizable bar-coloring modes, a semi-transparent fill highlighting the statistical zone, concise “Up”/“Down” labels, and a live five-metric scoring table.
Introduction
Markets often oscillate between trending and reverting, and simple thresholds or static envelopes frequently misfire when volatility shifts. Standard deviation quantifies how “wide” recent price moves have been, and a z-score transforms each deviation into a measure of how rare it is relative to its own history. By anchoring these bands to an exponential moving average, the script maintains a fluid statistical envelope that adapts instantly to both calm and turbulent regimes. Meanwhile, the Relative Strength Index (RSI) tracks momentum; smoothing RSI with an EMA and observing its slope filters out erratic spikes, ensuring that only genuine momentum flips—upward for longs and downward for shorts—qualify.
Purpose
This indicator is purpose-built for short-term mean-reversion traders operating on lower–timeframe charts. It reveals when price has strayed into the outer 5 percent of its recent range, signaling an increased likelihood of a bounce back toward fair value. Rather than firing on price alone, it demands that momentum follow suit: the smoothed RSI slope must flip in the opposite direction before any trade marker appears. This dual-filter approach dramatically reduces noise-driven, false setups. Traders then see immediate visual confirmation—bar colors that reflect the latest signal and age over time, clear entry labels, and an always-visible table of metric scores—so they can gauge both the validity and freshness of each signal at a glance.
Originality and Uniqueness
Uptrick: Z-Trend Bands stands apart from typical envelope or oscillator tools in four key ways. First, it employs fully normalized z-score bands, meaning ±2 always captures roughly the top and bottom 5 percent of moves, regardless of volatility regime. Second, it insists on two simultaneous conditions—price reentry into the bands and a confirming RSI slope flip—dramatically reducing whipsaw signals. Third, it uses slope-phase memory to lock out duplicate signals until momentum truly reverses again, enforcing disciplined entries. Finally, it offers four distinct bar-coloring schemes (solid reversal, fading reversal, exceeding bands, and classic heatmap) plus a dynamic scoring table, rather than a single, opaque alert, giving traders deep insight into every layer of analysis.
Why Each Component Was Picked
The EMA baseline was chosen for its blend of responsiveness—weighting recent price heavily—and smoothness, which filters market noise. Z-score deviation bands standardize price extremes relative to their own history, adapting automatically to shifting volatility so that “extreme” always means statistically rare. The RSI, smoothed with an EMA before slope calculation, captures true momentum shifts without the false spikes that raw RSI often produces. Slope-phase memory flags prevent repeated alerts within a single swing, curbing over-trading in choppy conditions. Bar-coloring modes provide flexible visual contexts—whether you prefer to track the latest reversal, see signal age, highlight every breakout, or view a continuous gradient—and the scoring table breaks down all five core checks for complete transparency.
Features
This indicator offers a suite of configurable visual and logical tools designed to make reversal signals both robust and transparent:
Dynamic z-score bands that expand or contract in real time to reflect current volatility regimes, ensuring the outer ±zThreshold levels always represent statistically rare extremes.
A smooth EMA baseline that weights recent price more heavily, serving as a fair-value anchor around which deviations are measured.
EMA-smoothed RSI slope confirmation, which filters out erratic momentum spikes by first smoothing raw RSI and then requiring its bar-to-bar slope to flip before any signal is allowed.
Slope-phase memory logic that locks out duplicate buy or sell markers until the RSI slope crosses back through zero, preventing over-trading during choppy swings.
Four distinct bar-coloring modes—Reversal Solid, Reversal Fade, Exceeding Bands, Classic Heat—plus a “None” option, so traders can choose whether to highlight the latest signal, show signal age, emphasize breakout bars, or view a continuous heat gradient within the bands.
A semi-transparent fill between the EMA and the upper/lower bands that visually frames the statistical zone and makes extremes immediately obvious.
Concise “Up” and “Down” labels that plot exactly when price re-enters a band with confirming momentum, keeping chart clutter to a minimum.
A real-time, five-metric scoring table (z-score, RSI slope, price vs. EMA, trend state, re-entry) that updates every two bars, displaying individual +1/–1/0 scores and an averaged Buy/Sell/Neutral verdict for complete transparency.
Calculations
Compute the fair-value EMA over fairLen bars.
Subtract that EMA from current price each bar to derive the raw deviation.
Over zLen bars, calculate the rolling mean and standard deviation of those deviations.
Convert each deviation into a z-score by subtracting the mean and dividing by the standard deviation.
Plot the upper and lower bands at ±zThreshold × standard deviation around the EMA.
Calculate raw RSI over rsiLen bars, then smooth it with an EMA of length rsiEmaLen.
Derive the RSI slope by taking the difference between the current and previous smoothed RSI.
Detect a potential reentry when price exits one of the bands on the prior bar and re-enters on the current bar.
Require that reentry coincide with an RSI slope flip (positive for a lower-band reentry, negative for an upper-band reentry).
On first valid reentry per momentum swing, fire a buy or sell signal and set a memory flag; reset that flag only when the RSI slope crosses back through zero.
For each bar, assign scores of +1, –1, or 0 for the z-score direction, RSI slope, price vs. EMA, trend-state, and reentry status.
Average those five scores; if the result exceeds +0.1, label “Buy,” if below –0.1, label “Sell,” otherwise “Neutral.”
Update bar colors, the semi-transparent fill, reversal labels, and the scoring table every two bars to reflect the latest calculations.
How It Actually Works
On each new candle, the EMA baseline and band widths update to reflect current volatility. The RSI is smoothed and its slope recalculated. The script then looks back one bar to see if price exited either band and forward to see if it reentered. If that reentry coincides with an appropriate RSI slope flip—and no signal has yet been generated in that swing—a concise label appears. Bar colors refresh according to your selected mode, and the scoring table updates to show which of the five conditions passed or failed, along with the overall verdict. This process repeats seamlessly at each bar, giving traders a continuous feed of disciplined, statistically filtered reversal cues.
Inputs
All parameters are fully user-configurable, allowing you to tailor sensitivity, lookbacks, and visuals to your trading style:
EMA length (fairLen): number of bars for the fair-value EMA; higher values smooth more but lag further behind price.
Z-Score lookback (zLen): window for calculating the mean and standard deviation of price deviations; longer lookbacks reduce noise but respond more slowly to new volatility.
Z-Score threshold (zThreshold): number of standard deviations defining the upper and lower bands; common default is 2.0 for roughly the outer 5 percent of moves.
Source (src): choice of price series (close, hl2, etc.) used for EMA, deviation, and RSI calculations.
RSI length (rsiLen): period for raw RSI calculation; shorter values react faster to momentum changes but can be choppier.
RSI EMA length (rsiEmaLen): period for smoothing raw RSI before taking its slope; higher values filter more noise.
Bar coloring mode (colorMode): select from None, Reversal Solid, Reversal Fade, Exceeding Bands, or Classic Heat to control how bars are shaded in relation to signals and band positions.
Show signals (showSignals): toggle on-chart “Up” and “Down” labels for reversal entries.
Show scoring table (enableTable): toggle the display of the five-metric breakdown table.
Table position (tablePos): choose which corner (Top Left, Top Right, Bottom Left, Bottom Right) hosts the scoring table.
Conclusion
By merging a normalized z-score framework, momentum slope confirmation, disciplined signal memory, flexible visuals, and transparent scoring into one Pine Script overlay, Uptrick: Z-Trend Bands offers a powerful yet intuitive tool for intraday mean-reversion trading. Its adaptability to real-time volatility and multi-layered filter logic deliver clear, high-confidence reversal cues without the clutter or confusion of simpler indicators.
Disclaimer
This indicator is provided solely for educational and informational purposes. It does not constitute financial advice. Trading involves substantial risk and may not be suitable for all investors. Past performance is not indicative of future results. Always conduct your own testing and apply careful risk management before trading live.
