Time Matrix TableICT stresses time and liquidity levels in his teachings. This table helps to easily locate these key Time-based price levels. You can use these levels to determine your directional bias and to help generate your narrative for where the market is going.
This indicator creates a table that gives you the price for the following liquidity levels:
PDO - Previous Day Open
PDH - Previous Day High
PDL - Previous Day Low
PDC - Previous Day Close
PDEQ - Equilibrium of the previous day's range. (Calculated by math.abs(((pdh-pdl)/2)+pdl))
PWH - Previous Week High
PWL - Previous Week Low
PDH2 - Two Days Back High
PDL2 - Two Days Back Low
PDH3 - Three Days Back High
PDL3 - Three Days Back Low
And gives you the opening price for the following times:
Daily Open - 6:00pm open for current session
1:30 AM
3:00 AM
4:00 AM
Midnight Open
6:00 AM
7:30 AM
8:30 AM
NY Open
10:00 AM
12:00 PM
NY PM - 1:30pm
2:00 PM
The levels are sorted descending in price in the table, with the background colored based on their relation to price. The prices are also plotted on the chart based on the range you specify in relation to the current price. These lines are also colored based on their relation to price.
This indicator does not give you anything but the price at a specific time, you must determine your own bias and narrative based on the levels that are given.
Поиск скриптов по запросу "ict"

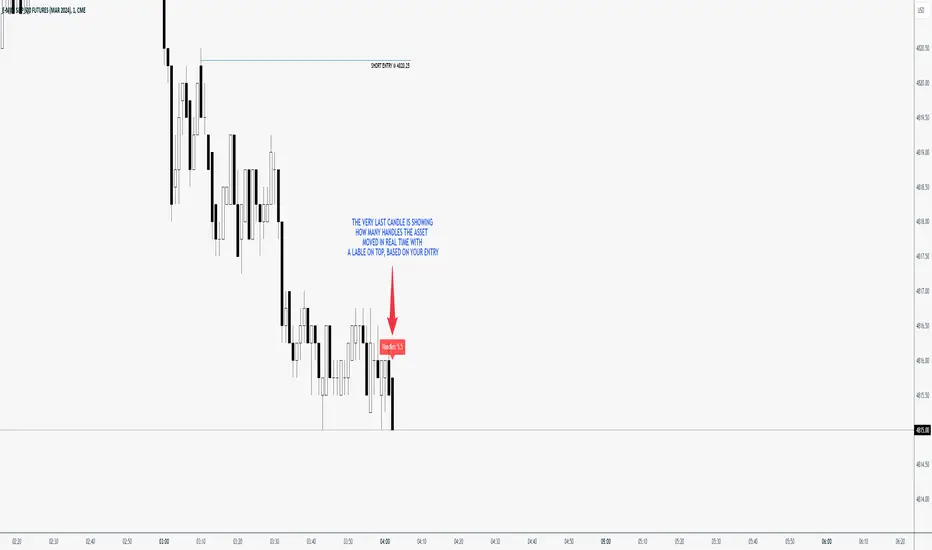
ICT Handle CounterThe "Handle Counter" is a unique TradingView script designed for ease and effectiveness in tracking price movements. It's particularly useful for traders who follow ICT methodologies. Users manually input their trade entry price, and the script then dynamically calculates and displays the number of Handles, or price changes, in a clear box above the latest candle on the chart. This real-time updating feature provides traders with crucial, current data on price movement, aiding in informed decision-making and a better understanding of market dynamics.
The "Handle Counter" script operates in the following way:
User Input: It starts by allowing you to input your trade's entry price. This is the price level from which the script will measure price movement.
Handles Calculation: The script calculates "Handles," which represent the price difference from your entry point to the current market price. This is done using a mathematical formula that finds the absolute value of this difference.
Display Mechanism: The calculated Handles are then displayed in a box, which is positioned above the latest candle on your trading chart. This box updates in real-time, giving you an ongoing view of how many Handles (price changes) have occurred since your entry point.
This script is designed to be straightforward and easy to use, providing clear, real-time information.
How to use:
Add the Indicator.
Open the Menu by clicking on the 'Settings' icon.
Navigate to the 'Inputs' tab and enter your entry price.
Click 'OK.' The indicator should immediately place a box above the latest candle, showing the current handles.
Additional Settings
Change Color of the Box
Change Color of the Font
ICT Time Indicator - MinimalisticThis indicator is intended to make backtesting and journaling a lot easier.
This script will automatically plot the sessions you selec.t
You don't have to worry about your timezone because this indicator will automatically handle that.
For best results please don't go any higher than the Hourly.
I aimed to keep this indicator very minimalistic to reduce the 'lipstick' on your chart.
Enabling any of the follow settings will quickly show you on your chart the times you want to be looking at:
Morning Session
Lunch
Afternoon Session
Marco 0950-1010
Marco 1050-1110
Marco 1450-1510
Silver Bullet London Open
Silver Bullet AM
Silver Bullet PM
You can also customize the color of any time session to suite your color scheme.
If you have any requests please leave a comment (I'm sure there are more marcos) :)

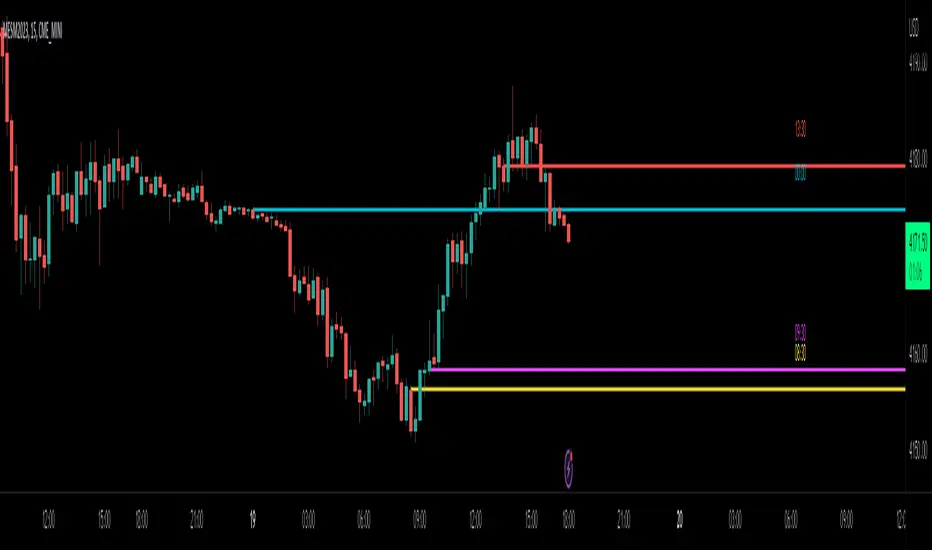
ICT Sessions_One Setup for Life [MK]The script plots the High/Low of the following trading sessions:
London - 02:00-05:00
NY AM - 09:30-12:00
New York Lunch - 12:00-13:30
New York PM - 13:30-16:00
Due to the high level of liquidity (resting orders), highs and lows of these sessions may be used as buy/sell areas and also as profit target areas. Typically, buy orders would be initiated below a session low and sell orders would be initiated above a
session high.
The script also plots 'RTH (Regular Trading Hours) Opening Gaps'. The RTH gaps are drawn from the closing price of regular trading at 16:15 (EST) to the open price of regular trading at 09:30 (EST). Gaps can be areas that traders might anticipate to be filled at some time in the future. A gap 'midline' is available if needed and yesterday RTH close line can be shown and extended to the current bar.
This script is simply a means to draw boxes around certain areas/periods on the charts. It is in no way a trading strategy and users should spend much time to study the concept and should also perform extensive back-testing before taking any trades.
By setting the lookback value to a much higher value then the default of 6, users can utilise the script to perform their own backtesting studies.
The above chart shows the default setup of the indicator. Note that the user has to choose how far (in days) to lookback and draw the sessions/gaps.
It is also possible to show the session high//low lines and extend them to the current bar time. If this is used it is advised to keep the lookback period as low as possible to ensure charts stay clean/uncluttered.
All boxes/lines styles/colors are fully customisable.

ICT Opening Lines [MK]Plots horizontal lines for the following opening times:
00:00 open
08:30 open
09:30 open
13:30 open
Opening lines can be used to monitor for power of 3/judas swings as per ICT teachings. The script allows the user to set a maximum timeframe for displaying the lines to keep HTF charts clean. Also an option is available to hide the lines after the market closes. If the hide option is used, the lines will be removed at 23:00.
Removing the lines after market closes ensures that the charts are clean when the market opens.
Labels can be displayed, colors and line styles can be customised.
ICT MacrosThis script allows traders to visualize the range of time when a macro (an automated series of instructions/trades from large fund traders, executed by an algorithm) will likely occur in the market. It does this by drawing vertical lines and labels on the chart at these specific times:
(Macro Open) - 9:50 AM EST
(Macro Close) - 10:10 AM EST
(Macro Open) - 10:50 AM EST
(Macro Close) - 11:10 AM EST
(Macro Open) - 1:10 PM EST
(Macro Close) - 1:40 PM EST
(Macro Open) - 3:15 PM EST
(Macro Close) - 3:45 PM EST
The theory behind the use of these macros - is that the market will either seek buy side or sell side liquidity, or seek to rebalance price at a point of interest in between the open and close of the macro. Traders who follow this theory can use that information to anticipate how price might behave.
When a macro occurs, the script draws a vertical line on the chart using a dotted line style with a user-defined color. Additionally, a label is placed above the line to indicate whether it is a Macro Open or Macro Close event.
To preserve space, the labels are abbreviated on chart - "Macro Open" (M.O.) and "Macro Close" (M.C.) for both the morning and afternoon trading sessions. The labels may be turned on/off by the user.
The script also includes alerts that can notify traders when a macro occurs. These alerts can be set to go off once per bar close, and the alert message indicates the specific macro type and time.
This script is entirely open-source, meaning that traders can read the code and modify it as needed. Credit to the foundation of this script goes to TradingView user @rickyzcarroll for his open source Strat Assistant Hour Flip script. Important changes include the specific time changes and alert function.

ICT - GAPs and Volume Imbalance
GAPs
Gaps are areas on chart where the price have moved sharply up or down, with no trading in between. Gaps often fill, but they don't have to.
Volume Imbalance
Volume imbalance - determined using 2 candles
Bullish Volume Imbalance - area between the close of 1st candle and the open of 2nd candle
Bearish Volume Imbalance - area between the close of 1st candle and the open of 2nd candle
How to use the indicator:-
When you find imbalance in volume or a GAP in the chart, you may expect price to rebalance it before continuation.
Importantly, GAPs/Imbalances do not always fill. Traders should never assume that a gap/imbalance will fill without understanding the reasons for the gap and monitoring trading activity around the gap.
Pair it with your current bias for better results.

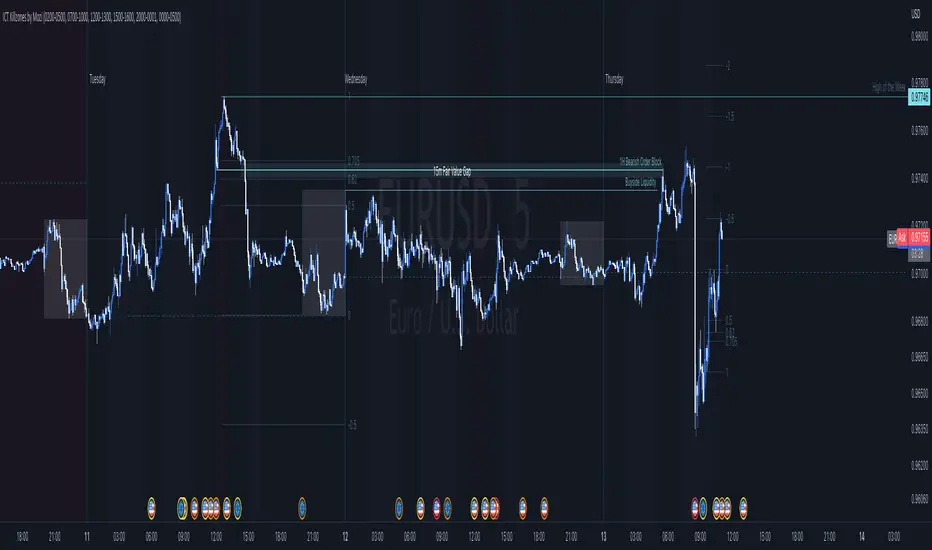
ICT Killzones by MoziThe ICT Killzone and important times indicator.
It highlights:
London Killzone
New York Killzone
New York Lunch Hour
New York Day End Hour
Asian Range
Judas Swing Time
In addition to this, it highlights the US and UK holidays with a background color and a label, so that you don't miss any bank holiday and you are sitting in front of your charts and are wondering, why the chart is not moving ;-)
I manually draw vertical lines at specific times like 08:30 London, 09:30 London, 08:30 New York, 09:30 New York, 11:00 New York (Take Profit Time)
ICT Killzones by MoziThe ICT Killzone and important times indicator.
It highlights:
London Killzone
New York Killzone
New York Lunch Hour
New York Day End Rallye
Asian Range
Judas Swing Time
In addition to this, it highlights the US and UK holidays with a background color and a label, so that you don't miss any bank holiday and you are sitting in front of your charts and are wondering, why the chart is not moving ;-)

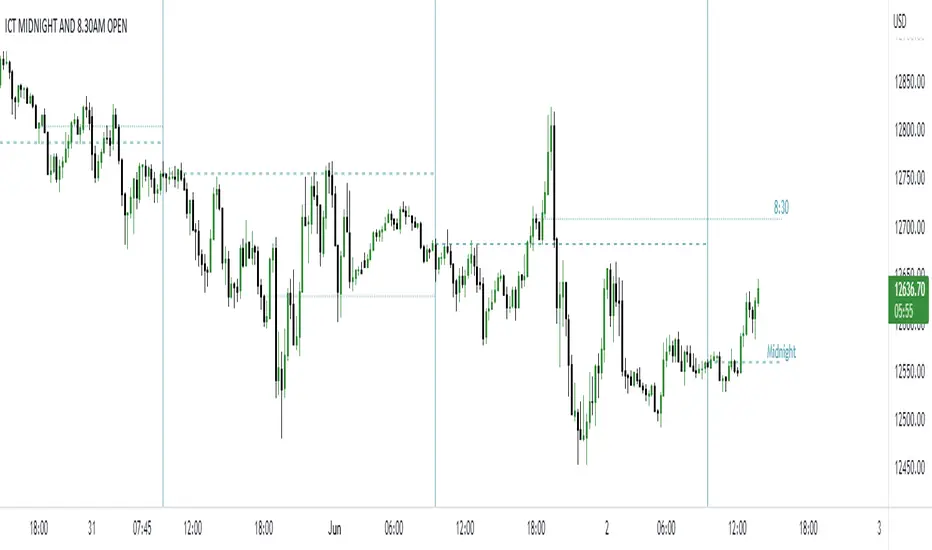
ICT NEW YORK MIDNIGHT OPEN AND 8.30 AM OPENTHIS SCRPT SHOWS NEW YORK MIDNIGHT OPEN PRICE AND 8.30 AM OPEN PRICE (AM SESSION)
you can use this script in forex, indices and your platform timezone should be exchange market time or new york time
ICT EverythingVersion 1.0
Global Settings
• Timezone Selection
• Hide Indicator Above Specified Time
Thematic Override
• Override Colors For Dark Theme ( Colors Set for White Theme by Default )
• Override Session Highlighting Color
Session Options
• Show Historical Sessions
• Enable/Disable Session Highlighting
• Session Specific Visibility
• Session's Crucial Time Vertical Lines w/ Options
NY Midnight Line Options
• Show Historical NY Midnight Vertical Lines
• Midnight Verticle Line Options
• Show Historical NY Midnight Price Lines
• Midnight Price Line Options
Opening Price Line Options
• New York 8:30 AM Price Line Settings
• Equities Open 9:30 AM Price Line Settings
• Option to Display Historical Price Lines
HTF Levels
• Weekly Open
• Monthly Open
label Settings
• Show/Hide Label Text
• Show/Hide Label
Day of Week
• Show Day of Week at the bottom of chart w/ Time Co-ordinates Selection
••• Message Me For Link to Frequently Updated Version of This Indicator •••

ICT - high low indicatorthis script is for new traders who are now getting into ICT trading, simply turn it on and it marks the previous 3 daily highs and lows, 3 weekly highs and lows, and the 3 monthly highs and lows.

ict newyork kill zone for Indian timethis is a indicator for ict New York kill zone for India standard time

Time-Based Fair Value Gaps (FVG) with Inversions (iFVG)Overview
The Time-Based Fair Value Gaps (FVG) with Inversions (iFVG) (ICT/SMT) indicator is a specialized tool designed for traders using Inner Circle Trader (ICT) methodologies. Inspired by LuxAlgo's Fair Value Gap indicator, this script introduces significant enhancements by integrating ICT principles, focusing on precise time-based FVG detection, inversion tracking, and retest signals tailored for institutional trading strategies. Unlike LuxAlgo’s general FVG approach, this indicator filters FVGs within customizable 10-minute windows aligned with ICT’s macro timeframes and incorporates ICT-specific concepts like mitigation, liquidity grabs, and session-based gap prioritization.
This tool is optimized for 1–5 minute charts, though probably best for 1 minute charts, identifying bullish and bearish FVGs, tracking their mitigation into inverted FVGs (iFVGs) as key support/resistance zones, and generating retest signals with customizable “Close” or “Wick” confirmation. Features like ATR-based filtering, optional FVG labels, mitigation removal, and session-specific FVG detection (e.g., first FVG in AM/PM sessions) make it a powerful tool for ICT traders.
Originality and Improvements
While inspired by LuxAlgo’s FVG indicator (credit to LuxAlgo for their foundational work), this script significantly extends the original concept by:
1. Time-Based FVG Detection: Unlike LuxAlgo’s continuous FVG identification, this script filters FVGs within user-defined 10-minute windows each hour (:00–:10, :10–:20, etc.), aligning with ICT’s emphasis on specific periods of institutional activity, such as hourly opens/closes or kill zones (e.g., New York 7:00–11:00 AM EST). This ensures FVGs are relevant to high-probability ICT setups.
2. Session-Specific First FVG Option: A unique feature allows traders to display only the first FVG in ICT-defined AM (9:30–10:00 AM EST) or PM (1:30–2:00 PM EST) sessions, reflecting ICT’s focus on initial market imbalances during key liquidity events.
3. ICT-Driven Mitigation and Inversion Logic: The script tracks FVG mitigation (when price closes through a gap) and converts mitigated FVGs into iFVGs, which serve as ICT-style support/resistance zones. This aligns with ICT’s view that mitigated gaps become critical reversal points, unlike LuxAlgo’s simpler gap display.
4. Customizable Retest Signals: Retest signals for iFVGs are configurable for “Close” (conservative, requiring candle body confirmation) or “Wick” (faster, using highs/lows), catering to ICT traders’ need for precise entry timing during liquidity grabs or Judas swings.
5. ATR Filtering and Mitigation Removal: An optional ATR filter ensures only significant FVGs are displayed, reducing noise, while mitigation removal declutters the chart by removing filled gaps, aligning with ICT’s principle that mitigated gaps lose relevance unless inverted.
6. Timezone and Timeframe Safeguards: A timezone offset setting aligns FVG detection with EST for ICT’s New York-centric strategies, and a timeframe warning alerts users to avoid ≥1-hour charts, ensuring accuracy in time-based filtering.
These enhancements make the script a distinct tool that builds on LuxAlgo’s foundation while offering ICT traders a tailored, high-precision solution.
How It Works
FVG Detection
FVGs are identified when a candle’s low is higher than the high of two candles prior (bullish FVG) or a candle’s high is lower than the low of two candles prior (bearish FVG). Detection is restricted to:
• User-selected 10-minute windows (e.g., :00–:10, :50–:60) to capture ICT-relevant periods like hourly transitions.
• AM/PM session first FVGs (if enabled), focusing on 9:30–10:00 AM or 1:30–2:00 PM EST for key market opens.
An optional ATR filter (default: 0.25× ATR) ensures only gaps larger than the threshold are displayed, prioritizing significant imbalances.
Mitigation and Inversion
When price closes through an FVG (e.g., below a bullish FVG’s bottom), the FVG is mitigated and becomes an iFVG, plotted as a support/resistance zone. iFVGs are critical in ICT for identifying reversal points where institutional orders accumulate.
Retest Signals
The script generates signals when price retests an iFVG:
• Close: Triggers when the candle body confirms the retest (conservative, lower noise).
• Wick: Triggers when the candle’s high/low touches the iFVG (faster, higher sensitivity). Signals are visualized with triangular markers (▲ for bullish, ▼ for bearish) and can trigger alerts.
Visualization
• FVGs: Displayed as colored boxes (green for bullish, red for bearish) with optional “Bull FVG”/“Bear FVG” labels.
• iFVGs: Shown as extended boxes with dashed midlines, limited to the user-defined number of recent zones (default: 5).
• Mitigation Removal: Mitigated FVGs/iFVGs are removed (if enabled) to keep the chart clean.
How to Use
Recommended Settings
• Timeframe: Use 1–5 minute charts for precision, avoiding ≥1-hour timeframes (a warning label appears if misconfigured).
• Time Windows: Enable :00–:10 and :50–:60 for hourly open/close FVGs, or use the “Show only 1st presented FVG” option for AM/PM session focus.
• ATR Filter: Keep enabled (multiplier 0.25–0.5) for significant gaps; disable on 1-minute charts for more FVGs during volatility.
• Signal Preference: Use “Close” for conservative entries, “Wick” for aggressive setups.
• Timezone Offset: Set to -5 for EST (or -4 for EDT) to align with ICT’s New York session.
Trading Strategy
1. Macro Timeframes: Focus on New York (7:00–11:00 AM EST) or London (2:00–5:00 AM EST) kill zones for high institutional activity.
2. FVG Entries: Trade bullish FVGs as support in uptrends or bearish FVGs as resistance in downtrends, especially in :00–:10 or :50–:60 windows.
3. iFVG Retests: Enter on retest signals (▲/▼) during liquidity grabs or Judas swings, using “Close” for confirmation or “Wick” for speed.
4. Session FVGs: Use the “Show only 1st presented FVG” option to target the first gap in AM/PM sessions, often tied to ICT’s market maker algorithms.
5. Risk Management: Combine with ICT concepts like order blocks or breaker blocks for confluence, and set stops beyond FVG/iFVG boundaries.
Alerts
Set alerts for:
• “Bullish FVG Detected”/“Bearish FVG Detected”: New FVGs in selected windows.
• “Bullish Signal”/“Bearish Signal”: iFVG retest confirmations.
Settings Description
• Show Last (1–100, default: 5): Number of recent iFVGs to display. Lower values reduce clutter.
• Show only 1st presented FVG : Limits FVGs to the first in 9:30–10:00 AM or 1:30–2:00 PM EST sessions (overrides time window checkboxes).
• Time Window Checkboxes: Enable/disable FVG detection in 10-minute windows (:00–:10, :10–:20, etc.). All enabled by default.
• Signal Preference: “Close” (default) or “Wick” for iFVG retest signals.
• Use ATR Filter: Enables ATR-based size filtering (default: true).
• ATR Multiplier (0–∞, default: 0.25): Sets FVG size threshold (higher values = larger gaps).
• Remove Mitigated FVGs: Removes filled FVGs/iFVGs (default: true).
• Show FVG Labels: Displays “Bull FVG”/“Bear FVG” labels (default: true).
• Timezone Offset (-12 to 12, default: -5): Aligns time windows with EST.
• Colors: Customize bullish (green), bearish (red), and midline (gray) colors.
Why Use This Indicator?
This indicator empowers ICT traders with a tool that goes beyond generic FVG detection, offering precise, time-filtered gaps and inversion tracking aligned with institutional trading principles. By focusing on ICT’s macro timeframes, session-specific imbalances, and customizable signal logic, it provides a clear edge for scalping, swing trading, or reversal setups in high-liquidity markets.

Advanced ICT Theory - A-ICT📊 Advanced ICT Theory (A-ICT): The Institutional Manipulation Detector
Are you tired of being the liquidity? Stop chasing shadows and start tracking the architects of price movement.
This is not another lagging indicator. This is a complete framework for viewing the market through the lens of institutional traders. Advanced ICT Theory (A-ICT) is an all-in-one, military-grade analysis engine designed to decode the complex language of "Smart Money." It automates the core tenets of Inner Circle Trader (ICT) methodology, moving beyond simple patterns to build a dynamic, real-time narrative of market manipulation, liquidity engineering, and institutional order flow.
AIT provides a living blueprint of the market, identifying high-probability zones, tracking structural shifts, and scoring the quality of setups with a sophisticated, multi-factor algorithm. This is your X-ray into the market's true intentions.
🔬 THE CORE ENGINE: DECODING THE THEORY & FORMULAS
A-ICT is built upon a sophisticated, multi-layered logic system that interprets price action as a story of cause and effect. It does not guess; it confirms. Here is the foundational theory that drives the engine:
1. Market Structure: The Blueprint of Trend
The script first establishes a deep understanding of the market's skeleton through multi-level pivot analysis. It uses ta.pivothigh and ta.pivotlow to identify significant swing points.
Internal Structure (iBOS): Minor swings that show the short-term order flow. A break of internal structure is the first whisper of a potential shift.
External Structure (eBOS): Major swing points that define the primary trend. A confirmed break of external structure is a powerful statement of trend continuation. AIT validates this with optional Volume Confirmation (volume > volumeSMA * 1.2) and Candle Confirmation to ensure the break is driven by institutional force, not just a random spike.
Change of Character (CHoCH): This is the earthquake. A CHoCH occurs when a confirmed eBOS happens against the prevailing trend (e.g., a bearish eBOS in a clear uptrend). A-ICT flags this immediately, as it is the strongest signal that the primary trend is under threat of reversal.
2. Liquidity Engineering: The Fuel of the Market
Institutions don't buy into strength; they buy into weakness. They need liquidity. A-ICT maps these liquidity pools with forensic precision:
Buyside & Sellside Liquidity (BSL/SSL): Using ta.highest and ta.lowest, AIT identifies recent highs and lows where clusters of stop-loss orders (liquidity) are resting. These are institutional targets.
Liquidity Sweeps: This is the "manipulation" part of the detector. AIT has a specific formula to detect a sweep: high > bsl and close < bsl . This signifies that institutions pushed price just high enough to trigger buy-stops before aggressively selling—a classic "stop hunt." This event dramatically increases the quality score of subsequent patterns.
3. The Element Lifecycle: From Potential to Power
This is the revolutionary heart of A-ICT. Zones are not static; they have a lifecycle. AIT tracks this with its dynamic classification engine.
Phase 1: PENDING (Yellow): The script identifies a potential zone of interest based on a specific candle formation (a "displacement"). It is marked as "Pending" because its true nature is unknown. It is a question.
Phase 2: CLASSIFICATION: After the zone is created, AIT watches what happens next. The zone's identity is defined by its actions:
ORDER BLOCK (Blue): The highest-grade element. A zone is classified as an Order Block if it directly causes a Break of Structure (BOS) . This is the footprint of institutions entering the market with enough force to validate the new trend direction.
TRAP ZONE (Orange): A zone is classified as a Trap Zone if it is directly involved in a Liquidity Sweep . This indicates the zone was used to engineer liquidity, setting a "trap" for retail traders before a reversal.
REVERSAL / S&R ZONE (Green): If a zone is not powerful enough to cause a BOS or a major sweep, but still serves as a pivot point, it's classified as a general support/resistance or reversal zone.
4. Market Inefficiencies: Gaps in the Matrix
Fair Value Gaps (FVG): AIT detects FVGs—a 3-bar pattern indicating an imbalance—with a strict formula: low > high (for a bullish FVG) and gapSize > atr14 * 0.5. This ensures only significant, volatile gaps are shown. An FVG co-located with an Order Block is a high-confluence setup.
5. Premium & Discount: The Law of Value
Institutions buy at wholesale (Discount) and sell at retail (Premium). AIT uses a pdLookback to define the current dealing range and divides it into three zones: Premium (sell zone), Discount (buy zone), and Equilibrium. An element's quality score is massively boosted if it aligns with this principle (e.g., a bullish Order Block in a Discount zone).
⚙️ THE CONTROL PANEL: A COMPLETE GUIDE TO THE INPUTS MENU
Every setting is a lever, allowing you to tune the AIT engine to your exact specifications. Master these to unlock the script's full potential.
🎯 A-ICT Detection Engine
Min Displacement Candles: Controls the sensitivity of element detection. How it works: It defines the number of subsequent candles that must be "inside" a large parent candle. Best practice: Use 2-3 for a balanced view on most timeframes. A higher number (4-5) will find only major, more significant zones, ideal for swing trading. A lower number (1) is highly sensitive, suitable for scalping.
Mitigation Method: Defines when a zone is considered "used up" or mitigated. How it works: Cross triggers as soon as price touches the zone's boundary. Close requires a candle to fully close beyond it. Best practice: Cross is more responsive for fast-moving markets. Close is more conservative and helps filter out fake-outs caused by wicks, making it safer for confirmations.
Min Element Size (ATR): A crucial noise filter. How it works: It requires a detected zone to be at least this multiple of the Average True Range (ATR). Best practice: Keep this around 0.5. If you see too many tiny, irrelevant zones, increase this value to 0.8 or 1.0. If you feel the script is missing smaller but valid zones, decrease it to 0.3.
Age Threshold & Pending Timeout: These manage visual clutter. How they work: Age Threshold removes old, mitigated elements after a set number of bars. Pending Timeout removes a "Pending" element if it isn't classified within a certain window. Best practice: The default settings are optimized. If your chart feels cluttered, reduce the Age Threshold. If pending zones disappear too quickly, increase the Pending Timeout.
Min Quality Threshold: Your primary visual filter. How it works: It hides all elements (boxes, lines, labels) that do not meet this minimum quality score (0-100). Best practice: Start with the default 30. To see only A- or B-grade setups, increase this to 60 or 70 for an exceptionally clean, high-probability view.
🏗️ Market Structure
Lookbacks (Internal, External, Major): These define the sensitivity of the trend analysis. How they work: They set the number of bars to the left and right for pivot detection. Best practice: Use smaller values for Internal (e.g., 3) to see minor structure and larger values for External (e.g., 10-15) to map the main trend. For a macro, long-term view, increase the Major Swing Lookback.
Require Volume/Candle Confirmation: Toggles for quality control on BOS/CHoCH signals. Best practice: It is highly recommended to keep these enabled. Disabling them will result in more structure signals, but many will be false alarms. They are your filter against market noise.
... (Continue this detailed breakdown for every single input group: Display Configuration, Zones Style, Levels Appearance, Colors, Dashboards, MTF, Liquidity, Premium/Discount, Sessions, and IPDA).
📊 THE INTELLIGENCE DASHBOARDS: YOUR COMMAND CENTER
The dashboards synthesize all the complex analysis into a simple, actionable intelligence briefing.
Main Dashboard (Bottom Right)
ICT Metrics & Breakdown: This is your statistical overview. Total Elements shows how much structure the script is tracking. High Quality instantly tells you if there are any A/B grade setups nearby. Unmitigated vs. Mitigated shows the balance of fresh opportunities versus resolved price action. The breakdown by Order Blocks, Trap Zones, etc., gives you a quick read on the market's recent character.
Structure & Market Context: This is your core bias. Order Flow tells you the current script-determined trend. Last BOS shows you the most recent structural event. CHoCH Active is a critical warning. HTF Bias shows if you are aligned with the higher timeframe—the checkmark (✓) for alignment is one of the most important confluence factors.
Smart Money Flow: A volume-based sentiment gauge. Net Flow shows the raw buying vs. selling pressure, while the Bias provides an interpretation (e.g., "STRONG BULLISH FLOW").
Key Guide (Large Dashboard only): A built-in legend so you never have to guess. It defines every pattern, structure type, and special level visually.
📖 Narrative Dashboard (Bottom Left)
This is the "story" of the market, updated in real-time. It's designed to build your trading thesis.
Recent Elements Table: A live list of the most recent, high-quality setups. It displays the Type , its Narrative Role (e.g., "Bullish OB caused BOS"), its raw Quality percentage, and its final Trade Score grade. This is your at-a-glance opportunity scanner.
Market Narrative Section: This is the soul of A-ICT. It combines all data points into a human-readable story:
📍 Current Phase: Tells you if you are in a high-volatility Killzone or a consolidation phase like the Asian Range.
🎯 Bias & Alignment: Your primary direction, with a clear indicator of HTF alignment or conflict.
🔗 Events: A causal sequence of recent events, like "💧 Sell-side liquidity swept →
📊 Bullish BOS → 🎯 Active Order Block".
🎯 Next Expectation: The script's logical conclusion. It provides a specific, forward-looking hypothesis, such as "📉 Pullback expected to bullish OB at 1.2345 before continuation up."
🎨 READING THE BATTLEFIELD: A VISUAL INTERPRETATION GUIDE
Every color and line is a piece of information. Learn to read them together to see the full picture.
The Core Zones (Boxes):
Blue Box (Order Block): Highest probability zone for trend continuation. Look for entries here.
Orange Box (Trap Zone): A manipulation footprint. Expect a potential reversal after price interacts with this zone.
Green Box (Reversal/S&R): A standard pivot area. A good reference point but requires more confluence.
Purple Box (FVG): A market imbalance. Acts as a magnet for price. An FVG inside an Order Block is an A+ confluence.
The Structural Lines:
Green/Red Line (eBOS): Confirms the trend direction. A break above the green line is bullish; a break below the red line is bearish.
Thick Orange Line (CHoCH): WARNING. The previous trend is now in question. The market character has changed.
Blue/Red Lines (BSL/SSL): Liquidity targets. Expect price to gravitate towards these lines. A dotted line with a checkmark (✓) means the liquidity has been "swept" or "purged."
How to Synthesize: The magic is in the confluence. A perfect setup might look like this: Price sweeps below a red SSL line , enters a green Discount Zone during the NY Killzone , and forms a blue Order Block which then causes a green eBOS . This sequence, visible at a glance, is the story of a high-probability long setup.
🔧 THE ARCHITECT'S VISION: THE DEVELOPMENT JOURNEY
A-ICT was forged from the frustration of using lagging indicators in a market that is forward-looking. Traditional tools are reactive; they tell you what happened. The vision for A-ICT was to create a proactive engine that could anticipate institutional behavior by understanding their objectives: liquidity and efficiency. The development process was centered on creating a "lifecycle" for price patterns—the idea that a zone's true meaning is only revealed by its consequence. This led to the post-breakout classification system and the narrative-building engine. It's designed not just to show you patterns, but to tell you their story.
⚠️ RISK DISCLAIMER & BEST PRACTICES
Advanced ICT Theory (A-ICT) is a professional-grade analytical tool and does not provide financial advice or direct buy/sell signals. Its analysis is based on historical price action and probabilities. All forms of trading involve substantial risk. Past performance is not indicative of future results. Always use this tool as part of a comprehensive trading plan that includes your own analysis and a robust risk management strategy. Do not trade based on this indicator alone.
観の目つよく、見の目よわく
"Kan no me tsuyoku, ken no me yowaku"
— Miyamoto Musashi, The Book of Five Rings
English: "Perceive that which cannot be seen with the eye."
— Dskyz, Trade with insight. Trade with anticipation.

GTrader-ICT All In One-Comumnity VersionMeet the **GTrader-ICT All In One **, a comprehensive toolkit designed to integrate key Inner Circle Trader (ICT) concepts directly onto your chart. This powerful overlay indicator consolidates multiple essential tools, streamlining your technical analysis and helping you identify key temporal and price-based events.
📚 References & Inspiration
This indicator stands on the shoulders of giants. With the help of **tradeforopp** and **LuxAlgo**. The concepts and some implementation details were referenced from the following excellent, publicly available scripts:
ICT Killzones: The session drawing and pivot logic is adapted from tradeforopp
ICT Macros: The macro detection and plotting functionality is inspired by the work of Lux Algo , particularly their widely-used indicators covering ICT concepts.
🎯 Core Features
* **ICT Killzones:** Visualize critical trading sessions with customizable boxes. You can easily toggle and style the **Asia**, **London**, and **New York (AM, Lunch, PM)** sessions to focus on the liquidity and volatility that matter most to your strategy.
* Fully customizable session times and colors.
* Timezone support to align sessions with your local or preferred trading time (defaults to `America/New_York`).
* **ICT Macros:** Automatically identify and plot specific, short-duration time windows where institutional algorithms are known to be active (e.g., `09:50-10:10`, `14:50-15:10`, etc.).
* Plots the high/low range of the macro, providing clear levels of interest.
* Utilizes 1-minute data for precision, even when viewing on 3-minute or 5-minute charts.
📚 Optimization over the other original indicators
We add the custom input for macros session, users just need to input the from/to hour: minute format, and they will be converted into session objects in pinescript
The macro draws function is optimized, removing redundant draws, leading to better performance
Add "Distance from Macro Line to Chart" option
Add "Session Drawings Limit" for better performance
⚠️ Notes on TradingView Warnings
You may encounter some warnings from TradingView when using this script. These are generally expected due to the script's advanced, event-driven nature:
1. **Function Call Consistency:** The function 'box.new' should be called on each calculation for consistency, which may appear. This happens because drawing elements (like session boxes) are intentionally created only on the *first bar* of a new session, not on every single bar. This is a necessary design choice for performance and to prevent duplicate drawings.
2. **Potential for Repainting/Slow Load:** The **Macro** feature uses the `request.security_lower_tf()` function to get accurate 1-minute data. This can trigger warnings about performance or slow loading times. This is a known trade-off for achieving the precision required for the feature.

TrendCraft ICT SwiftEdge// The TrendCraft ICT SwiftEdge is a trend-following indicator that combines Simple Moving Averages (SMAs) with Inner Circle Trader (ICT) concepts, specifically Break of Structure (BOS) and Market Structure Shift (MSS), to generate precise buy and sell signals. This unique mashup leverages the strengths of trend confirmation through SMAs and market structure analysis via ICT to help traders identify high-probability trend entries. The indicator is designed to be intuitive, customizable, and suitable for traders of all levels seeking to align with market trends on various timeframes.
//
// ### What It Does
// The indicator plots two SMAs based on the high and low prices of candles to define the trend direction. It colors the SMAs and fills the area between them to visually indicate whether the price is in a bullish (above both SMAs), bearish (below both SMAs), or neutral (between SMAs) state. Simultaneously, it identifies BOS and MSS levels on a user-defined higher timeframe to confirm trend continuation or reversal points. Buy and sell signals are generated when the price closes above/below the latest BOS or MSS level (based on user preference) while also being correctly positioned relative to the SMAs, ensuring alignment with the trend.
//
// ### Why Combine SMAs and ICT?
// SMAs provide a reliable way to gauge trend direction by smoothing price data, but they can lag or generate false signals in choppy markets. ICT's BOS and MSS concepts address this by focusing on key market structure breaks, offering context for significant price movements. By requiring price to close beyond a BOS or MSS level and align with the SMA-defined trend, the TrendCraft ICT SwiftEdge filters out noise and enhances signal reliability. This combination creates a robust system that balances trend-following simplicity with structural market insights, making it ideal for trend traders.
//
// ### How to Use
// 1. **SMA Length**: Adjust the `SMA Length` (default: 20) to control the sensitivity of the SMAs. Shorter lengths react faster to price changes, while longer lengths provide smoother trends.
// 2. **Structure Timeframe**: Set the `Structure Timeframe` to a higher timeframe (e.g., "1H" on a 15M chart) to calculate BOS and MSS levels. This ensures structural signals are based on significant market moves.
// 3. **Chart Timeframe**: Select the `Chart Timeframe` to optimize pivot point calculations for your current chart (e.g., "30M" for a 30-minute chart).
// 4. **Signal Type**: Choose between "BOS" (default) for signals based on trend continuation breaks or "MSS" for signals based on potential reversal points (breakers).
// 5. **Display Options**: Enable/disable `Show Continuation (BOS)` and `Show Breaker (MSS)` to toggle the visibility of BOS and MSS lines. Customize their colors for better chart clarity.
//
// ### Signals
// - **Buy Signal**: Appears when the close price crosses above the latest BOS or MSS level (based on Signal Type) and is above both SMAs, indicating a bullish trend entry. Marked with a green "Buy" label.
// - **Sell Signal**: Appears when the close price crosses below the latest BOS or MSS level (based on Signal Type) and is below both SMAs, indicating a bearish trend entry. Marked with a red "Sell" label.
//
// ### Originality
// The TrendCraft ICT SwiftEdge stands out by integrating the trend-following reliability of SMAs with the structural precision of ICT's BOS and MSS. Unlike standalone SMA or ICT indicators, this script requires both trend alignment and structural confirmation, reducing false signals. The user-selectable Signal Type (BOS or MSS) adds versatility, allowing traders to adapt the indicator to trend-following or counter-trend strategies. Its dynamic timeframe adjustments and visual clarity make it a unique tool for traders seeking to capture trend entries with confidence.
//
// ### Notes
// - Ensure the `Structure Timeframe` is higher than your chart timeframe to avoid calculation issues.
// - Signals are generated only when the trend state changes to avoid redundant signals in the same trend direction.
// - Past performance is not indicative of future results. Always combine this indicator with other analysis and risk management techniques.

[TehThomas] - Aligned Timeframe Liquidity Sweeps█ OVERVIEW
The Liquidity Sweeps ICT MTF indicator automatically detects and visualizes buyside and sellside liquidity levels based on higher timeframe (HTF) swing points. Designed specifically for traders using Smart Money Concepts and ICT (Inner Circle Trader) methodology, this tool helps identify where institutional players are likely hunting liquidity before making directional moves.
█ KEY FEATURES
✓ Automatic ICT-Aligned Timeframe Selection
• Intelligently selects the higher timeframe based on your current chart
• Follows ICT's recommended correlations (5min→1h, 15min→4h, 1h→Daily, etc.)
• No manual timeframe selection needed - adapts automatically
✓ Precise Liquidity Level Placement
• Lines start exactly at the LTF candle that created the HTF swing point
• Searches backwards through historical data to find exact placement
• Eliminates guesswork about where institutional orders cluster
✓ Real-Time Sweep Detection
• Solid lines indicate untouched liquidity (active levels)
• Lines automatically turn dotted when price sweeps through them
• Swept lines stop at the exact bar of the sweep (clean visualization)
• Both wicks and candle bodies trigger sweep detection
✓ Fully Customizable Per Timeframe
• Individual swing detection settings for each HTF (1m, 15m, 1h, 4h, D, W, M)
• Adjust sensitivity to show major levels only or capture granular liquidity pools
• Customizable colors and line width
• Organized settings groups for easy navigation
█ HOW IT WORKS
The indicator identifies swing highs and swing lows on a higher timeframe using pivot point detection. These swing points represent areas where stop-loss orders from retail traders concentrate, creating "liquidity pools" that smart money targets.
Timeframe Alignment (Automatic):
• 15s chart → 1min HTF
• 1min chart → 15min HTF
• 5min chart → 1hour HTF
• 15min chart → 4hour HTF
• 1hour chart → Daily HTF
• 4hour chart → Weekly HTF
• Daily chart → Monthly HTF
Swing Detection:
The indicator uses customizable left/right bar counts to identify valid swing points on the HTF. Default values are optimized per timeframe (e.g., 10 bars for 1h, 5 bars for Daily), but can be adjusted to your preference.
Visualization:
• Green lines = Buyside liquidity (swing highs where long stops sit)
• Red lines = Sellside liquidity (swing lows where short stops sit)
• Solid style = Untouched liquidity
• Dotted style = Swept liquidity
█ SETTINGS
Swing Detection Group:
• Swing Bars - 1 Minute: Default 5 bars
• Swing Bars - 15 Minutes: Default 8 bars
• Swing Bars - 1 Hour: Default 10 bars
• Swing Bars - 4 Hours: Default 6 bars
• Swing Bars - Daily: Default 5 bars
• Swing Bars - Weekly: Default 3 bars
• Swing Bars - Monthly: Default 2 bars
Tip: Increase values for cleaner charts with major levels only. Decrease for more sensitive detection.
Display Group:
• Buyside Liquidity Color: Default green
• Sellside Liquidity Color: Default red
• Line Width: Adjustable 1-5
█ HOW TO USE
Reading the liquidity levels:
🟢 Green solid line = Untouched buyside liquidity (potential magnet for price)
🔴 Red solid line = Untouched sellside liquidity (potential magnet for price)
🟢 Green dotted line = Swept buyside liquidity (bulls trapped)
🔴 Red dotted line = Swept sellside liquidity (bears trapped)
Trading Applications:
1. Liquidity Grab Reversals: Watch for sweeps followed by immediate reversals
2. Stop Hunt Detection: Multiple sweeps often precede strong counter-moves
3. Target Identification: Use untouched levels as potential price magnets
4. Market Structure Analysis: Understand institutional order flow
5. Confluence Zones: Combine with order blocks, FVGs, or other ICT concepts
Best Practices:
• Focus on liquid markets (major FX pairs, indices, large-cap stocks)
• Consider higher timeframe trend - sweeps against trend are higher probability
• Look for liquidity clusters (multiple levels close together)
• Wait for confirmation after sweeps before entering
• Not all sweeps result in reversals - context matters
█ TRADING STRATEGY EXAMPLES
Liquidity Sweep Reversal:
1. Identify untouched liquidity level
2. Wait for price to sweep through (line turns dotted)
3. Look for reversal price action (engulfing, rejection)
4. Enter in reversal direction with stop beyond the sweep
5. Target next liquidity level or structure
Liquidity-to-Liquidity:
1. Price sweeps sellside liquidity (red dotted)
2. Enter long positions
3. Target buyside liquidity above (green solid)
4. Exit when buyside liquidity is swept
█ IDEAL FOR
• ICT Methodology Traders
• Smart Money Concept Practitioners
• Liquidity-Based Strategies
• Multi-Timeframe Analysis
• Price Action Traders
• Stop Hunt Avoidance
█ TECHNICAL SPECIFICATIONS
• Maximum Lines: 500
• Lookback Range: Up to 1000 bars for precise placement
• Compatible: All markets and timeframes
• Data: Works on both real-time and historical bars
█ NOTES & DISCLAIMERS
• This indicator is a tool for analysis, not a standalone trading system
• Always use proper risk management and combine with other analysis
• Performance may vary across different markets and conditions
• Based on ICT concepts - familiarity with Smart Money trading is recommended
█ LIQUIDITY FOR SINGLETIMEFRAMES
If you prefer normal liquidity lines you can use my other free liquidity indicator

Custom Time Range HighlightThis indicator highlights specific time ranges on your TradingView chart with customizable background colors and labels, making it easier to identify key trading sessions and ICT (Inner Circle Trader) Killzones. It is designed for traders who want to mark important market hours, such as major sessions (Asia, New York, London) or high-volatility Killzones, with full control over activation, timing, colors, and transparency.
Features
Customizable Time Ranges: Define up to 9 different time ranges, including one custom range, three major market sessions (Asia, New York, London), and five ICT Killzones (Asia, NY Open, NY Close, London Open, London Close).
Individual Activation: Enable or disable each time range independently via checkboxes in the settings. By default, only the ICT Killzones are active.
Custom Colors and Transparency: Set unique background and label colors for each range, with adjustable transparency for both.
Labeled Time Ranges: Each active range is marked with a customizable label at the start of the period, displayed above the chart for easy identification.
Priority Handling: If multiple ranges overlap, the range with the higher number (e.g., Asia Killzone over Custom Range) determines the background color.
CET Time Zone: Time ranges are based on Central European Time (CET, Europe/Vienna). Adjust the hours and minutes to match your trading needs.
Settings
The indicator settings are organized into three groups for clarity:
Custom Range: A flexible range (default: 15:30–18:00 CET) for user-defined periods.
Session - Asia, NY, London: Major market sessions (Asia: 01:00–10:00, New York: 14:00–23:00, London: 09:00–18:00 CET).
ICT Killzones - Asia, NY, London: High-volatility periods (NY Open: 13:00–16:00, NY Close: 20:00–23:00, London Open: 08:00–11:00, London Close: 16:00–18:00, Asia: 02:00–05:00 CET).
For each range, you can:
Toggle activation (default: only ICT Killzones enabled).
Adjust start and end times (hours and minutes).
Customize the label text.
Choose background and label colors with transparency levels (0–100).
How to Use
Add the indicator to your chart.
Open the settings to enable/disable specific ranges, adjust their times, or customize colors and labels.
The chart will highlight active time ranges with the selected background colors and display labels at the start of each range.
Use it to focus on key trading periods, such as ICT Killzones for high-probability setups or major sessions for market analysis.
Notes
Ensure your time ranges align with your trading instrument’s session times.
Overlapping ranges prioritize higher-numbered ranges (e.g., Asia Killzone overrides London Session).
Ideal for day traders, scalpers, or ICT strategy followers who need clear visual cues for specific market hours.
Feedback
If you have suggestions for improvements or need help with customization, feel free to leave a comment or contact the author!

[KVA] ICT Dealing rangesNaive aproach of Dynamic Detection of Dealing Ranges:
The script dynamically identifies dealing ranges based on sequences of upward or downward price movements. It uses arrays to track the highest highs and lowest lows after detecting two consecutive up or down bars, a fundamental step towards understanding market structure and potential shifts in momentum.
ICT Concept: Order Blocks & Fair Value Gaps. This aspect can be linked to the identification of order blocks (bullish or bearish) and fair value gaps. Order blocks are essentially the last bearish or bullish candle before a significant price move, which this script could approximate by identifying the highs and lows of potential reversal zones.
Red and Green Ranges for Bullish and Bearish Movements:
The script separates these movements into red (bearish) and green (bullish) ranges, effectively categorizing potential areas of selling and buying pressure.
ICT Concept: Liquidity Pools. Red ranges could be indicative of areas where selling might occur, potentially leading to liquidity pools below these ranges. Conversely, green ranges might indicate potential buying pressure, with liquidity pools above. These areas are critical for ICT traders, as they often represent zones where price may return to "hunt" for liquidity.
Horizontal Lines for High and Low Points:
The indicator draws horizontal lines at the high and low points of these ranges, offering visual cues for significant levels.
ICT Concept: Breaker Blocks & Mitigation Sequences. The high and low points of these ranges can be seen as potential breaker blocks or areas for future mitigation sequences. In ICT terms, breaker blocks are areas where institutional orders have overwhelmed retail stop clusters, creating potential entry points for trend continuation or reversal. The high and low points marked by the indicator could serve as references for these sequences, where price might return to retest these levels.
Customizability and Historical Depth:
With inputs like rangePlot and maxBarsBack, the indicator allows for customization of the number of ranges to display and how far back in the chart history it looks to identify these ranges. This flexibility is crucial for tailoring the analysis to different trading strategies and timeframes.
ICT Concept: Market Structure Analysis. The ability to adjust the depth and number of ranges plotted caters to a detailed market structure analysis, an essential component of ICT methodology. Traders can adjust these parameters to better understand the distribution of buying and selling pressure over time and how actions have shaped price movements.

Twitter Model ICT [TradingFinder] MMXM ERL D + FVG + M15 MSS/SMT🔵 Introduction
The Twitter Model ICT is a trading approach based on ICT (Inner Circle Trader) models, focusing on price movement between external and internal liquidity in lower timeframes. This model integrates key concepts such as Market Structure Shift (MSS), Smart Money Technique (SMT) divergence, and CISD level break to identify precise entry points in the market.
The primary goal of this model is to determine key liquidity levels, such as the previous day’s high and low (PDH/PDL) and align them with the Fair Value Gap (FVG) in the 1-hour timeframe. The overall strategy involves framing trades around the 1H FVG and using the M15 Market Structure Shift (MSS) for entry confirmation.
The Twitter Model ICT is designed to utilize external liquidity levels, such as PDH/PDL, as key entry zones. The model identifies FVG in the 1-hour timeframe, which acts as a magnet for price movement. Additionally, traders confirm entries using M15 Market Structure Shift (MSS) and SMT divergence.
Bullish Twitter Model :
In a bullish setup, the price sweeps the previous day’s low (PDL), and after confirming reversal signals, buys are executed in internal liquidity zones. Conversely, in a bearish setup, the price sweeps the previous day’s high (PDH), and after confirming weakness signals, sells are executed.
Bearish Twitter Model :
In short setups, entries are only executed above the Midnight Open, while in long setups, entries are taken below the Midnight Open. Adhering to these principles allows traders to define precise entry and exit points and analyze price movement with greater accuracy based on liquidity and market structure.
🔵 How to Use
The Twitter Model ICT is a liquidity-based trading strategy that analyzes price movements relative to the previous day’s high and low (PDH/PDL) and Fair Value Gap (FVG). This model is applicable in both bullish and bearish directions and utilizes the 1-hour (1H) and 15-minute (M15) timeframes for entry confirmation.
The price first sweeps an external liquidity level (PDH or PDL) and then provides an entry opportunity based on Market Structure Shift (MSS) and SMT divergence. Additionally, the entry should be positioned relative to the Midnight Open, meaning long entries should occur below the Midnight Open and short entries above it.
🟣 Bullish Twitter Model
In a bullish setup, the price first sweeps the previous day’s low (PDL) and reaches an external liquidity level. Then, in the 1-hour timeframe (1H), a bullish Fair Value Gap (FVG) forms, which serves as the price target.
To confirm the entry, a Market Structure Shift (MSS) in the 15-minute timeframe (M15) should be observed, signaling a trend reversal to the upside. Additionally, SMT divergence with correlated assets can indicate weakness in selling pressure.
Under these conditions, a long position is taken below the Midnight Open, with a stop-loss placed at the lowest point of the recent bearish move. The price target for this trade is the FVG in the 1-hour timeframe.
🟣 Bearish Twitter Model
In a bearish setup, the price first sweeps the previous day’s high (PDH) and reaches an external liquidity level. Then, in the 1-hour timeframe (1H), a bearish Fair Value Gap (FVG) is identified, serving as the trade target.
To confirm entry, a Market Structure Shift (MSS) in the 15-minute timeframe (M15) should form, signaling a trend shift to the downside. If an SMT divergence is present, it can provide additional confirmation for the trade.
Once these conditions are met, a short position is taken above the Midnight Open, with a stop-loss placed at the highest level of the recent bullish move. The trade's price target is the FVG in the 1-hour timeframe.
🔵 Settings
Bar Back Check : Determining the return of candles to identify the CISD level.
CISD Level Validity : CISD level validity period based on the number of candles.
Daily Position : Determines whether only the first signal of the day is considered or if signals are evaluated throughout the entire day.
Session : Specifies in which trading sessions the indicator will be active.
Second Symbol : This setting allows you to select another asset for comparison with the primary asset. By default, "XAUUSD" (Gold) is set as the second symbol, but you can change it to any currency pair, stock, or cryptocurrency. For example, you can choose currency pairs like EUR/USD or GBP/USD to identify divergences between these two assets.
Divergence Fractal Periods : This parameter defines the number of past candles to consider when identifying divergences. The default value is 2, but you can change it to suit your preferences. This setting allows you to detect divergences more accurately by selecting a greater number of candles.
The indicator allows displaying sessions based on various time zones. The user can select one of the following options :
UTC (Coordinated Universal Time)
Local Time of the Session
User’s Local Time
Show Open Price : Displays the New York market opening price.
Show PDH / PDL : Displays the previous day’s high and low to identify potential entry points.
Show SMT Divergence : Displays lines and labels for bullish ("+SMT") and bearish ("-SMT") divergences.
🔵 Conclusion
The Twitter Model ICT is an effective approach for analyzing and executing trades in financial markets, utilizing a combination of liquidity principles, market structure, and SMT confirmations to identify optimal entry and exit points.
By analyzing the previous day’s high and low (PDH/PDL), Fair Value Gaps (FVG), and Market Structure Shift (MSS) in the 1H and M15 timeframes, traders can pinpoint liquidity-driven trade opportunities. Additionally, considering the Midnight Open level helps traders avoid random entries and ensures better trade placement.
By applying this model, traders can interpret market movements based on liquidity flow and structural changes, allowing them to fine-tune their trading decisions with higher precision. Ultimately, the Twitter Model ICT provides a structured and logical approach for traders who seek to trade based on liquidity behavior and trend shifts in the market.

Trading IQ - ICT LibraryLibrary "ICTlibrary"
Used to calculate various ICT related price levels and strategies. An ongoing project.
Hello Coders!
This library is meant for sourcing ICT related concepts. While some functions might generate more output than you require, you can specify "Lite Mode" as "true" in applicable functions to slim down necessary inputs.
isLastBar(userTF)
Identifies the last bar on the chart before a timeframe change
Parameters:
userTF (simple int) : the timeframe you wish to calculate the last bar for, must be converted to integer using 'timeframe.in_seconds()'
Returns: bool true if bar on chart is last bar of higher TF, dalse if bar on chart is not last bar of higher TF
necessaryData(atrTF)
returns necessaryData UDT for historical data access
Parameters:
atrTF (float) : user-selected timeframe ATR value.
Returns: logZ. log return Z score, used for calculating order blocks.
method gradBoxes(gradientBoxes, idColor, timeStart, bottom, top, rightCoordinate)
creates neon like effect for box drawings
Namespace types: array
Parameters:
gradientBoxes (array) : an array.new() to store the gradient boxes
idColor (color)
timeStart (int) : left point of box
bottom (float) : bottom of box price point
top (float) : top of box price point
rightCoordinate (int) : right point of box
Returns: void
checkIfTraded(tradeName)
checks if recent trade is of specific name
Parameters:
tradeName (string)
Returns: bool true if recent trade id matches target name, false otherwise
checkIfClosed(tradeName)
checks if recent closed trade is of specific name
Parameters:
tradeName (string)
Returns: bool true if recent closed trade id matches target name, false otherwise
IQZZ(atrMult, finalTF)
custom ZZ to quickly determine market direction.
Parameters:
atrMult (float) : an atr multiplier used to determine the required price move for a ZZ direction change
finalTF (string) : the timeframe used for the atr calcuation
Returns: dir market direction. Up => 1, down => -1
method drawBos(id, startPoint, getKeyPointTime, getKeyPointPrice, col, showBOS, isUp)
calculates and draws Break Of Structure
Namespace types: array
Parameters:
id (array)
startPoint (chart.point)
getKeyPointTime (int) : the actual time of startPoint, simplystartPoint.time
getKeyPointPrice (float) : the actual time of startPoint, simplystartPoint.price
col (color) : color of the BoS line / label
showBOS (bool) : whether to show label/line. This function still calculates internally for other ICT related concepts even if not drawn.
isUp (bool) : whether BoS happened during price increase or price decrease.
Returns: void
method drawMSS(id, startPoint, getKeyPointTime, getKeyPointPrice, col, showMSS, isUp, upRejections, dnRejections, highArr, lowArr, timeArr, closeArr, openArr, atrTFarr, upRejectionsPrices, dnRejectionsPrices)
calculates and draws Market Structure Shift. This data is also used to calculate Rejection Blocks.
Namespace types: array
Parameters:
id (array)
startPoint (chart.point)
getKeyPointTime (int) : the actual time of startPoint, simplystartPoint.time
getKeyPointPrice (float) : the actual time of startPoint, simplystartPoint.price
col (color) : color of the MSS line / label
showMSS (bool) : whether to show label/line. This function still calculates internally for other ICT related concepts even if not drawn.
isUp (bool) : whether MSS happened during price increase or price decrease.
upRejections (array)
dnRejections (array)
highArr (array) : array containing historical highs, should be taken from the UDT "necessaryData" defined above
lowArr (array) : array containing historical lows, should be taken from the UDT "necessaryData" defined above
timeArr (array) : array containing historical times, should be taken from the UDT "necessaryData" defined above
closeArr (array) : array containing historical closes, should be taken from the UDT "necessaryData" defined above
openArr (array) : array containing historical opens, should be taken from the UDT "necessaryData" defined above
atrTFarr (array) : array containing historical atr values (of user-selected TF), should be taken from the UDT "necessaryData" defined above
upRejectionsPrices (array) : array containing up rejections prices. Is sorted and used to determine selective looping for invalidations.
dnRejectionsPrices (array) : array containing down rejections prices. Is sorted and used to determine selective looping for invalidations.
Returns: void
method getTime(id, compare, timeArr)
gets time of inputted price (compare) in an array of data
this is useful when the user-selected timeframe for ICT concepts is greater than the chart's timeframe
Namespace types: array
Parameters:
id (array) : the array of data to search through, to find which index has the same value as "compare"
compare (float) : the target data point to find in the array
timeArr (array) : array of historical times
Returns: the time that the data point in the array was recorded
method OB(id, highArr, signArr, lowArr, timeArr, sign)
store bullish orderblock data
Namespace types: array
Parameters:
id (array)
highArr (array) : array of historical highs
signArr (array) : array of historical price direction "math.sign(close - open)"
lowArr (array) : array of historical lows
timeArr (array) : array of historical times
sign (int) : orderblock direction, -1 => bullish, 1 => bearish
Returns: void
OTEstrat(OTEstart, future, closeArr, highArr, lowArr, timeArr, longOTEPT, longOTESL, longOTElevel, shortOTEPT, shortOTESL, shortOTElevel, structureDirection, oteLongs, atrTF, oteShorts)
executes the OTE strategy
Parameters:
OTEstart (chart.point)
future (int) : future time point for drawings
closeArr (array) : array of historical closes
highArr (array) : array of historical highs
lowArr (array) : array of historical lows
timeArr (array) : array of historical times
longOTEPT (string) : user-selected long OTE profit target, please create an input.string() for this using the example below
longOTESL (int) : user-selected long OTE stop loss, please create an input.string() for this using the example below
longOTElevel (float) : long entry price of selected retracement ratio for OTE
shortOTEPT (string) : user-selected short OTE profit target, please create an input.string() for this using the example below
shortOTESL (int) : user-selected short OTE stop loss, please create an input.string() for this using the example below
shortOTElevel (float) : short entry price of selected retracement ratio for OTE
structureDirection (string) : current market structure direction, this should be "Up" or "Down". This is used to cancel pending orders if market structure changes
oteLongs (bool) : input.bool() for whether OTE longs can be executed
atrTF (float) : atr of the user-seleceted TF
oteShorts (bool) : input.bool() for whether OTE shorts can be executed
@exampleInputs
oteLongs = input.bool(defval = false, title = "OTE Longs", group = "Optimal Trade Entry")
longOTElevel = input.float(defval = 0.79, title = "Long Entry Retracement Level", options = , group = "Optimal Trade Entry")
longOTEPT = input.string(defval = "-0.5", title = "Long TP", options = , group = "Optimal Trade Entry")
longOTESL = input.int(defval = 0, title = "How Many Ticks Below Swing Low For Stop Loss", group = "Optimal Trade Entry")
oteShorts = input.bool(defval = false, title = "OTE Shorts", group = "Optimal Trade Entry")
shortOTElevel = input.float(defval = 0.79, title = "Short Entry Retracement Level", options = , group = "Optimal Trade Entry")
shortOTEPT = input.string(defval = "-0.5", title = "Short TP", options = , group = "Optimal Trade Entry")
shortOTESL = input.int(defval = 0, title = "How Many Ticks Above Swing Low For Stop Loss", group = "Optimal Trade Entry")
Returns: void (0)
displacement(logZ, atrTFreg, highArr, timeArr, lowArr, upDispShow, dnDispShow, masterCoords, labelLevels, dispUpcol, rightCoordinate, dispDncol, noBorders)
calculates and draws dispacements
Parameters:
logZ (float) : log return of current price, used to determine a "significant price move" for a displacement
atrTFreg (float) : atr of user-seleceted timeframe
highArr (array) : array of historical highs
timeArr (array) : array of historical times
lowArr (array) : array of historical lows
upDispShow (int) : amount of historical upside displacements to show
dnDispShow (int) : amount of historical downside displacements to show
masterCoords (map) : a map to push the most recent displacement prices into, useful for having key levels in one data structure
labelLevels (string) : used to determine label placement for the displacement, can be inside box, outside box, or none, example below
dispUpcol (color) : upside displacement color
rightCoordinate (int) : future time for displacement drawing, best is "last_bar_time"
dispDncol (color) : downside displacement color
noBorders (bool) : input.bool() to remove box borders, example below
@exampleInputs
labelLevels = input.string(defval = "Inside" , title = "Box Label Placement", options = )
noBorders = input.bool(defval = false, title = "No Borders On Levels")
Returns: void
method getStrongLow(id, startIndex, timeArr, lowArr, strongLowPoints)
unshift strong low data to array id
Namespace types: array
Parameters:
id (array)
startIndex (int) : the starting index for the timeArr array of the UDT "necessaryData".
this point should start from at least 1 pivot prior to find the low before an upside BoS
timeArr (array) : array of historical times
lowArr (array) : array of historical lows
strongLowPoints (array) : array of strong low prices. Used to retrieve highest strong low price and see if need for
removal of invalidated strong lows
Returns: void
method getStrongHigh(id, startIndex, timeArr, highArr, strongHighPoints)
unshift strong high data to array id
Namespace types: array
Parameters:
id (array)
startIndex (int) : the starting index for the timeArr array of the UDT "necessaryData".
this point should start from at least 1 pivot prior to find the high before a downside BoS
timeArr (array) : array of historical times
highArr (array) : array of historical highs
strongHighPoints (array)
Returns: void
equalLevels(highArr, lowArr, timeArr, rightCoordinate, equalHighsCol, equalLowsCol, liteMode)
used to calculate recent equal highs or equal lows
Parameters:
highArr (array) : array of historical highs
lowArr (array) : array of historical lows
timeArr (array) : array of historical times
rightCoordinate (int) : a future time (right for boxes, x2 for lines)
equalHighsCol (color) : user-selected color for equal highs drawings
equalLowsCol (color) : user-selected color for equal lows drawings
liteMode (bool) : optional for a lite mode version of an ICT strategy. For more control over drawings leave as "True", "False" will apply neon effects
Returns: void
quickTime(timeString)
used to quickly determine if a user-inputted time range is currently active in NYT time
Parameters:
timeString (string) : a time range
Returns: true if session is active, false if session is inactive
macros(showMacros, noBorders)
used to calculate and draw session macros
Parameters:
showMacros (bool) : an input.bool() or simple bool to determine whether to activate the function
noBorders (bool) : an input.bool() to determine whether the box anchored to the session should have borders
Returns: void
po3(tf, left, right, show)
use to calculate HTF po3 candle
@tip only call this function on "barstate.islast"
Parameters:
tf (simple string)
left (int) : the left point of the candle, calculated as bar_index + left,
right (int) : :the right point of the candle, calculated as bar_index + right,
show (bool) : input.bool() whether to show the po3 candle or not
Returns: void
silverBullet(silverBulletStratLong, silverBulletStratShort, future, userTF, H, L, H2, L2, noBorders, silverBulletLongTP, historicalPoints, historicalData, silverBulletLongSL, silverBulletShortTP, silverBulletShortSL)
used to execute the Silver Bullet Strategy
Parameters:
silverBulletStratLong (simple bool)
silverBulletStratShort (simple bool)
future (int) : a future time, used for drawings, example "last_bar_time"
userTF (simple int)
H (float) : the high price of the user-selected TF
L (float) : the low price of the user-selected TF
H2 (float) : the high price of the user-selected TF
L2 (float) : the low price of the user-selected TF
noBorders (bool) : an input.bool() used to remove the borders from box drawings
silverBulletLongTP (series silverBulletLevels)
historicalPoints (array)
historicalData (necessaryData)
silverBulletLongSL (series silverBulletLevels)
silverBulletShortTP (series silverBulletLevels)
silverBulletShortSL (series silverBulletLevels)
Returns: void
method invalidFVGcheck(FVGarr, upFVGpricesSorted, dnFVGpricesSorted)
check if existing FVGs are still valid
Namespace types: array
Parameters:
FVGarr (array)
upFVGpricesSorted (array) : an array of bullish FVG prices, used to selective search through FVG array to remove invalidated levels
dnFVGpricesSorted (array) : an array of bearish FVG prices, used to selective search through FVG array to remove invalidated levels
Returns: void (0)
method drawFVG(counter, FVGshow, FVGname, FVGcol, data, masterCoords, labelLevels, borderTransp, liteMode, rightCoordinate)
draws FVGs on last bar
Namespace types: map
Parameters:
counter (map) : a counter, as map, keeping count of the number of FVGs drawn, makes sure that there aren't more FVGs drawn
than int FVGshow
FVGshow (int) : the number of FVGs to show. There should be a bullish FVG show and bearish FVG show. This function "drawFVG" is used separately
for bearish FVG and bullish FVG.
FVGname (string) : the name of the FVG, "FVG Up" or "FVG Down"
FVGcol (color) : desired FVG color
data (FVG)
masterCoords (map) : a map containing the names and price points of key levels. Used to define price ranges.
labelLevels (string) : an input.string with options "Inside", "Outside", "Remove". Determines whether FVG labels should be inside box, outside,
or na.
borderTransp (int)
liteMode (bool)
rightCoordinate (int) : the right coordinate of any drawings. Must be a time point.
Returns: void
invalidBlockCheck(bullishOBbox, bearishOBbox, userTF)
check if existing order blocks are still valid
Parameters:
bullishOBbox (array) : an array declared using the UDT orderBlock that contains bullish order block related data
bearishOBbox (array) : an array declared using the UDT orderBlock that contains bearish order block related data
userTF (simple int)
Returns: void (0)
method lastBarRejections(id, rejectionColor, idShow, rejectionString, labelLevels, borderTransp, liteMode, rightCoordinate, masterCoords)
draws rejectionBlocks on last bar
Namespace types: array
Parameters:
id (array) : the array, an array of rejection block data declared using the UDT rejection block
rejectionColor (color) : the desired color of the rejection box
idShow (int)
rejectionString (string) : the desired name of the rejection blocks
labelLevels (string) : an input.string() to determine if labels for the block should be inside the box, outside, or none.
borderTransp (int)
liteMode (bool) : an input.bool(). True = neon effect, false = no neon.
rightCoordinate (int) : atime for the right coordinate of the box
masterCoords (map) : a map that stores the price of key levels and assigns them a name, used to determine price ranges
Returns: void
method OBdraw(id, OBshow, BBshow, OBcol, BBcol, bullishString, bearishString, isBullish, labelLevels, borderTransp, liteMode, rightCoordinate, masterCoords)
draws orderblocks and breaker blocks for data stored in UDT array()
Namespace types: array
Parameters:
id (array) : the array, an array of order block data declared using the UDT orderblock
OBshow (int) : the number of order blocks to show
BBshow (int) : the number of breaker blocks to show
OBcol (color) : color of order blocks
BBcol (color) : color of breaker blocks
bullishString (string) : the title of bullish blocks, which is a regular bullish orderblock or a bearish orderblock that's converted to breakerblock
bearishString (string) : the title of bearish blocks, which is a regular bearish orderblock or a bullish orderblock that's converted to breakerblock
isBullish (bool) : whether the array contains bullish orderblocks or bearish orderblocks. If bullish orderblocks,
the array will naturally contain bearish BB, and if bearish OB, the array will naturally contain bullish BB
labelLevels (string) : an input.string() to determine if labels for the block should be inside the box, outside, or none.
borderTransp (int)
liteMode (bool) : an input.bool(). True = neon effect, false = no neon.
rightCoordinate (int) : atime for the right coordinate of the box
masterCoords (map) : a map that stores the price of key levels and assigns them a name, used to determine price ranges
Returns: void
FVG
UDT for FVG calcualtions
Fields:
H (series float) : high price of user-selected timeframe
L (series float) : low price of user-selected timeframe
direction (series string) : FVG direction => "Up" or "Down"
T (series int) : => time of bar on user-selected timeframe where FVG was created
fvgLabel (series label) : optional label for FVG
fvgLineTop (series line) : optional line for top of FVG
fvgLineBot (series line) : optional line for bottom of FVG
fvgBox (series box) : optional box for FVG
labelLine
quickly pair a line and label together as UDT
Fields:
lin (series line) : Line you wish to pair with label
lab (series label) : Label you wish to pair with line
orderBlock
UDT for order block calculations
Fields:
orderBlockData (array) : array containing order block x and y points
orderBlockBox (series box) : optional order block box
vioCount (series int) : = 0 violation count of the order block. 0 = Order Block, 1 = Breaker Block
traded (series bool)
status (series string) : = "OB" status == "OB" => Level is order block. status == "BB" => Level is breaker block.
orderBlockLab (series label) : options label for the order block / breaker block.
strongPoints
UDT for strong highs and strong lows
Fields:
price (series float) : price of the strong high or strong low
timeAtprice (series int) : time of the strong high or strong low
strongPointLabel (series label) : optional label for strong point
strongPointLine (series line) : optional line for strong point
overlayLine (series line) : optional lines for strong point to enhance visibility
overlayLine2 (series line) : optional lines for strong point to enhance visibility
displacement
UDT for dispacements
Fields:
highPrice (series float) : high price of displacement
lowPrice (series float) : low price of displacement
timeAtPrice (series int) : time of bar where displacement occurred
displacementBox (series box) : optional box to draw displacement
displacementLab (series label) : optional label for displacement
po3data
UDT for po3 calculations
Fields:
dHigh (series float) : higher timeframe high price
dLow (series float) : higher timeframe low price
dOpen (series float) : higher timeframe open price
dClose (series float) : higher timeframe close price
po3box (series box) : box to draw po3 candle body
po3line (array) : line array to draw po3 wicks
po3Labels (array) : label array to label price points of po3 candle
macros
UDT for session macros
Fields:
sessions (array) : Array of sessions, you can populate this array using the "quickTime" function located above "export macros".
prices (matrix) : Matrix of session data -> open, high, low, close, time
sessionTimes (array) : Array of session names. Pairs with array sessions.
sessionLines (matrix) : Optional array for sesion drawings.
OTEtimes
UDT for data storage and drawings associated with OTE strategy
Fields:
upTimes (array) : time of highest point before trade is taken
dnTimes (array) : time of lowest point before trade is taken
tpLineLong (series line) : line to mark tp level long
tpLabelLong (series label) : label to mark tp level long
slLineLong (series line) : line to mark sl level long
slLabelLong (series label) : label to mark sl level long
tpLineShort (series line) : line to mark tp level short
tpLabelShort (series label) : label to mark tp level short
slLineShort (series line) : line to mark sl level short
slLabelShort (series label) : label to mark sl level short
sweeps
UDT for data storage and drawings associated with liquidity sweeps
Fields:
upSweeps (matrix) : matrix containing liquidity sweep price points and time points for up sweeps
dnSweeps (matrix) : matrix containing liquidity sweep price points and time points for down sweeps
upSweepDrawings (array) : optional up sweep box array. Pair the size of this array with the rows or columns,
dnSweepDrawings (array) : optional up sweep box array. Pair the size of this array with the rows or columns,
raidExitDrawings
UDT for drawings associated with the Liquidity Raid Strategy
Fields:
tpLine (series line) : tp line for the liquidity raid entry
tpLabel (series label) : tp label for the liquidity raid entry
slLine (series line) : sl line for the liquidity raid entry
slLabel (series label) : sl label for the liquidity raid entry
m2022
UDT for data storage and drawings associated with the Model 2022 Strategy
Fields:
mTime (series int) : time of the FVG where entry limit order is placed
mIndex (series int) : array index of FVG where entry limit order is placed. This requires an array of FVG data, which is defined above.
mEntryDistance (series float) : the distance of the FVG to the 50% range. M2022 looks for the fvg closest to 50% mark of range.
mEntry (series float) : the entry price for the most eligible fvg
fvgHigh (series float) : the high point of the eligible fvg
fvgLow (series float) : the low point of the eligible fvg
longFVGentryBox (series box) : long FVG box, used to draw the eligible FVG
shortFVGentryBox (series box) : short FVG box, used to draw the eligible FVG
line50P (series line) : line used to mark 50% of the range
line100P (series line) : line used to mark 100% (top) of the range
line0P (series line) : line used to mark 0% (bottom) of the range
label50P (series label) : label used to mark 50% of the range
label100P (series label) : label used to mark 100% (top) of the range
label0P (series label) : label used to mark 0% (bottom) of the range
sweepData (array)
silverBullet
UDT for data storage and drawings associated with the Silver Bullet Strategy
Fields:
session (series bool)
sessionStr (series string) : name of the session for silver bullet
sessionBias (series string)
sessionHigh (series float) : = high high of session // use math.max(silverBullet.sessionHigh, high)
sessionLow (series float) : = low low of session // use math.min(silverBullet.sessionLow, low)
sessionFVG (series float) : if applicable, the FVG created during the session
sessionFVGdraw (series box) : if applicable, draw the FVG created during the session
traded (series bool)
tp (series float) : tp of trade entered at the session FVG
sl (series float) : sl of trade entered at the session FVG
sessionDraw (series box) : optional draw session with box
sessionDrawLabel (series label) : optional label session with label
silverBulletDrawings
UDT for trade exit drawings associated with the Silver Bullet Strategy
Fields:
tpLine (series line) : tp line drawing for strategy
tpLabel (series label) : tp label drawing for strategy
slLine (series line) : sl line drawing for strategy
slLabel (series label) : sl label drawing for strategy
unicornModel
UDT for data storage and drawings associated with the Unicorn Model Strategy
Fields:
hPoint (chart.point)
hPoint2 (chart.point)
hPoint3 (chart.point)
breakerBlock (series box) : used to draw the breaker block required for the Unicorn Model
FVG (series box) : used to draw the FVG required for the Unicorn model
topBlock (series float) : price of top of breaker block, can be used to detail trade entry
botBlock (series float) : price of bottom of breaker block, can be used to detail trade entry
startBlock (series int) : start time of the breaker block, used to set the "left = " param for the box
includes (array) : used to store the time of the breaker block, or FVG, or the chart point sequence that setup the Unicorn Model.
entry (series float) : // eligible entry price, for longs"math.max(topBlock, FVG.get_top())",
tpLine (series line) : optional line to mark PT
tpLabel (series label) : optional label to mark PT
slLine (series line) : optional line to mark SL
slLabel (series label) : optional label to mark SL
rejectionBlocks
UDT for data storage and drawings associated with rejection blocks
Fields:
rejectionPoint (chart.point)
bodyPrice (series float) : candle body price closest to the rejection point, for "Up" rejections => math.max(open, close),
rejectionBox (series box) : optional box drawing of the rejection block
rejectionLabel (series label) : optional label for the rejection block
equalLevelsDraw
UDT for data storage and drawings associated with equal highs / equal lows
Fields:
connector (series line) : single line placed at the first high or low, y = avgerage of distinguished equal highs/lows
connectorLab (series label) : optional label to be placed at the highs or lows
levels (array) : array containing the equal highs or lows prices
times (array) : array containing the equal highs or lows individual times
startTime (series int) : the time of the first high or low that forms a sequence of equal highs or lows
radiate (array) : options label to "radiate" the label in connector lab. Can be used for anything
necessaryData
UDT for data storage of historical price points.
Fields:
highArr (array) : array containing historical high points
lowArr (array) : array containing historical low points
timeArr (array) : array containing historical time points
logArr (array) : array containing historical log returns
signArr (array) : array containing historical price directions
closeArr (array) : array containing historical close points
binaryTimeArr (array) : array containing historical time points, uses "push" instead of "unshift" to allow for binary search
binaryCloseArr (array) : array containing historical close points, uses "push" instead of "unshift" to allow the correct
binaryOpenArr (array) : array containing historical optn points, uses "push" instead of "unshift" to allow the correct
atrTFarr (array) : array containing historical user-selected TF atr points
openArr (array) : array containing historical open points
