Setting-Less Trend-Step FilteringIntroduction
Indicators settings have been a major concern in trading strategies, in order to provide the best results each indicators involved in the strategy must have its settings optimized, when using only 1 indicator this task can easily be achieved, but an increasing number of indicators involve more slower computations, lot of softwares will use brute force for indicators settings optimization, this involve testing each indicator settings and see which setting/combination maximize the equity, in order to fasten this process softwares can use a user defined range for the indicator settings. Nonetheless the combination that maximize the equity at time t might be different at time t+1...n .
Therefore i propose an indicator without any numerical setting that aim to filter small price variations using the architecture of the T-step lsma, such indicator can provide robust filtering and can therefore be used as input for other indicators.
Robustness Vs Non Robustness
Robustness is often defined as the ability of certain statistical tools to be less affected by outliers, outliers are defined as huge variations in a data-set, high volatility movements and large gaps might be considered as outliers. However here we define robustness as the ability of an indicator to be non affected by price variations that are not correlated with the main trend, which can be defined in technical analysis as pullbacks.
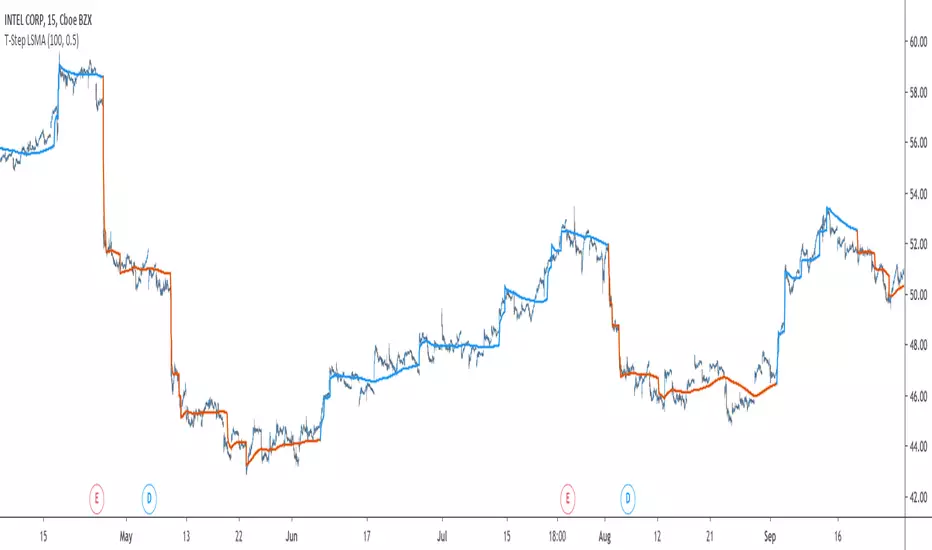
Some small pullbacks in INTEL, the indicator is not affected by them, which allow the indicator to filter the price in a "smart" way.
This effect is made possible by using exponential averaging in the indicator, exponential averaging is defined as y = sc*x + (1-sc)*y , with 1 > sc > 0 . Here sc is calculated in a similar way as the kalman gain, which is in the form of a/(a + b) , in our case this is done with :
sc = abs(input - nz(b ))/(abs(input - nz(b )) + nz(a ))
Non Robust Version Of The Indicator
The user is allowed to use the non robust version of the indicator by unchecking "robust" in the setting panel, this allow a better fit with the price at the cost of less filtering.
robust checked
robust unchecked
Conclusion
I proposed a technical indicator that aim to filter short frequencies without the use of parameters, the indicator proven to be robust to various pullbacks and therefore was able to follow the main trend, although using the term trend for such small price variations might be wrong. Removing high frequencies is always beneficial in trading, noisy series are harder to manipulate, this is why you'll see a lot of indicators using median price often defined as hl2 instead of the closing price.
Like previous settings-less indicators i published this one can behave differently depending on the time frame selected by the user, lower time frames will make the indicator filter more. I'll try to make more setting-less indicators that will correct this effect.
Acknowledgements
The support and interest of the community is only thing that allowed me to be where i'am today, i'am thankful. Special thanks to the tv staff, LucF, and my family who may not have believed in this project but are still proud of their son.
Поиск скриптов по запросу "indicators"

T-Step LSMAIntroduction
The trend step indicator family has produced much interest in the community, those indicators showed in certain cases robustness and reactivity. Their ease of use/interpretation is also a major advantage. Although those indicators have a relatively good fit with the input price, they can still be improved by introducing least-squares fitting on their calculations. This is why i propose a new indicator (T-Step LSMA) which aim to gather all the components of the trend-step indicator family (including the auto-line family).
The indicator will use as a threshold the mean absolute error between the input and the output (T-Channel) scaled with the efficiency ratio (Efficient Trend Step) while using least squares in order to provide a better fit with the price (Auto-Filter).
The Indicator
The interpretation of the indicator is easy, the indicator estimate an up-trending market when in blue, down-trending when in orange, the signal only depend on the trend-step part ( b in the code).
length control the period of the efficiency ratio as well as any components in the lsma calculation. The efficiency ratio allow to provide adaptivity, therefore the threshold will be lower when market is trending and higher when market is ranging.
Sc control the amount of feedback of the indicator, a value of 1 will use only the closing price as input, a value of 0.5 will use 50% of the closing price/indicator output as input, this allow to get smoother results.
It is possible to get the non-smooth version of the indicator by checking "No Smoothing".
This allow the indicator to filter more information.
Least Squares Smoothing - Benefits
One could ask why introducing least squares smoothing, there are several reasons to this choice, we have seen that trend-step indicators are boxy, they filter most of the variational information in the price, introducing least squares smoothing allow to gain back some of this variational information while providing a better fit with the price, the indicator is more noisy but also more practical in certain situations.
For example the indicator in its boxy form can't really be useful as input for other indicators, which is not the case with this version.
Relative strength index of period 14 using the proposed indicator as input.
Down-Sides
The indicator is dependent on the time frame used, larger time frames resulting in an indicator overfitting, sticking with lower time frames might be ideal. The indicator behavior might also change depending on the market in which it is applied.
Setting Up Alerts For The Indicator
Alerts conditions are already set, in order to create an alert based on the indicator follow these steps :
Go to the alert section (the alarm clock) -> create new alert -> select T-Step LSMA in condition -> Below select Up or Dn (Up for a up-trending alert and Dn for a down-trending alert)
In option select "once per bar close", change the message if you want a personalized message.
Conclusion
I don't think i'll post other indicators related to the trend-step framework for the time to comes, nonetheless the ones posted proven to have interesting results as well as many upsides. Although i don't think they would generate positive long-terms returns they could still be of use when using smarter volatility metrics as threshold. The proposed indicator conserve more information than its relatives and might find some use as input for other indicators.
Recommended Use Of The Code
Although i don't put restrictions on the code usage, i still recommend creative and pertinent changes to be made, graphical changes or any minor changes are not necessary, remember that such practice is disrespectful toward the author, you don't want to load up the tradingview servers for nothing right ?
Support Me
Making indicators sure is hard, it takes time and it can be quite lonely to, so i would love talking with you guys while making them :) There isn't better support than the one provided by your friends so drop me a message.
Accumulation/Distribution Percentage (ADP) [Cyrus c|:D]Accumulation/Distribution Percentage ( ADP ) is used to measure money flow similar to Chaikin Money Flow ( CMF ) and Money Flow. It is the range-bound version of my previous indicator ADMF. This indicator can be used for analyzing momentum, buy/sell pressure, and overbought/oversold conditions. I believe that this indicator is more accurate than CMF and MFI (I will publish a TA about it one day!).
What to look for:
- When this indicator moves up, it means buy pressure is increasing and the other way around for sell pressure. Crossing 0 means that trend has changed in the given period (it is best to look for confirmation of buy/sell pressure in larger TFs)
- Overbought above 40 and oversold below -40 (these numbers vary depending on the security. Look for historical levels to determine overbought and oversold conditions of each security)
- Regular divergence shows that momentum of a trend is declining. Hidden divergence implies continuation of a trend. The non-bound mode should be more accurate for identifying divergence.
- Failure swings can detect potential reversals.
Please read Relative Strength Index and Money Flow for more information and similar disclaimers.
Recommendations:
- hlc3 (AKA typical price) as input source might be better than "close" as it captures more information. If you use hlc3 as a source, then change the chart type to line and set hlc3 as the source for identifying divergence.
- Use hybrid tickers e.g.(BITFINEX:BTCUSD+COINBASE:BTCUSD+BITSTAMP:BTCUSD)/3. Volume-based indicators are susceptible to wash trading/volume printing and hybrid tickers mitigate this issue.
- In non-bound mode, small TFs with longer length should be more accurate than larger TFs with standard length (same is true for many other indicators)
Background:
I have developed 4 indicators based on a simple but elegant concept of A/D ratio. A/D ratio is equal to (current close - previous close)/True Range (when there are no price gaps, True Range = High - Low)
1) What you see on ADV indicator as darker green and red is equal to A/D ratio x volume.
2) ADL indicator shows the summation of ADV
3) ADMF (or ADP in non-bound mode) shows Moving Average of ADV
4) ADP shows relative accumulation strength which is calculated as RMA (accumulations)/RMA(accumulation + distribution). ADP equation is based on RSI equation which is RMA(gains)/RMA(gains + losses). That is why these two indicators look quite similar.
PS: Please leave a like if you find these indicators useful. I am working on improvements on these and other indicators. I am trying my best to keep them as simple as possible. Please let me know in the comments if you want me to make future indicators even simpler.
--------
Complementary indicators based on the same concept:
ADL: a replacement for Chaikin's Accum/Dist, On Balance Volume, and Price Volume Trend
ADV: a replacement for regular volume indicator
ADP also has a scaled RSI and ADMF built in (ie ADMF is obsolete).

Inverse Fisher Transform COMBO STO+RSI+CCIv2 by KIVANÇ fr3762A combined 3in1 version of pre shared INVERSE FISHER TRANSFORM indicators on RSI , on STOCHASTIC and on CCIv2 to provide space for 2 more indicators for users...
About John EHLERS:
From California, USA, John is a veteran trader. With 35 years trading experience he has seen it all. John has an engineering background that led to his technical approach to trading ignoring fundamental analysis (with one important exception).
John strongly believes in cycles. He’d rather exit a trade when the cycle ends or a new one starts. He uses the MESA principle to make predictions about cycles in the market and trades one hundred percent automatically.
In the show John reveals:
• What is more appropriate than trading individual stocks
• The one thing he relies upon in his approach to the market
• The detail surrounding his unique trading style
• What important thing underpins the market and gives every trader an edge
About INVERSE FISHER TRANSFORM:
The purpose of technical indicators is to help with your timing decisions to buy or
sell. Hopefully, the signals are clear and unequivocal. However, more often than
not your decision to pull the trigger is accompanied by crossing your fingers.
Even if you have placed only a few trades you know the drill.
In this article I will show you a way to make your oscillator-type indicators make
clear black-or-white indication of the time to buy or sell. I will do this by using the
Inverse Fisher Transform to alter the Probability Distribution Function ( PDF ) of
your indicators. In the past12 I have noted that the PDF of price and indicators do
not have a Gaussian, or Normal, probability distribution. A Gaussian PDF is the
familiar bell-shaped curve where the long “tails” mean that wide deviations from
the mean occur with relatively low probability. The Fisher Transform can be
applied to almost any normalized data set to make the resulting PDF nearly
Gaussian, with the result that the turning points are sharply peaked and easy to
identify. The Fisher Transform is defined by the equation
1)
Whereas the Fisher Transform is expansive, the Inverse Fisher Transform is
compressive. The Inverse Fisher Transform is found by solving equation 1 for x
in terms of y. The Inverse Fisher Transform is:
2)
The transfer response of the Inverse Fisher Transform is shown in Figure 1. If
the input falls between –0.5 and +0.5, the output is nearly the same as the input.
For larger absolute values (say, larger than 2), the output is compressed to be no
larger than unity . The result of using the Inverse Fisher Transform is that the
output has a very high probability of being either +1 or –1. This bipolar
probability distribution makes the Inverse Fisher Transform ideal for generating
an indicator that provides clear buy and sell signals.
Creator: John EHLERS
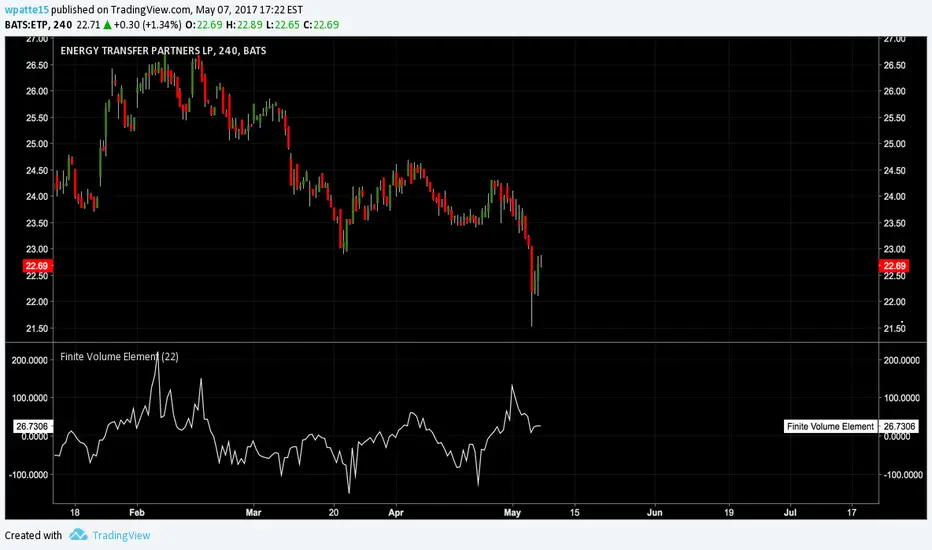
Finite Volume Elementwww.prorealcode.com
From ProRealTime,
"FVE is a money flow indicator but with two important differences from existing money flow indicators:
It resolves contradictions between intraday money flow indicators (such as Chaikin’s money flow) and interday money flow indicators (like On Balance Volume) by taking into account both intra- and interday price action. Unlike other money flow indicators which add or subtract all volume even if the security closed just 1 cent higher than the previous close, FVE uses a volatility threshold to take into account minimal price changes. The FVE provides 3 types of signals: The strongest signal is divergence between price and the indicator. Divergence can provide leading signals of breakouts or warnings of impending corrections. The classic method for detecting divergence is for FVE to make lower highs while price makes higher highs (negative divergence). An alternative method is to draw the linear regression line on both charts, and compare the slopes. A logical buy signal would be for FVE, diverging from price, to rise sharply and make a series higher highs and/or higher lows. The most obvious and coincident signal is the slope of the FVE line. An upward slope indicates that the bulls are in control and the opposite for downward. This is a unique and very important property of this indicator. Values above zero are bullish and indicate accumulation while values below zero indicate distribution. FVE crossing the zero line indicates that the short to intermediate balance of power is changing from the bulls to the bears or vice versa. The best scenario is when a stock is in the process of building a base, and FVE diverges from price and rises to cross the zero line from below, at a sharp angle. Conversely the crossing of the zero line from above is a bearish signal to liquidate positions or initiate a short trade."
Flexible S/R Channels🟩 Flexible S/R Channels is a visualization tool that draws curved support and resistance boundaries through user-defined anchor points. Unlike traditional trendlines and channels that force linear interpretation onto price action, this indicator captures the curved structures that markets frequently form—rounded tops and bottoms, parabolic advances and declines, arcing rallies and pullbacks. Three anchor points per curve define the shape; the indicator fits a smooth mathematical curve through these points and projects it forward. The approach is simple: draw what you see. Curved market structure that resists precise definition with traditional tools can now be rendered with mathematical accuracy.
The indicator bridges the gap between static drawing tools and programmable indicators. TradingView's arc tool draws curves but produces only visual pixels with no analytical value. Flexible S/R Channels creates live data series that integrate with other analysis tools. Four curve-fitting methods—Quadratic, Quadratic-Linear, Weighted Linear, and Natural Cubic Spline—accommodate different market structures. The curved levels naturally lend themselves to breakout and reversion strategies—applications left to the trader's discretion. The open-source code invites experimentation and customization.
💡 THEORY AND CONCEPT 💡
Traders have long relied on horizontal levels and diagonal trendlines to define support and resistance. Linear tools assume constant slope—a property rarely exhibited by actual market movement. When momentum accelerates or decelerates, price trajectories curve rather than hold to fixed angles. The resulting structures—parabolic advances during expansion phases, arcing pullbacks during consolidation, rounded formations at reversal points—represent changes in the rate of change itself. Traditional drawing tools cannot accommodate this variable geometry without sacrificing mathematical precision..
Flexible S/R Channels extends familiar support and resistance concepts into curved space. The approach is simple: draw what you see. When the eye recognizes a curved boundary in price action, this indicator provides the means to define it precisely. Three anchor points per curve—an initial point, an intermediate point, and a recent point—are all that is required. The indicator fits a smooth mathematical curve through these points and extends it forward as a projection.
This indicator represents a blend of human pattern recognition and algorithmic precision. Fully automated indicators make decisions without user input—efficient but detached from trader discretion. Manual drawing tools rely entirely on freehand skill—expressive but imprecise. Flexible S/R Channels occupies the middle ground. The trader identifies the curved structure; the algorithm renders it mathematically. The result is human insight expressed with computational accuracy—for traders who recognize curved structure in price action but lack precise tools to define it.
This projection is not a prediction. It is a visual hypothesis—a structured way of asking "if this trajectory continues, where would price be?" The underlying assumption is simple: like Newton's first law of motion, a trajectory in motion tends to continue unless acted upon by an external force. Future price action validates or invalidates the projection, just as it does with any trendline or channel.
TradingView offers an arc drawing tool for freehand curved lines, but these are purely visual—static pixels on a screen with no programmable value. Flexible S/R Channels bridges this gap. The fitted curves exist as data series that can generate alerts, trigger signals, and interact with other analysis tools. The visual drawing becomes operational structure.
🔁 CURVE METHODS 🔁
The indicator offers four curve-calculation methods, each producing different shapes suited to different market structures:
Quadratic — Fits a parabolic arc through the three anchor points. Best for smooth, continuous curves such as rounded tops and bottoms. It captures the natural "swing" of the market, assuming the momentum will maintain its current rate of acceleration or deceleration.
Quadratic-Linear — Uses a parabolic curve through the anchor points, then transitions to a straight line after the final anchor. Useful when curved structure gives way to linear trend continuation. This is the "bridge" between a turning market and a steady, directed move, preventing the projection from curving back on itself when the price begins to run.
Weighted Linear — Connects anchor points with straight line segments rather than a smooth curve. Suited for angular market structures with distinct inflection points. It treats the market as a series of rigid shifts, providing a clear "corridor" when the price is bouncing between sharp, diagonal levels.
Natural Cubic Spline — Produces the smoothest curve by minimizing abrupt directional changes. Ideal for organic, flowing market movements. It acts as a flexible spine that adapts to complex transitions without the rigid constraints of a fixed geometric shape.
Quadratic Fitting : A smooth, parabolic arc defines a curved resistance boundary. By fitting a mathematical path through three anchor points, the curve captures rounded structures and arcing price action that traditional linear trendlines fail to represent.
Weighted Linear Fitting : This method produces an angular, segmented path by connecting anchor points with distinct linear slopes. Unlike the continuous smoothness of a quadratic arc, the weighted linear approach creates a more jointed geometry, allowing for a precise match to market structures that exhibit sharp, localized changes in trajectory.
Natural Cubic Spline Fitting : This method creates a highly fluid, elastic curve that can accommodate complex price oscillations. In this instance, the curves define a narrowing range as support and resistance converge, highlighting the volatility compression that often precedes a significant breakout or breakdown from established structures.
🖱️ HOW IT WORKS 🖱️
1️⃣ Initial Setup
Unlike traditional indicators that calculate values automatically from price data, Flexible S/R Channels requires user-defined anchor points. This is intentional. The trader's eye is the pattern recognition engine—no algorithm can see the curved structure that experience and intuition reveal. The indicator waits for this input, then applies mathematical precision to render what the trader has identified.
The Recognition of Natural Structure : Effective analysis begins when a curved rhythm becomes visible within price action that traditional trendlines cannot satisfy. Identifying the specific swing highs and swing lows that define these boundaries is the first step in organizing a chart. By isolating three key pivots for resistance and three for support, the underlying framework of the market's trajectory is established, providing the necessary coordinates to accurately map the path.
Interactive Setup Workflow : Upon loading, the indicator prompts for the sequential selection of six points—three swing highs and three swing lows—to serve as the raw data for the calculation. While the chart remains blank during this initial phase, the curves generate instantly once the final anchor is confirmed. These points are not permanent; they appear as interactive grips that can be dragged in real time to refine the boundaries as the market structure evolves.
The indicator prompts for six sequential selections—three for resistance, three for support. The first three selections define the resistance boundary; the final three define support. This sequential grouping is distinct from zigzag-style selection patterns. Within each group, clicking order is flexible—the algorithm automatically sorts points chronologically, allowing traders to select visually prominent pivots in whatever sequence feels natural.
Structural Anchor Identification : Identifying three key swing highs and three key swing lows provides the foundation for the dual-curve geometry. These specific structural peaks and troughs serve as the coordinates for the mathematical models, ensuring that the resulting boundaries accurately reflect the underlying skeleton of the market action.
2️⃣ Interactive Adjustment
After the initial setup, all six anchor points are fully adjustable:
Points are automatically sorted chronologically regardless of selection order
Grip handles appear at each anchor location
Any point can be repositioned by clicking and dragging its grip handle
The curves recalculate instantly as points are adjusted
The algorithm produces a mathematically perfect curve based on the anchor points provided. If the result does not match the trader's vision, adjustments are immediate. This iterative refinement—see, adjust, refine—continues until the rendered curve represents what the trader sees in the price action. The user remains in control; the algorithm remains in service.
Interactive Channel Boundaries : Six user-defined anchor points—three for resistance and three for support —establish a non-linear range that moves beyond the constraints of a flat, horizontal channel. This configuration captures the arcing trajectory of the market while showing price action respecting the curved boundaries in a classic reversion pattern. By manually positioning these anchors, a dynamic dimension is added to the chart that maintains structural integrity even as the price follows a rounded path.
🛠️ SETTINGS 🛠️
Customizable Visual Feedback : Beyond the core geometry, the visualization offers various user-defined settings to tailor the chart's information density. From identifying specific price targets to toggling structural labels, these options allow the trader to adjust the level of detail to suit their personal analysis style while maintaining a clear view of the non-linear boundaries.
Configuration Options
Curve Method — Select the curve-fitting algorithm: Quadratic, Quadratic-Linear, Weighted Linear, or Natural Cubic Spline.
Projection Length — Number of bars to project the curves beyond current price action. Projections appear as dashed lines.
Visual Settings
Grip Size — Size of the draggable handles displayed at each anchor point. Set to zero to hide grips entirely.
Line Width — Thickness of the support and resistance curves.
Support Color / Resistance Color — Color settings for each curve.
Show Info Table — Toggle display of the info table showing the current curve method in the chart corner.
Advanced: Time/Price Coordinates
The settings panel includes precise time and price values for each of the six anchor points, grouped under Resistance Time/Price and Support Time/Price. These values are populated automatically when points are selected on the chart.
Adjusting anchor points by dragging the grip handles directly on the chart is faster and more intuitive. The time/price fields are available for situations requiring exact coordinate entry—such as aligning an anchor to a specific candle timestamp or a precise price level. These fields can be safely ignored unless fine-tuning is necessary.
🖼️ CHART EXAMPLES 🖼️
The Flexible S/R Channels indicator adapts to diverse market structures across multiple timeframes and instruments. Curved boundaries can define subtle momentum shifts in near-linear trends, dramatic reversals in rounding formations, or volatility compression as channels converge toward breakout points. The four curve-fitting methods accommodate different geometries—smooth parabolic arcs for continuous momentum changes, segmented linear paths for angular structures, and elastic splines for complex oscillations. Each anchor point adjustment instantly recalculates the curves, allowing iterative refinement until the rendered boundaries align with the trader's interpretation of market structure. Forward projections extend these mathematical relationships into future territory, providing visual context for hypothetical support and resistance levels if current trajectories persist.
Subtle Curve Alignment : Even in structures that appear linear, subtle curvature allows the channel boundaries to breathe with the market’s internal momentum. By utilizing three anchor points rather than two, the channel adapts to the slight acceleration of a trend, providing a more precise fit than a rigid, straight corridor.
Decelerating Momentum and Convergence : This classic rounding structure illustrates a transition where the initial wide oscillations between highs and lows begin to contract. As the boundaries converge, the curve captures the diminishing volatility and the shift in market energy, providing a clear visual representation of a trend losing its expansive momentum as it approaches a potential turning point.
Organic Trend Modeling : In an accelerating uptrend, the Natural Cubic Spline provides a highly adaptable boundary that mirrors the organic flow of momentum. This non-traditional approach allows the channel to follow complex price pulses that a standard linear trendline would likely cut through, maintaining a precise fit even as the angle of the trend shifts over time.
Non-Linear Projections : Unlike standard trendlines that converge at a fixed rate, curved projections adapt to the historical momentum of the move. This allows the indicator to map a dynamic squeeze, capturing the subtle nuances of how price action tightens toward an apex. It provides a more sophisticated view of future convergence points that traditional linear channels often fail to anticipate.
The "Draw What You See" Philosophy : Market structures are rarely perfect, and this example highlights the indicator’s ability to map unconventional rhythms. Rather than forcing price into a predefined category, the tool remains flexible enough to define any structural path the trader identifies. If you can see a trend's trajectory, the indicator can provide the mathematical framework to support it.
Comparative Projection Modeling : Using identical anchor points as above, this example demonstrates how selecting a different calculation method can alter the projected path. While the historical fit remains precise, the variation in the forward-looking trajectory allows traders to explore multiple mathematical interpretations of the same market structure, choosing the model that best aligns with the current volatility and trend behavior.
Extended Timeframe Channel Definition : This multi-year perspective demonstrates the indicator's ability to define curved channel boundaries across extended timeframes spanning hundreds of bars and multiple market cycles. The resistance curve captures the rounded distribution of swing highs while the support curve follows the accelerating base formation, creating a non-linear channel that frames long-term structural trends more precisely than traditional parallel channels or static trendlines.
Rounding Bottom Reversal and Channel Convergence : This example captures a classic rounding bottom formation—a reversal pattern that linear tools cannot adequately define. The Quadratic method produces a smooth parabolic arc through the resistance anchors, tracing the deceleration of the downtrend, the capitulation low, and the subsequent re-acceleration upward as a single continuous curve. The support boundary mirrors this momentum shift from below, creating a curved channel that narrows toward current price. This convergence represents structural compression—the boundaries tightening as volatility contracts and directional resolution approaches. Price action oscillates within these non-linear boundaries, demonstrating that channel behavior persists even when the geometry is curved rather than parallel. The projection extends both curves forward, mapping the hypothetical trajectory if the current momentum structure continues, providing visual context for potential breakout or breakdown levels as the channel reaches its apex.
Built-in Precision vs. Algorithmic Power : While TradingView offers basic curve drawing tools (shown here as dashed lines), the Flexible S/R Channels indicator elevates this concept into a functional analytical framework. By converting manual observations into mathematical models, it moves beyond mere drawing to provide a data-driven structure that can be utilized for advanced technical analysis and future Pine Script trading logic.
⚙️ TECHNICAL DETAILS ⚙️
Curve Fitting vs. Overfitting: The term curve fitting often carries negative connotations in quantitative analysis due to its association with overfitting—the practice of adjusting a model until it perfectly matches historical data, producing an illusion of accuracy that fails when applied to new data. The application here is fundamentally different. Flexible S/R Channels does not optimize parameters to maximize historical fit; it constructs a mathematical curve through user-selected anchor points, then projects that curve into unknown territory. The curve is not fitted to price data—it is fitted to structural pivots identified by the trader. The projection represents a hypothesis about trajectory continuation, not a prediction derived from statistical optimization. Future price action validates or invalidates this hypothesis in real time, exactly as it does with any trendline or channel. The anchor points remain fixed unless manually adjusted, ensuring the curve does not adapt to new data retroactively.
Non-Repainting Behavior: The indicator does not repaint historical bars. The mathematical coefficients that define each curve are calculated once—when the final anchor point is set—and stored as fixed values. These coefficients remain constant unless an anchor point is manually repositioned. The backfit polyline is drawn once using these coefficients, spanning the known range from the first to last anchor point. The plot() function applies the same coefficients to each subsequent bar, updating in real-time as new bars form but never altering previously plotted values. The projection polyline extends forward from the current bar using the same fixed coefficients, projecting a user-defined number of future bars (maximum 500). This projection redraws on each tick to maintain its position relative to the moving current bar, but the mathematical trajectory remains constant—only the starting point advances. The current bar's curve value will update tick-by-tick as price develops, which is standard real-time behavior, not repainting. Once a bar closes, all curve values on that bar are permanent. The hybrid architecture (backfit polyline for known history, plot() for unlimited real-time range, projection polyline for controlled forward extension) prevents overflow errors while maintaining non-repainting integrity across all components.
🗒️ NOTES 🗒️
The indicator renders curves based on any anchor points provided without validation. Unusual anchor placement produces mathematically accurate but potentially non-useful results. Adjustment is iterative—if the curve doesn't match expectations, reposition the anchors.
Because anchor points are stored as specific time and price coordinates, a new instance of the indicator should be added when analyzing a different chart or timeframe.
Grip handles can be hidden by setting Grip Size to zero in the settings. This is useful for clean chart screenshots or presentations where interactive elements are not needed.
Projection length can be set to zero if forward-looking curves are not desired. The indicator will still render the backfit curves through the anchor points and continue plotting in real-time without the dotted projection extensions.
Anchor points remain fixed at their selected time-price coordinates as new bars form. The curves extend forward automatically from these historical anchors, allowing observation of how projected trajectories align with developing price action.
⚠️ DISCLAIMER ⚠️
The Flexible S/R Channels indicator is a visual analysis tool designed to illustrate geometric market inertia and serve as a framework for understanding dynamic support and resistance. While the indicator generates structural channels and projected paths, no guarantee is made regarding the accuracy or profitability of these projections. Like all technical indicators, the curves and boundaries generated by this tool may appear to align with favorable trading opportunities in hindsight. However, these visualizations are not intended as standalone recommendations for trading decisions. This indicator is intended for educational and analytical purposes, complementing other tools and methods of market analysis.
🧠 BEYOND THE CODE 🧠
Flexible S/R Channels is part of a broader collection of tools designed to provide structured market analysis. This includes the Grid Bot Simulator , the Grid Bot Auto , the Grid Bot Parabolic , and the Gridbot Ping Pong . While each tool serves a distinct purpose, they all utilize dynamic anchor mechanics and non-linear boundaries to adapt to evolving market conditions.
This indicator shares the same educational philosophy as the Fibonacci Time-Price Zones and the Fibonacci Geometry Series - providing frameworks for understanding market concepts through visualization and experimentation rather than black-box signals.
The Flexible S/R Channels indicator, like other xxattaxx indicators , is designed to encourage both education and community engagement. Feedback and insights are invaluable to refining and enhancing this tool. We look forward to the creative applications, observations, and discussions this indicator inspires within the trading community.

Linear Regression Market State IndexStandard Deviation Market Structure Indicator
A Comprehensive Multi-Timeframe Market Analysis Tool
🎯 Overview
The Standard Deviation Market Structure (SDMS) indicator is a sophisticated technical analysis tool that integrates multiple proven methodologies to identify market structure, trend direction, and potential reversal zones. By combining price action, statistical analysis, and momentum indicators across multiple timeframes, SDMS provides traders with a comprehensive view of market dynamics.
✨ Key Features
Multi-Timeframe Integration
Primary analysis on current timeframe
1-hour statistical confirmation for support/resistance levels
Order block extension across 500 future bars
Comprehensive Technical Suite
RSI with Deviation Analysis
Dynamic Order Block Detection
Gaussian Filter Channels
Linear Regression with Statistical Bands
Standard deviation to detect price outliers
Directional Movement Index (DMI/ADX)
Bollinger Band % Analysis
Support/Resistance Line System
Visual Clarity
Color-coded signals and zones
Automatic level management
Clean, intuitive display
📊 Core Components Explained
1. Order Block System
What Are Order Blocks?
Order blocks are price zones where institutional activity has occurred, creating future support or resistance levels. SDMS automatically detects these critical zones.
Detection Logic:
Bullish Order Blocks: Form when price breaks above recent highs following bearish candles
Bearish Order Blocks: Form when price breaks below recent lows following bullish candles
Visual Identification:
Green boxes with "BuOB" labels (support zones)
Red boxes with "BeOB" labels (resistance zones)
Each block shows its boundary price for easy reference
Dynamic Management:
Automatically extends 300 bars into the future
Self-cleaning: removes blocks when price breaches their boundaries
Real-time adjustment to changing market structure
2. Statistical Support/Resistance System
How It Works:
SDMS creates support and resistance lines based on statistical extremes confirmed on the 1-hour timeframe.
Trigger Conditions:
Support Lines (Green): Trigger when 1H Bollinger Band % crosses above 0 and bearish momentum subsides.
Resistance Lines (Red): Trigger when 1H Bollinger Band % crosses below 1 and bullish momentum subsides
The Science Behind BB%:
BB% = (Price - Lower Band) / (Upper Band - Lower Band)
BB% <= 0: Price at statistical oversold extreme; also indicated by white candles.
BB% > 1: Price at statistical overbought extreme; also indicated by white candles.
Line Management:
Maximum of 15 active lines
Oldest lines automatically removed
Lines extend across chart for ongoing reference
3. Trend Analysis Suite
Hull Moving Average (HMA):
55-period smoothed trend indicator
Color-coded: Green = bullish, Red = bearish
Visual band shows trend acceleration/deceleration
Gaussian Channel:
Advanced filtering of market noise
Dynamic channel based on true range volatility
Helps identify mean reversion opportunities
Form a yellow band when price is overbought or oversold zones.
Linear Regression System:
Statistical price modeling
Multiple standard deviation bands (up to 3SD)
Regression-based candlestick visualization
Candles turn white when in overbought zones. Yellow candles indicate extremely overbought zones. Blue candles indicate a bullish trend with high volume.
Bearish candles are bluish-purple when volume is high and red when the volume is within normal ranges or low.
4. Momentum & Oscillator Integration
RSI with Deviation Tracking:
21-period RSI with 30-period smoothing
Tracks deviation from moving average based off linear regression
Identifies momentum divergences
Directional Movement Index:
Multi-period DMI/ADX analysis
Used to detect overbought and oversold zones within the indicator calculations.
Combines with RSI for enhanced signals
Momentum confirmation for all entries/exits
🎯 Trading Signals & Alerts
Buy Signals (Yellow "Buy" Labels)
Multi-Condition Confirmation Required:
RSI Oversold Reversal: RSI crosses above 30
Trend Alignment: HMA showing bullish structure
Momentum Confirmation: DMI alignment
Statistical Support: Price at or near support zones
Risk Management: Multiple confirming indicators
Strong Buy Conditions:
Confluence of order block support + BB% support line
Multiple timeframe alignment
Volume confirmation at key levels
Sell Signals (Red/Yellow "Sell" Labels)
Multi-Condition Confirmation Required:
RSI Overbought Reversal: RSI crosses below 70
Trend Exhaustion: HMA showing bearish structure
Momentum Divergence: DMI bearish alignment
Statistical Resistance: Price at or near resistance zones
Timeframe Confirmation: 1H BB% bearish signals
Strong Sell Conditions:
Confluence of order block resistance + BB% resistance line
Multiple timeframe distribution
Volume surge at resistance
Additional Alerts
RSI Divergence Signals: Triangles showing momentum shifts
Extreme Price Alerts: Circles at statistical extremes
Structure Breaks: Visual cues for order block violations
🎨 Visual System Guide
Color Coding System
Green: Bullish conditions, support zones, rising trends
Red: Bearish conditions, resistance zones, falling trends
Blue: Statistical channels, neutral zones
Yellow: Alert conditions, extreme signals
White: Transition zones, neutral signals
Zone Identification
Buying Pressure Zones: Green/blue tinted areas below price or white candles with white dots within the moving average center line
Selling Pressure Zones: Red tinted areas above price with white dots within the moving average center line
Standard Deviation Zones: Gradient colors showing statistical extremes
⚙️ Customization Options
Adjustable Parameters
RSI Settings: Period, oversold/overbought levels, sensitivity
Order Block Detection: Lookback period, ATR multiplier, extension
Statistical Settings: Gaussian filter poles, regression periods
Support/Resistance: Maximum lines, BB% settings
Visual Preferences: Colors, band displays, alert styles
Input Groups
RSI Trading Strategy
Order Block Configuration
Gaussian Channel Settings
Linear Regression Parameters
DMI/ADX Configuration
Bollinger Band % Settings
📈 Practical Trading Applications
For Swing Traders
Identify Key Levels: Use order blocks + BB% lines for entry/exit planning
Trend Confirmation: HMA + Gaussian channel for trend direction
Risk Management: Standard deviation bands for stop placement
Timing Entries: RSI/DMI alignment for optimal entry timing
For Day Traders
Intraday Levels: Order blocks provide immediate S/R for day trading
Momentum Signals: Real-time RSI/DMI signals for quick moves
Statistical Edges: Gaussian channel for mean reversion plays
Breakout Confirmation: Order block breaks with volume
For Position Traders
Higher Timeframe Structure: 1H BB% lines for major levels
Trend Persistence: HMA for long-term trend identification
Accumulation/Distribution Zones: Order blocks show institutional activity
Multi-Timeframe Alignment: Confirmation across timeframes
🔍 How to Use SDMS Effectively
Step 1: Market Structure Assessment
Identify active order blocks (green/red boxes)
Note BB% support/resistance lines (horizontal lines)
Assess HMA and moving average trend direction (color)
Check Gaussian channel position (preferably outside 2SD)
Step 2: Signal Confirmation
Wait for multiple indicator alignment
look for doji candles.
Confirm with green (bullish) or red (bearish) candles
Confirm with volume if available
Check for confluence of levels
Assess risk/reward based on nearby levels
Step 3: Trade Management
Enter at confirmed support/resistance
Place stops beyond opposite levels
Take profits at next statistical level
Monitor for structure changes
Step 4: Risk Management
Use standard deviation bands for volatility assessment
Never risk more than 1-2% per trade
Adjust position size based on confluence strength
Have predefined exit rules
💡 Advanced Strategies
Strategy 1: Confluence Trading
Setup: Order block + BB% line at same level
Entry: Price tests confluence zone with RSI signal
Stop: Beyond the confluence zone
Target: Next statistical level
Strategy 2: Breakout Trading
Setup: Price approaching order block boundary
Entry: Break with volume + RSI/DMI confirmation
Stop: Re-entry into order block
Target: Next BB% line extension
Strategy 3: Mean Reversion
Setup: Price at Gaussian channel extremes
Entry: RSI reversal signal at channel boundary
Stop: Beyond channel extreme
Target: Channel midline or opposite boundary
⚠️ Important Considerations
Best Market Conditions
Trending Markets: Excellent performance in clear trends
Breakout Scenarios: Strong identification of break levels
Range Markets: Works well with defined ranges
Limitations
Choppy Markets: May give false signals in consolidation
News Events: Fundamental shocks can override technical levels
Timeframe Specific: Optimal on 15-minute to daily charts
Risk Management Rules
Always use stops
Never rely on single signals
Consider market context
Adjust for volatility changes
Keep position sizes consistent
🔧 Technical Specifications
Maximum Lines: 500
Maximum Bars Back: 1000
Maximum Boxes: 500
Calculation Efficiency: Optimized for real-time use
🏆 Why SDMS Stands Out
Unique Advantages
Integrated Approach: Combines multiple methodologies into one tool
Self-Adjusting: Automatically adapts to market changes
Multi-Timeframe: Provides both immediate and higher timeframe context
Visual Clarity: Clean, intuitive display of complex data
Professional Grade: Institutional-level analysis accessible to all traders
Educational Value: Learn how different indicators interact
Understand market structure development
See institutional order flow patterns
Develop disciplined trading habits
📚 Learning Resources
Recommended Study Approach
Start Simple: Focus on order blocks and BB% lines first
Add Complexity: Gradually incorporate other indicators
Paper Trade: Practice without risk
Keep Journal: Document setups and outcomes
Review Regularly: Analyze both wins and losses
Common Pitfalls to Avoid
Overtrading: Wait for high-quality setups
Ignoring Context: Consider overall market conditions
Chasing Signals: Enter at planned levels, not after moves
Risk Mismanagement: Always know your risk before entering
Confirmation Bias: Be objective about signals
🤝 Community & Support
Getting the Most from SDMS
Start with Defaults: Use default settings initially
Adjust Gradually: Make small changes as you understand the tool
Combine with Fundamentals: Use for timing within fundamental context
Stay Disciplined: Follow your trading plan consistently
Continuous Improvement
SDMS is designed for continuous learning. As you use the indicator, you'll develop insights into:
Market microstructure
Institutional trading patterns
Statistical edge identification
Risk management optimization
Risk management is more important than signal accuracy
Patience is required for high-quality setups
Success Factors
Discipline: Following your plan consistently
Patience: Waiting for proper setups
Risk Management: Protecting your capital
Continuous Learning: Improving your skills over time
🌟 Final Thoughts
The Standard Deviation Market Structure indicator represents a sophisticated approach to technical analysis, combining the best elements of price action, statistical analysis, and momentum indicators. While powerful, remember that no indicator guarantees success. SDMS is a tool – your skill, discipline, and risk management determine your trading results.
Use SDMS as part of a comprehensive trading plan, combine it with proper risk management, and continue developing your trading skills. The markets are always teaching – stay humble, stay disciplined, and trade well.
Disclaimer: This indicator is for educational purposes only. Past performance does not guarantee future results. Trading involves risk of loss. Always consult with a qualified financial professional before making investment decisions.

4H HOD/LOD Checkpoint Analysis4H HOD/LOD Checkpoint Analysis - Detailed User Guide
OVERVIEW
This indicator is a data-driven probability framework for NQ Futures traders that predicts High-of-Day (HOD) and Low-of-Day (LOD) placement based on statistical analysis of 3,136+ trading days (2013-2025). Unlike traditional indicators that rely on technical signals, this tool uses checkpoint-based state analysis with zero forward-looking bias to provide real-time probabilities of whether the daily range is complete.
⚠️ IMPORTANT: This indicator is specifically designed for NQ FUTURES ONLY. All probabilities, patterns, and statistics were derived from a 10+ year historical dataset of NQ 1-minute bars. Using this on other instruments will produce inaccurate results.
CORE CONCEPT: CHECKPOINT METHODOLOGY
What is a Checkpoint?
A checkpoint occurs when a 4-hour candle closes. At this moment, the indicator "locks" the current market state and calculates probabilities for the remainder of the trading day. The key innovation is that state never changes after locking - probabilities remain constant throughout the session until the next checkpoint.
The Six 4-Hour Candles (EST):
6PM (18:00-22:00) - Evening/Globex open
10PM (22:00-02:00) - Asia session
2AM (02:00-06:00) - Early London
6AM (06:00-10:00) - Late London + NY Open
10AM (10:00-14:00) - NY Morning
2PM (14:00-17:00) - NY Afternoon (3 hours only)
Five Checkpoints:
10PM Checkpoint - After 6PM closes
2AM Checkpoint - After 10PM closes
6AM Checkpoint - After 2AM closes
10AM Checkpoint - After 6AM closes (most critical)
2PM Checkpoint - After 10AM closes (highest conviction fade signals)
HOW IT WORKS: THE THREE-FACTOR STATE SYSTEM
At each checkpoint, the indicator evaluates three critical factors to determine probability:
1. ELIMINATIONS (Quantity)
An "elimination" occurs when a candle trades beyond a previous candle's high or low, effectively removing that candle from contention for HOD/LOD.
Example at 10AM Checkpoint:
6PM high = 18,000
10PM high = 18,050 (eliminates 6PM high)
2AM high = 18,100 (eliminates 10PM high)
6AM high = 18,075 (does NOT eliminate 2AM high)
Result: 2 eliminations
The number of eliminations indicates trend strength:
0 eliminations = Range-bound, high probability extremes already set
1-2 eliminations = Moderate trend
3-4 eliminations = Strong trend day, range likely to extend
2. STRUCTURE (Pattern Type)
The indicator distinguishes between two elimination patterns:
Sequential: Eliminations occur in order (6pm → 10pm → 2am → 6am → 10am)
Indicates smooth, consistent trend
Example: 10pm eliminates 6pm, then 2am eliminates 10pm (sequential)
Skip: Eliminations skip candles
Indicates choppy/reversal behavior
Example: 2am eliminates 6pm but NOT 10pm (skip pattern)
Why it matters: Skip patterns show 2X probability differences compared to sequential patterns. At 10AM checkpoint with 2 eliminations, skip pattern shows 64% participation rate vs 36% for sequential pattern with previous survived.
3. PREVIOUS CANDLE STATUS
Did the immediately prior candle get eliminated?
Eliminated: Previous candle's high/low was taken out
Indicates relentless trend
Higher probability of continuation
Survived: Previous candle's high/low still intact
Indicates trend pause
Higher probability of mean reversion or range completion
Critical insight: High and low are tracked separately. At 2AM checkpoint, 10PM might have eliminated 6PM high (relentless uptrend) but NOT eliminated 6PM low (low survived). This creates different probabilities for HOD vs LOD.
VISUAL ELEMENTS
4-Hour Candle Boxes
Each 4H candle is displayed as a colored box showing its range:
Gray = 6PM (evening)
Blue = 10PM (Asia)
Purple = 2AM (early London)
Orange = 6AM (London + NY Open) - THE CURVE SESSION
Teal = 10AM (NY morning) - THE MONEY SESSION
Red = 2PM (NY afternoon) - THE FADE SESSION
HOD/LOD Lines
Black horizontal lines extend from current HOD/LOD with labels showing:
Which candle set the extreme
Current price level
THE CHECKPOINT TABLE EXPLAINED
Table Header:
Shows current checkpoint (e.g., "🎯 10AM CHECKPOINT") or "⏳ PRE-CHECKPOINT" if between checkpoints.
Main Metrics (Side-by-Side Comparison):
The table displays HOD and LOD separately in two columns because they can have different patterns:
METRIC
HODLOD Eliminations
Number of candles eliminated so far for highs
Number of candles eliminated so far for lows
Structure
Sequential or Skip pattern for highs
Sequential or Skip pattern for lows
Prev Candle
Was previous candle's high eliminated or did it survive?
Was previous candle's low eliminated or did it survive?
Pattern
Combined interpretation: Relentless/Paused/Skip/Early
Combined interpretation: Relentless/Paused/Skip/Early
Color Coding:
Structure Row:
White = Sequential (smooth trend)
Orange = Skip (choppy/reversal)
Previous Candle Row:
Red = Eliminated (relentless trend continuing)
Blue = Survived (trend paused)
Pattern Row:
Red = Relentless (previous eliminated + sequential = strong trend)
Blue = Paused (previous survived + sequential = trend pause)
Orange = Skip/Chop (skip pattern = reversal likely)
Gray = Early (0-1 eliminations, too early to tell)
Probability Section:
Prob Already In: Percentage chance that HOD/LOD has already been set
Color coding:
Green (>75%) = High confidence extreme is in, FADE
Yellow (45-75%) = Moderate confidence
Red (<45%) = Low confidence extreme is in, CONTINUATION likely
Sample Size: Shows how many historical occurrences match this exact state (n=XXX)
Larger samples = higher confidence
Most common states have n=500-2,000+
Current: Which candle currently holds HOD/LOD
Pattern Guide Section:
Appears when you have 2+ eliminations. Provides interpretation:
📈 Paused: Trend has paused, 2pm more likely to set extreme
📈 Relentless: Breaking higher/lower, continuation expected
📈 Skip/Chop: Choppy pattern, next session likely
Same for lows with 📉 symbol.
PRACTICAL TRADING EXAMPLES
Example 1: High Conviction Fade Setup
State at 10AM Checkpoint:
Eliminations: 0 (both HOD/LOD)
Structure: None (no eliminations yet)
Prev Candle: Survived
Table shows:
HOD Prob Already In: 68.9% (n=582)
LOD Prob Already In: 73.6% (n=785)
Interpretation: Range is likely complete. Fade extremes. With 0 eliminations and 70%+ probability, this is a high-conviction mean reversion signal.
Example 2: Strong Continuation Signal
State at 10AM Checkpoint:
Eliminations: 3 (both HOD/LOD)
Structure: Sequential
Prev Candle: Eliminated (relentless)
Table shows:
HOD Prob Already In: 29.8% (n=1,758)
LOD Prob Already In: 34.6% (n=1,451)
Pattern: 📈 Relentless / 📉 Relentless
Interpretation: Strong trend day. Only 30-35% chance range is complete. Look for breakouts in direction of trend. 10AM and 2PM likely to extend range.
Example 3: Pattern Structure Edge
State at 10AM Checkpoint:
Eliminations: 2 (HOD)
Structure: Skip (orange background)
Prev Candle: Eliminated vs Alternative State:
Eliminations: 2 (HOD)
Structure: Sequential
Prev Candle: Survived
Result: Skip pattern shows 64% chance 10AM participates vs 36% for sequential+survived. Skip pattern = 2X more likely to see 10AM high. This structural edge is unique to this indicator.
Example 4: Different HOD vs LOD Patterns
State at 10AM Checkpoint:
HOD: 2 eliminations, Sequential, Previous Eliminated (Relentless) = 46.7% in
LOD: 2 eliminations, Skip, Previous Eliminated (Choppy) = 48.4% in
Interpretation: Highs show relentless uptrend but lows show choppy behavior. This divergence suggests potential for upside continuation but with volatility. Not a clean trend day.
KEY CHECKPOINT STATISTICS (DERIVED FROM 10-YEAR DATASET)
10PM Checkpoint (After 6PM):
Very early in day
13.5% HOD in, 21.3% LOD in
Most likely outcome: Range extends into 6AM/10AM
2AM Checkpoint (After 10PM):
Still early
With 0 elims: 22-31% in (balanced)
With 1 elim: 8-12% in (strong trend signal)
6AM Checkpoint (After 2AM) - Critical Decision Point:
With 0 elims: 40-47% in (balanced, could go either way)
With 2 elims: 18-22% in (strong trend into 6AM/10AM)
Most likely outcome: 10AM sets extremes (~38-40%)
10AM Checkpoint (After 6AM) - Highest Conviction:
With 0 elims: 69-74% in → FADE (high confidence)
With 3 elims: 30-35% in → BUY/SELL continuation
This is THE money checkpoint for high-probability setups
2PM Checkpoint (After 10AM) - Maximum Fade Conviction:
With 0-3 elims: 67-95% in → FADE strongly
With 4 elims: 49-61% in (monster trend, weaker fade)
2PM is primarily a mean reversion session
UNDERSTANDING THE UNDERLYING DATA
All probabilities are derived from analysis of:
Instrument: NQ Futures (E-mini NASDAQ-100)
Timeframe: 1-minute bars
Period: January 2013 - December 2025
Sample: 3,136+ complete trading days
Methodology: Real-time checkpoint analysis with zero forward-looking bias
Why NQ-Specific?
Each futures contract has unique:
Session characteristics (6AM in NQ shows 60-64% curve behavior, other sessions differ)
Timing patterns (NQ's 10AM session has 67-74% immediate takeouts)
Volatility profiles (NQ 2PM shows 56% bullish bias vs ES shows different bias)
Using this indicator on ES, RTY, or other instruments will produce inaccurate results because the probability tables are NQ-specific.
ORIGINALITY & INNOVATION
What Makes This Indicator Unique:
Zero Forward-Looking Bias: State locks at checkpoint moments. Traditional indicators recalculate continuously, introducing bias. This indicator freezes probabilities at the exact moment a 4H candle closes.
Three-Factor State System: Combines elimination count, structure pattern, and previous candle status. Most indicators only track one dimension. This multi-factor approach provides 2X+ probability differentials.
Separate HOD/LOD Tracking: Highs and lows can have different patterns simultaneously (relentless high with choppy low). This indicator tracks them separately for precision.
Pattern Structure Analysis: Distinguishes between sequential and skip patterns, a concept not found in standard indicators. Skip patterns show mean reversion while sequential shows continuation.
10+ Year Statistical Foundation: Every probability is backed by hundreds to thousands of historical occurrences (sample sizes shown in table). Not based on theories or assumptions.
Checkpoint-Specific Probabilities: Different checkpoints have different probability profiles. 10AM checkpoint with 0 eliminations = 70%+ fade. 6AM checkpoint with same state = 40%+ fade. Context matters.
HOW TO USE THIS INDICATOR
Step 1: Wait for Checkpoint
The table will show "⏳ PRE-CHECKPOINT" until a 4H candle closes. Probabilities are only valid at checkpoint moments.
Step 2: Read the State
Check the three factors:
How many eliminations?
Sequential or skip?
Previous candle eliminated or survived?
Step 3: Check Probability
Look at "Prob Already In" percentage:
>75% (Green) = High confidence extreme is set, fade
45-75% (Yellow) = Moderate confidence, use other confirmation
<45% (Red) = Low confidence extreme is set, continuation likely
Step 4: Check Sample Size
Larger sample (n=1,000+) = higher confidence
Smaller sample (n=50-200) = use caution, edge is real but less robust
Step 5: Consider Pattern
Read the pattern guide:
Relentless = trend continuing
Paused = trend stalled, mean reversion
Skip/Chop = reversal/range likely
Step 6: Compare HOD vs LOD
If both show similar patterns = cleaner signal
If divergent patterns = complex day, be cautious
BEST PRACTICES
Focus on 10AM and 2PM checkpoints - These have the highest conviction signals
Combine with price action - Don't fade blindly at 90% probability if price is breaking out strongly
Larger samples = better edges - Prioritize setups with n=500+
Watch for pattern divergence - When HOD and LOD show different patterns, expect complexity
Remember session characteristics:
6AM = THE CURVE SESSION (60-64% mean reversion when Q2 breaks Q1)
10AM = THE MONEY SESSION (67-74% immediate takeouts, highest conviction)
2PM = THE FADE SESSION (67-95% extremes already in)
SETTINGS
Show 4H Candle Boxes - Display colored boxes for each 4H candle
Show HOD/LOD Lines - Display horizontal lines at current extremes
Show Checkpoint Analysis - Display probability table
Table Position - Choose where to place the checkpoint table
Table Size - Tiny/Small/Normal
Colors - Customize box colors for each session
LIMITATIONS & DISCLAIMERS
NQ FUTURES ONLY - Do not use on other instruments
Not a standalone system - Use as confluence with your strategy
Historical data - Past performance doesn't guarantee future results
Sample size variance - Some states have smaller samples, use judgment
Requires understanding - Read this guide fully before trading with this tool
FINAL NOTES
This indicator represents 10+ years of NQ futures data distilled into actionable, real-time probabilities. The checkpoint methodology ensures zero forward-looking bias, while the three-factor state system provides granular edge that traditional indicators miss.
Remember: This tool provides probabilities, not certainties. Trade with proper risk management, and use this as one input in your decision-making process.

VaCs Pro Max by CS (Final Version - V9)VaCs Pro Max by CS (Final Version - V9) – TradingView Indicator Overview
Introduction:
The VaCs Pro Max indicator is a comprehensive, all-in-one technical analysis tool designed for traders who seek a clear, visual, and flexible overview of market trends, levels, sessions, and key signals. This advanced TradingView script integrates multiple technical indicators, market level trackers, session visualizations, and the innovative AlphaTrend module to provide actionable insights across any timeframe.
1. Technical Indicators:
This module combines essential trend-following and market momentum tools:
VWAP (Volume Weighted Average Price): Shows the average price weighted by volume, helping traders identify key support/resistance levels. Customizable color allows easy chart visibility.
EMAs (Exponential Moving Averages): Two EMAs (fast and long) track short-term and long-term price trends. Traders can adjust lengths and colors for personalized analysis.
Parabolic SAR: Highlights potential trend reversals with dots above/below candles. Step and maximum settings allow fine-tuning for sensitivity.
S2F Bands (Stock-to-Flow): A dynamic band system representing mid, upper, and lower levels derived from EMA. Useful for identifying overbought/oversold zones.
Logarithmic Growth Channel (LGC): Provides logarithmic regression channels, highlighting long-term price structure and growth trends. Adjustable length and band colors.
Linear Regressions: Two regression lines (short and long) detect trend directions and deviations over customizable periods.
Liquidity Zones: Highlights recent highs/lows over a defined lookback period, showing potential support/resistance clusters.
SMC Markers (Swing Market Context): Marks pivot highs and lows using visual labels, helping identify swing points and trend continuation patterns.
2. Market Levels:
Track weekly and Monday high/low levels for precise intraday and swing trading decisions:
Weekly Levels: Highlight the previous week’s high and low for reference.
Monday Levels: Focus on the day’s opening range, particularly useful for weekly breakout strategies.
3. Session Boxes (UTC):
Visual boxes mark major trading sessions (London, New York) in UTC time:
London Session Box: Highlights market activity between 08:00–16:30 UTC.
New York Session Box: Highlights market activity between 13:30–20:00 UTC.
Boxes automatically adjust to session highs and lows for clear intraday structure visualization.
4. Vertical Session Lines (Turkey Time – UTC+3):
These vertical lines provide an easy-to-read visualization of key market opens and closes:
US (NYSE), EU (LSE), JP (TSE), CN (SSE) lines: Color-coded and labeled, showing market opening and closing times in Turkish local time.
Ideal for identifying session overlaps and liquidity spikes.
5. AlphaTrend Module:
The AlphaTrend module is a dynamic trend-following system offering both visual guidance and trade signals:
Trend Calculation: Uses ATR and RSI/MFI logic to determine dynamic trend levels.
Signals: Generates BUY and SELL markers based on trend crossovers.
Customizable Settings: Multiplier, period, source input, and volume data modes allow tailored sensitivity.
Visuals: Filled areas between main and lag lines highlight trend direction, making it easy to interpret market bias at a glance.
Alerts: Includes multiple alert conditions such as potential and confirmed BUY/SELL, and price crossovers, suitable for automated notifications.
Usage & Benefits:
All modules have on/off toggles in the input panel, allowing users to customize the chart view without losing performance.
Color-coded visuals, session boxes, and trend channels improve readability, especially during high volatility.
Suitable for day trading, swing trading, and long-term analysis due to multi-timeframe adaptability.
The combination of trend indicators, liquidity zones, and session analysis provides a holistic view of market structure.
Alerts enable traders to automate monitoring without constantly staring at the chart.
Conclusion:
VaCs Pro Max by CS (V9) is designed for both professional and semi-professional traders who want an all-inclusive, visually intuitive, and highly configurable TradingView indicator. It merges classical technical indicators with modern trend and session analysis tools, making it an indispensable tool for informed trading decisions.

Indicator Overview主力籌碼預判買賣力道 (JUMBO)Pro+ 2.0主力預判買賣力道 Pro+ 是一個先進的多維度交易分析系統,專為台灣股市投資者設計。本指標整合了趨勢、成交量、動量、價格位置和波動率五大維度,通過加權評分系統生成綜合的「Power指標」,精準預判主力資金動向。
🔧 核心技術架構
1. 多維度評分系統
趨勢維度 (30%):雙EMA系統 + MACD + ADX趨勢強度
成交量維度 (25%):OBV能量潮 + 成交量比率分析
動量維度 (20%):RSI + MFI資金流量指標
價格位置維度 (20%):VWAP + 布林通道位置分析
波動率維度 (5%):ATR波動率調整
2. 多重確認機制
趨勢確認:EMA金叉/死叉 + 超級趨勢方向
成交量確認:成交量脈衝檢測 + OBV趨勢確認
動量確認:RSI超買超賣 + MFI資金流向
位置確認:布林通道位置 + VWAP相對位置
📊 主要功能特色
訊號系統
主力佈局訊號 🟥
趨勢多頭確認 + Power > 35
成交量放大 + 動量指標多頭
RSI未超買 + 價格突破基準
主力出貨訊號 🟩
趨勢空頭確認 + Power < -35
成交量異常 + 動量指標空頭
RSI未超賣 + 價格跌破基準
Power交叉訊號 🟠🔵
黃金交叉:Power線向上穿越Power MA線
死亡交叉:Power線向下穿越Power MA線
視覺化系統
台灣股市顏色標準:紅色上漲/多頭,綠色下跌/空頭
多層級K線著色:強力訊號→普通訊號→偏多偏空→盤整
智能資訊面板:實時顯示8大關鍵指標狀態
⚙️ 參數設定說明
主要參數
EMA週期:13/55(短期/長期)
Power閾值:35(靈敏度調整)
成交量濾波:1.2倍(異常成交量檢測)
超級趨勢:10週期/3倍數(趨勢過濾)
進階參數
布林通道:20週期/2倍標準差
波動率設定:14週期ATR
動量指標:14週期RSI/MFI
🎯 交易應用策略
進場時機
強力買入:🔥標記 + Power黃金交叉
常規買入:紅色向上箭頭 + Power > 35
確認買入:多重條件同時滿足
出場時機
強力賣出:💧標記 + Power死亡交叉
常規賣出:綠色向下箭頭 + Power < -35
風險控制:趨勢反轉 + 動量減弱
風險管理
止損設定:ATR波動率參考
倉位控制:Power數值強度分級
訊號過濾:ADX趨勢強度確認
📈 指標優勢
高準確率:多重條件過濾,減少假訊號
及時性:領先指標預判主力動向
完整性:涵蓋技術分析主要維度
用戶友好:直觀的視覺化設計
自定義:參數可調適應不同交易風格
🎯 Indicator Overview
Main Force Prediction Buying/Selling Strength Pro+ is an advanced multi-dimensional trading analysis system specifically designed for Taiwan stock market investors. This indicator integrates five key dimensions: trend, volume, momentum, price position, and volatility, generating a comprehensive "Power Indicator" through a weighted scoring system to accurately predict institutional fund movements.
🔧 Core Technical Architecture
1. Multi-Dimensional Scoring System
Trend Dimension (30%): Dual EMA system + MACD + ADX trend strength
Volume Dimension (25%): OBV accumulation + Volume ratio analysis
Momentum Dimension (20%): RSI + MFI money flow index
Price Position Dimension (20%): VWAP + Bollinger Bands position analysis
Volatility Dimension (5%): ATR volatility adjustment
2. Multi-Confirmation Mechanism
Trend Confirmation: EMA golden/death cross + SuperTrend direction
Volume Confirmation: Volume spike detection + OBV trend confirmation
Momentum Confirmation: RSI overbought/oversold + MFI money flow
Position Confirmation: Bollinger Bands position + VWAP relative position
📊 Key Features
Signal System
Institutional Accumulation Signals 🟥
Bullish trend confirmation + Power > 35
Volume expansion + Momentum indicators bullish
RSI not overbought + Price breakthrough baseline
Institutional Distribution Signals 🟩
Bearish trend confirmation + Power < -35
Abnormal volume + Momentum indicators bearish
RSI not oversold + Price breakdown below baseline
Power Cross Signals 🟠🔵
Golden Cross: Power line crosses above Power MA line
Death Cross: Power line crosses below Power MA line
Visualization System
Taiwan Market Color Standard: Red for uptrend/bullish, Green for downtrend/bearish
Multi-level Candlestick Coloring: Strong signals → Regular signals → Bias signals → Consolidation
Smart Info Panel: Real-time display of 8 key indicator statuses
⚙️ Parameter Settings
Main Parameters
EMA Periods: 13/55 (Short-term/Long-term)
Power Threshold: 35 (Sensitivity adjustment)
Volume Filter: 1.2x (Abnormal volume detection)
SuperTrend: 10 period/3 multiplier (Trend filtering)
Advanced Parameters
Bollinger Bands: 20 period/2 standard deviations
Volatility Settings: 14 period ATR
Momentum Indicators: 14 period RSI/MFI
🎯 Trading Application Strategies
Entry Timing
Strong Buy: 🔥 Mark + Power Golden Cross
Regular Buy: Red upward arrow + Power > 35
Confirmed Buy: Multiple conditions simultaneously met
Exit Timing
Strong Sell: 💧 Mark + Power Death Cross
Regular Sell: Green downward arrow + Power < -35
Risk Control: Trend reversal + Momentum weakening
Risk Management
Stop Loss Setting: ATR volatility reference
Position Sizing: Power value strength grading
Signal Filtering: ADX trend strength confirmation
📈 Indicator Advantages
High Accuracy: Multiple condition filtering reduces false signals
Timeliness: Leading indicators predict institutional movements
Completeness: Covers main dimensions of technical analysis
User-Friendly: Intuitive visualization design
Customizable: Adjustable parameters adapt to different trading styles
🔍 Professional Usage Tips
Trend Confirmation: Use in conjunction with major trend direction
Volume Validation: Ensure volume confirms price movements
Risk Management: Always use appropriate position sizing
Timeframe Analysis: Apply across multiple timeframes for confirmation
Market Context: Consider overall market conditions and sector rotation
版本: Pro+ 2.0
適用市場: 台股、亞股、全球股市
最佳時間框架: 日線、4小時線、1小時線
開發者: JUMBO Trading System
更新日期: 2025版本

Puell Multiple Variants [OperationHeadLessChicken]Overview
This script contains three different, but related indicators to visualise Bitcoin miner revenue.
The classical Puell Multiple : historically, it has been good at signaling Bitcoin cycle tops and bottoms, but due to the diminishing rewards miners get after each halving, it is not clear how you determine overvalued and undervalued territories on it. Here is how the other two modified versions come into play:
Halving-Corrected Puell Multiple : The idea is to multiply the miner revenue after each halving with a correction factor, so overvalued levels are made comparable by a horizontal line across cycles. After experimentation, this correction factor turned out to be around 1.63. This brings cycle tops close to each other, but we lose the ability to see undervalued territories as a horizontal region. The third variant aims to fix this:
Miner Revenue Relative Strength Index (Miner Revenue RSI) : It uses RSI to map miner revenue into the 0-100 range, making it easy to visualise over/undervalued territories. With correct parameter settings, it eliminates the diminishing nature of the original Puell Multiple, and shows both over- and undervalued revenues correctly.
Example usage
The goal is to determine cycle tops and bottoms. I recommend using it on high timeframes, like monthly or weekly . Lower than that, you will see a lot of noise, but it could still be used. Here I use monthly as the example.
The classical Puell Multiple is included for reference. It is calculated as Miner Revenue divided by the 365-day Moving Average of the Miner Revenue . As you can see in the picture below, it has been good at signaling tops at 1,3,5,7.
The problems:
- I have to switch the Puell Multiple to a logarithmic scale
- Still, I cannot use a horizontal oversold territory
- 5 didn't touch the trendline, despite being a cycle top
- 9 touched the trendline despite not being a cycle top
Halving-Corrected Puell Multiple (yellow): Multiplies the Puell Multiple by 1.63 (a number determined via experimentation) after each halving. In the picture below, you can see how the Classical (white) and Corrected (yellow) Puell Multiples compare:
Advantages:
- Now you can set a constant overvalued level (12.49 in my case)
- 1,3,7 are signaled correctly as cycle tops
- 9 is correctly not signaled as a cycle top
Caveats:
- Now you don't have bottom signals anymore
- 5 is still not signaled as cycle top
Let's see if we can further improve this:
Miner Revenue RSI (blue):
On the monthly, you can see that an RSI period of 6, an overvalued threshold of 90, and an undervalued threshold of 35 have given historically pretty good signals.
Advantages:
- Uses two simple and clear horizontal levels for undervalued and overvalued levels
- Signaling 1,3,5,7 correctly as cycle tops
- Correctly does not signal 9 as a cycle top
- Signaling 4,6,8 correctly as cycle bottoms
Caveats:
- Misses two as a cycle bottom, although it was a long time ago when the Bitcoin market was much less mature
- In the past, gave some early overvalued signals
Usage
Using the example above, you can apply these indicators to any timeframe you like and tweak their parameters to obtain signals for overvalued/undervalued BTC prices
You can show or hide any of the three indicators individually
Set overvalued/undervalued thresholds for each => the background will highlight in green (undervalued) or red (overvalued)
Set special parameters for the given indicators: correction factor for the Corrected Puell and RSI period for Revenue RSI
Show or hide halving events on the indicator panel
All parameters and colours are adjustable

Keltner Channel Enhanced [DCAUT]█ Keltner Channel Enhanced
📊 ORIGINALITY & INNOVATION
The Keltner Channel Enhanced represents an important advancement over standard Keltner Channel implementations by introducing dual flexibility in moving average selection for both the middle band and ATR calculation. While traditional Keltner Channels typically use EMA for the middle band and RMA (Wilder's smoothing) for ATR, this enhanced version provides access to 25+ moving average algorithms for both components, enabling traders to fine-tune the indicator's behavior to match specific market characteristics and trading approaches.
Key Advancements:
Dual MA Algorithm Flexibility: Independent selection of moving average types for middle band (25+ options) and ATR smoothing (25+ options), allowing optimization of both trend identification and volatility measurement separately
Enhanced Trend Sensitivity: Ability to use faster algorithms (HMA, T3) for middle band while maintaining stable volatility measurement with traditional ATR smoothing, or vice versa for different trading strategies
Adaptive Volatility Measurement: Choice of ATR smoothing algorithm affects channel responsiveness to volatility changes, from highly reactive (SMA, EMA) to smoothly adaptive (RMA, TEMA)
Comprehensive Alert System: Five distinct alert conditions covering breakouts, trend changes, and volatility expansion, enabling automated monitoring without constant chart observation
Multi-Timeframe Compatibility: Works effectively across all timeframes from intraday scalping to long-term position trading, with independent optimization of trend and volatility components
This implementation addresses key limitations of standard Keltner Channels: fixed EMA/RMA combination may not suit all market conditions or trading styles. By decoupling the trend component from volatility measurement and allowing independent algorithm selection, traders can create highly customized configurations for specific instruments and market phases.
📐 MATHEMATICAL FOUNDATION
Keltner Channel Enhanced uses a three-component calculation system that combines a flexible moving average middle band with ATR-based (Average True Range) upper and lower channels, creating volatility-adjusted trend-following bands.
Core Calculation Process:
1. Middle Band (Basis) Calculation:
The basis line is calculated using the selected moving average algorithm applied to the price source over the specified period:
basis = ma(source, length, maType)
Supported algorithms include EMA (standard choice, trend-biased), SMA (balanced and symmetric), HMA (reduced lag), WMA, VWMA, TEMA, T3, KAMA, and 17+ others.
2. Average True Range (ATR) Calculation:
ATR measures market volatility by calculating the average of true ranges over the specified period:
trueRange = max(high - low, abs(high - close ), abs(low - close ))
atrValue = ma(trueRange, atrLength, atrMaType)
ATR smoothing algorithm significantly affects channel behavior, with options including RMA (standard, very smooth), SMA (moderate smoothness), EMA (fast adaptation), TEMA (smooth yet responsive), and others.
3. Channel Calculation:
Upper and lower channels are positioned at specified multiples of ATR from the basis:
upperChannel = basis + (multiplier × atrValue)
lowerChannel = basis - (multiplier × atrValue)
Standard multiplier is 2.0, providing channels that dynamically adjust width based on market volatility.
Keltner Channel vs. Bollinger Bands - Key Differences:
While both indicators create volatility-based channels, they use fundamentally different volatility measures:
Keltner Channel (ATR-based):
Uses Average True Range to measure actual price movement volatility
Incorporates gaps and limit moves through true range calculation
More stable in trending markets, less prone to extreme compression
Better reflects intraday volatility and trading range
Typically fewer band touches, making touches more significant
More suitable for trend-following strategies
Bollinger Bands (Standard Deviation-based):
Uses statistical standard deviation to measure price dispersion
Based on closing prices only, doesn't account for intraday range
Can compress significantly during consolidation (squeeze patterns)
More touches in ranging markets
Better suited for mean-reversion strategies
Provides statistical probability framework (95% within 2 standard deviations)
Algorithm Combination Effects:
The interaction between middle band MA type and ATR MA type creates different indicator characteristics:
Trend-Focused Configuration (Fast MA + Slow ATR): Middle band uses HMA/EMA/T3, ATR uses RMA/TEMA, quick trend changes with stable channel width, suitable for trend-following
Volatility-Focused Configuration (Slow MA + Fast ATR): Middle band uses SMA/WMA, ATR uses EMA/SMA, stable trend with dynamic channel width, suitable for volatility trading
Balanced Configuration (Standard EMA/RMA): Classic Keltner Channel behavior, time-tested combination, suitable for general-purpose trend following
Adaptive Configuration (KAMA + KAMA): Self-adjusting indicator responding to efficiency ratio, suitable for markets with varying trend strength and volatility regimes
📊 COMPREHENSIVE SIGNAL ANALYSIS
Keltner Channel Enhanced provides multiple signal categories optimized for trend-following and breakout strategies.
Channel Position Signals:
Upper Channel Interaction:
Price Touching Upper Channel: Strong bullish momentum, price moving more than typical volatility range suggests, potential continuation signal in established uptrends
Price Breaking Above Upper Channel: Exceptional strength, price exceeding normal volatility expectations, consider adding to long positions or tightening trailing stops
Price Riding Upper Channel: Sustained strong uptrend, characteristic of powerful bull moves, stay with trend and avoid premature profit-taking
Price Rejection at Upper Channel: Momentum exhaustion signal, consider profit-taking on longs or waiting for pullback to middle band for reentry
Lower Channel Interaction:
Price Touching Lower Channel: Strong bearish momentum, price moving more than typical volatility range suggests, potential continuation signal in established downtrends
Price Breaking Below Lower Channel: Exceptional weakness, price exceeding normal volatility expectations, consider adding to short positions or protecting against further downside
Price Riding Lower Channel: Sustained strong downtrend, characteristic of powerful bear moves, stay with trend and avoid premature covering
Price Rejection at Lower Channel: Momentum exhaustion signal, consider covering shorts or waiting for bounce to middle band for reentry
Middle Band (Basis) Signals:
Trend Direction Confirmation:
Price Above Basis: Bullish trend bias, middle band acts as dynamic support in uptrends, consider long positions or holding existing longs
Price Below Basis: Bearish trend bias, middle band acts as dynamic resistance in downtrends, consider short positions or avoiding longs
Price Crossing Above Basis: Potential trend change from bearish to bullish, early signal to establish long positions
Price Crossing Below Basis: Potential trend change from bullish to bearish, early signal to establish short positions or exit longs
Pullback Trading Strategy:
Uptrend Pullback: Price pulls back from upper channel to middle band, finds support, and resumes upward, ideal long entry point
Downtrend Bounce: Price bounces from lower channel to middle band, meets resistance, and resumes downward, ideal short entry point
Basis Test: Strong trends often show price respecting the middle band as support/resistance on pullbacks
Failed Test: Price breaking through middle band against trend direction signals potential reversal
Volatility-Based Signals:
Narrow Channels (Low Volatility):
Consolidation Phase: Channels contract during periods of reduced volatility and directionless price action
Breakout Preparation: Narrow channels often precede significant directional moves as volatility cycles
Trading Approach: Reduce position sizes, wait for breakout confirmation, avoid range-bound strategies within channels
Breakout Direction: Monitor for price breaking decisively outside channel range with expanding width
Wide Channels (High Volatility):
Trending Phase: Channels expand during strong directional moves and increased volatility
Momentum Confirmation: Wide channels confirm genuine trend with substantial volatility backing
Trading Approach: Trend-following strategies excel, wider stops necessary, mean-reversion strategies risky
Exhaustion Signs: Extreme channel width (historical highs) may signal approaching consolidation or reversal
Advanced Pattern Recognition:
Channel Walking Pattern:
Upper Channel Walk: Price consistently touches or exceeds upper channel while staying above basis, very strong uptrend signal, hold longs aggressively
Lower Channel Walk: Price consistently touches or exceeds lower channel while staying below basis, very strong downtrend signal, hold shorts aggressively
Basis Support/Resistance: During channel walks, price typically uses middle band as support/resistance on minor pullbacks
Pattern Break: Price crossing basis during channel walk signals potential trend exhaustion
Squeeze and Release Pattern:
Squeeze Phase: Channels narrow significantly, price consolidates near middle band, volatility contracts
Direction Clues: Watch for price positioning relative to basis during squeeze (above = bullish bias, below = bearish bias)
Release Trigger: Price breaking outside narrow channel range with expanding width confirms breakout
Follow-Through: Measure squeeze height and project from breakout point for initial profit targets
Channel Expansion Pattern:
Breakout Confirmation: Rapid channel widening confirms volatility increase and genuine trend establishment
Entry Timing: Enter positions early in expansion phase before trend becomes overextended
Risk Management: Use channel width to size stops appropriately, wider channels require wider stops
Basis Bounce Pattern:
Clean Bounce: Price touches middle band and immediately reverses, confirms trend strength and entry opportunity
Multiple Bounces: Repeated basis bounces indicate strong, sustainable trend
Bounce Failure: Price penetrating basis signals weakening trend and potential reversal
Divergence Analysis:
Price/Channel Divergence: Price makes new high/low while staying within channel (not reaching outer band), suggests momentum weakening
Width/Price Divergence: Price breaks to new extremes but channel width contracts, suggests move lacks conviction
Reversal Signal: Divergences often precede trend reversals or significant consolidation periods
Multi-Timeframe Analysis:
Keltner Channels work particularly well in multi-timeframe trend-following approaches:
Three-Timeframe Alignment:
Higher Timeframe (Weekly/Daily): Identify major trend direction, note price position relative to basis and channels
Intermediate Timeframe (Daily/4H): Identify pullback opportunities within higher timeframe trend
Lower Timeframe (4H/1H): Time precise entries when price touches middle band or lower channel (in uptrends) with rejection
Optimal Entry Conditions:
Best Long Entries: Higher timeframe in uptrend (price above basis), intermediate timeframe pulls back to basis, lower timeframe shows rejection at middle band or lower channel
Best Short Entries: Higher timeframe in downtrend (price below basis), intermediate timeframe bounces to basis, lower timeframe shows rejection at middle band or upper channel
Risk Management: Use higher timeframe channel width to set position sizing, stops below/above higher timeframe channels
🎯 STRATEGIC APPLICATIONS
Keltner Channel Enhanced excels in trend-following and breakout strategies across different market conditions.
Trend Following Strategy:
Setup Requirements:
Identify established trend with price consistently on one side of basis line
Wait for pullback to middle band (basis) or brief penetration through it
Confirm trend resumption with price rejection at basis and move back toward outer channel
Enter in trend direction with stop beyond basis line
Entry Rules:
Uptrend Entry:
Price pulls back from upper channel to middle band, shows support at basis (bullish candlestick, momentum divergence)
Enter long on rejection/bounce from basis with stop 1-2 ATR below basis
Aggressive: Enter on first touch; Conservative: Wait for confirmation candle
Downtrend Entry:
Price bounces from lower channel to middle band, shows resistance at basis (bearish candlestick, momentum divergence)
Enter short on rejection/reversal from basis with stop 1-2 ATR above basis
Aggressive: Enter on first touch; Conservative: Wait for confirmation candle
Trend Management:
Trailing Stop: Use basis line as dynamic trailing stop, exit if price closes beyond basis against position
Profit Taking: Take partial profits at opposite channel, move stops to basis
Position Additions: Add to winners on subsequent basis bounces if trend intact
Breakout Strategy:
Setup Requirements:
Identify consolidation period with contracting channel width
Monitor price action near middle band with reduced volatility
Wait for decisive breakout beyond channel range with expanding width
Enter in breakout direction after confirmation
Breakout Confirmation:
Price breaks clearly outside channel (upper for longs, lower for shorts), channel width begins expanding from contracted state
Volume increases significantly on breakout (if using volume analysis)
Price sustains outside channel for multiple bars without immediate reversal
Entry Approaches:
Aggressive: Enter on initial break with stop at opposite channel or basis, use smaller position size
Conservative: Wait for pullback to broken channel level, enter on rejection and resumption, tighter stop
Volatility-Based Position Sizing:
Adjust position sizing based on channel width (ATR-based volatility):
Wide Channels (High ATR): Reduce position size as stops must be wider, calculate position size using ATR-based risk calculation: Risk / (Stop Distance in ATR × ATR Value)
Narrow Channels (Low ATR): Increase position size as stops can be tighter, be cautious of impending volatility expansion
ATR-Based Risk Management: Use ATR-based risk calculations, position size = 0.01 × Capital / (2 × ATR), use multiples of ATR (1-2 ATR) for adaptive stops
Algorithm Selection Guidelines:
Different market conditions benefit from different algorithm combinations:
Strong Trending Markets: Middle band use EMA or HMA, ATR use RMA, capture trends quickly while maintaining stable channel width
Choppy/Ranging Markets: Middle band use SMA or WMA, ATR use SMA or WMA, avoid false trend signals while identifying genuine reversals
Volatile Markets: Middle band and ATR both use KAMA or FRAMA, self-adjusting to changing market conditions reduces manual optimization
Breakout Trading: Middle band use SMA, ATR use EMA or SMA, stable trend with dynamic channels highlights volatility expansion early
Scalping/Day Trading: Middle band use HMA or T3, ATR use EMA or TEMA, both components respond quickly
Position Trading: Middle band use EMA/TEMA/T3, ATR use RMA or TEMA, filter out noise for long-term trend-following
📋 DETAILED PARAMETER CONFIGURATION
Understanding and optimizing parameters is essential for adapting Keltner Channel Enhanced to specific trading approaches.
Source Parameter:
Close (Most Common): Uses closing price, reflects daily settlement, best for end-of-day analysis and position trading, standard choice
HL2 (Median Price): Smooths out closing bias, better represents full daily range in volatile markets, good for swing trading
HLC3 (Typical Price): Gives more weight to close while including full range, popular for intraday applications, slightly more responsive than HL2
OHLC4 (Average Price): Most comprehensive price representation, smoothest option, good for gap-prone markets or highly volatile instruments
Length Parameter:
Controls the lookback period for middle band (basis) calculation:
Short Periods (10-15): Very responsive to price changes, suitable for day trading and scalping, higher false signal rate
Standard Period (20 - Default): Represents approximately one month of trading, good balance between responsiveness and stability, suitable for swing and position trading
Medium Periods (30-50): Smoother trend identification, fewer false signals, better for position trading and longer holding periods
Long Periods (50+): Very smooth, identifies major trends only, minimal false signals but significant lag, suitable for long-term investment
Optimization by Timeframe: 1-15 minute charts use 10-20 period, 30-60 minute charts use 20-30 period, 4-hour to daily charts use 20-40 period, weekly charts use 20-30 weeks.
ATR Length Parameter:
Controls the lookback period for Average True Range calculation, affecting channel width:
Short ATR Periods (5-10): Very responsive to recent volatility changes, standard is 10 (Keltner's original specification), may be too reactive in whipsaw conditions
Standard ATR Period (10 - Default): Chester Keltner's original specification, good balance between responsiveness and stability, most widely used
Medium ATR Periods (14-20): Smoother channel width, ATR 14 aligns with Wilder's original ATR specification, good for position trading
Long ATR Periods (20+): Very smooth channel width, suitable for long-term trend-following
Length vs. ATR Length Relationship: Equal values (20/20) provide balanced responsiveness, longer ATR (20/14) gives more stable channel width, shorter ATR (20/10) is standard configuration, much shorter ATR (20/5) creates very dynamic channels.
Multiplier Parameter:
Controls channel width by setting ATR multiples:
Lower Values (1.0-1.5): Tighter channels with frequent price touches, more trading signals, higher false signal rate, better for range-bound and mean-reversion strategies
Standard Value (2.0 - Default): Chester Keltner's recommended setting, good balance between signal frequency and reliability, suitable for both trending and ranging strategies
Higher Values (2.5-3.0): Wider channels with less frequent touches, fewer but potentially higher-quality signals, better for strong trending markets
Market-Specific Optimization: High volatility markets (crypto, small-caps) use 2.5-3.0 multiplier, medium volatility markets (major forex, large-caps) use 2.0 multiplier, low volatility markets (bonds, utilities) use 1.5-2.0 multiplier.
MA Type Parameter (Middle Band):
Critical selection that determines trend identification characteristics:
EMA (Exponential Moving Average - Default): Standard Keltner Channel choice, Chester Keltner's original specification, emphasizes recent prices, faster response to trend changes, suitable for all timeframes
SMA (Simple Moving Average): Equal weighting of all data points, no directional bias, slower than EMA, better for ranging markets and mean-reversion
HMA (Hull Moving Average): Minimal lag with smooth output, excellent for fast trend identification, best for day trading and scalping
TEMA (Triple Exponential Moving Average): Advanced smoothing with reduced lag, responsive to trends while filtering noise, suitable for volatile markets
T3 (Tillson T3): Very smooth with minimal lag, excellent for established trend identification, suitable for position trading
KAMA (Kaufman Adaptive Moving Average): Automatically adjusts speed based on market efficiency, slow in ranging markets, fast in trends, suitable for markets with varying conditions
ATR MA Type Parameter:
Determines how Average True Range is smoothed, affecting channel width stability:
RMA (Wilder's Smoothing - Default): J. Welles Wilder's original ATR smoothing method, very smooth, slow to adapt to volatility changes, provides stable channel width
SMA (Simple Moving Average): Equal weighting, moderate smoothness, faster response to volatility changes than RMA, more dynamic channel width
EMA (Exponential Moving Average): Emphasizes recent volatility, quick adaptation to new volatility regimes, very responsive channel width changes
TEMA (Triple Exponential Moving Average): Smooth yet responsive, good balance for varying volatility, suitable for most trading styles
Parameter Combination Strategies:
Conservative Trend-Following: Length 30/ATR Length 20/Multiplier 2.5, MA Type EMA or TEMA/ATR MA Type RMA, smooth trend with stable wide channels, suitable for position trading
Standard Balanced Approach: Length 20/ATR Length 10/Multiplier 2.0, MA Type EMA/ATR MA Type RMA, classic Keltner Channel configuration, suitable for general purpose swing trading
Aggressive Day Trading: Length 10-15/ATR Length 5-7/Multiplier 1.5-2.0, MA Type HMA or EMA/ATR MA Type EMA or SMA, fast trend with dynamic channels, suitable for scalping and day trading
Breakout Specialist: Length 20-30/ATR Length 5-10/Multiplier 2.0, MA Type SMA or WMA/ATR MA Type EMA or SMA, stable trend with responsive channel width
Adaptive All-Conditions: Length 20/ATR Length 10/Multiplier 2.0, MA Type KAMA or FRAMA/ATR MA Type KAMA or TEMA, self-adjusting to market conditions
Offset Parameter:
Controls horizontal positioning of channels on chart. Positive values shift channels to the right (future) for visual projection, negative values shift left (past) for historical analysis, zero (default) aligns with current price bars for real-time signal analysis. Offset affects only visual display, not alert conditions or actual calculations.
📈 PERFORMANCE ANALYSIS & COMPETITIVE ADVANTAGES
Keltner Channel Enhanced provides improvements over standard implementations while maintaining proven effectiveness.
Response Characteristics:
Standard EMA/RMA Configuration: Moderate trend lag (approximately 0.4 × length periods), smooth and stable channel width from RMA smoothing, good balance for most market conditions
Fast HMA/EMA Configuration: Approximately 60% reduction in trend lag compared to EMA, responsive channel width from EMA ATR smoothing, suitable for quick trend changes and breakouts
Adaptive KAMA/KAMA Configuration: Variable lag based on market efficiency, automatic adjustment to trending vs. ranging conditions, self-optimizing behavior reduces manual intervention
Comparison with Traditional Keltner Channels:
Enhanced Version Advantages:
Dual Algorithm Flexibility: Independent MA selection for trend and volatility vs. fixed EMA/RMA, separate tuning of trend responsiveness and channel stability
Market Adaptation: Choose configurations optimized for specific instruments and conditions, customize for scalping, swing, or position trading preferences
Comprehensive Alerts: Enhanced alert system including channel expansion detection
Traditional Version Advantages:
Simplicity: Fewer parameters, easier to understand and implement
Standardization: Fixed EMA/RMA combination ensures consistency across users
Research Base: Decades of backtesting and research on standard configuration
When to Use Enhanced Version: Trading multiple instruments with different characteristics, switching between trending and ranging markets, employing different strategies, algorithm-based trading systems requiring customization, seeking optimization for specific trading style and timeframe.
When to Use Standard Version: Beginning traders learning Keltner Channel concepts, following published research or trading systems, preferring simplicity and standardization, wanting to avoid optimization and curve-fitting risks.
Performance Across Market Conditions:
Strong Trending Markets: EMA or HMA basis with RMA or TEMA ATR smoothing provides quicker trend identification, pullbacks to basis offer excellent entry opportunities
Choppy/Ranging Markets: SMA or WMA basis with RMA ATR smoothing and lower multipliers, channel bounce strategies work well, avoid false breakouts
Volatile Markets: KAMA or FRAMA with EMA or TEMA, adaptive algorithms excel by automatic adjustment, wider multipliers (2.5-3.0) accommodate large price swings
Low Volatility/Consolidation: Channels narrow significantly indicating consolidation, algorithm choice less impactful, focus on detecting channel width contraction for breakout preparation
Keltner Channel vs. Bollinger Bands - Usage Comparison:
Favor Keltner Channels When: Trend-following is primary strategy, trading volatile instruments with gaps, want ATR-based volatility measurement, prefer fewer higher-quality channel touches, seeking stable channel width during trends.
Favor Bollinger Bands When: Mean-reversion is primary strategy, trading instruments with limited gaps, want statistical framework based on standard deviation, need squeeze patterns for breakout identification, prefer more frequent trading opportunities.
Use Both Together: Bollinger Band squeeze + Keltner Channel breakout is powerful combination, price outside Bollinger Bands but inside Keltner Channels indicates moderate signal, price outside both indicates very strong signal, Bollinger Bands for entries and Keltner Channels for trend confirmation.
Limitations and Considerations:
General Limitations:
Lagging Indicator: All moving averages lag price, even with reduced-lag algorithms
Trend-Dependent: Works best in trending markets, less effective in choppy conditions
No Direction Prediction: Indicates volatility and deviation, not future direction, requires confirmation
Enhanced Version Specific Considerations:
Optimization Risk: More parameters increase risk of curve-fitting historical data
Complexity: Additional choices may overwhelm beginning traders
Backtesting Challenges: Different algorithms produce different historical results
Mitigation Strategies:
Use Confirmation: Combine with momentum indicators (RSI, MACD), volume, or price action
Test Parameter Robustness: Ensure parameters work across range of values, not just optimized ones
Multi-Timeframe Analysis: Confirm signals across different timeframes
Proper Risk Management: Use appropriate position sizing and stops
Start Simple: Begin with standard EMA/RMA before exploring alternatives
Optimal Usage Recommendations:
For Maximum Effectiveness:
Start with standard EMA/RMA configuration to understand classic behavior
Experiment with alternatives on demo account or paper trading
Match algorithm combination to market condition and trading style
Use channel width analysis to identify market phases
Combine with complementary indicators for confirmation
Implement strict risk management using ATR-based position sizing
Focus on high-quality setups rather than trading every signal
Respect the trend: trade with basis direction for higher probability
Complementary Indicators:
RSI or Stochastic: Confirm momentum at channel extremes
MACD: Confirm trend direction and momentum shifts
Volume: Validate breakouts and trend strength
ADX: Measure trend strength, avoid Keltner signals in weak trends
Support/Resistance: Combine with traditional levels for high-probability setups
Bollinger Bands: Use together for enhanced breakout and volatility analysis
USAGE NOTES
This indicator is designed for technical analysis and educational purposes. Keltner Channel Enhanced has limitations and should not be used as the sole basis for trading decisions. While the flexible moving average selection for both trend and volatility components provides valuable adaptability across different market conditions, algorithm performance varies with market conditions, and past characteristics do not guarantee future results.
Key considerations:
Always use multiple forms of analysis and confirmation before entering trades
Backtest any parameter combination thoroughly before live trading
Be aware that optimization can lead to curve-fitting if not done carefully
Start with standard EMA/RMA settings and adjust only when specific conditions warrant
Understand that no moving average algorithm can eliminate lag entirely
Consider market regime (trending, ranging, volatile) when selecting parameters
Use ATR-based position sizing and risk management on every trade
Keltner Channels work best in trending markets, less effective in choppy conditions
Respect the trend direction indicated by price position relative to basis line
The enhanced flexibility of dual algorithm selection provides powerful tools for adaptation but requires responsible use, thorough understanding of how different algorithms behave under various market conditions, and disciplined risk management.

GRG/RGR Signal, MA, Ranges and PivotsThis indicator is a combination of several indicators.
It is a combination of two of my indicators which I solely use for trading
1. EMA 10-20-50-200, Pivots and Previous Day/Week/Month range
2. 3/4-Bar GRG / RGR Pattern (Conditional 4th Candle)
You can use them individually if you already have some of them or just use this one. Belive me when I say, this is all you need, along with market structure knowlege and even if you don’t have that, this indicator has been doing wonders for me. This is all I use. I do not use anything else.
**Note - Do checkout the indicators individually as I have added valuable information in the comment section.
It contains the following,
1. 10 EMA/SMA - configurable
2. 20 EMA/SMA - configurable
3. 50 EMA/SMA - configurable
4. 200 EMA/SMA - configurable
5. Previous Day's Range - configurable
6. Previous Week's Range - configurable
7. Previous Month's Range - configurable
8. Pivots - configurable
9. Buy Sell Signal - configurable
The Moving Averages
It is a very important combination and using it correctly with price action will strengthen your entries and exits.
The ema's or sma's added are the most powerful ones and they do definitely act as support and resistance.
The Daily/Weekly/Monthly Ranges
The Daily/Weekly/Monthly ranges are extremely important for any trader and should be used for targets and reversals.
Pivots
Pivots can provide support and resistance level. R5 and S5 can be used to check for over stretched conditions. You can customise them however you like. It is a full pivot indicator.
It is defaulted to show R5 and S5 only to reduce noise in the chart but it can be customised.
The 3/4 RGR or GRG Signal Generator
Combined with a 3/4 RGR or GRG setup can be all a trader needs.
You don't need complex strategies and SMC concepts to trade. Simple EMAs, ranges and RGR/GRG setup is the most winning combination.
This indicator can be used to identify the Green-Red-Green or Red-Green-Red pattern.
It is a price action indicator where a price action which identifies the defeat of buyers and sellers.
If the buyers comprehensively defeat the sellers then the price moves up and if the sellers defeat the buyers then the price moves down.
In my trading experience this is what defines the price movement.
It is a 3 or 4 candle pattern, beyond that i.e, 5 or more candles could mean a very sideways market and unnecessary signal generation.
How does it work?
Upside/Green signal
1. Say candle 1 is Green, which means buyers stepped in, then candle 2 is Red or a Doji, that means sellers brought the price down. Then if candle 3 is forming to be Green and breaks the closing of the 1st candle and opening of the 2nd candle, then a green arrow will appear and that is the place where you want to take your trade.
2. Here the buyers defeated the sellers.
3. Sometimes candle 3 falls short but candle 4 breaks candle 1's closing and candle 2's opening price. We can enter on candle 4.
4. Important - We need to enter the trade as soon as the price moves above the candle 1 and 2's body and should not wait for the 3rd or 4th candle to close. Ignore wicks.
5. But for a more optimised entry I have added an option to use candle’s highs and lows instead of open and close. This reduces lot of noise and provides us with more precise entry. This setting is turned on by default.
6. I have restricted it to 4 candles and that is all that is needed. More than that is a longer sideways market.
7. I call it the +-+ or GRG pattern or Green-Red-Green or Buyer-Seller-Buyer or Seller defeated or just Buyer pattern.
8. Stop loss can be candle 2's mid for safe traders (that includes me) or candle 2's body low for risky traders.
9. Back testing suggests that body low will be useless and result in more points in loss because for the bigger move this point will not be touched, so why not get out faster.
Downside/Red signal
1. Say candle 1 is Red, which means sellers stepped in, then candle 2 is Green or a Doji, that means buyers took the price up. Then if candle 3 is forming to be Red and breaks the closing of the 1st candle and opening of the 2nd candle then a Red arrow will appear and that is the place where you want to take your trade.
2. Sometimes candle 3 falls short but candle 4 breaks candle 1's closing and candle 2's opening price. We can enter on candle 4.
3. We need to enter the trade as soon as the price moves below the candle 1 and 2's body and should not wait for the 3rd or 4th candle to close.
4. But for a more optimised entry I have added an option to use candle’s highs and lows instead of open and close. This reduces lot of noise and provides us with more precise entry. This setting is turned on by default.
5. I have restricted it to 4 candles and that is all that is needed. More than that is a longer sideways market.
6. I call it the -+- or RGR pattern or Red-Green-Red or Seller-Buyer-Seller or Buyer defeated or just Seller pattern.
7. Stop loss can be candle 2's mid for safe traders ( that includes me) or candle 2's body high for risky traders.
8. Back testing suggests that body high will be useless and result in more points in loss because for the bigger move this point will not be touched, so why not get out faster.
Combining Indicators and Signal
Combining these indicators with GRG/RGR signal can be very powerful and can provide big moves.
1. MA crossover and Signal - This is very powerful and provides a very big move. Trades can be held for longer. If after taking the trade we notice that the MA crossover has happened then trades can be held for higher targets.
2. Pivots and Signal - Pivots and add a support or resistance point. Take profits on these points. R5/S5 are over streched conditions so we can start looking for reversal signals and ignore other signals
3. Intraday Range - first 1, 5, 15 min of the day - Sideways days is when price will stay in these ranges. You can take profits at these ranges or if the range is broken and we get a signal, then it can mean that the direction will be sustained.
4. Previous Day/Week/Month Ranges - These can be used as Take Profit points if the price is moving towards them after getting the signal. If the range is broken and we get a signal then it can be a strong signal. They can also be used as reversal points if a strong signal is generated.
Important Settings
1. Include 4th Candle Confirmation - You can enable or disable the 4th candle signal to avoid the noise, but at times I have noticed that the 4th candle gives a very strong signal or I can say that the strong signal falls on the 4th candle. This is mostly a coincidence.
2. Bars to check (default 10) - You can also configure how many previous bars should the signal be generated for. 10 to 30 is good enough. To backtest increase it to 2000 or 5000 for example.
3. Use Candle High/Low for confirmation instead of Candle Open/Close - More optimized entry and noise reduction. This option is now defaulted to false.
4. Show Green-Red-Green (bull) signals - Show only bull entries. Useful when I have a predefined view i.e, I know market is going to go up today.
5. Show Red-Green-Red (bear) signals - Show only bear entries. Useful when I have a predefined view i.e, I know market is going to go down today.
6. 3rd candle should be a Strong candle before considering 4th candle - This will enforce additional logic in 4 candle setup that the 3rd candle is the candle in our direction of breakout. This means something like GRGG is mandatory, which is still the default behaviour. If disabled, the 3rd candle can be any candle and 4th candle will act as our breakout candle. This behaviour has led to breakouts and breakdowns as times, hence I added this as a separate feature. Vice-versa for a RGGR.
For a 4 candle setup till now we were expecting GRGG or RGRR but we can let the system ignore the 3rd candle completely if needed.
This will result in additional signals.
7. Three intraday ranges added for index and stock traders - 1 min, 5 min and 15 min ranges will be displayed. These are disabled by default except 15 min. These are very important ranges and in sideways days the price will usually move within the 15 min. A breakout of this range and a positive signal can be a very powerful setup.
Safe traders can avoid taking a trade in this range as it can lead to fakeouts.
The line style, width, color and opacity are configurable.
Pointers/Golden Rules
1. If after taking the trade, the next candle moves in your direction and closes strong bullish or bearish, then move SL to break even and after that you can trail it.
2. If a upside trade hits SL and immediately a down side trade signal is generated on the next candle then take it. Vice versa is true.
3. Trades need to be taken on previous 2 candle's body high or low combined and not the wicks.
4. The most losses a trader takes is on a sideways day and because in our strategy the stop loss is so small that even on a sideways day we'll get out with a little profit or worst break even.
5. Hold trades for longer targets and don't panic.
6. If last 3-4 days have been sideways then there is a good probability that today will be trending so we can hold our trade for longer targets. Inverse is true when the market has been trending for 2-3 days then volatility followed by sideways is coming (DOW theory). Target to hold the trade for whole day and not exit till the day closes.
7. In general avoid trading in the middle of the day for index and stocks. Divide the day into 3 parts and avoid the middle.
8. Use Support/Resistance, 10, 20, 50, 200 EMA/SMA, Gaps, Whole/Round numbers(very imp) for identifying targets.
9. Trail your SL.
10. For indexes I would use 5 min and 15 min timeframe and at times 10 mins.
11. For commodities and crypto we can use higher timeframe as well. Look for signals during volatile time durations and avoid trading the whole day. Signal usually gives good targets on those times.
12. If a GRG or RGR pattern appears on a daily timeframe then this is our time to go big.
13. Minimum Risk to Reward should be 1:2 and for longer targets can be 1:4 to 1:10.
14. Trade with small lot size. Money management will happen automatically.
15. With small lot size and correct Risk-Reward we can be very profitable. Don't trade with big lot size.
16. Stay in the market for longer and collect points not money.
17. Very imp - Watch market and learn to generate a market view.
18. Very imp - Only 3 type of candles are needed in trading -
Strong Bullish (Big Green candle), Strong Bearish (Big Red candle),
Hammer (it is Strong Bullish), Inverse Hammer (it is Strong Bearish)
and Doji (indecision or confusion).
If on daily timeframe I see Strong Bullish candle previous day then I am biased to the upside the next day, if I see Strong Bearish candle the previous day then I am biased to the downside the next day, if I see Doji on the previous day then I am cautious the next day, if there are back to back Dojis forming in daily or weekly then I am preparing for big move so time to go big once I get the signal.
19. Most Important Candlestick pattern - Bullish and Bearish Engulfing
20. The only Chart patterns I need -
a) Falling Wedge/Channel Bullish Pattern Uptrend or Bull Flag - Buying - Forming over a couple days for intraday and forming over a couple of weeks for swing
b) Falling Wedge/Channel Bullish Pattern Downtrend or Falling Channel - Buying
c) Rising Wedge Bearish Pattern Uptrend or Rising Channel - Selling
d) Rising Wedge Bearish Pattern Downtrend or Bear flag - Selling
e) Head and Shoulder - Over a longer period not for intraday. In 15 min takes few days and for swing 1hr or 4h or daily can take few days
f) M and W pattern - Reversal Patterns - They form within the above 4 patterns, usually resulting in the break of trend line
21. How Gaps work -
a) Small Gap up in Uptrend - Market can fill the gap and reverse. The perception is that people are buying. If previous day candle was Strong Bullish then market view is up.
b) Big Gap up in Uptrend - Not news driven - Profit booking will come but may not fill the entire gap
c) Big Gap up in Uptrend - News driven, war related, tax, interest rate - Market can keep going up without stopping.
c) Flat opening in Uptrend - Big chance of market going up. If previous day candle was Strong Bullish then view is upwards, if it was Doji then still upwards.
d) Gap down in Uptrend - Market is surprised. After going down initially it can go up
e) Small Gap down in Downtrend - Market can fill the gap and keep moving down. If previous day candle was Strong Bearish then view is still down.
f) Flat opening in Downtrend - View is down, short today.
g) Big Gap down in Downtrend - Profit booking and foolish buying will come but market view is still down.
h) Gap down with News - Volatility, sideways then down.
i) Gap Up in Downtrend - Can move up - Price can move up during 2/3rd of the day and End of the day revert and close in red.
22. Go big on bearish days for option traders. Puts are better bought and Calls are better sold.
23. Cluster of green signals can lead to bigger move on the upside and vice versa for red signals.
24. Most of this is what I learned from successful traders (from the top 2%) only the indicator is mine.

MULTI-CONDITION RSI SIGNAL GENERATOR═══════════════════════════════════════════════
MULTI-CONDITION RSI SIGNAL GENERATOR
═══════════════════════════════════════════════
OVERVIEW:
This indicator generates trading signals based on Relative Strength Index (RSI) movements with multiple confirmation layers designed to filter false signals and identify high-probability reversal opportunities.
═══════════════════════════════════════════════
WHAT MAKES THIS ORIGINAL:
═══════════════════════════════════════════════
Unlike basic RSI indicators that simply plot overbought/oversold crossovers, this system combines FOUR distinct confirmation mechanisms:
1. PERSISTENCE FILTERING - Requires RSI to remain in extreme zones for a minimum duration
2. LOOKBACK VALIDATION - Verifies recent extreme zone visits before signaling
3. DIVERGENCE DETECTION - Identifies price/RSI divergence for stronger signals
4. MOMENTUM CONFIRMATION - Provides trend-continuation entries via midline crosses
This multi-layered approach significantly reduces whipsaw trades that plague simple RSI crossover systems.
═══════════════════════════════════════════════
HOW IT WORKS (TECHNICAL METHODOLOGY):
═══════════════════════════════════════════════
STEP 1: RSI CALCULATION
- Standard RSI calculation using user-defined period (default: 14)
- Monitors two extreme zones: Overbought (default: 70) and Oversold (default: 30)
STEP 2: PERSISTENCE FILTERING
The script counts how many bars RSI has spent in extreme zones within the lookback period:
- For overbought signals: Counts bars where RSI > 70
- For oversold signals: Counts bars where RSI < 30
- Signal only triggers if count >= Minimum Duration (default: 4 bars)
This filters out brief spikes that immediately reverse, focusing on sustained extreme conditions that are more likely to lead to genuine reversals.
STEP 3: LOOKBACK VALIDATION
- Checks if RSI reached extreme zones within the Lookback Bars period (default: 20)
- Uses ta.highest() and ta.lowest() functions to verify recent extremes
- Ensures we're trading reversals from meaningful extremes, not random crossovers
STEP 4: BASIC SIGNAL GENERATION
- BUY SIGNAL: RSI crosses above the oversold level (30) after meeting persistence and lookback conditions
- SELL SIGNAL: RSI crosses below the overbought level (70) after meeting persistence and lookback conditions
STEP 5: DIVERGENCE DETECTION
The script identifies two types of divergence over the Divergence Lookback period (default: 5 bars):
A) BULLISH DIVERGENCE (indicates potential upward reversal):
- Price makes a lower low (current low < previous low)
- RSI makes a higher low (current RSI low > previous RSI low)
- Suggests weakening downward momentum
B) BEARISH DIVERGENCE (indicates potential downward reversal):
- Price makes a higher high (current high > previous high)
- RSI makes a lower high (current RSI high < previous RSI high)
- Suggests weakening upward momentum
STEP 6: STRONG SIGNAL CONFIRMATION
- STRONG BUY: Basic buy signal + bullish divergence present
- STRONG SELL: Basic sell signal + bearish divergence present
- These represent the highest-probability setups
STEP 7: MOMENTUM SIGNALS (OPTIONAL)
- MOMENTUM BUY: RSI crosses above 50 after being oversold (trend continuation)
- MOMENTUM SELL: RSI crosses below 50 after being overbought (trend continuation)
- Smaller signals for traders who want trend-following entries
═══════════════════════════════════════════════
SIGNAL TYPES AND VISUAL INDICATORS:
═══════════════════════════════════════════════
📈 GREEN TRIANGLE (below bar) - Standard Buy Signal
RSI crossed above oversold level with confirmation filters
📉 RED TRIANGLE (above bar) - Standard Sell Signal
RSI crossed below overbought level with confirmation filters
🔵 BLUE TRIANGLE (below bar) - Strong Buy Signal
Buy signal + bullish divergence (HIGHEST PRIORITY)
🟣 PURPLE TRIANGLE (above bar) - Strong Sell Signal
Sell signal + bearish divergence (HIGHEST PRIORITY)
🟢 GREEN CIRCLE (small) - Momentum Buy
RSI crosses above 50 after oversold conditions
🔴 RED CIRCLE (small) - Momentum Sell
RSI crosses below 50 after overbought conditions
BACKGROUND SHADING:
- Light red background: RSI currently overbought
- Light green background: RSI currently oversold
═══════════════════════════════════════════════
PARAMETER SETTINGS:
═══════════════════════════════════════════════
1. OVERBOUGHT LEVEL (default: 70, range: 50-90)
- Higher values = fewer but stronger overbought signals
- Lower values = more sensitive to overbought conditions
- Recommended: 70 for standard markets, 80 for crypto/volatile assets
2. OVERSOLD LEVEL (default: 30, range: 10-50)
- Lower values = fewer but stronger oversold signals
- Higher values = more sensitive to oversold conditions
- Recommended: 30 for standard markets, 20 for crypto/volatile assets
3. RSI PERIOD (default: 14, range: 2-50)
- Standard RSI calculation period
- Lower = more sensitive/faster signals
- Higher = smoother/slower signals
- Recommended: 14 (industry standard)
4. MINIMUM DURATION (default: 4, range: 1-20)
- Required bars in extreme zone before signal
- Higher values = fewer signals but better quality
- Lower values = more signals but more false positives
- Recommended: 3-5 for day trading, 5-10 for swing trading
5. LOOKBACK BARS (default: 20, range: 5-100)
- How far back to check for extreme zone visits
- Should match your typical trading timeframe
- Recommended: 20 for intraday, 50 for daily charts
6. DIVERGENCE LOOKBACK (default: 5, range: 2-20)
- Period for comparing price/RSI highs and lows
- Lower values = more frequent divergence signals
- Higher values = more significant divergences
- Recommended: 5-10 depending on timeframe
═══════════════════════════════════════════════
HOW TO USE THIS INDICATOR:
═══════════════════════════════════════════════
RECOMMENDED TRADING APPROACH:
1. PRIMARY ENTRIES: Focus on Strong Buy/Sell signals (blue/purple triangles)
- These have the highest win rate due to divergence confirmation
- Wait for price action confirmation (support/resistance, candlestick patterns)
2. SECONDARY ENTRIES: Regular Buy/Sell signals (green/red triangles)
- Use these when Strong signals are infrequent
- Require additional confirmation from other indicators or chart patterns
3. TREND CONTINUATION: Momentum signals (small circles)
- Best used when overall trend is clear
- Not recommended for reversal trading
4. FILTER TRADES: Use background shading as context
- Be cautious entering longs when background is red (overbought)
- Be cautious entering shorts when background is green (oversold)
RISK MANAGEMENT GUIDELINES:
- Never risk more than 2-5% of capital per trade
- Use stop losses below recent swing lows (buys) or above swing highs (sells)
- Target at least 1.5:1 reward-to-risk ratio
- Consider position sizing based on signal strength
TIMEFRAME RECOMMENDATIONS:
- 15min - 1hour: Day trading with adjusted parameters (lower minimum duration)
- 4hour - Daily: Swing trading with default parameters
- Weekly: Position trading with increased lookback periods
COMPLEMENTARY TOOLS:
This indicator works best when combined with:
- Support and resistance levels
- Trend indicators (moving averages, trend lines)
- Volume analysis
- Price action patterns (engulfing candles, pin bars)
═══════════════════════════════════════════════
LIMITATIONS AND CONSIDERATIONS:
═══════════════════════════════════════════════
- This is NOT a standalone trading system - requires additional analysis
- RSI-based strategies perform best in ranging/choppy markets
- May generate fewer signals in strong trending markets
- Divergence signals can be early - wait for price confirmation
- Not recommended for highly illiquid assets
- Backtest on your specific market before live trading
- No indicator is 100% accurate - always use proper risk management
═══════════════════════════════════════════════
TECHNICAL NOTES:
═══════════════════════════════════════════════
- Code is original and does not reuse external libraries
- Uses Pine Script v5 native functions only
- Alert conditions included for all signal types
- No repainting - signals appear and remain fixed
- Efficient calculation methods minimize processing load
═══════════════════════════════════════════════
ALERT SETUP:
═══════════════════════════════════════════════
Four alert conditions are available:
1. "Buy Alert" - Triggers on standard buy signals
2. "Sell Alert" - Triggers on standard sell signals
3. "Strong Buy Alert" - Triggers on divergence-confirmed buy signals
4. "Strong Sell Alert" - Triggers on divergence-confirmed sell signals
To set up alerts: Right-click chart → Add Alert → Select desired condition
═══════════════════════════════════════════════
This indicator is provided for educational and informational purposes. Always practice proper risk management and never trade with money you cannot afford to lose.

SMC - Institutional Confidence Oscillator [PhenLabs]📊 Institutional Confidence Oscillator
Version: PineScript™v6
📌 Description
The Institutional Confidence Oscillator (ICO) revolutionizes market analysis by automatically detecting and evaluating institutional activity at key support and resistance levels using our own in-house detection system. This sophisticated indicator combines volume analysis, volatility measurements, and mathematical confidence algorithms to provide real-time readings of institutional sentiment and zone strength.
Using our advanced thin liquidity detection, the ICO identifies high-volume, narrow-range bars that signal institutional zone formation, then tracks how these zones perform under market pressure. The result is a dual-wave confidence oscillator that shows traders when institutions are actively defending price levels versus when they’re abandoning positions.
The indicator transforms complex institutional behavior patterns into clear, actionable confidence percentiles, helping traders align with smart money movements and avoid common retail trading pitfalls.
🚀 Points of Innovation
Automated thin liquidity zone detection using volume threshold multipliers and zone size filtering
Dual-sided confidence tracking for both support and resistance levels simultaneously
Sigmoid function processing for enhanced mathematical accuracy in confidence calculations
Real-time institutional defense pattern analysis through complete test cycles
Advanced visual smoothing options with multiple algorithmic methods (EMA, SMA, WMA, ALMA)
Integrated momentum indicators and gradient visualization for enhanced signal clarity
🔧 Core Components
Volume Threshold System: Analyzes volume ratios against baseline averages to identify institutional activity spikes
Zone Detection Algorithm: Automatically identifies thin liquidity zones based on customizable volume and size parameters
Confidence Lifecycle Engine: Tracks institutional defense patterns through complete observation windows
Mathematical Processing Core: Uses sigmoid functions to convert raw market data into normalized confidence percentiles
Visual Enhancement Suite: Provides multiple smoothing methods and customizable display options for optimal chart interpretation
🔥 Key Features
Auto-Detection Technology: Automatically scans for institutional zones without manual intervention, saving analysis time
Dual Confidence Tracking: Simultaneously monitors both support and resistance institutional activity for comprehensive market view
Smart Zone Validation: Evaluates zone strength through volume analysis, adverse excursion measurement, and defense success rates
Customizable Parameters: Extensive input options for volume thresholds, observation windows, and visual preferences
Real-Time Updates: Continuously processes market data to provide current institutional confidence readings
Enhanced Visualization: Features gradient fills, momentum indicators, and information panels for clear signal interpretation
🎨 Visualization
Dual Oscillator Lines: Support confidence (cyan) and resistance confidence (red) plotted as percentage values 0-100%
Gradient Fill Areas: Color-coded regions showing confidence dominance and strength levels
Reference Grid Lines: Horizontal markers at 25%, 50%, and 75% levels for easy interpretation
Information Panel: Real-time display of current confidence percentiles with color-coded dominance indicators
Momentum Indicators: Rate of change visualization for confidence trends
Background Highlights: Extreme confidence level alerts when readings exceed 80%
📖 Usage Guidelines
Auto-Detection Settings
Use Auto-Detection
Default: true
Description: Enables automatic thin liquidity zone identification based on volume and size criteria
Volume Threshold Multiplier
Default: 6.0, Range: 1.0+
Description: Controls sensitivity of volume spike detection for zone identification, higher values require more significant volume increases
Volume MA Length
Default: 15, Range: 1+
Description: Period for volume moving average baseline calculation, affects volume spike sensitivity
Max Zone Height %
Default: 0.5%, Range: 0.05%+
Description: Filters out wide price bars, keeping only thin liquidity zones as percentage of current price
Confidence Logic Settings
Test Observation Window
Default: 20 bars, Range: 2+
Description: Number of bars to monitor zone tests for confidence calculation, longer windows provide more stable readings
Clean Break Threshold
Default: 1.5 ATR, Range: 0.1+
Description: ATR multiple required for zone invalidation, higher values make zones more persistent
Visual Settings
Smoothing Method
Default: EMA, Options: SMA/EMA/WMA/ALMA
Description: Algorithm for signal smoothing, EMA responds faster while SMA provides more stability
Smoothing Length
Default: 5, Range: 1-50
Description: Period for smoothing calculation, higher values create smoother lines with more lag
✅ Best Use Cases
Trending market analysis where institutional zones provide reliable support/resistance levels
Breakout confirmation by validating zone strength before position entry
Divergence analysis when confidence shifts between support and resistance levels
Risk management through identification of high-confidence institutional backing
Market structure analysis for understanding institutional sentiment changes
⚠️ Limitations
Performs best in liquid markets with clear institutional participation
May produce false signals during low-volume or holiday trading periods
Requires sufficient price history for accurate confidence calculations
Confidence readings can fluctuate rapidly during high-impact news events
Manual fallback zones may not reflect actual institutional activity
💡 What Makes This Unique
Automated Detection: First Pine Script indicator to automatically identify thin liquidity zones using sophisticated volume analysis
Dual-Sided Analysis: Simultaneously tracks institutional confidence for both support and resistance levels
Mathematical Precision: Uses sigmoid functions for enhanced accuracy in confidence percentage calculations
Real-Time Processing: Continuously evaluates institutional defense patterns as market conditions change
Visual Innovation: Advanced smoothing options and gradient visualization for superior chart clarity
🔬 How It Works
1. Zone Identification Process:
Scans for high-volume bars that exceed the volume threshold multiplier
Filters bars by maximum zone height percentage to identify thin liquidity conditions
Stores qualified zones with proximity threshold filtering for relevance
2. Confidence Calculation Process:
Monitors price interaction with identified zones during observation windows
Measures volume ratios and adverse excursions during zone tests
Applies sigmoid function processing to normalize raw data into confidence percentiles
3. Real-Time Analysis Process:
Continuously updates confidence readings as new market data becomes available
Tracks institutional defense success rates and zone validation patterns
Provides visual and numerical feedback through the oscillator display
💡 Note:
The ICO works best when combined with traditional technical analysis and proper risk management. Higher confidence readings indicate stronger institutional backing but should be confirmed with price action and volume analysis. Consider using multiple timeframes for comprehensive market structure understanding.

SCTI V30Description
The SCTI V30 is an advanced multi-functional technical analysis indicator for TradingView that combines multiple analytical approaches into a single comprehensive tool. This indicator provides:
Multiple Moving Average Types (EMA, SMA, PMA with various calculation methods)
Customizable VWAP with standard deviation bands
Sophisticated Divergence Detection across 12 different indicators
Volume Profile Analysis with peak/trough detection
Highly Configurable Display Options
The indicator is designed to help traders identify trends, potential reversals, and key support/resistance levels across different timeframes.
Features
1. Moving Average Systems
EMA Section: 13 configurable EMA periods (8, 13, 21, 34, 55, 89, 144, 233, 377, 610, 987, 1597, 2584)
SMA Section: 13 configurable SMA periods (same as EMA)
PMA Section: 11 customizable moving averages with multiple calculation methods:
ALMA, EMA, RMA, SMA, SWMA, VWAP, VWMA, WMA
Adjustable lengths from 12 to 1056
Customizable colors, widths, and fill options between MAs
2. VWAP Implementation
Multiple anchor periods (Session, Week, Month, Quarter, Year, etc.)
Standard deviation or percentage-based bands
Option to hide on daily/weekly/monthly timeframes
Customizable band multipliers (1.0, 2.0, 3.0)
3. Divergence Detection
Detects regular and hidden divergences across 12 indicators:
MACD, MACD Histogram, RSI, Stochastic, CCI, Momentum
OBV, VW-MACD, Chaikin Money Flow, Money Flow Index
Williams %R, and custom external indicators
Customizable detection parameters:
Pivot point period (1-50)
Source (Close or High/Low)
Divergence type (Regular, Hidden, or Both)
Minimum number of divergences required (1-11)
Maximum pivot points to check (1-20)
Maximum bars to look back (30-200)
4. Volume Profile Analysis
Configurable profile length (10-5000 bars)
Value Area threshold (0-100%)
Profile placement (Left or Right)
Number of rows (30-130)
Profile width adjustment
Volume node detection:
Peaks (with cluster option)
Troughs (with cluster option)
Highest/Lowest volume nodes
Customizable colors for all elements
Input Parameters
The indicator is organized into 7 parameter groups:
Basic Indicator Settings - Toggle visibility of main components
EMA Settings - Configure 13 EMA periods and visibility
SMA Settings - Configure 13 SMA periods and visibility
PMA Settings - Advanced moving average configuration
VWAP Settings - Volume-weighted average price configuration
Divergence Settings - Comprehensive divergence detection options
Volume Profile & Node Detection - Volume analysis configuration
How to Use
Trend Identification: Use the multiple moving averages to identify trend direction and strength. The Fibonacci-based periods (21, 34, 55, 89, 144, etc.) are particularly useful for this.
Support/Resistance: The VWAP and volume profile components help identify key support/resistance levels.
Divergence Trading: Look for divergences between price and the various indicators to spot potential reversal points.
Volume Analysis: The volume profile shows where the most trading activity occurred, highlighting important price levels.
Customization: Adjust the settings to match your trading style and timeframe. The indicator is highly configurable to suit different trading approaches.
Alerts
The indicator includes alert conditions for:
Positive regular divergence detected
Negative regular divergence detected
Positive hidden divergence detected
Negative hidden divergence detected
Any positive divergence (regular or hidden)
Any negative divergence (regular or hidden)
Notes
The indicator may be resource-intensive due to its comprehensive calculations, especially on lower timeframes with long lookback periods.
Some features (like VWAP) can be hidden on higher timeframes to improve performance.
The default settings are optimized for daily charts but can be adjusted for any timeframe.
This powerful all-in-one indicator provides traders with a complete toolkit for technical analysis, combining trend-following, momentum, volume, and divergence techniques into a single, customizable solution.

Bear Market Probability Model# Bear Market Probability Model: A Multi-Factor Risk Assessment Framework
The Bear Market Probability Model represents a comprehensive quantitative framework for assessing systemic market risk through the integration of 13 distinct risk factors across four analytical categories: macroeconomic indicators, technical analysis factors, market sentiment measures, and market breadth metrics. This indicator synthesizes established financial research methodologies to provide real-time probabilistic assessments of impending bear market conditions, offering institutional-grade risk management capabilities to retail and professional traders alike.
## Theoretical Foundation
### Historical Context of Bear Market Prediction
Bear market prediction has been a central focus of financial research since the seminal work of Dow (1901) and the subsequent development of technical analysis theory. The challenge of predicting market downturns gained renewed academic attention following the market crashes of 1929, 1987, 2000, and 2008, leading to the development of sophisticated multi-factor models.
Fama and French (1989) demonstrated that certain financial variables possess predictive power for stock returns, particularly during market stress periods. Their three-factor model laid the groundwork for multi-dimensional risk assessment, which this indicator extends through the incorporation of real-time market microstructure data.
### Methodological Framework
The model employs a weighted composite scoring methodology based on the theoretical framework established by Campbell and Shiller (1998) for market valuation assessment, extended through the incorporation of high-frequency sentiment and technical indicators as proposed by Baker and Wurgler (2006) in their seminal work on investor sentiment.
The mathematical foundation follows the general form:
Bear Market Probability = Σ(Wi × Ci) / ΣWi × 100
Where:
- Wi = Category weight (i = 1,2,3,4)
- Ci = Normalized category score
- Categories: Macroeconomic, Technical, Sentiment, Breadth
## Component Analysis
### 1. Macroeconomic Risk Factors
#### Yield Curve Analysis
The inclusion of yield curve inversion as a primary predictor follows extensive research by Estrella and Mishkin (1998), who demonstrated that the term spread between 3-month and 10-year Treasury securities has historically preceded all major recessions since 1969. The model incorporates both the 2Y-10Y and 3M-10Y spreads to capture different aspects of monetary policy expectations.
Implementation:
- 2Y-10Y Spread: Captures market expectations of monetary policy trajectory
- 3M-10Y Spread: Traditional recession predictor with 12-18 month lead time
Scientific Basis: Harvey (1988) and subsequent research by Ang, Piazzesi, and Wei (2006) established the theoretical foundation linking yield curve inversions to economic contractions through the expectations hypothesis of the term structure.
#### Credit Risk Premium Assessment
High-yield credit spreads serve as a real-time gauge of systemic risk, following the methodology established by Gilchrist and Zakrajšek (2012) in their excess bond premium research. The model incorporates the ICE BofA High Yield Master II Option-Adjusted Spread as a proxy for credit market stress.
Threshold Calibration:
- Normal conditions: < 350 basis points
- Elevated risk: 350-500 basis points
- Severe stress: > 500 basis points
#### Currency and Commodity Stress Indicators
The US Dollar Index (DXY) momentum serves as a risk-off indicator, while the Gold-to-Oil ratio captures commodity market stress dynamics. This approach follows the methodology of Akram (2009) and Beckmann, Berger, and Czudaj (2015) in analyzing commodity-currency relationships during market stress.
### 2. Technical Analysis Factors
#### Multi-Timeframe Moving Average Analysis
The technical component incorporates the well-established moving average convergence methodology, drawing from the work of Brock, Lakonishok, and LeBaron (1992), who provided empirical evidence for the profitability of technical trading rules.
Implementation:
- Price relative to 50-day and 200-day simple moving averages
- Moving average convergence/divergence analysis
- Multi-timeframe MACD assessment (daily and weekly)
#### Momentum and Volatility Analysis
The model integrates Relative Strength Index (RSI) analysis following Wilder's (1978) original methodology, combined with maximum drawdown analysis based on the work of Magdon-Ismail and Atiya (2004) on optimal drawdown measurement.
### 3. Market Sentiment Factors
#### Volatility Index Analysis
The VIX component follows the established research of Whaley (2009) and subsequent work by Bekaert and Hoerova (2014) on VIX as a predictor of market stress. The model incorporates both absolute VIX levels and relative VIX spikes compared to the 20-day moving average.
Calibration:
- Low volatility: VIX < 20
- Elevated concern: VIX 20-25
- High fear: VIX > 25
- Panic conditions: VIX > 30
#### Put-Call Ratio Analysis
Options flow analysis through put-call ratios provides insight into sophisticated investor positioning, following the methodology established by Pan and Poteshman (2006) in their analysis of informed trading in options markets.
### 4. Market Breadth Factors
#### Advance-Decline Analysis
Market breadth assessment follows the classic work of Fosback (1976) and subsequent research by Brown and Cliff (2004) on market breadth as a predictor of future returns.
Components:
- Daily advance-decline ratio
- Advance-decline line momentum
- McClellan Oscillator (Ema19 - Ema39 of A-D difference)
#### New Highs-New Lows Analysis
The new highs-new lows ratio serves as a market leadership indicator, based on the research of Zweig (1986) and validated in academic literature by Zarowin (1990).
## Dynamic Threshold Methodology
The model incorporates adaptive thresholds based on rolling volatility and trend analysis, following the methodology established by Pagan and Sossounov (2003) for business cycle dating. This approach allows the model to adjust sensitivity based on prevailing market conditions.
Dynamic Threshold Calculation:
- Warning Level: Base threshold ± (Volatility × 1.0)
- Danger Level: Base threshold ± (Volatility × 1.5)
- Bounds: ±10-20 points from base threshold
## Professional Implementation
### Institutional Usage Patterns
Professional risk managers typically employ multi-factor bear market models in several contexts:
#### 1. Portfolio Risk Management
- Tactical Asset Allocation: Reducing equity exposure when probability exceeds 60-70%
- Hedging Strategies: Implementing protective puts or VIX calls when warning thresholds are breached
- Sector Rotation: Shifting from growth to defensive sectors during elevated risk periods
#### 2. Risk Budgeting
- Value-at-Risk Adjustment: Incorporating bear market probability into VaR calculations
- Stress Testing: Using probability levels to calibrate stress test scenarios
- Capital Requirements: Adjusting regulatory capital based on systemic risk assessment
#### 3. Client Communication
- Risk Reporting: Quantifying market risk for client presentations
- Investment Committee Decisions: Providing objective risk metrics for strategic decisions
- Performance Attribution: Explaining defensive positioning during market stress
### Implementation Framework
Professional traders typically implement such models through:
#### Signal Hierarchy:
1. Probability < 30%: Normal risk positioning
2. Probability 30-50%: Increased hedging, reduced leverage
3. Probability 50-70%: Defensive positioning, cash building
4. Probability > 70%: Maximum defensive posture, short exposure consideration
#### Risk Management Integration:
- Position Sizing: Inverse relationship between probability and position size
- Stop-Loss Adjustment: Tighter stops during elevated risk periods
- Correlation Monitoring: Increased attention to cross-asset correlations
## Strengths and Advantages
### 1. Comprehensive Coverage
The model's primary strength lies in its multi-dimensional approach, avoiding the single-factor bias that has historically plagued market timing models. By incorporating macroeconomic, technical, sentiment, and breadth factors, the model provides robust risk assessment across different market regimes.
### 2. Dynamic Adaptability
The adaptive threshold mechanism allows the model to adjust sensitivity based on prevailing volatility conditions, reducing false signals during low-volatility periods and maintaining sensitivity during high-volatility regimes.
### 3. Real-Time Processing
Unlike traditional academic models that rely on monthly or quarterly data, this indicator processes daily market data, providing timely risk assessment for active portfolio management.
### 4. Transparency and Interpretability
The component-based structure allows users to understand which factors are driving risk assessment, enabling informed decision-making about model signals.
### 5. Historical Validation
Each component has been validated in academic literature, providing theoretical foundation for the model's predictive power.
## Limitations and Weaknesses
### 1. Data Dependencies
The model's effectiveness depends heavily on the availability and quality of real-time economic data. Federal Reserve Economic Data (FRED) updates may have lags that could impact model responsiveness during rapidly evolving market conditions.
### 2. Regime Change Sensitivity
Like most quantitative models, the indicator may struggle during unprecedented market conditions or structural regime changes where historical relationships break down (Taleb, 2007).
### 3. False Signal Risk
Multi-factor models inherently face the challenge of balancing sensitivity with specificity. The model may generate false positive signals during normal market volatility periods.
### 4. Currency and Geographic Bias
The model focuses primarily on US market indicators, potentially limiting its effectiveness for global portfolio management or non-USD denominated assets.
### 5. Correlation Breakdown
During extreme market stress, correlations between risk factors may increase dramatically, reducing the model's diversification benefits (Forbes and Rigobon, 2002).
## References
Akram, Q. F. (2009). Commodity prices, interest rates and the dollar. Energy Economics, 31(6), 838-851.
Ang, A., Piazzesi, M., & Wei, M. (2006). What does the yield curve tell us about GDP growth? Journal of Econometrics, 131(1-2), 359-403.
Baker, M., & Wurgler, J. (2006). Investor sentiment and the cross‐section of stock returns. The Journal of Finance, 61(4), 1645-1680.
Baker, S. R., Bloom, N., & Davis, S. J. (2016). Measuring economic policy uncertainty. The Quarterly Journal of Economics, 131(4), 1593-1636.
Barber, B. M., & Odean, T. (2001). Boys will be boys: Gender, overconfidence, and common stock investment. The Quarterly Journal of Economics, 116(1), 261-292.
Beckmann, J., Berger, T., & Czudaj, R. (2015). Does gold act as a hedge or a safe haven for stocks? A smooth transition approach. Economic Modelling, 48, 16-24.
Bekaert, G., & Hoerova, M. (2014). The VIX, the variance premium and stock market volatility. Journal of Econometrics, 183(2), 181-192.
Brock, W., Lakonishok, J., & LeBaron, B. (1992). Simple technical trading rules and the stochastic properties of stock returns. The Journal of Finance, 47(5), 1731-1764.
Brown, G. W., & Cliff, M. T. (2004). Investor sentiment and the near-term stock market. Journal of Empirical Finance, 11(1), 1-27.
Campbell, J. Y., & Shiller, R. J. (1998). Valuation ratios and the long-run stock market outlook. The Journal of Portfolio Management, 24(2), 11-26.
Dow, C. H. (1901). Scientific stock speculation. The Magazine of Wall Street.
Estrella, A., & Mishkin, F. S. (1998). Predicting US recessions: Financial variables as leading indicators. Review of Economics and Statistics, 80(1), 45-61.
Fama, E. F., & French, K. R. (1989). Business conditions and expected returns on stocks and bonds. Journal of Financial Economics, 25(1), 23-49.
Forbes, K. J., & Rigobon, R. (2002). No contagion, only interdependence: measuring stock market comovements. The Journal of Finance, 57(5), 2223-2261.
Fosback, N. G. (1976). Stock market logic: A sophisticated approach to profits on Wall Street. The Institute for Econometric Research.
Gilchrist, S., & Zakrajšek, E. (2012). Credit spreads and business cycle fluctuations. American Economic Review, 102(4), 1692-1720.
Harvey, C. R. (1988). The real term structure and consumption growth. Journal of Financial Economics, 22(2), 305-333.
Kahneman, D., & Tversky, A. (1979). Prospect theory: An analysis of decision under risk. Econometrica, 47(2), 263-291.
Magdon-Ismail, M., & Atiya, A. F. (2004). Maximum drawdown. Risk, 17(10), 99-102.
Nickerson, R. S. (1998). Confirmation bias: A ubiquitous phenomenon in many guises. Review of General Psychology, 2(2), 175-220.
Pagan, A. R., & Sossounov, K. A. (2003). A simple framework for analysing bull and bear markets. Journal of Applied Econometrics, 18(1), 23-46.
Pan, J., & Poteshman, A. M. (2006). The information in option volume for future stock prices. The Review of Financial Studies, 19(3), 871-908.
Taleb, N. N. (2007). The black swan: The impact of the highly improbable. Random House.
Whaley, R. E. (2009). Understanding the VIX. The Journal of Portfolio Management, 35(3), 98-105.
Wilder, J. W. (1978). New concepts in technical trading systems. Trend Research.
Zarowin, P. (1990). Size, seasonality, and stock market overreaction. Journal of Financial and Quantitative Analysis, 25(1), 113-125.
Zweig, M. E. (1986). Winning on Wall Street. Warner Books.

Price Lag Factor (PLF)📊 Price Lag Factor (PLF) for Crypto Traders: A Comprehensive Breakdown
The Price Lag Factor (PLF) is a momentum indicator designed to identify overextended price movements and gauge market momentum. It is particularly optimized for the crypto market, which is known for its high volatility and rapid trend shifts.
🔎 What is the Price Lag Factor (PLF)?
The PLF measures the difference between long-term and short-term price momentum and scales it dynamically based on recent volatility. This helps traders identify when the market might be overbought or oversold while filtering out noise.
The formula used in the PLF calculation is:
PLF = (Z-Long - Z-Short) / Stdev(PLF)
Where:
Z-long: Z-score of the long-term moving average (50-period by default).
Z-short: Z-score of the short-term moving average (14-period by default).
Stdev(PLF): Standard deviation of the PLF over a longer period (50-period by default).
🧠 How to Interpret the PLF:
1. Trend Direction:
Positive PLF (Green Bars): Indicates bullish momentum. The long-term trend is up, and short-term movements are confirming it.
Negative PLF (Red Bars): Indicates bearish momentum. The long-term trend is down, and short-term movements are consistent with it.
2. Momentum Strength:
PLF near Zero (±0.5): Low momentum; trend direction is not strong.
PLF between ±1 and ±2: Moderate momentum, indicating that the market is moving with strength but not in an overextended state.
PLF beyond ±2: High momentum (overbought/oversold), indicating potential trend exhaustion and a possible reversal.
📈 Trading Strategies:
1. Trend Following:
Bullish Signal:
Enter long when PLF crosses above 0 and remains green.
Confirm with other indicators like RSI or MACD to reduce false signals.
Bearish Signal:
Enter short when PLF crosses below 0 and remains red.
Use trend confirmation (e.g., moving average crossover) for better accuracy.
2. Reversal Trading:
Overbought Signal:
If PLF rises above +2, look for signs of bearish divergence or a reversal pattern to consider a short entry.
Oversold Signal:
If PLF falls below -2, watch for bullish divergence or a support bounce to consider a long entry.
3. Momentum Divergence:
Bullish Divergence:
Price makes a lower low while PLF makes a higher low.
Indicates weakening bearish momentum and a potential bullish reversal.
Bearish Divergence:
Price makes a higher high while PLF makes a lower high.
Signals weakening bullish momentum and a potential bearish reversal.
💡 Best Practices:
Combine with Volume:
Volume spikes during high PLF readings can confirm trend continuation.
Low volume during PLF extremes may hint at false breakouts.
Watch for Extreme Levels:
PLF beyond ±2 suggests overextended price action. Use caution when entering new positions.
Confirm with Other Indicators:
Use with Relative Strength Index (RSI) or Bollinger Bands to get a better sense of overbought/oversold conditions.
Overlay with a moving average to gauge trend consistency.
🚀 Why the PLF Works for Crypto:
Crypto markets are highly volatile and prone to rapid trend changes. The PLF's adaptive scaling ensures it remains relevant regardless of market conditions.
It highlights momentum shifts more accurately than static indicators because it accounts for changing volatility in its calculation.
🚨 Disclaimer for Traders Using the Price Lag Factor (PLF) Indicator:
The Price Lag Factor (PLF) indicator is designed as a technical analysis tool to gauge momentum and identify potential overbought or oversold conditions. However, it should not be relied upon as a sole decision-making factor for trading or investing.
Important Points to Consider:
Market Risk: Trading cryptocurrencies and other financial assets involves significant risk. The PLF may not accurately predict future price movements, especially during unexpected market events.
Indicator Limitations: No technical indicator, including the PLF, is infallible. False signals can occur, particularly in low-volume or highly volatile conditions.
Supplementary Analysis: Always combine PLF insights with other technical indicators, fundamental analysis, and risk management strategies to make informed decisions.
Personal Judgment: Traders should use their own discretion when interpreting PLF signals and never trade based solely on this indicator.
No Guarantees: The PLF is designed for educational and informational purposes only. Past performance is not indicative of future results.
Always perform thorough research and consider consulting with a professional financial advisor before making any trading decisions.

[blackcat] L2 FiboKAMA Adaptive TrendOVERVIEW
The L2 FiboKAMA Adaptive Trend indicator leverages advanced technical analysis techniques by integrating Fibonacci principles with the Kaufman Adaptive Moving Average (KAMA). This combination creates a dynamic and responsive tool designed to adapt seamlessly to changing market conditions. By providing clear buy and sell signals based on adaptive momentum, this indicator helps traders identify potential entry and exit points effectively. Its intuitive design and robust features make it a valuable addition to any trader’s arsenal 📊💹.
According to the principle of Kaufman's Adaptive Moving Average (KAMA), it is a type of moving average line specifically designed for markets with high volatility. Unlike traditional moving averages, KAMA can automatically adjust its period based on market conditions to improve accuracy and responsiveness. This makes it particularly useful for capturing market trends and reducing false signals in varying market environments.
The use of Fibonacci magic numbers (3, 8, 13) enhances the performance and accuracy of KAMA. These numbers have special mathematical properties that align well with the changing trends of KAMA moving averages. Combining them with KAMA can significantly boost its effectiveness, making it a popular choice among traders seeking reliable signals.
This fusion not only smoothens price fluctuations but also ensures quick responses to market changes, offering dependable entry and exit points. Thanks to the flexibility and precision of KAMA combined with Fibonacci magic numbers, traders can better manage risks and aim for higher returns.
FEATURES
Enhanced Kaufman Adaptive Moving Average (KAMA): Incorporates Fibonacci principles for improved adaptability:
Source Price: Allows customization of the price series used for calculation (default: HLCC4).
Fast Length: Determines the period for quicker adjustments to recent price changes.
Slow Length: Sets the period for smoother transitions over longer-term trends.
Dynamic Lines:
KAMA Line: A yellow line representing the primary adaptive moving average, which adapts quickly to new trends.
Trigger Line: A fuchsia line serving as a reference point for detecting crossovers and generating signals.
Visual Cues:
Buy Signals: Green 'B' labels indicating potential buying opportunities.
Sell Signals: Red 'S' labels signaling possible selling points.
Fill Areas: Colored regions between the KAMA and Trigger lines to visually represent trend directions and strength.
Alert Functionality: Generates real-time alerts for both buy and sell signals, ensuring timely notifications for actionable insights 🔔.
Customizable Parameters: Offers flexibility through adjustable inputs, allowing users to tailor the indicator to their specific trading strategies and preferences.
HOW TO USE
Adding the Indicator:
Open your TradingView chart and navigate to the indicators list.
Select L2 FiboKAMA Adaptive Trend and add it to your chart.
Configuring Parameters:
Adjust the Source Price to choose the desired price series (e.g., close, open, high, low).
Set the Fast Length to define how quickly the indicator responds to recent price movements.
Configure the Slow Length to determine the smoothness of long-term trend adaptations.
Interpreting Signals:
Monitor the chart for green 'B' labels indicating buy signals and red 'S' labels for sell signals.
Observe the colored fill areas between the KAMA and Trigger lines to gauge trend strength and direction.
Setting Up Alerts:
Enable alerts within the indicator settings to receive notifications whenever buy or sell signals are triggered.
Customize alert messages and frequencies according to your trading plan.
Combining with Other Tools:
Integrate this indicator with additional technical analysis tools and fundamental research for comprehensive decision-making.
Confirm signals using other indicators like RSI, MACD, or Bollinger Bands for increased reliability.
Optimizing Performance:
Backtest the indicator across various assets and timeframes to understand its behavior under different market conditions.
Fine-tune parameters based on historical performance and current market dynamics.
Integrating Magic Numbers:
Understand the basic principles of KAMA to find suitable entry points for Fibonacci magic numbers.
Utilize the efficiency ratio to measure market volatility and adjust moving average parameters accordingly.
Apply Fibonacci magic numbers (3, 8, 13) to enhance the responsiveness and accuracy of KAMA.
LIMITATIONS
Market Volatility: May produce false signals during periods of extreme volatility or sideways movement.
Parameter Sensitivity: Requires careful tuning of fast and slow lengths to balance responsiveness and stability.
Asset-Specific Behavior: Effectiveness can vary significantly across different financial instruments and time horizons.
Complementary Analysis: Should be used alongside other analytical methods to enhance accuracy and reduce risk.
NOTES
Historical Data: Ensure adequate historical data availability for precise calculations and backtesting.
Demo Testing: Thoroughly test the indicator on demo accounts before deploying it in live trading environments.
Continuous Learning: Stay updated with market trends and continuously refine your strategy incorporating feedback from the indicator's performance.
Risk Management: Always implement proper risk management practices regardless of the signals provided by the indicator.
ADVANCED USAGE TIPS
Multi-Timeframe Analysis: Apply the indicator across multiple timeframes to gain deeper insights into underlying trends.
Divergence Strategy: Look for divergences between price action and the KAMA line to spot potential reversals early.
Volume Integration: Combine volume analysis with the indicator to confirm the strength of identified trends.
Custom Scripting: Modify the script to include additional filters or conditions tailored to your unique trading approach.
IMPROVING KAMA PERFORMANCE
Increase Length: Extend the KAMA length to consider more historical data, reducing the impact of short-term price fluctuations.
Adjust Fast and Slow Lengths: Make KAMA smoother by increasing the fast length and decreasing the slow length.
Use Smoothing Factor: Apply a smoothing factor to control the level of smoothness; typical values range from 0 to 1.
Combine with Other Indicators: Pair KAMA with other smoothing indicators like EMA or SMA for more reliable signals.
Filter Noise: Use filters or other technical analysis tools to eliminate price noise, enhancing KAMA's effectiveness.
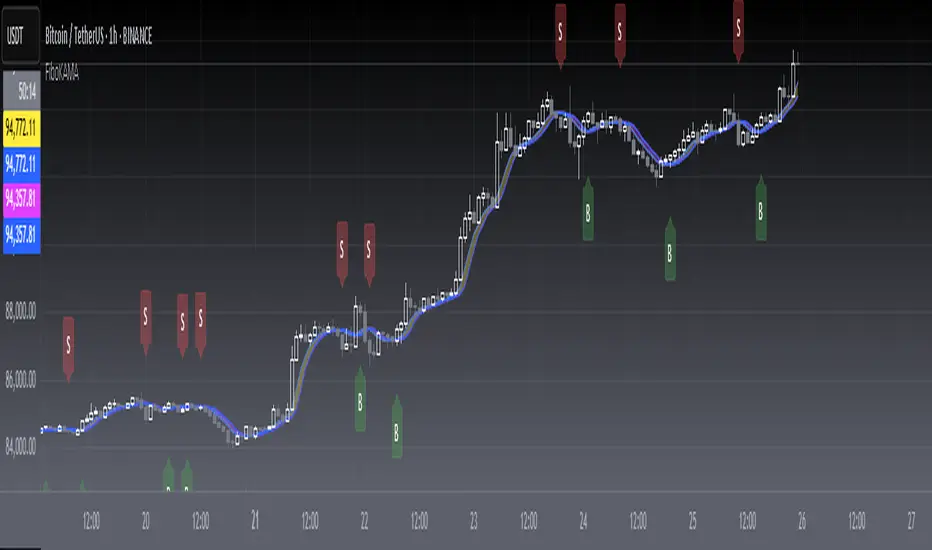
Deadzone Pro @DaviddTechDeadzone Pro by @DaviddTech – Adaptive Multi-Strategy NNFX Trading System
Deadzone Pro by @DaviddTech is a meticulously engineered trading indicator that strictly adheres to the No-Nonsense Forex (NNFX) methodology. It integrates adaptive trend detection, dual confirmation indicators, advanced volatility filtering, and dynamic risk management into one powerful, visually intuitive system. Ideal for traders seeking precision and clarity, this indicator consistently delivers high-probability trade setups across all market conditions.
🔥 Key Features:
The Setup:
Adaptive Hull Moving Average Baseline: Clearly identifies trend direction using an advanced, gradient-colored Hull MA that intensifies based on trend strength, providing immediate visual clarity.
Dual Confirmation Indicators: Combines Waddah Attar Explosion (momentum detector) and Bull/Bear Power (strength gauge) for robust validation, significantly reducing false entries.
Volatility Filter (ADX): Ensures entries are only made during strong trending markets, filtering out weak, range-bound scenarios for enhanced trade accuracy.
Dynamic Trailing Stop Loss: Implements a SuperTrend-based trailing stop using adaptive ATR calculations, managing risk effectively while optimizing exits.
Dashboard:
💎 Gradient Visualization & User Interface:
Dynamic gradient colors enhance readability, clearly indicating bullish/bearish strength.
Comprehensive dashboard summarizes component statuses, real-time market sentiment, and entry conditions at a glance.
Distinct and clear buy/sell entry and exit signals, with adaptive stop-loss levels visually plotted.
Candlestick coloring based on momentum signals (Waddah Attar) for intuitive market reading.
📈 How to Interpret Signals:
Bullish Signal: Enter when Hull MA baseline trends upward, both confirmation indicators align bullish, ADX indicates strong trend (>25), and price breaks above the previous trailing stop.
Bearish Signal: Enter short or exit long when Hull MA baseline trends downward, confirmations indicate bearish momentum, ADX confirms trend strength, and price breaks below previous trailing stop.
📊 Recommended Usage:
Timeframes: Ideal on 1H, 4H, and Daily charts for swing trading; effective on shorter (5M, 15M) charts for day trading.
Markets: Compatible with Forex, Crypto, Indices, Stocks, and Commodities.
The Entry & Exit:
🎯 Trading Styles:
Choose from three distinct trading modes:
Conservative: Requires full alignment of all indicators for maximum accuracy.
Balanced (Default): Optimized balance between signal frequency and reliability.
Aggressive: Fewer confirmations needed for more frequent trading signals.
📝 Credits & Originality:
Deadzone Pro incorporates advanced concepts inspired by:
Hull Moving Average by @Julien_Eche
Waddah Attar Explosion by @LazyBear
Bull Bear Power by @Pinecoders
ADX methodology by @BeikabuOyaji
This system has been significantly refactored and enhanced by @DaviddTech to maximize synergy, clarity, and usability, standing apart distinctly from its original components.
Deadzone Pro exemplifies precision and discipline, aligning fully with NNFX principles to provide traders with a comprehensive yet intuitive trading advantage.

Mehul - ADX Zero LagThis script combines two popular technical indicators into a single visualization:
1. **Average Directional Index (ADX)**:
- Measures trend strength on a scale from 0-100 (now normalized to 0-1 by dividing by 100)
- Displayed as a red line
- Adjustable smoothing and length parameters
2. **Zero Lag MACD (Modified Moving Average Convergence Divergence)**:
- An enhanced version of the traditional MACD with reduced lag
- Shows the relationship between fast and slow moving averages
- Main components include:
- MACD line (black)
- Signal line (gray)
- Histogram (green for positive, purple for negative)
- EMA of the MACD line (red)
- Optional crossing dots
Key features of the combined indicator:
- **Scale Adjustment**: Both indicators can be scaled independently (adxScale and macdScale parameters)
- **Visibility Toggles**: Each indicator can be shown or hidden
- **Advanced Customization**: Parameters for both indicators can be fine-tuned
- **Algorithm Selection**: Option to choose between the "Glaz" algorithm or the "real" zero lag algorithm
- **Display Options**: Toggles for visualization elements like crossing dots
The most significant technical aspect is that both indicators are displayed in the same pane with compatible scaling, achieved by normalizing the ADX values and applying user-defined scale factors to both indicators.
This combined indicator is designed to give traders a comprehensive view of both trend strength (from ADX) and momentum/direction (from Zero Lag MACD) in a single, easy-to-read visualization.
Multi-Indicator Signals with Selectable Options by DiGetMulti-Indicator Signals with Selectable Options
Script Overview
This Pine Script is a multi-indicator trading strategy designed to generate buy/sell signals based on combinations of popular technical indicators: RSI (Relative Strength Index) , CCI (Commodity Channel Index) , and Stochastic Oscillator . The script allows you to select which combination of signals to display, making it highly customizable and adaptable to different trading styles.
The primary goal of this script is to provide clear and actionable entry/exit points by visualizing buy/sell signals with arrows , labels , and vertical lines directly on the chart. It also includes input validation, dynamic signal plotting, and clutter-free line management to ensure a clean and professional user experience.
Key Features
1. Customizable Signal Types
You can choose from five signal types:
RSI & CCI : Combines RSI and CCI signals for confirmation.
RSI & Stochastic : Combines RSI and Stochastic signals.
CCI & Stochastic : Combines CCI and Stochastic signals.
RSI & CCI & Stochastic : Requires all three indicators to align for a signal.
All Signals : Displays individual signals from each indicator separately.
This flexibility allows you to test and use the combination that works best for your trading strategy.
2. Clear Buy/Sell Indicators
Arrows : Buy signals are marked with upward arrows (green/lime/yellow) below the candles, while sell signals are marked with downward arrows (red/fuchsia/gray) above the candles.
Labels : Each signal is accompanied by a label ("BUY" or "SELL") near the arrow for clarity.
Vertical Lines : A vertical line is drawn at the exact bar where the signal occurs, extending from the low to the high of the candle. This ensures you can pinpoint the exact entry point without ambiguity.
3. Dynamic Overbought/Oversold Levels
You can customize the overbought and oversold levels for each indicator:
RSI: Default values are 70 (overbought) and 30 (oversold).
CCI: Default values are +100 (overbought) and -100 (oversold).
Stochastic: Default values are 80 (overbought) and 20 (oversold).
These levels can be adjusted to suit your trading preferences or market conditions.
4. Input Validation
The script includes built-in validation to ensure that oversold levels are always lower than overbought levels for each indicator. If the inputs are invalid, an error message will appear, preventing incorrect configurations.
5. Clean Chart Design
To avoid clutter, the script dynamically manages vertical lines:
Only the most recent 50 buy/sell lines are displayed. Older lines are automatically deleted to keep the chart clean.
Labels and arrows are placed strategically to avoid overlapping with candles.
6. ATR-Based Offset
The vertical lines and labels are offset using the Average True Range (ATR) to ensure they don’t overlap with the price action. This makes the signals easier to see, especially during volatile market conditions.
7. Scalable and Professional
The script uses arrays to manage multiple vertical lines, ensuring scalability and performance even when many signals are generated.
It adheres to Pine Script v6 standards, ensuring compatibility and reliability.
How It Works
Indicator Calculations :
The script calculates the values of RSI, CCI, and Stochastic Oscillator based on user-defined lengths and smoothing parameters.
It then checks for crossover/crossunder conditions relative to the overbought/oversold levels to generate individual signals.
Combined Signals :
Depending on the selected signal type, the script combines the individual signals logically:
For example, a "RSI & CCI" buy signal requires both RSI and CCI to cross into their respective oversold zones simultaneously.
Signal Plotting :
When a signal is generated, the script:
Plots an arrow (upward for buy, downward for sell) at the corresponding bar.
Adds a label ("BUY" or "SELL") near the arrow for clarity.
Draws a vertical line extending from the low to the high of the candle to mark the exact entry point.
Line Management :
To prevent clutter, the script stores up to 50 vertical lines in arrays (buy_lines and sell_lines). Older lines are automatically deleted when the limit is exceeded.
Why Use This Script?
Versatility : Whether you're a scalper, swing trader, or long-term investor, this script can be tailored to your needs by selecting the appropriate signal type and adjusting the indicator parameters.
Clarity : The combination of arrows, labels, and vertical lines ensures that signals are easy to spot and interpret, even in fast-moving markets.
Customization : With adjustable overbought/oversold levels and multiple signal options, you can fine-tune the script to match your trading strategy.
Professional Design : The script avoids clutter by limiting the number of lines displayed and using ATR-based offsets for better visibility.
How to Use This Script
Add the Script to Your Chart :
Copy and paste the script into the Pine Editor in TradingView.
Save and add it to your chart.
Select Signal Type :
Use the "Signal Type" dropdown menu to choose the combination of indicators you want to use.
Adjust Parameters :
Customize the lengths of RSI, CCI, and Stochastic, as well as their overbought/oversold levels, to match your trading preferences.
Interpret Signals :
Look for green arrows and "BUY" labels for buy signals, and red arrows and "SELL" labels for sell signals.
Vertical lines will help you identify the exact bar where the signal occurred.
Tips for Traders
Backtest Thoroughly : Before using this script in live trading, backtest it on historical data to ensure it aligns with your strategy.
Combine with Other Tools : While this script provides reliable signals, consider combining it with other tools like support/resistance levels or volume analysis for additional confirmation.
Avoid Overloading the Chart : If you notice too many signals, try tightening the overbought/oversold levels or switching to a combined signal type (e.g., "RSI & CCI & Stochastic") for fewer but higher-confidence signals.

Aj's DikFat Adjusted ADXRAj's DikFat Adjusted ADXR
This indicator is designed to plot the Average Directional Index (ADX) and Average Directional Movement Rating (ADXR) on the chart. The ADX and ADXR are both used to measure the strength of a trend in the market. The script allows you to customize several parameters, including the ADX Length and the Moving Average Method used for smoothing the directional movement indicators.
Key Features:
- ADX Length : Defines the number of periods over which the ADX is calculated. This value can be adjusted by the user to suit different trading styles and timeframes.
- Moving Average Method : Choose between several smoothing methods, including Simple Moving Average (SMA), Exponential Moving Average (EMA), Wilder's Moving Average, Weighted Moving Average (WMA), Hull Moving Average (HMA), or a Super Smooth Moving Average.
- Directional Indicators : The script calculates the +DI and -DI, which represent the positive and negative directional indicators respectively. These are then used to calculate the ADX.
- ADXR : The ADXR is calculated as the average of the current ADX value and the ADX value from 14 periods ago, providing a more smoothed representation of the trend strength.
How Traders Use ADX and ADXR:
- ADX : A rising ADX indicates an increasing trend strength, while a falling ADX suggests a weakening trend. A value above 25 is often considered an indication of a strong trend.
- ADXR : This indicator smooths the ADX over time, helping traders identify persistent trends. The ADXR can help filter out noise and provide a clearer picture of the trend's health.
Please note that this script and its indicators are designed to be used as tools for analysis, not as guarantees of market outcomes. Adjustments to the moving average method or ADX length can change the behavior of the indicators based on market conditions.