Key Levels (4H and Daily)Key Levels (4H and Daily)
This indicator highlights important key price levels derived from the 4-hour (4H) and daily (D) timeframes, providing traders with critical support and resistance areas. The levels are calculated using the highest highs and lowest lows over a customizable lookback period, offering a dynamic view of significant price points that could influence market movement.
Key Features:
Key Levels for 4H and Daily Timeframes:
The indicator calculates and displays the highest high and lowest low over a user-defined period for both the 4-hour and daily timeframes. This helps traders identify key support and resistance levels that could dictate the market's behavior.
Customizable Lookback Period:
Traders can adjust the lookback period (in days) for both the 4-hour and daily timeframes to reflect different market conditions. This flexibility ensures the levels are tailored to your preferred trading style and market conditions.
Horizontal Lines:
The indicator plots horizontal lines at the high and low levels for both timeframes. These levels serve as dynamic support and resistance areas and help traders monitor price action near these critical points.
Real-Time Updates:
The lines adjust automatically with each new bar, providing up-to-date key levels based on the most recent price action and trading session.
Alert Conditions:
Alerts are built-in to notify traders when the price breaks above or below these key levels. Traders can set up notifications to stay informed when significant market moves occur.
How to Use:
Support and Resistance: Use the levels as potential support and resistance areas where price could reverse. Price often reacts at these levels, providing potential trading opportunities.
Breakouts: Pay attention to breakouts above the high or below the low of these levels. A break above the 4H or daily high could indicate bullish momentum, while a break below could signal bearish trends.
Trend Confirmation: Combine these levels with other technical analysis tools to confirm the overall market trend and enhance your trading strategy.
Perfect for:
Day Traders: Use the 4-hour levels for intraday trading setups, such as potential reversals or breakouts.
Swing Traders: The daily levels provide longer-term insights, helping to identify key zones where price might pause, reverse, or break out.
Market Context: Ideal for those who want to contextualize their trades within broader timeframes, helping to understand the market’s structure at multiple time scales.
This description conveys the utility and functionality of the indicator, focusing on how it helps traders identify and monitor key levels that influence market action.
Поиск скриптов по запросу "key levels"
Key Levels: Monday / Weekly / Monthly + Year/Quarter + LiquidityKey Levels: Monday / Weekly / Monthly / Year / Quarter + Liquidity

Key Levels: ATH + Previous Day + HTF S/RKey levels line indicator for all time high, previous day low and high for momentum trading
Key Levels and Trend indicatorKey Levels and Trend indicator By Pravin. This indicator shows you the recent Support level and resistance level for the current script.
It also detects breakout and breakdown at levels.

Key LevelsKey Levels Indicator
In the world of trading, manually identifying and plotting key levels for every close can be a tedious and error-prone task. This indicator stands out by automatically detecting and plotting only those levels where a significant shift in market sentiment has occurred. Unlike traditional indicators that plot lines for every open or close, this tool focuses on levels where liquidity has changed hands, indicating a potential shift in momentum.
How It Works:
- The indicator identifies Higher Timeframe (HTF) reversals, plotting levels only when a bearish candle is followed by a bullish one, or vice versa.
- Weekly levels are represented by dashed lines, while monthly levels are solid, providing clear visual differentiation.
- Levels are drawn at the open price of the reversal candle, starting precisely at the beginning of the new HTF bar.
Why It's Different:
- Focuses on genuine shifts in market sentiment rather than arbitrary price points.
- Automatically manages the number of visible levels to prevent chart clutter.
- Ideal for range traders and mean reversion strategies, offering insights into potential support and resistance zones where market participants have shown a change in behavior.
Usage Note:
While this indicator provides valuable insights, it should not be used in isolation. Always consider the broader market context and combine it with other analysis techniques for optimal results.
Settings:
- Toggle weekly/monthly levels
- Adjust the number of visible levels (1-20)
- Customize level colors
Key Levels v1Key Levels
This comprehensive multi-timeframe indicator provides traders with key price levels and opening ranges across multiple timeframes, designed to identify significant support/resistance zones and market structure.
KEY FEATURES:
📦 Monthly Range Box
- Automatically draws a box capturing the high and low of the first 9 hours of each new month
- Box extends until the next month begins
- Includes an optional mid-line showing the 50% level of the range
- Fully customizable colors, line styles, and background opacity
📊 Multi-Timeframe Open Lines
The indicator plots horizontal lines at the open price of:
- Midnight Open (00:00 session start)
- 4-Hour Open (updates every 4-hour candle)
- Daily Open (true daily candle open)
- Weekly Open (start of trading week)
- Monthly Open (start of new month)
- Yearly Open (start of new year)
🎯 Smart Label System
- Automatic label combining when multiple timeframe opens overlap at the same price
- Clean text labels positioned ahead of current price to avoid obstruction
- Labels show combined timeframes (e.g., "Monthly Open / Weekly Open")
⚙️ Customization Options
Each timeframe open line includes:
- Toggle on/off independently
- Custom color selection
- Line style options (Solid, Dashed, Dotted)
- Organized settings grouped by timeframe for easy navigation
🔧 Technical Implementation
- Uses request.security() for accurate higher timeframe data
- Works on any chart timeframe
- Lines extend 10 bars beyond current price for clear label visibility
- Efficient overlap detection prevents duplicate labels
IDEAL FOR:
✓ Identifying key institutional levels
✓ Trading range breakouts
✓ Multi-timeframe analysis
✓ Support and resistance zones
✓ Session-based trading strategies
All settings are organized chronologically from shortest to longest timeframe for intuitive configuration.

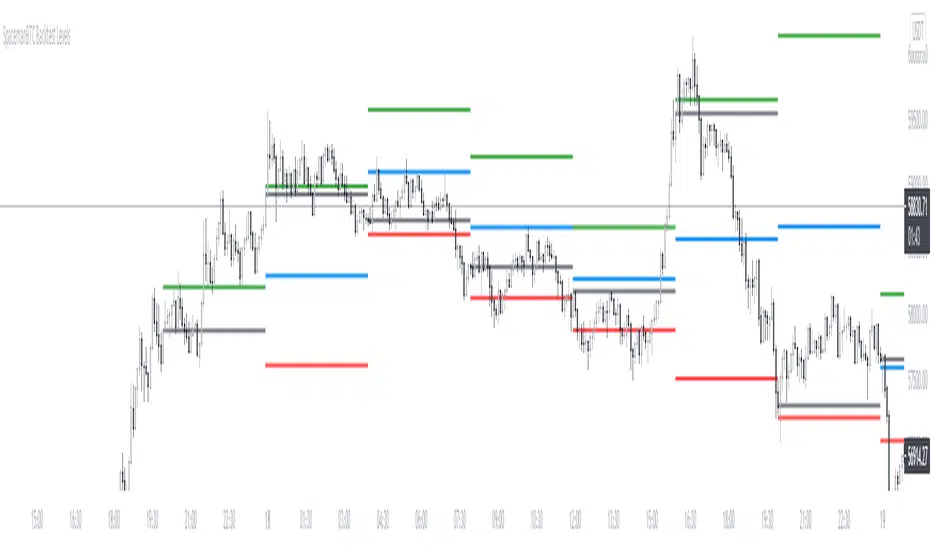
Key Levels CustomTF + Backtest: SpacemanBTCKey Levels Backtest, same logic as the key levels script, provide levels based:
High, Low, Mid and Close.
This was requested, took a long time to post as I fell sick and was given a lot of Dev Work.
Hope this helps those who use it, very useful to see liquidity grabs in my opinion.
Input time in minutes!
Result of a user request.
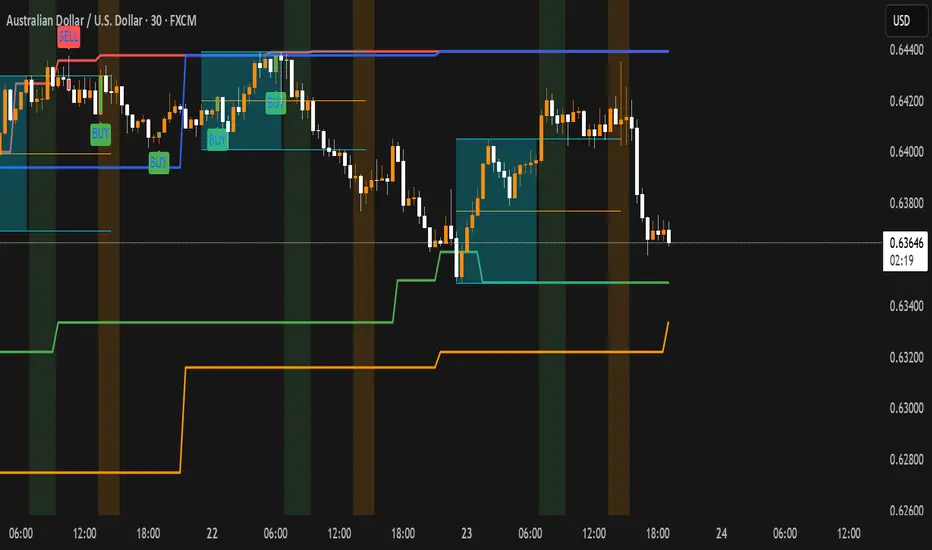
Key LevelsKey levels marked out for the day.
Week, 4 hour, 1 hour, PM, and OR levels marked out for each session.

Key Levels SpacemanBTC IDWMKey levels, plotted automatically
Additional timeframes can be added on request
Useful for seeing strength of the trend in the market

Key Levels Theory with Boxes v3Key Levels Theory with Boxes
This script helps traders visualize important price levels and mark them with lines and boxes on a chart. The lines represent key whole number levels, and the boxes give you a visual reference to see how price interacts with these levels. This tool can be used to track support/resistance areas and anticipate price movement based on round numbers.
Key Functions:
Lines:
The script draws horizontal lines at key price levels (e.g., 2850, 2855, 2860, etc.) starting from a defined "start level."
The lines are dashed by default and their appearance can be customized (color, style, width).
Boxes:
For each level, a box is drawn above and below the line.
The size of the box is fixed (1.5 units above and below the level) and it can be customized to any other interval.
The box is filled with a green color by default, with 5% opacity, so it doesn’t overpower the chart but still provides a visual reference.
Customizable Inputs:
Start Level: The starting price level from which all other levels will be calculated (e.g., 2850).
Number of Levels: How many levels of lines and boxes you want to display (e.g., 6 levels).
Box Interval: The distance above and below each level to define the size of the boxes (default is 1.5).
Line Style: The appearance of the lines (solid, dotted, or dashed).
Line Color: The color of the lines (default is white).
Line Width: The width of the lines (default is set to 0 for a cleaner look).
Box Color: The color of the boxes (default is green with 5% opacity).
What Does It Do?
Visualizes price levels: The script plots key price levels and helps traders easily identify where price is currently at, relative to whole number levels.
Marks support/resistance: These levels often act as psychological price points, making them useful for spotting potential support or resistance.
Helps with trade decisions: By seeing how the price behaves around these key levels, traders can make more informed decisions about entering or exiting positions.

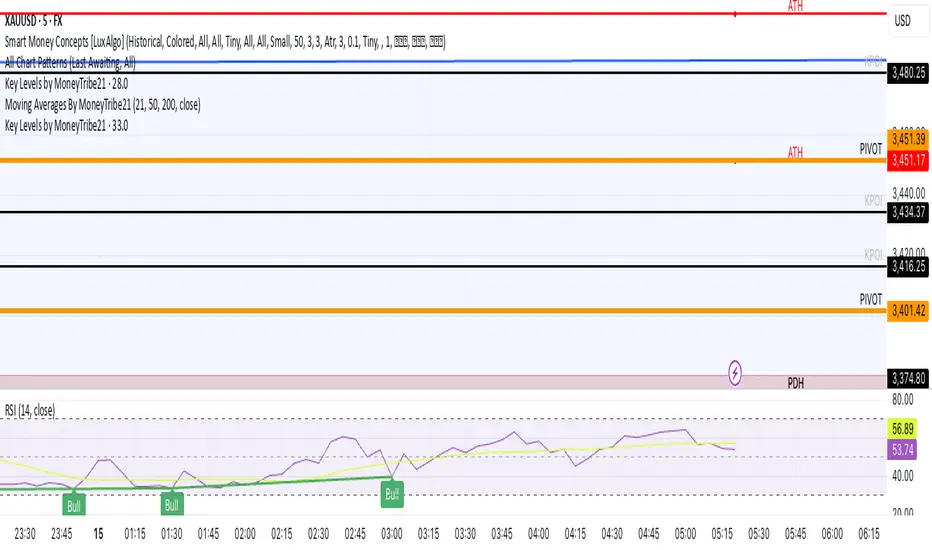
Key Levels by MoneyTribe21This custom script provides real-time tracking of key market price levels, helping traders identify critical support and resistance zones. It dynamically updates throughout the trading session, making it ideal for intraday trading, breakout strategies, and market structure analysis.
Features:
Real-Time Tracking of Key Price Levels:
ATH (All-Time High): Tracks the highest price ever reached for the asset.
PDH (Previous Day High): Marks the high of the last trading day,
PDL (Previous Day Low): Marks the low of the last trading day, serving as dynamic support.
Resistance Level: Based on the current day’s high, signaling potential price rejection points.
Support Level: Based on the current day’s low, indicating potential price bounces.
Daily Open Price: Tracks the exact market open price at the start of the trading session.
Works Across All Timeframes:
Designed for intraday, swing, and long-term trading.
Automatically adjusts levels for Forex, Stocks, Crypto, and Indices.
Fully Customizable Settings:
Modify line colors, thickness, and styles for better chart readability.
Enable/disable specific levels based on trading preference.
Works on all TradingView-compatible brokers and platforms.
How to Use This Indicator:
Breakout & Reversal Trading:
If price breaks above PDH, it may indicate bullish momentum.
If price breaks below PDL, it may signal a bearish continuation.
ATH levels can act as strong resistance zones—watch for breakouts or rejection.
Dynamic Support & Resistance:
Resistance Level (Current Day High): If price fails to break, it may signal a reversal.
Support Level (Current Day Low): If price bounces off, it may confirm a strong uptrend.
Daily Open for Trend Confirmation:
Above Daily Open: Market sentiment is bullish.
Below Daily Open: Market sentiment is bearish.
Customization Options:
Toggle individual price levels ON/OFF for a clutter-free chart.
Customize colors, line styles, and alerts for better visualization.
Set alerts for breakouts & retests of key levels.
Ideal for Traders Who:
Want high-probability support & resistance zones in real-time.
Trade breakouts, reversals, or trend continuations.
Use market structure analysis for informed decision-making.
Need automatic price tracking instead of drawing levels manually.
Compatible with all TradingView timeframes & assets (Forex, Stocks, Crypto, Indices).
Designed for both beginner and advanced traders.
Add this indicator to your chart and start tracking key levels instantly.
Key Levels with Alerts
Introducing the "Key Levels with Alerts" Indicator
This powerful and fully customizable indicator for the TradingView platform helps you easily identify and monitor crucial **daily, weekly, and monthly price levels** directly on your chart. Beyond just visual representation, the indicator offers advanced alert capabilities to notify you of any price breaks at these significant areas.
Key Levels Identified by the Indicator
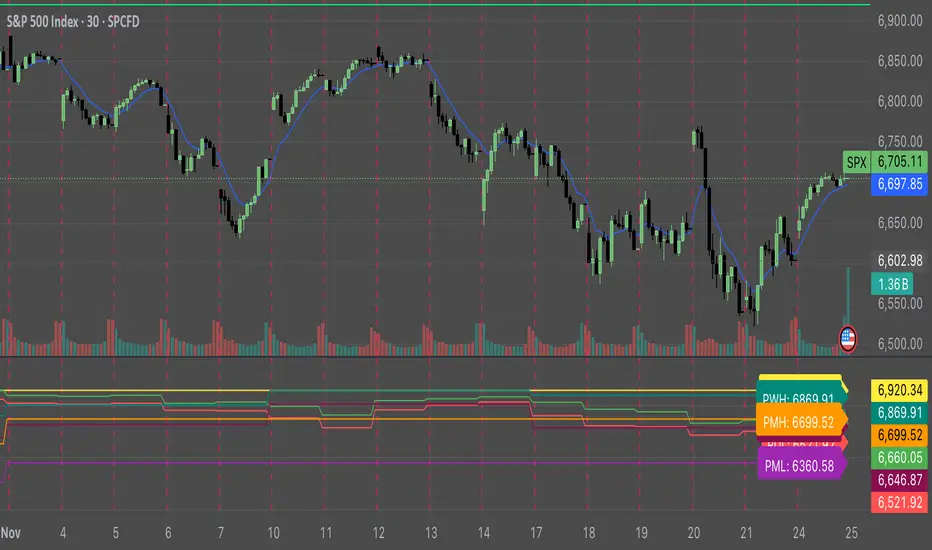
This indicator calculates and displays six vital price levels based on the previous day's, week's, and month's closed candles:
1. **PDH (Previous Day High):** The highest price of the previous day.
2. **PDL (Previous Day Low):** The lowest price of the previous day.
3. **PWH (Previous Week High):** The highest price of the previous week.
4. **PWL (Previous Week Low):** The lowest price of the previous week.
5. **PMH (Previous Month High):** The highest price of the previous month.
6. **PML (Previous Month Low):** The lowest price of the previous month.
Core Features
* **Visual Line Display:** Each of these six levels is plotted as a **horizontal line** on your chart. These lines start from the current candle and extend forward for a specified number of candles (defaulting to 20 candles).
* **Complete Style Customization:** For every level (PDH, PDL, PWH, PWL, PMH, PML), you can **independently customize** the line's color, width, and style (solid, dashed, dotted) directly through the indicator's settings. This feature allows you to easily differentiate between the various levels.
* **Toggleable Labels:** You can choose whether to display text labels like "PDH", "PDL", "PWH", "PWL", "PMH", "PML" at the end of each line. The style of these labels will also automatically match their corresponding line colors.
* **Line Visibility Control:** Beyond just labels, you can also independently **show or hide the lines themselves** for PDH, PDL, PWH, PWL, PMH, and PML.
* **Price Break Alerts:** This is one of the indicator's most important features. You can set up alerts for each of these levels:
* **PDH Break Alert:** Triggers when the price moves above the **Previous Day High**.
* **PDL Break Alert:** Triggers when the price moves below the **Previous Day Low**.
* **PWH Break Alert:** Triggers when the price moves above the **Previous Week High**.
* **PWL Break Alert:** Triggers when the price moves below the **Previous Week Low**.
* **PMH Break Alert:** Triggers when the price moves above the **Previous Month High**.
* **PML Break Alert:** Triggers when the price moves below the **Previous Month Low**.
* **Clear Alert Messages:** Each alert message includes the **symbol or ticker name** (e.g., ` `) so you can quickly identify which asset the alert pertains to and which level has been broken.
* **Enable/Disable Alerts:** You have the flexibility to enable or disable each PDH, PDL, PWH, PWL, PMH, and PML alert independently via the indicator's settings.
Why This Indicator Is Useful
Daily, weekly, and monthly High and Low levels often act as **key support and resistance areas**. Traders use these levels to identify potential entry and exit points, set stop-loss and take-profit targets, and understand overall market sentiment. This indicator, with its clear visualization and timely alerts, helps you effectively leverage this crucial information in your trading strategies.

Key Levels (PA, MAs, VWAPs, Volume Profile, rVWAPs)This indicator marks all kinds of key levels so that users can keep an overview of their specified levels in a convenient non chart cluttering way. It can highlight levels of confluence or display each level seperately.
The indicator includes markers for the following levels:
Price Action: Opens, Previous High/Low, Monday Range
Moving Averages: H4, D1 and W1 with customisable lengths
VWAPs: Developing and Previous VWAPs with their respective VAL/VAH (1 Standard Deviation)
Rolling VWAPs
Volume Profile: Developing and Previous VAL/VAH/POC
What makes this indicator different is its vast customisation options and big library of levels…
… users can choose to merge all levels that are aligned in a specified % threshold and additionally they can choose to color them the same color to highlight confluence levels.
… users have the choice between Full Label Markers or Abbreviations of those Labels.
… users have the choice of a few presets making level switching fast and convenient (Price Action, Volume Profile, VWAP, Volume or Custom).
… users can specify if they prefer to highlight Simple Moving Averages or Exponential Moving Averages. They have calculations available on three different timeframes and can change the lengths of each.
… users can color all levels the same with one click instead of having to manually change all of them.
… when users choose Volume Profile Levels they can either let the script auto calculate the row size making asset switching simple or they can manually input row size.
With the custom preset users can show and hide whichever levels they want.
(To have them the same every time you freshly load the indicator save your settings as default in the lower left corner of the settings tab).
Purpose
This indicator is designed to serve as a level visualisation tool that has the ability to highlight levels of confluence. It may assist in keeping an overview of where all levels are currently located but does not produce signals or trade recommendations.

Key Levels: Daily, Weekly, Monthly [BackQuant]Key Levels: Daily, Weekly, Monthly
Map the market’s “memory” in one glance—yesterday’s range, this week’s chosen day high/low, and D/W/M opens—then auto-clean levels once they break.
What it does
This tool plots three families of high-signal reference lines and keeps them tidy as price evolves:
Chosen Day High/Low (per week) — Pick a weekday (e.g., Monday). For each past week, the script records that day’s session high and low and projects them forward for a configurable number of bars. These act like “memory levels” that price often revisits.
Daily / Weekly / Monthly Opens — Plots the opening price of each new day, week, and month with separate styling. These opens frequently behave like magnets/flip lines intraday and anchors for regime on higher timeframes.
Auto-pruning — When price breaks a stored level, the script can automatically remove it to reduce clutter and refocus you on still-active lines. See: (broken levels removed).
Why these levels matter
Liquidity pockets — Prior day’s high/low and the daily open concentrate stops and pending orders. Mapping them quickly reveals likely sweep or fade zones. Example: previous day highs + daily open highlighting liquidity:
Context & regime — Monthly opens frame macro bias; trading above a rising cluster of monthly opens vs. below gives a clean top-down read. Example: monthly-only “macro outlook” view:
Cleaner charts — Auto-remove broken lines so you focus on what still matters right now.
What it plots (at a glance)
Past Chosen Day High/Low for up to N prior weeks (your choice), extended right.
Current Daily Open , Weekly Open , and Monthly Open , each with its own color, label, and forward extension.
Optional short labels (e.g., “Mon High”) or full labels (with week/month info).
How breaks are detected & cleaned
You control both the evidence and the timing of a “break”:
Break uses — Choose Close (more conservative) or Wick (more sensitive).
Inclusive? — If enabled, equality counts (≥ high or ≤ low). If disabled, you need a strict cross.
Allow intraday breaks? — If on, a level can break during the tracked day; if off, the script only counts breaks after the session completes.
Remove Broken Levels — When a break is confirmed, the line/label is deleted automatically. (See the demo: )
Quick start
Pick a Day of Week to Track (e.g., Monday).
Set how many weeks back to show (e.g., 8–10).
Choose how far to extend each family (bars to the right for chosen-day H/L and D/W/M opens).
Decide if a break uses Close or Wick , and whether equality counts.
Toggle Remove Broken Levels to keep the chart clean automatically.
Tips by use-case
Intraday bias — Watch the Daily Open as a magnet/flip. If price gaps above and holds, pullbacks to the daily open often decide direction. Pair with last day’s high/low for sweep→reversal or true breakout cues. See:
Weekly structure — Track the week’s chosen day (e.g., Monday) high/low across prior weeks. If price stalls near a cluster of old “Monday Highs,” look for sweep/reject patterns or continuation on reclaim.
Macro regime — Hide daily/weekly lines and keep only Monthly Opens to read bigger cycles at a glance (BTC/crypto especially). Example:
Customization
Use wicks or bodies for highs/lows (wicks capture extremes; bodies are stricter).
Line style & thickness — solid/dashed/dotted, width 1–5, plus global transparency.
Labels — Abbreviated (“Mon High”, “D Open”) or full (month/week/day info).
Color scheme — Separate colors for highs, lows, and each of D/W/M opens.
Capacity controls — Set how many daily/weekly/monthly opens and how many weeks of chosen-day H/L to keep visible.
What’s under the hood
On your selected weekday, the script records that session’s true high and true low (using wicks or body-based extremes—your choice), then projects a horizontal line forward for the next bars.
At each new day/week/month , it records the opening price and projects that line forward as well.
Each bar, the script checks your “break” rules; once broken, lines/labels are removed if auto-cleaning is on.
Everything updates in real time; past levels don’t repaint after the session finishes.
Recommended presets
Day trading — Weeks back: 6–10; extend D/W opens: 50–100 bars; Break uses: Close ; Inclusive: off; Auto-remove: on.
Swing — Fewer daily opens, more weekly opens (2–6), and 8–12 weeks of chosen-day H/L.
Macro — Show only Monthly Opens (1–6 months), dashed style, thicker lines for clarity.
Reading the examples
Broken lines disappear — decluttering in action:
Macro outlook — monthly opens as cycle rails:
Liquidity map — previous day highs + daily open:
Final note
These are not “signals”—they’re reference points that many participants watch. By standardising how you draw them and automatically clearing the ones that no longer matter, you turn a noisy chart into a focused map: where liquidity likely sits, where price memory lives, and which lines are still in play.

Futures Key LevelsKey Levels — Sessions, Previous Ranges & Opens (Chicago-aligned sessions)
What it does
This indicator plots commonly used reference levels across multiple timeframes to help you frame the day and find confluence:
Sessions (Chicago TZ): London, New York, and Asia session high/low ranges.
Previous Period Ranges: Previous Day / Week / Month / Quarter / Year High/Low and optional Mid.
Opens: Current Daily / Weekly / Monthly / Quarterly / Yearly opens.
Intraday (4H): Previous 4-Hour High/Low + optional Mid.
Monday Range: Captures Monday’s High/Low (and optional Mid) to use as a weekly reference.
Price-scale markers: Optional markers that track key levels on the price scale without adding extra lines.
How it works (concepts & calculations)
Higher-timeframe values are retrieved using request.security() and update when a new period begins (e.g., previous day’s H/L become fixed at the start of the new day).
Session ranges are built from bar data within session windows using time(session, "America/Chicago"):
London: 02:00–05:00 CT
New York: 08:30–15:00 CT
Asia: 20:00–00:00 CT
“Mid” levels are simple midpoints between each period’s High and Low.
Merge Levels: when different levels land at the same price, their labels are merged to reduce clutter (e.g., “PDH / PWH”).
Why this version is useful / original bits
All-white baseline for clean charts; session colors stand out by design: London = Yellow, New York = Aquatic Blue, Asia = Red.
Right-anchored mode lets you park levels to the right side of the chart with a configurable anchor distance.
Label merging keeps the display minimal when multiple levels coincide.
Price-scale-only markers available when you prefer fewer lines on the chart.
Inputs & customization
Display Style: Standard or Right Anchored (+ distance controls).
Levels toggles: enable/disable each period (Daily/Weekly/Monthly/Quarterly/Yearly), Monday range, 4H range, and session ranges.
Text: optional shorthand labels (e.g., PDH/PDL, PWH/PWL).
Colors: global white theme, with session highlights; you can override in the Inputs.
Price-scale markers: on/off toggle.
How to use it
Use previous High/Low as liquidity pools and areas to watch for sweeps, breaks, or retests.
The Monday range often frames the rest of the week; breaks or rejections around Monday H/L can be informative.
The 4H previous range gives intraday context—great for mean-reversion vs. continuation reads.
Session ranges help you see where the active session expanded price and where liquidity may remain.
Notes & limitations
Sessions are computed in America/Chicago; higher-TF levels use the symbol’s exchange timezone.
This is an indicator, not a strategy; it does not place trades or claim performance.
Always combine levels with your own execution rules (structure, momentum, risk).
Credit: inspired by spacemanBTC; this version adds the all-white styling, Chicago-aligned sessions, right-anchoring, label merging, and price-scale markers.
Also my mentor to tell me about the levels
Disclaimer
This tool is for educational purposes only and is not financial advice. Markets involve risk; do your own research and manage risk appropriately.

Key Levels | Flux Charts💎 GENERAL OVERVIEW
Introducing our new Key Levels indicator! This indicator allows you to see the key levels on the current chart such as previous day lows / highs, pre-market data, yesterday's close, today's open, pivot points, and much more! It's highly user-friendly with every line being individually customizable and having a wide range of text options.
Features of the new Key Levels indicator :
Today & Yesterday High, Low, Open & Close
Previous 3-10th Day Highs & Lows
Pre-Market Highs & Lows
Previous Month High & Low
High & Low Pivots
Combination Of Same Levels
Wide Customization Options
📌 HOW DOES IT WORK ?
Key levels are important areas in a chart where a significant reaction is expected. In this indicator, you can enable up to the previous 10 days highs and lows, yesterday's close / today's open, and the latest pivot points. Key levels generally act like support & resistance. Here are a few examples :
As shown, key levels play an important role determining the current trend and can be useful in identifying potential levels where the market will reverse or breakout.
🚩UNIQUENESS
1. More Key Levels
We believe that past key levels may be as important as current ones. Some of the key-levels indicators do not include them even though strong reactions can happen around them. Thus, our indicator let's you check up to 10 days backwards.
You can select the ones you think that are the most important and just enable them, making the indicator customizable to your liking.
2. Pre-Market Data
With assets that have pre-market data available, it's crucial to analyze it to have a better understanding of the market in regular trading hours. Our indicator will plot pre-market highs and lows, even if your chart is in the regular trading hours only mode. We believe this will be helpful with your analyzing process.
3. Combination
The indicator can dynamically combine same key levels, so you can have a clear look to the chart without lines & text colliding with each other. This would also help you determine stronger key levels as if a key level occured more than a time, it could be a sign that it's a stronger one. An example :
To summarize, using key levels is an essential skill while detecting zones where strong reactions are expected. This indicator provides up to 10 day's high and low levels, and all of them can be individually turned on / off. Traders that believe older key levels can be important and want to look at the whole picture may use this feature. Also for assets that have pre-market data available, the indicator provides pre-market levels as well. Besides all that, High & Low pivots will provide latest key levels so traders can use them in their decisions.
⚙️SETTINGS
1. General Configuration
You can enable / disable :
1. Today's High / Low / Open
2. Yesterday's High / Low / Close
3. 3th-10th Day High / Low
4. Pre-Market High / Low
5. Previous Month High / Low
You can also change the colors and switch their line styles between solid, dashed and dotted.
2. High & Low Pivots
Enabled -> Enable / Disable High & Low Pivots
Pivot Range -> The range used in the detection of pivot points. Larger values will result in less pivot points, while smaller values will provide more pivot points. This essentially determines how many bars to the right & left shouldn't exceed the pivot's high or low.
You can also change the text color and text size of the pivots from the settings.
3. Style settings
Text Offset -> How many bars of offset should the texts have to the right. Increase if text collides with bars while Align Labels option is set to "Right".
Extend Lines -> If enabled, lines will be extended infinitely to right & left. If disabled, all lines will be clamped in their timelines.
Show Line Values -> If enabled, line information text will contain their price.
Align Labels ->
Right = Align line labels to right.
Center = Line labels will always be at the center of the screen.

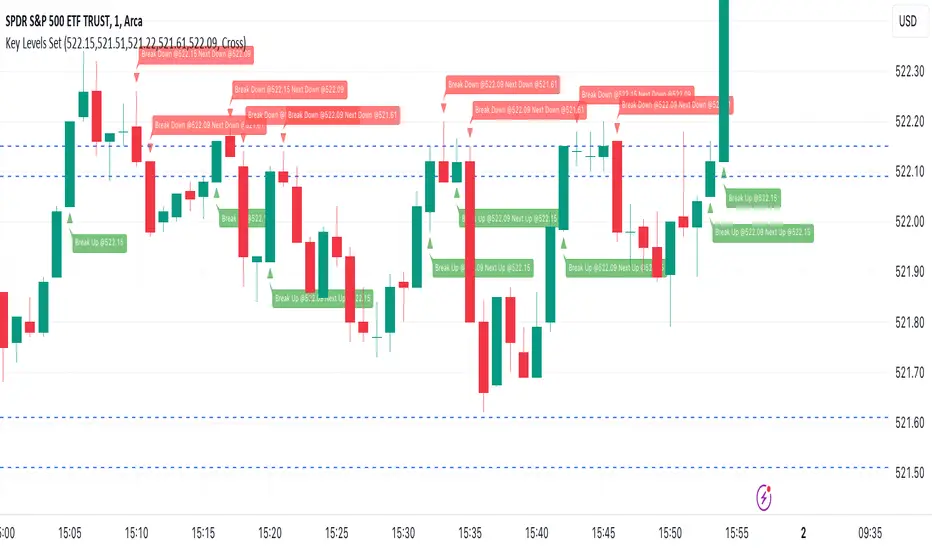
Key Levels SetKey Levels Set allows to set key levels as comma separated values, and to detect breaks to the downside and/or upside, taking into account potential gaps between bars.
This indicator can be very handy if you, like me, rely on some key levels that you identified as potential support/resistance from some technical analysis.
Features
+ It allows for key levels to be set as comma separated values.
+ It draws key levels on chart.
+ On close, it identifies highest key level that has been broken to the upside, if any.
+ On close, it identifies lowest key level that has been broken to the downside, if any.
+ In Cross mode, as bar is printing, it also detects highest/lowest key levels being broken to the upside/downside between bar high and low, if any.
+ It plots and labels breaks with current level and next level information.
+ It includes alerts from breaks on close.
+ It includes turn on/off functionality.
Settings
+ {Prices} checkbox: turns on/off entire functionality
+ {Prices} text field: comma separated values for key levels
+ {Breaks on} checkbox: turns on/off breaks detection functionality
+ {Breaks on} options: selects Close or Cross mode
Key-Levels - D/W/M High-Low + Fib + MA🧭 Key-Levels – D/W/M High-Low + Fibonacci + Moving Averages
A complete multi-timeframe analysis toolkit that combines Daily, Weekly, and Monthly high/low levels, Fibonacci retracements, and customizable moving averages — all in one clean, efficient display.
Ideal for traders who want to identify key reaction zones, retracement levels, and trend alignment across multiple timeframes.
🔹 Features
1. Prior High/Low Levels
Plots Daily (PDH/PDL), Weekly (PWH/PWL), and Monthly (PMH/PML) key levels
Adjustable colors, styles (Solid / Dashed / Dotted), and line widths
Optional midline display for each timeframe
Displays live labels with price values and % difference from current close
Extend lines rightward to project future price interactions
2. Fibonacci Retracement
Auto-detects swing highs/lows using configurable pivot lengths
Smart pivot logic prioritizes major swings based on % span
Auto-orients retracements depending on trend direction
Customizable visibility and color for each Fibonacci level
Supports 0.236 → 1.618 levels, with optional auto-extension in uptrend scenarios
Displays ratio + price for each level label
3. Pivot Labels
Optionally show pivot high/low labels with customizable text and background colors
Independent control of left/right length and label style
4. Moving Averages
Up to three customizable MAs (default: 8 EMA, 21 EMA, 50 SMA)
Choose between EMA or SMA for each
Toggle individual or all moving averages
Adjustable lengths, colors, and line widths
5. Alerts
Built-in alert condition for price crossing a user-defined level
Clean alert message format with ticker symbol and live price
⚙️ Customization
Flexible style controls for lines, labels, and colors
Adjustable right-extension length for projecting levels
Font size and visibility toggles for all elements
Smart grouping for intuitive settings management
📈 Ideal For
Identifying key reversal or breakout zones
Spotting Fibonacci confluence between retracements and prior highs/lows
Tracking trend structure via multi-timeframe MAs
Swing traders, intraday traders, and technical analysts
💡 Summary
Key-Levels – D/W/M High-Low + Fib + MA is a professional-grade indicator designed to simplify complex multi-timeframe analysis.
It helps you see the bigger picture, find actionable zones, and trade with confidence.
🧩 Compatible with any market and timeframe.


Key LevelsI couldn't find an indicator that plotted previous day and intraday key levels like I wanted.
This indicator plots key levels on the chart:
Current session high (HOD) and low (LOD)
Previous day high (PDH), low (PDL), and close (PDC)
Overnight high (ONH) and low (ONL) based on a defined overnight window
At the start of a new session (day), the indicator resets its values and creates a new set of labels.
These labels are positioned in a fixed horizontal column (offset from the current bar) and are updated each bar so that they remain vertically aligned with their corresponding level (with a small vertical offset).
Inputs you can modify:
Futures Mode and session times for equities and futures.
Horizontal label offset (in bars) and vertical offset (price units) for label positioning.
Colors, line widths, and styles for each level (day high, day low, overnight high/low, previous day levels).
Adjust these inputs to match your market hours and desired appearance.
Zero background in coding, but worked with chatGPT to develop this, and it works for me. Would welcome any and all feedback.

Key Levels (Open, Premarket, & Yesterday)OVERVIEW
This indicator automatically identifies and draws recent high-probability support and resistance levels (recent key levels). Specifically, yesterdays highs / lows, premarket highs / lows, as well as yesterdays end of day Volume Weighted Average Price and trader specified Moving Average.
This is most useful on charts with intraday time frames (1 minute, 5 minute etc.) commonly used for day trading. This is not ideal for larger time frames (greater than 1 hour) commonly used for swing trading or identifying larger trends.
INPUTS
You can configure:
Line size, style, and colors
Label colors
Which key levels you want to see
Moving Average Parameters
Market Hours and Time Zone
DEV NOTES
This script illustrates:
A method for iterative management of more complex data objects (not just discrete values) with loops and arrays.

Basic Key Levels | Feng FuturesKey Levels | Feng Futures (Basic) automatically plots the most essential daily reference levels used by futures traders to establish intraday context and structure.
This lightweight version focuses on the three levels that matter most for session bias and liquidity reference:
Previous Day High (PDH)
Previous Day Low (PDL)
Session Open (18:00 NY for futures)
These levels are commonly used by professional and institutional participants as decision points for:
directional bias
continuation vs. reversal context
risk definition and invalidation
Features:
• Auto-plotted PDH and PDL
• Futures session open (18:00 NY)
• Clean, non-repainting levels
• Lines extend forward for intraday use
• Optional price labels pinned to the right edge
• Minimal design to reduce chart clutter
• Full color, width, and label customization
• Optimized for intraday futures trading
This indicator does not provide trade signals or alerts.
It is designed to support planning, execution, and review within your own trading framework.
Best used on:
ES, NQ, RTY, YM (intraday timeframes)
PDH / PDL levels can be used as take profit targets or to help form bias. For example, if we break out of PDH, we may look for longs.
Disclaimer:
This indicator is for educational purposes only and does not constitute financial advice. Trading futures involves significant risk and may not be suitable for all investors. Always do your own research and use proper risk management.

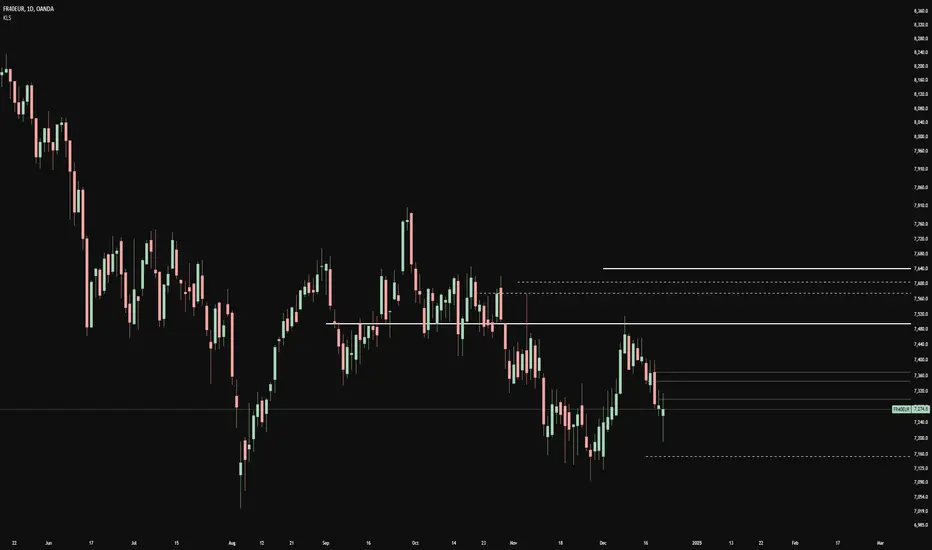
Key Levels// How it Works \\
Calculating Previous Days, Weeks and Monthly open, high, low, close and vwaps
Plots these levels on your chart
// Settings \\
You can enable/disable any of the levels you want to see
You can also change the amount of bars back the levels are plotted back to
// Use Case \\
These levels are often used in different methods of Technical analysis for support and resistance.
// Suggestions \\
Happy for anyone to make any suggestions on changes which could improve the script,
// Terms \\
Feel free to use the script, If you do use the script could you please just tag me as I am interested to see how people are using it. Good Luck!
