Market Sector Scanner/Screener With MOM + RSI + MFI + DMI + MACDMARKET SECTOR SCANNER/SCREENER MOM + RSI + MFI + DMI + MACD FOR STOCKS CRYPTO & FOREX
This script scans 9 markets constantly and returns the values of 5 different popular indicators.
This indicator helps you see when one of your favorite stocks is bullish or bearish when you are not watching that chart so you can always catch the big moves as they happen.
***HOW TO USE***
A great way to use this market screener is to set up separate chart layouts for each sector you like to trade. Such as the top 9 stocks in the S & P 500, top 9 stocks in the XLF etf, etc. Make sure to set up separate chart layouts in Tradingview so you don’t have to change the symbols constantly. This will give you a good idea in real time if that entire sector is bullish, bearish or mixed. When the entire grid goes red or green, those are very strong signs of market direction across that entire sector, so trades in the corresponding direction are quite safe.
This can be done for crypto as well, using the top 9 cryptocurrencies by market cap. Watch the grid and wait for the entire lot to turn green or red and then take a position in that direction.
You can also use this with a variety of your favorite tickers so you can see when specific markets are looking strong in either direction, instead of constantly changing charts or missing good opportunities because you weren’t watching that specific chart.
This grid can also be used to determine how long to hold a position as well. If the entire grid is still green or red, according to your trade direction, you can usually expect price to continue in that direction until you see some conflicting colors start to pop up on the grid. As it starts to give mixed signals, you can expect the market to be indecisive or reverse which is a good time to get out.
If you have your scanner setup to show similar markets in one sector, be careful taking trades when the grid is very mixed in color. This shows signs of indecision and will likely have choppy price action until the market decides a direction so make sure to use caution when the grid is mixed. It is best to wait for the entire grid to turn green or red and then take position.
***COLOR MEANINGS***
When each indicator value is in bullish territory, the background of that value will turn green.
When each indicator value is in bearish territory, the background of that value will turn red.
When each indicator value is in neutral territory, the background of that value will turn blue.
When all 5 indicators for a ticker are bullish, the ticker background will turn green.
When all 5 indicators for a ticker are bearish, the ticker background will turn red.
When there is a mixture of bullish and bearish values, the ticker background will turn blue.
***CUSTOMIZATION***
You can customize which tickers are in your scanner including stocks, crypto, futures and forex, the source of the indicators, the length of the indicator settings and the smoothing parameters.
***INDICATORS USED***
The indicators used for each ticker are as follows:
Momentum(MOM) - Default length is 14. Bullish is above zero, bearish is below zero.
Relative Strength Index(RSI) - Default length is 14. Bullish is above 50, bearish is below 50.
Money Flow Index(MFI) - Default length is 14. Bullish is above 50, bearish is below 50.
Directional Movement Index(DMI) - Default length is 14 and smoothing is 14. Calculated by subtracting di minus from di plus. If the value is positive, it is bullish. If the value is negative, it is bearish.
Moving Average Convergence & Divergence(MACD) - Default settings are 12, 26, 9. If the short line is greater than the long line, then it is bullish. If the short line is less than the long line, it is bearish.
***MARKETS***
This market scanner can be used as a signal on all markets, including stocks, crypto, futures and forex.
***TIMEFRAMES***
This scanner can be used on all timeframes and pulls data from other tickers using the same timeframe as what your current chart is set to.
***TIPS***
Try using numerous indicators of ours on your chart so you can instantly see the bullish or bearish trend of multiple indicators in real time without having to analyze the data. Some of our favorites are Trend Friend Scalp & Swing Signals, Auto Fibonacci, Directional Movement Index, Volume Profile With Buy/Sell Pressure, Auto Support And Resistance and Money Flow Index in combination with this Scanner. They all have real time Bullish and Bearish labels as well so you can immediately understand each indicator's trend.
Поиск скриптов по запросу "macd"

MACD + AveragesA classic MACD with average peak and dip lines. The lighter green and red horizontal lines are the average peak and dip of the entire span, respectively. The second, bolder of the two lines are the averages of the peaks and dips above and below the overall peak and dip averages. The filled in color is to help visualize these averages and possible trade setups.
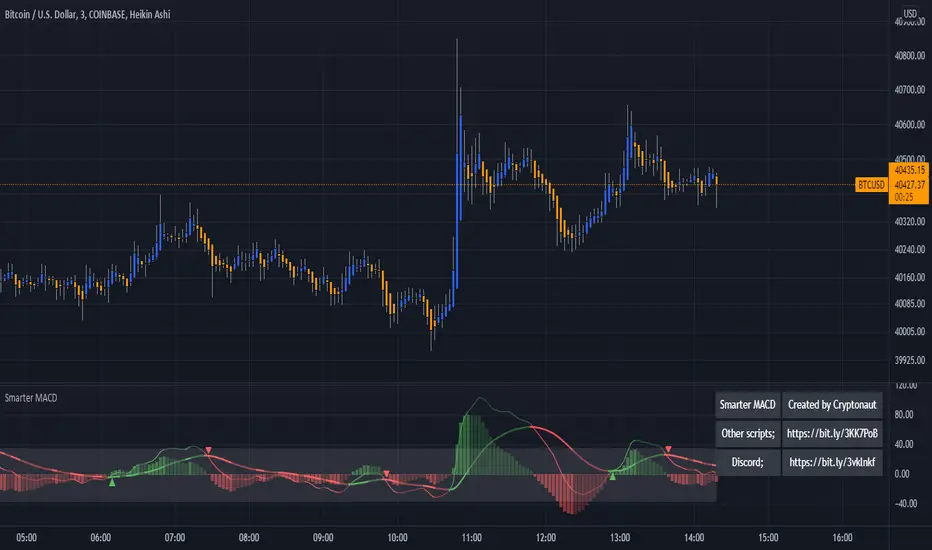
Micro MACDMicro version of the MACD
Positioning
ATR - uses ATR to position indicator 1.5x above high of the Nth bar (needs improvement)
Absolute - allows you to specify the zero line position using price on the chart.

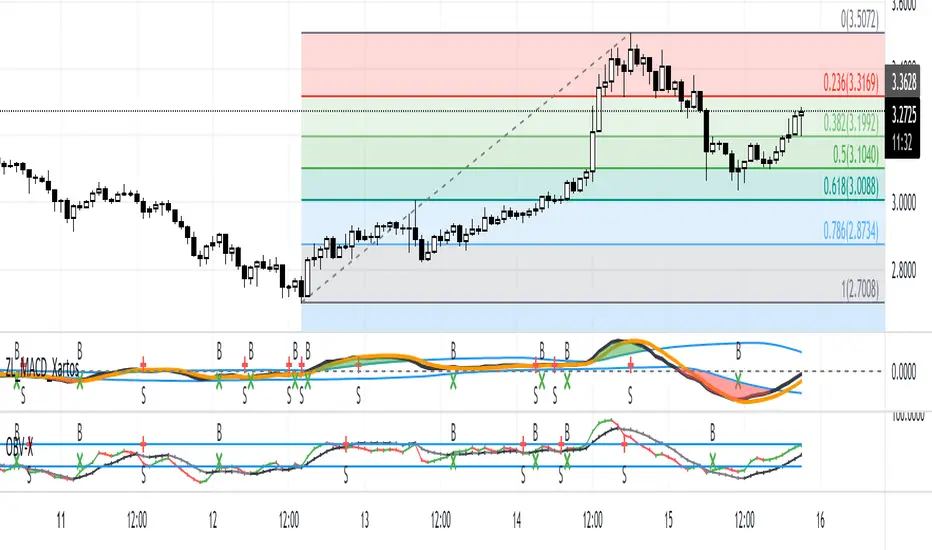
Xartos ZeroLag MACD + MOM Indicatorinspired by Grimmes MACD HIGH LOW indicator,
this script uses ZL MACD for fast adaption to changes. High Low MOM uses EMA instead of sma. HF

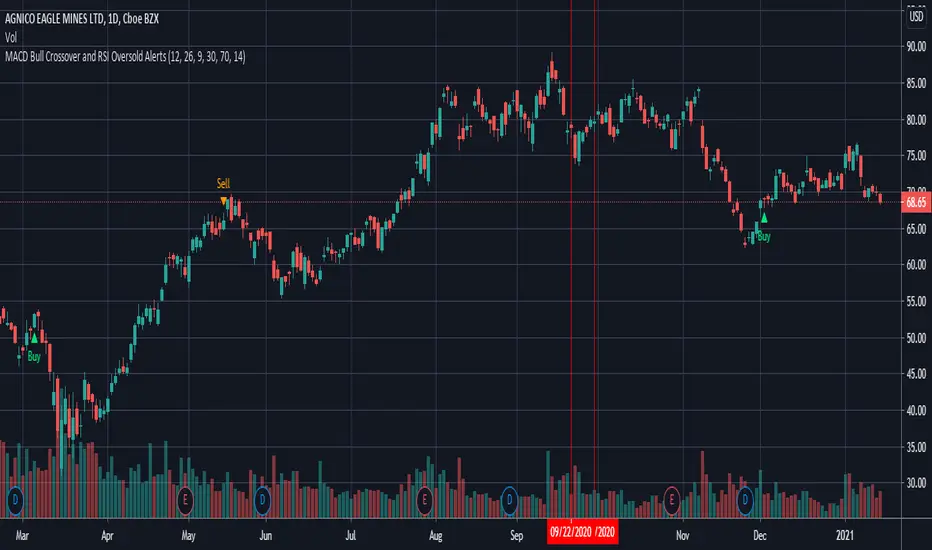
MACD Bull Crossover and RSI Oversold - AlertsHello everyone, these are the alerts for my previous "MACD Bull Crossover and RSI Oversold" Long Strategy. This version currently does not support stoploss and takeprofit alerts but the next update will.
MACD and EMA200 With SignalsThis is my first indicator. It PROVIDES BUY, SHORT, and FALSE Signals by taking the MACD and the 200EMA.

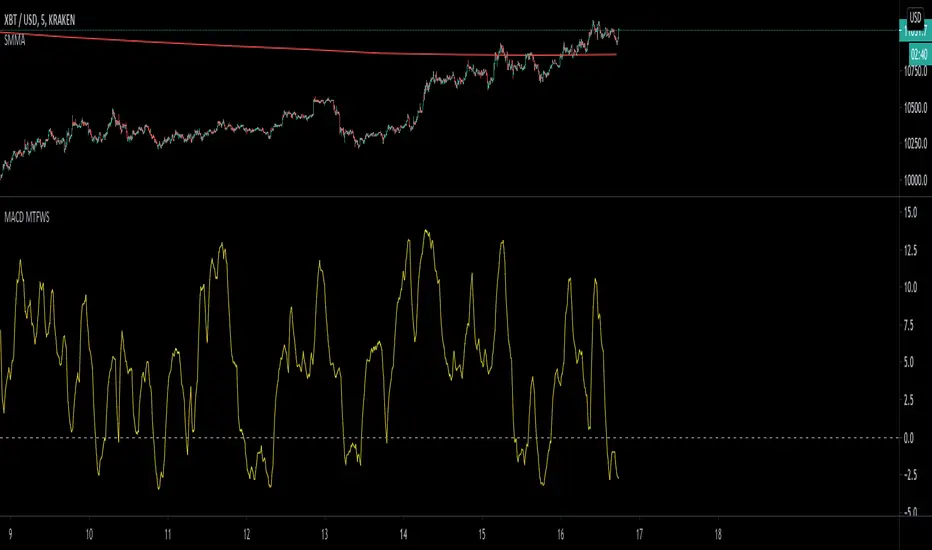
MACD Multiple Time Frames Weighted Momentum Score OscillatorThis script looks at the current momentum direction (up or down) for the 5 minute, 30 minute, 1 hour, 4 hour and daily and allows you to set scores of importance to these.
These scores are then added up to create an oscillator matching your preferences. Tune the indicator to match what you believe is the most important time frames that people use and score it accordingly. The values I put by default are just for demonstration.
For example, (and if you want to test to verify it's working), set the scores to 0 for everything except for the daily). Look at the daily macD by adding it as an indicator and set a score. Whenever the macD is trending up it will add the appropriate value to the score and likewise remove it when it's not.
Enjoy!
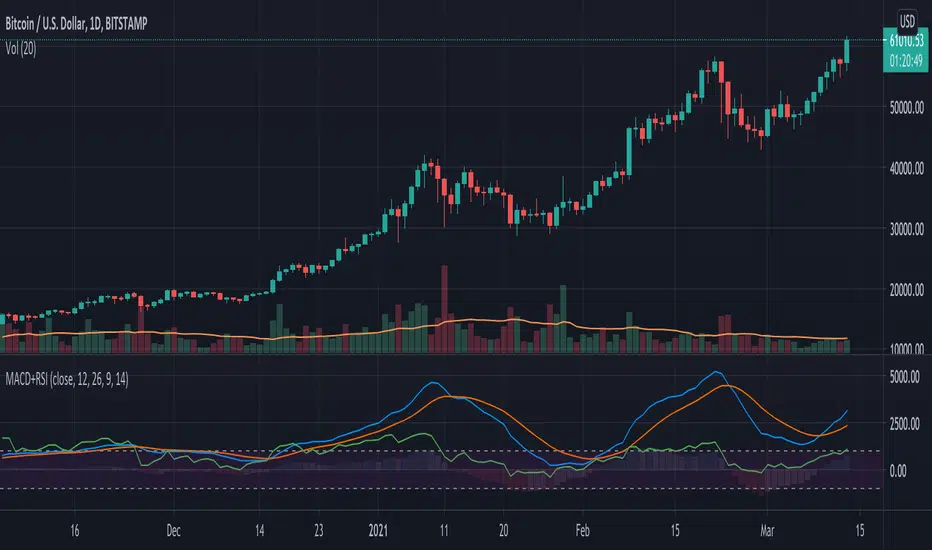
MACD & RSIThis indicator shows the MACD and the RSI in one chart. So that both oscillators can be displayed, the RSI was subtracted by 50.
The RSI ranges between 50 and -50 (default 0-100)
The MACD is in the normal setting.

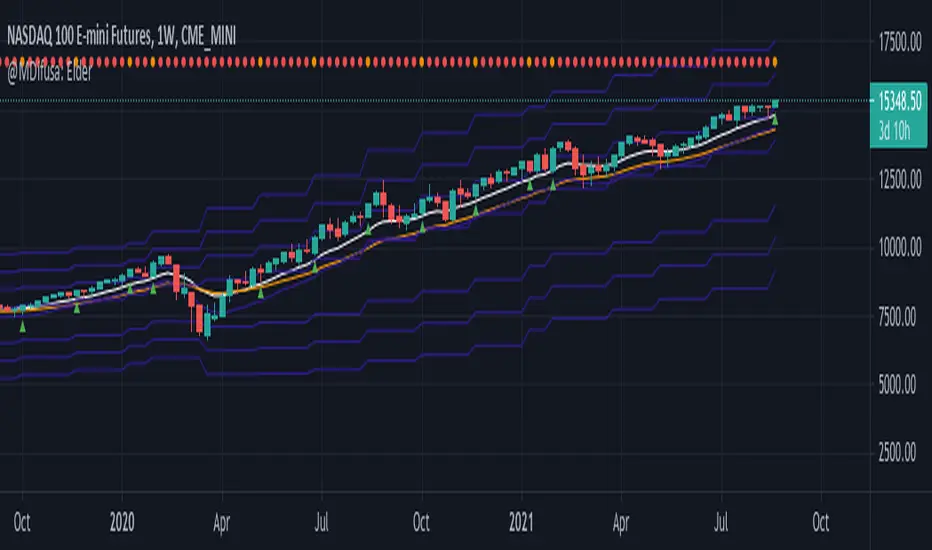
Elder EMA, ATR & MACD Indicator, 5X Time Frame & Divergences.This indicator is elaborated following the 3 window strategy described by Elder.
The fast, slow averages and MACD histogram are taken from a time frame 5 times higher than the active time frame and indicate bullish / bearish trends as well as divergences (bottom) of the hostogram with the price.
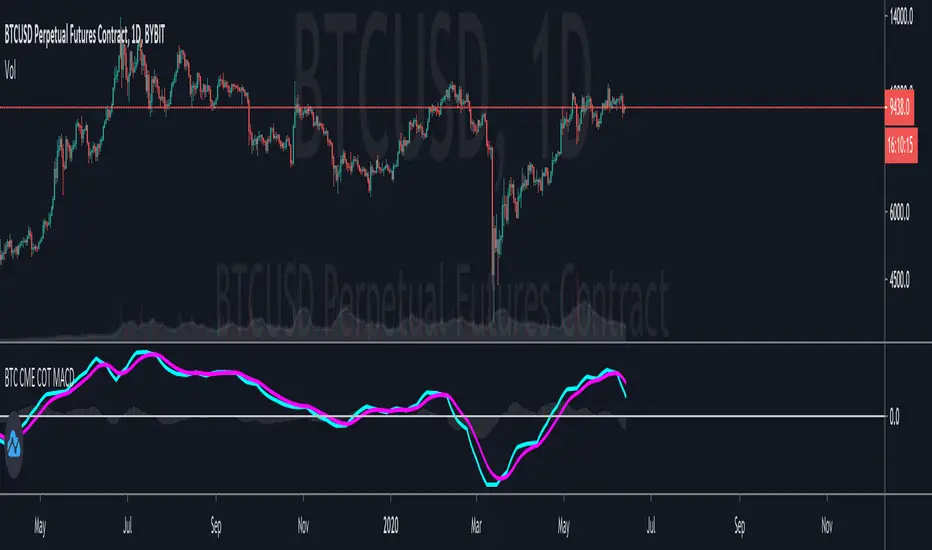
Bitcoin CME Retail vs Professionals MACD
This is an interesting study using the data provided by the Bitcoin CME Commitment of Traders report.
The MACD plot the difference between the Retail Traders positions and the Professional Traders positions.
The general idea is that Professional Traders have a better read on the market than Retail Traders.
The signal line helps to identify the trend that it is moving in.
I believe that this plot helps to visualize the overall market sentiment better than the raw COT data.
Try it out and let me know what you think!
MACD with BGThis is a standard MACD indicator with Background colour and the option to draw the Background colour of the next higher timeframe.
DiNapoli MACD MTFSimple oscillator, based on formula from Joe Dinapoli for MACD oscillator. Simply it's analysing current timeframe (bottom row) and 2 higher timeframes.

Minkowski Distance Factor Adaptive Period MACDHi, this script comes from the idea that Ricardo Santos' Minkovski Distance Function is transferred to the period as a factor.
Minkowski distance is used as a percentage factor with the help of Relative Strength Index function.
Minkowski Distance Function Script :
And thus an adaptive MACD was created.
This script can give much better results in more optimized larger periods.
I leave the decision to determine the periods and weights.
I used the weights of 9,12,26 and periods created with multiplied by factor.
Regards.

[fikira] MACD & RSI+Stoch + DivergencesThis is a new version of my "Divergences"
Compared to my "Divergences (Pivots)", this is calculated totally different
There are 3 options:
- MACD
- RSI
- Stoch RSI
Since this script is very heavy in calculation it is limited in time (= inspired from a script of "Che_Trader")
Also it uses "max_bars_back" (=1000)
For MACD and Stoch RSI there is a "custom Divergences Period", which compares more then 7 Pivot Points,
the higher the number, the less reliable, it is not necessary to use this, but it is there,
also you can change the "leftbars" and "rightbars", again, it is not necessary to change, but you can...
Linewidth and style of the Divergences lines can be changed
Thank you!

Bollinger Bands on MacdOnly longs when Macd line is above Bollinger Band and shorts when Macd line is above Bollinger Band, this will avoid many problems.
thumbs up!!!

PHI MACDPhiCube calibrated 3-line MACD with candle coloring function at intersections! NOTE: Interesting to use in conjunction with PHI EMAs + MAs.
Personal Preferences: I use the Series 4 parameters, averages 72 17 34 and 144, but you can set it in the Flow Diffuser parameters 55 21 34 and 144, or according to your preferences.
Hope you like it!

Double MACD Buy and SellIndicator for strategy that was used in a Forex competition and was a winner. Use double MACD with custom settings, search video on YouTube:
Learn Five Powerful MACD Trading Strategies
Add some tools to analyze the market context a little more:
- Detector of regular and hidden divergences.
- Atlas Zone (detects consolidation that is about to generate a movement)
- Choppines zone configurable (detects if the market is stable or not)
Visualization of entries in trend and counter-trend according to the rules described in the video.
Buy and sell alerts.
Note: I do not recommend using only this indicator as an investment strategy, it is another tool that must be complemented with a market study by the trader.
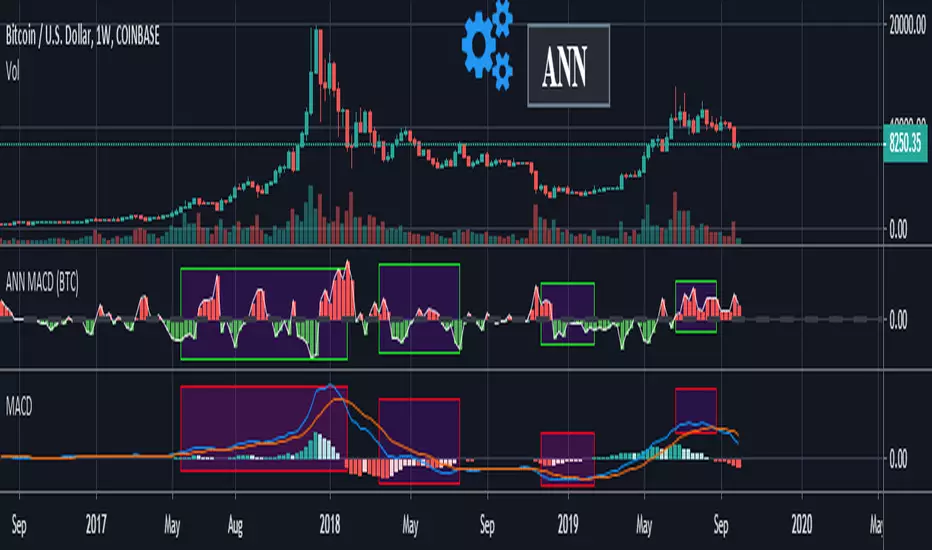
ANN MACD (BTC)
Logic is correct.
But I prefer to say experimental because the sample set is narrow. (300 columns)
Let's start:
6 inputs : Volume Change , Bollinger Low Band chg. , Bollinger Mid Band chg., Bollinger Up Band chg. , RSI change , MACD histogram change.
1 output : Future bar change (Historical)
Training timeframe : 15 mins (Analysis TF > 4 hours (My opinion))
Learning cycles : 337
Training error: 0.009999
Input columns: 6
Output columns: 1
Excluded columns: 0
Grid
Training example rows: 301
Validating example rows: 0
Querying example rows: 0
Excluded example rows: 0
Duplicated example rows: 0
Network
Input nodes connected: 6
Hidden layer 1 nodes: 8
Hidden layer 2 nodes: 0
Hidden layer 3 nodes: 0
Output nodes: 1
Learning rate : 0.6 Momentum : 0.8
More info :
EDIT : This code is open source under the MIT License. If you have any improvements or corrections to suggest, please send me a pull request via the github repository github.com
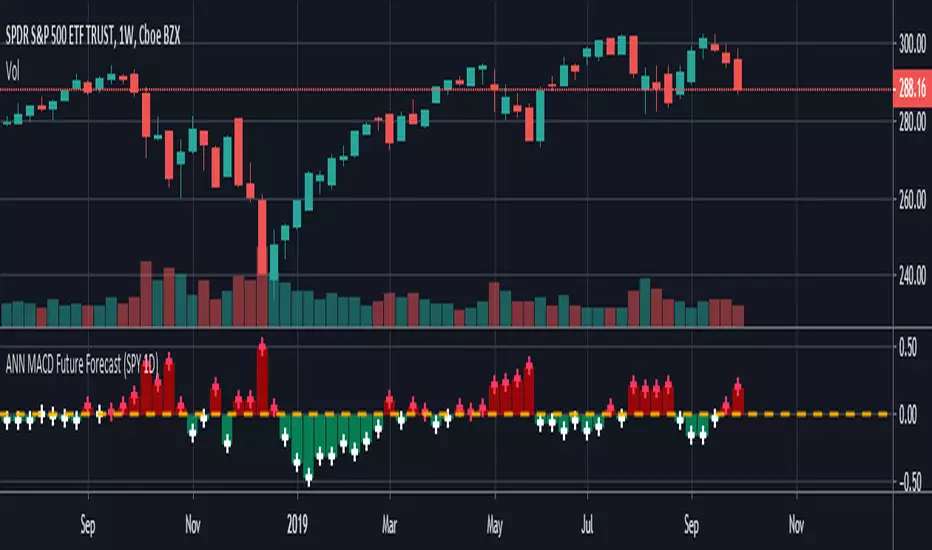
ANN MACD Future Forecast (SPY 1D) NOTE : Deep learning was conducted in a narrow sample set for testing purposes. So this script is Experimental .
This system is based on the following article and is inspired by an external program:
hackernoon.com
None of the artificial neural networks in Tradingview work and are not based on completely correct logic. Unlike others in this system:
IMPORTANT NOTE: If the tangent activation function is used, the input data must also have tangent values (compared to the previous values of 1 bar).
Inputs were prepared according to this judgment.
1. The tangent function which is the activation function is written correctly. (The tangent function in the article: ActivationFunctionTanh (v) => (1 - exp (-2 * v)) / (1 + exp (-2 * v)))
2. Missing bias parts in the formulas were added.
3. The output function is taken from the next day (historical), so that the next bar can be predicted, which is the truth.
4.The forecast value of the next bar is subtracted from the current bar change and the market direction is determined.
5.When the future forecast and the current close are added together, the resulting data is called seed.
The seed carries data both from the present and from yesterday and from the future.
6.And this seed was subjected to the MACD method.
Thus, due to exponential averages, more importance will be given to recent developments and
The acceleration situations will show us the direction.
However, a short position should be taken for crossover and a long position for crossunder .
Because the predicted values work in reverse.Even though we use the same period (9,12,26) it is much faster!
7. There is no future code that can cause Repaint.
However, the color after closing should be checked.
The system is completely correct.
However, a very narrow sample was selected.
100 data: Tangent diffs ; volume change, bollinger bands values changes (Upband , Midband , Lowband) and LazyBear's Squeeze Momentum Indicator (SQZMOM_LB) change and the next bar data (historical) price change were put into the deep learning test.
IMPORTANT NOTE : The larger the sample set and the more effective dependent variables, the higher the hit rate of the deep learning test!
EDIT : This code is open source under the MIT License. If you have any improvements or corrections to suggest, please send me a pull request via the github repository github.com
Stay tuned. Best regards!
MACD with RSI WarningI like using both MACD and RSI for my strategies to confirm patterns, but I really only check RSI to see if it is outside of the normal range. So I rewrote the MACD indicator to color bars that are above or below the set RSI boundaries in a different color (yellow by default) so I can quickly check that parameter without needing both indicators up.
This is my first indicator, so please feel free to let me know how I might clean it up!
Options - MACDThis is a standard MACD indicator with addition of a 9 period simple moving average, the settings for MACD is fixed and prefabricated for Options trading with two options for settings : short and long time