Impulse Alert - Demand (Buy) [Fixed]🔵 Impulse Alert – Demand (Buy)
This indicator is designed to detect high-probability Demand Zones based on impulsive bullish price action, helping traders get alerted only when it matters most.
🧠 Core Logic:
Scans the chart for 2 consecutive bullish impulsive candles with significant range (body size)
Also captures single large bullish impulse candles that often mark institutional buying
Marks the origin of the move as a potential Demand Zone
Sends alerts when such bullish setups form, allowing you to monitor charts passively
⚙️ Features:
✅ Alerts on impulsive move formations
✅ Detects both 2-candle and single-candle impulses
✅ Custom zone detection logic based on pip size and momentum
✅ Cleaner & smarter: removes distractions and avoids false signals
📌 Best Used For:
Smart Money / Supply & Demand traders
Identifying potential institutional buy zones
Executing trades with HTF confluence
Traders who want to get alerted without screen-watching
🔁 Suggested Strategy:
Set HTF directional bias (H1, H4, D1)
Use this indicator on LTF (1M–15M) for impulsive bullish entries
Wait for price to return to the marked zone for low-risk entries
💡 Pro Tip: Combine with your Supply Zone (Sell) indicator to track both sides of market structure and increase R:R
👤 Created by: Rohit Jadhav | YT/Insta/X - @GrowthByTrading
📬 Want updates, enhancements, or personal versions? Leave feedback or reach out through profile!
Поиск скриптов по запросу "market structure"
Midnight 30min High/LowMidnight 30min High/Low — Overnight Liquidity Range Tracker
Capture the Overnight Session: A Strategic Level Identification Tool from Professional Trading Methodology
This indicator captures the high and low prices during the critical 30-minute midnight session (12:00-12:30 AM EST) and projects these levels forward as key support and resistance zones. These overnight ranges often contain significant liquidity and serve as crucial reference points for intraday price action, representing areas where institutional activity may have established important levels.
🔍 What This Script Does:
Identifies Critical Overnight Session Levels
- Automatically detects the 12:00-12:30 AM EST session window
- Captures the highest and lowest prices during this 30-minute period
- Projects these levels forward for multiple trading days
Creates Dynamic Support/Resistance Zones
- Extends midnight high/low levels as horizontal lines with customizable projection periods
- Fills the area between high and low to create a visual trading range
- Updates automatically each trading day with new overnight levels
Provides Clear Visual Reference Points
- Optional session start markers (●) highlight when the midnight session begins
- Color-coded lines distinguish between high and low levels
- Transparent fill area creates an easy-to-identify trading zone
Real-Time Level Tracking
- Updates levels in real-time during the active midnight session
- Maintains historical levels for reference and backtesting
- Compatible with data window for precise level values
⚙️ Customization Options:
Extend Days (1-30):** Control how many days forward the levels are projected (default: 5 days)
High Line Color:** Customize the midnight high line color (default: blue)
Low Line Color:** Customize the midnight low line color (default: orange)
Fill Color:** Adjust the transparency and color of the range area (default: light aqua, 80% transparency)
Show Session Markers:** Toggle yellow session start indicators on/off (default: enabled)
💡 How to Use:
Deploy on lower timeframes (1m-15m) for precise level identification and reaction monitoring**
Watch for key price interactions:
- Rejection at midnight high levels (potential resistance)
- Bounce from midnight low levels (potential support)
- Range-bound trading between the high and low levels
Combine with liquidity concepts:
- Monitor for stop hunts above/below these levels
- Look for false breakouts that snap back into the range
- Use as confluence with other ICT concepts like FVGs and Order Blocks
Strategic Applications:
- Range trading between midnight levels
- Breakout confirmation when price closes decisively outside the range
- Support/resistance validation for entry and exit planning
🔗 Combine With These Tools for Complete Market Structure Analysis:
✅ First FVG — Opening Range Fair Value Gap Detector.
✅ ICT Turtle Soup (Liquidity Reversal)— Spot stop hunts and false breakout scenarios
✅ ICT Macro Zones (Grey Box Version)- It tracks real-time highs and lows for each Silver Bullet session
✅ ICT SMC Liquidity Grabs and OBs- Liquidity Grabs, Order Block Zones, and Fibonacci OTE Levels, allowing traders to identify institutional entry models with clean, rule-based visual signals.
Together, these tools create a comprehensive Smart Money Concepts (SMC) framework — helping traders identify, anticipate, and capitalize on institutional-level price movements with precision and confidence during critical overnight sessions.

VWAP Volume Profile [BigBeluga]🔵 OVERVIEW
VWAP Volume Profile is an advanced hybrid of the VWAP and volume profile concepts. It visualizes how volume accumulates relative to VWAP movement—separating rising (+VWAP) and declining (−VWAP) activity into two mirrored horizontal profiles. It highlights the dominant price bins (POCs) where volume peaked during each directional phase, helping traders spot hidden accumulation or distribution zones.
🔵 CONCEPTS
VWAP-Driven Profiling: Unlike standard volume profiles, this tool segments volume based on VWAP movement—accumulating positive or negative volume depending on VWAP slope.
Dual-Sided Profiles: Profiles expand horizontally to the right of price. Separate bins show rising (+) and falling (−) VWAP volume.
Bin Logic: Volume is accumulated into defined horizontal bins based on VWAP’s position relative to price ranges.
Gradient Coloring: Volume bars are colored with a dynamic gradient to emphasize intensity and direction.
POC Highlighting: The highest-volume bin in each profile type (+/-) is marked with a transparent box and label.
Contextual VWAP Line: VWAP is plotted and dynamically colored (green = rising, orange = falling) for instant trend context.
Candle Overlay: Price candles are recolored to match the VWAP slope for full visual integration.
🔵 FEATURES
Dual-sided horizontal volume profiles based on VWAP slope.
Supports rising VWAP , falling VWAP , or both simultaneously.
Customizable number of bins and lookback period.
Dynamically colored VWAP line to show rising/falling bias.
POC detection and labeling with volume values for +VWAP and −VWAP.
Candlesticks are recolored to match VWAP bias for intuitive momentum tracking.
Optional background boxes with customizable styling.
Adaptive volume scaling to normalize bar length across markets.
🔵 HOW TO USE
Use POC zones to identify high-volume consolidation areas and potential support/resistance levels.
Watch for shifts in VWAP direction and observe how volume builds differently during uptrends and downtrends.
Use the gradient profile shape to detect accumulation (widening volume below price) or distribution (above price).
Use candle coloring for real-time confirmation of VWAP bias.
Adjust the profile period or bin count to fit your trading style (e.g., intraday scalping or swing trading).
🔵 CONCLUSION
VWAP Volume Profile merges two essential concepts—volume and VWAP—into a single, high-precision tool. By visualizing how volume behaves in relation to VWAP movement, it uncovers hidden dynamics often missed by traditional profiles. Perfect for intraday and swing traders who want a more nuanced read on market structure, trend strength, and volume flow.

MP MTF LiquidityMP MTF Liquidity
Multi-Timeframe Liquidity Levels – Automatic High/Low Tracking
This indicator automatically tracks and draws liquidity levels (recent highs and lows) from up to 6 custom timeframes directly on your chart. It’s designed for advanced traders who want to visualize important swing points and liquidity pools across multiple timeframes—ideal for Smart Money Concepts (SMC), ICT, and price action trading.
Key Features:
Multi-Timeframe Support:
Select up to 6 different timeframes (ex: 1H, 4H, Daily, Weekly, etc.), each with separate color and visibility controls.
Real Liquidity (No Repaint):
Levels are only drawn from fully closed bars on each timeframe—no lines from currently forming candles, ensuring accuracy and no forward-looking bias.
Automatic Detection:
Highs and lows are detected automatically. Levels that get swept (price breaks through) are converted to dashed lines for easy visual distinction.
Customizable:
Choose line colors for highs/lows and set the maximum number of active levels per timeframe to keep charts clean.
Extended Lines:
All levels are extended to the right, helping you see how current price interacts with past liquidity.
How It Works:
On every new bar of your chosen higher timeframe(s), the indicator records the high and low of the previous (just-closed) candle.
These levels are extended as rays until price sweeps (crosses) them.
When a level is swept, it is redrawn as a dashed line to highlight liquidity grabs or stop hunts.
No lines are drawn for the “live” bar—only confirmed, closed levels are displayed.
Who is this for?
SMC, ICT, and price action traders seeking high-confidence liquidity zones.
Intraday, swing, and multi-timeframe traders who want an automated, visual edge.
Anyone wanting to avoid repainting or “fake” levels from unfinished candles.
Tip:
Combine this indicator with your favorite order block, fair value gap (FVG), or market structure tools for even greater context and confluence.
Disclaimer:
No indicator guarantees profits. Always use with proper risk management and in conjunction with your trading plan.

DP_ORB Entry & Exit IndicatorDisclaimer:
This indicator is for educational purposes only. It does not constitute financial advice. Always do your own research and manage your risk. Also, I cannot take full credit for 'ORB' as its a well known strategy amongst many traders, but I do need to give a special shout out to @TheBigDaddyMax for putting me on to this.
DP_ORB Entry & Exit Indicator
Description:
The DP_ORB Entry & Exit Indicator is a powerful tool designed for traders who utilize the Opening Range Breakout (ORB) strategy on the NYSE session. This indicator visually identifies the initial volatility window of the trading day, by marking the 15m High, and 15m Low into a ORB Box, & then tracks breakout opportunities, and provides clear, dynamic trade management levels—all directly on your chart.
Key Features:
Automatic Opening Range (ORB) Box:
Identifies and plots the high and low of the user-defined opening range (default 9:30–9:45 NYSE) for visual reference and strategy foundation.
Breakout Entry Signals:
Automatically detects and marks long or short breakout entries when price closes above or below the ORB range, with additional momentum confirmation.
Dynamic Stop Loss:
Stop loss is intelligently set to the previous bar’s low for long trades (or high for shorts), adapting to market structure at entry.
Take Profit Targets:
Up to three fully adjustable take-profit levels are plotted, calculated as percentages from entry, supporting progressive trade management.
Visual Trade Management:
Entry, stop loss, and take profit levels are displayed as extending dashed lines from entry point to the current bar, with labels always shown just to the right of price for clarity on all timeframes.
Automatic Reset and Cleanup:
Visuals and logic reset daily and upon exit, ensuring a clean, uncluttered chart experience.
How to Use:
Set your preferred opening range time and take profit levels in the settings.
Wait for a breakout and confirmation during the NYSE session.
Use the on-chart lines and labels to manage your trade according to your risk and strategy plan.
Best For:
Day traders and scalpers seeking a disciplined, visual, and fully-automated approach to opening range breakout trading.

First FVG📘 Indicator Description (English)
First FVG – NY Open is a TradingView indicator designed to automatically identify the first Fair Value Gap (FVG) that appears during the New York session, following the ICT (Inner Circle Trader) methodology.
It highlights institutional inefficiencies in price caused by imbalanced price action and helps traders spot high-probability entry zones, especially after the 9:30 AM EST (New York Open).
⚙️ How It Works
Session time: The indicator scans for FVGs starting at 9:32 AM (allowing 3 candles after the NY Open to form).
FVG Conditions:
Bullish FVG: When the high of 2 candles ago is lower than the low of the current candle and the middle candle is bullish.
Bearish FVG: When the low of 2 candles ago is higher than the high of the current candle and the middle candle is bearish.
Only the first FVG per session is drawn, as taught by ICT for setups like Judas Swing or NY Reversal models.
A colored box is drawn to represent the FVG zone.
A dotted horizontal line (CE) is drawn at the midpoint of the FVG box (Consequent Encroachment), a key level watched by smart money traders.
A dashed vertical line is drawn at 9:30 NY time to mark the open.
🧠 How to Use It
Wait for the NY Open (9:30 AM EST) – the indicator becomes active at 9:32 AM.
Watch for the first FVG box of the day. This is often a high-probability reaction zone.
Use the CE line (center of the FVG) as a reference for entries, rejections, or liquidity grabs.
Combine with market structure, PD Arrays, and liquidity concepts as taught by ICT for confluence.
The FVG box and CE line will extend forward for several candles for visual clarity.
🎛️ Customizable Settings
Session time (default: 09:32–16:00 NY)
FVG box color (up/down)
Text color
Max number of days to keep boxes on chart
Option to show or hide the 9:30 NY Open vertical line

Swing High/Low with Liquidity Sweeps🧠 Overview
This indicator identifies swing highs and swing lows based on user-defined candle lengths and checks for liquidity sweeps—situations where the price breaks a previous swing level but then closes back inside, indicating a potential false breakout or stop hunt. It also supports visual labeling and alerts for these events.
⚙️ Inputs
Swing Length (must be odd number ≥ 3):
Determines how many candles are used to identify swing highs/lows. The central candle must be higher or lower than all neighbors within the range.
Example: If swingLength = 5, the central candle must be higher/lower than the 2 candles on both sides.
Sweep Lookback (bars):
Defines how many bars to look back for possible liquidity sweeps.
Show Swing Labels (checkbox):
Optionally display labels on the chart when a swing high or low is detected.
Show Sweep Labels (checkbox):
Optionally display labels on the chart when a liquidity sweep occurs.
🕯️ Swing Detection Logic
A Swing High is detected when the high of the central candle is greater than the highs of all candles around it (as per the defined length).
A Swing Low is detected when the low of the central candle is lower than the lows of surrounding candles.
Swing labels are placed slightly above (for highs) or below (for lows) the candle.
💧 Liquidity Sweep Logic
A Sweep High is triggered if:
The current high breaks above a previously detected swing high,
And then the candle closes below that swing high,
Within the configured lookback window.
A Sweep Low is triggered if:
The current low breaks below a previous swing low,
And then closes above it,
Within the lookback window.
These are often seen as stop hunts or fake breakouts.
🔔 Alerts
Sweep High Alert: Triggered when a sweep above a swing high occurs.
Sweep Low Alert: Triggered when a sweep below a swing low occurs.
You can use these to set up TradingView alerts to notify you of potential liquidity grabs.
📊 Use Cases
Identifying market structure shifts.
Spotting fake breakouts and potential reversals.
Assisting in smart money concepts and liquidity-based trading.
Supporting entry timing in trend continuation or reversal strategies.

AdvancedOFPIAnalyzerLibrary "AdvancedOFPIAnalyzer"
Advanced Order Flow Pressure Index Analyzer Library
Implements sophisticated volume distribution analysis with candle microstructure
Provides comprehensive order flow assessment for institutional activity detection
analyzeAdvancedOrderFlow(priceOpen, priceHigh, priceLow, priceClose, volumeData, analysisWindow, institutionalSensitivity)
Performs comprehensive order flow analysis with advanced institutional detection
Parameters:
priceOpen (float) : float Opening price for analysis
priceHigh (float) : float High price for range calculation
priceLow (float) : float Low price for support detection
priceClose (float) : float Closing price for trend assessment
volumeData (float) : float Volume data for flow analysis
analysisWindow (int) : int Analysis window period
institutionalSensitivity (float) : float Institutional detection sensitivity
Returns: OFPI, momentum, institutional detected, strength, phase, overall strength, class, volume available, trend, efficiency, market structure
calculateMicrostructurePressure(priceOpen, priceHigh, priceLow, priceClose, volumeData, microWindow)
Calculates sophisticated order flow pressure with comprehensive candle microstructure analysis
Parameters:
priceOpen (float) : float Opening price for pressure calculation
priceHigh (float) : float High price for range analysis
priceLow (float) : float Low price for support detection
priceClose (float) : float Closing price for trend assessment
volumeData (float) : float Volume data for pressure analysis
microWindow (int) : int Microstructure analysis window
Returns: Pressure index, buying pressure, selling pressure, body ratio, upper wick ratio, lower wick ratio, microstructure confidence, volume confirmation, institutional pressure, pressure velocity, microstructure quality
generateInstitutionalAlerts(priceClose, volumeData, alertSensitivity, lookbackPeriod)
Generates sophisticated volume-weighted institutional activity alerts
Parameters:
priceClose (float) : float Close price for analysis
volumeData (float) : float Volume data for detection
alertSensitivity (float) : float Alert sensitivity threshold
lookbackPeriod (int) : int Analysis lookback period
Returns: Institutional detected, alert level, phase, strength, volume signature, pressure signature, time signature, absorption signature, impact signature, reliability, active methods, priority

PriceLevels GBGoldbach Price Levels – Identify Algorithmic Key Zones
This open-source indicator is designed to help traders identify potential algorithmic key zones by highlighting price levels ending with specific numbers such as 03, 11, 29, 35, 65, and 71. These levels may act as inflection points or hesitation areas based on observed behavioral patterns in price movement.
What It Does:
📌 Scans and plots horizontal price levels where the price ends with one of the selected number combinations
🎯 Toggle on/off visibility for each number ending
🎨 Customize color and thickness for each level
🏷️ Shows price labels at the end of each line
🌗 Label styles (color/transparency) are adjustable for both dark and light chart themes
🧠 Why Use It:
This tool is ideal for discretionary traders who study market structure through static price anchors. It provides a visual reference for recurring numerical levels that may be used in algorithmic trading models or serve as psychological price zones.
⚠️ Disclaimer:
This script is open-source and intended for educational and analytical purposes only. No trading signals or performance guarantees are provided. Please use your own judgment when applying this tool in a trading context.

Crypto Cycle Projection📈 Crypto Cycle Projection – Indicator Description
This indicator is designed to visually track and forecast repeating price cycles in the crypto market. It highlights a defined time-based cycle starting from a chosen date or the latest bar on the chart. By identifying cycle Start, Midpoint, and End zones, traders can gain insights into timing-based market structure and possible pivot periods.
⚙️ User Settings Explained
Start Point
Start from Last Candle (useLastCandle) – When enabled, the cycle begins from the most recent candle on the chart.
Manual Date (Year / Month / Day) – If Start from Last Candle is disabled, you can manually set a specific start date for the cycle.
Display Options
- Show Projection (showZone) – Toggles the display of the main cycle projection.
- Show Outer Bars (showOuter) – Adds faded edge bars around the key cycle zones for better visual emphasis.
- Show Previous Cycle (showPreviousCycle) – Adds the prior cycle to the chart, going one full cycle period back from the main start point.
Show Next Cycle (showNextCycle) – Projects one additional cycle forward beyond the current.
Cycle Parameters
Cycle Period (cyclePeriod) – Defines the number of bars in a full cycle (e.g., 60 = 60 bars). This sets the spacing between Start → Midpoint → End.
Each cycle section is color-coded:
Start = White
Midpoint = Yellow
End = Green
These reference lines and zones help you align trades with cycle timing for potential reversals, continuations, or volatility expansions.
Co-author Credit:
Matthew Hyland @ParabolicMatt

Multi-Timeframe 20 EMA Horizontal LinesOverview
This Multi-Timeframe 20 EMA indicator provides intelligent trend analysis by displaying your current timeframe EMA alongside relevant higher timeframe EMA levels as horizontal support/resistance lines. On lower timeframes, you see all higher EMA levels for comprehensive multi-timeframe confluence, while on higher timeframes, it filters out lower timeframe noise to maintain focus on macro trends. This allows traders to align short-term entries with long-term market structure, identifying high-probability setups where multiple timeframe EMAs converge while using the current timeframe EMA for precise timing.
Feature
Multi-Timeframe Horizontal EMA Lines
The indicator fetches and displays 20 EMAs from five higher timeframes:
Daily (D): Daily 20 EMA
Weekly (W): Weekly 20 EMA
Monthly (M): Monthly 20 EMA
Quarterly (Q): 3-Month 20 EMA
Half-Yearly (HY): 6-Month 20 EMA
Intelligent Timeframe Filtering
Smart Display Logic: Only shows EMAs from timeframes higher than your current chart timeframe
Prevents Redundancy: Automatically filters out lower timeframe EMAs to avoid clutter
Example: On a 4-hour chart, you'll see Daily, Weekly, Monthly, Quarterly, and Half-Yearly EMAs, but on a Weekly chart, you'll only see Weekly and higher timeframes
Half-Yearly (HY): 6-Month 20 EMA
Shows only current timeframe EMA with half-yearly horizontal line, filtering out all lower timeframes.
Quarterly (Q): 3-Month 20 EMA
Displays current timeframe EMA with quarterly and higher horizontal lines, hiding monthly, weekly, and daily EMAs.
Monthly (M): Monthly 20 EMA
Shows current timeframe EMA with monthly and higher horizontal EMAs, excluding weekly and daily timeframes.
Weekly (W): Weekly 20 EMA
Displays current timeframe EMA with weekly and higher horizontal EMA lines, filtering out daily timeframe.
Daily (D):
Shows current timeframe EMA with all higher timeframe horizontal EMAs (daily, weekly, monthly, quarterly, half-yearly).
Note: Make sure to enable Price-Line in Style Settings after Importing Script.

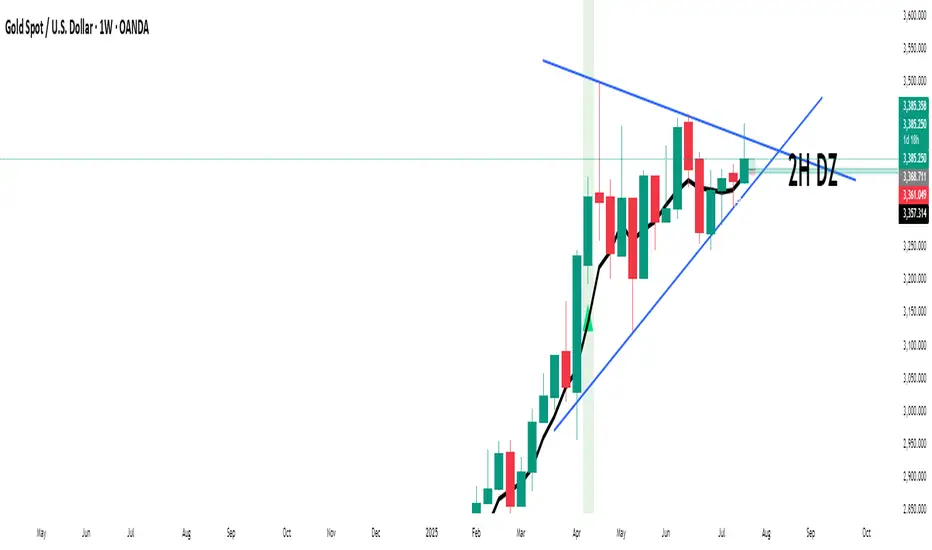
Liquidity Engulfing (Nephew_Sam_)🔥 Liquidity Engulfing Multi-Timeframe Detector
This indicator finds engulfing bars which have swept liquidity from its previous candle. You can use it across 6 timeframes with fibonacci entries.
⚡ Key Features
6 Customizable Timeframes - Complete market structure analysis
Smart Liquidity Detection - Finds patterns that sweep liquidity then reverse
Real-Time Status Table - Confirmed vs unconfirmed patterns with color coding
Fibonacci Integration - 5 customizable fib levels for precise entries
HTF → LTF Strategy - Spot reversals on higher timeframes, enter on lower timeframe fibs
📈 Engulfing Rules
Bullish: Current candle bullish + previous bearish + current low < previous low + current close > previous open
Bearish: Current candle bearish + previous bullish + current high > previous high + current close < previous open
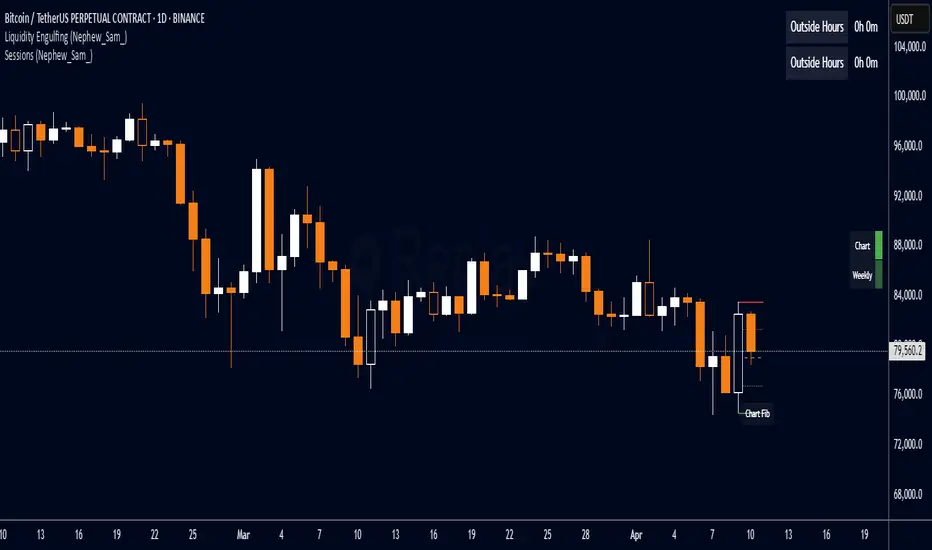
P&L Entry Zone Marker (clean)This indicator is a simple visual calculator for futures traders.
It helps you track your long and short entry zones based on position size and average price.
🔹 Green line – recalculated long entry after averaging down.
🔹 Red line – short entry point.
You can manually input your initial entry, volume, averaging volume, and averaging price.
The script calculates your new average entry for long positions and plots both lines as full horizontal levels across the chart.
✳️ Useful for:
Visualizing break-even zones
Planning P&L zones for hedged positions
Quickly aligning your trades with market structure
✅ Clean version — no labels, just lines.
📉 Works on all symbols and timeframes.
Math by Thomas Liquidity PoolDescription
Math by Thomas Liquidity Pool is a TradingView indicator designed to visually identify potential liquidity pools on the chart by detecting areas where price forms clusters of equal highs or equal lows.
Bullish Liquidity Pools (Green Boxes): Marked below price where two adjacent candles have similar lows within a specified difference, indicating potential demand zones or stop loss clusters below support.
Bearish Liquidity Pools (Red Boxes): Marked above price where two adjacent candles have similar highs within the difference threshold, indicating potential supply zones or stop loss clusters above resistance.
This tool helps traders spot areas where smart money might hunt stop losses or where price is likely to react, providing valuable insight for trade entries, exits, and risk management.
Features:
Adjustable box height (vertical range) in points.
Adjustable maximum difference threshold between candle highs/lows to consider them equal.
Boxes automatically extend forward for visibility and delete when price sweeps through or after a defined lifetime.
Separate visual zones for bullish and bearish liquidity with customizable colors.
How to Use
Add the Indicator to your chart (preferably on instruments like Nifty where point-based thresholds are meaningful).
Adjust Inputs:
Box Height: Set the vertical size of the liquidity zones (default 15 points).
Max Difference Between Highs/Lows: Set the max price difference to consider two candle highs or lows as “equal” (default 10 points).
Box Lifetime: How many bars the box stays visible if not swept (default 120 bars).
Interpret Boxes:
Green Boxes (Bullish Liquidity Pools): Areas of potential demand and stop loss clusters below price. Watch for price bounces or accumulation near these zones.
Red Boxes (Bearish Liquidity Pools): Areas of potential supply and stop loss clusters above price. Watch for price rejections or distribution near these zones.
Trading Strategy Tips:
Use these zones to anticipate where stop loss hunting or liquidity sweeps may occur.
Combine with your Order Block, Fair Value Gap, and Market Structure tools for higher probability setups.
Manage risk by avoiding entries into price regions just before large liquidity pools get swept.
Automatic Cleanup:
Boxes delete automatically once price breaks above (for bearish zones) or below (for bullish zones) the zone or after the set lifetime.

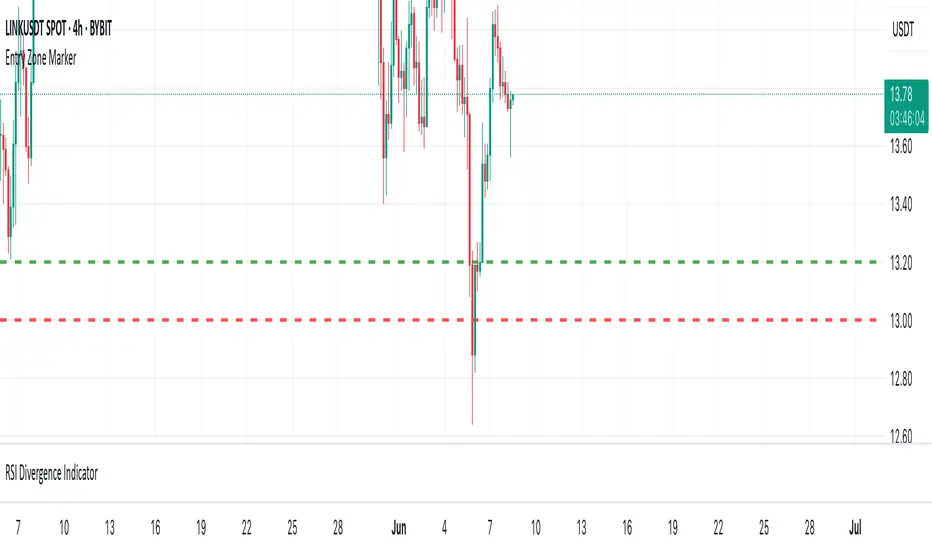
IU Pivot Zones + GMADESCRIPTION:
IU Pivot Zones + GMA is a smart price-action-based indicator that detects meaningful support and resistance zones formed through pivot highs/lows while combining them with dynamic zone generation and Geometric Moving Averages (GMA). This tool is built to help traders visualize institutional breakout/rejection zones with clear, logical mapping and live box management — helping you stay ahead of the move.
The indicator is designed for intraday, swing, and positional traders who want to enhance their trading decisions with visual confluence zones and market structure logic.
USER INPUTS
* Pivot point Lengths: Number of bars used to detect pivot highs/lows
* Zone length: Controls the thickness of the support/resistance zone; higher values create wider zones
* GMA Length: Period for calculating the geometric moving averages based on highs and lows
* Allow Bar/candle Color: Enables or disables special candle coloring when price interacts with the zones
LOGIC OF THE INDICATOR:
* Detects pivot highs and pivot lows using the user-defined length
* Compares consecutive pivot levels to determine if they fall within a valid ATR-based price band to form a zone
* If confirmed, the indicator dynamically plots a resistance or support box between those pivot points, colored respectively (red for resistance, green for support)
* The boxes update in real-time based on price action. If price respects the zone, the box extends forward. If price breaks the zone, the box disappears
* Geometric Moving Averages (GMA) based on logarithmic mean of highs and lows are plotted to offer a trend bias
* Candles that touch the top of the support zone are colored yellow, and those touching the bottom of the resistance zone are orange, enhancing zone reaction visibility
WHY IT IS UNIQUE:
* Uses logarithmic-based GMAs, which are smoother and less reactive than traditional moving averages
* ATR-based zone logic makes it adaptive to volatility instead of using fixed-width zones
* Combines structural levels (pivots), volatility filters (ATR), and trend overlays (GMA) in one unified tool
* Real-time zone extension and disappearance logic based on price interaction
HOW USER CAN BENEFIT FROM IT:
* Spot high-probability breakout or reversal zones that price respects consistently
* Use the GMA cloud for trend confirmation — for example, bullish bias when price is above both GMAs
* Build price action strategies around zone touches, breakouts, or rejections
* Use color-coded candles as real-time alerts for potential entry/exit signals near S/R levels
* Save time by avoiding manual marking of zones on charts across timeframes
DISCLAIMER:
This indicator is created for educational and informational purposes only. It does not constitute financial advice or a recommendation to buy or sell any asset. All trading involves risk, and users should conduct their own analysis or consult with a qualified financial advisor before making any trading decisions. The creator is not responsible for any losses incurred through the use of this tool. Use at your own discretion.
MestreDoFOMO Future Projection BoxMestreDoFOMO Future Projection Box - Description & How to Use
Description
The "MestreDoFOMO Future Projection Box" is a TradingView indicator tailored for crypto traders (e.g., BTC/USDT on 1H, 4H, or 1D timeframes). It visualizes current price ranges, projects future levels, and confirms trends using semi-transparent boxes. With labeled price levels and built-in alerts, it’s a simple yet powerful tool for identifying support, resistance, and potential price targets.
How It Works
Blue Box (Current Channel): Shows the recent price range over the last 10 bars (adjustable). The top is the highest high plus an ATR buffer, and the bottom is the lowest low minus the buffer. Labels display exact levels (e.g., "Top: 114000", "Bottom: 102600").
Green Box (Future Projection): Projects the price range 10 bars ahead (adjustable) based on the trend slope of the moving average. Labels show "Proj Top" and "Proj Bottom" for future targets.
Orange Box (Moving Average): Traces a 50-period EMA (adjustable) to confirm the trend. An upward slope signals a bullish trend; a downward slope signals a bearish trend. A label shows the current MA value (e.g., "MA: 105000").
Alerts: Triggers when the price nears the projected top or bottom, helping you catch breakouts or retracements.
How to Use
Add the Indicator: Apply "MestreDoFOMO Future Projection Box" to your chart in TradingView.
Interpret the Trend: Check the orange box’s slope—upward for bullish, downward for bearish.
Identify Key Levels: Use the blue box’s top as resistance and bottom as support. On a 4H chart, if the top is 114,000, expect resistance; if the bottom is 102,600, expect support.
Plan Targets: Use the green box for future targets—top for profit-taking (e.g., 114,000), bottom for stop-loss or buying (e.g., 102,600).
Set Alerts: Enable alerts for "Near Upper Projection" or "Near Lower Projection" to get notified when the price hits key levels.
Trade Examples:
Bullish: If the price breaks above the blue box top (e.g., 114,000), buy with a target at the green box top. Set a stop-loss below the green box bottom.
Bearish: If the price rejects at the blue box top and drops below the orange MA, short with a target at the blue box bottom.
Customize: Adjust the lookback period, projection bars, ATR multiplier, and MA length in the settings to fit your trading style.
Tips
Use on 1H for short-term trades, 4H for swing trades, or 1D for long-term trends.
Combine with volume or RSI to confirm signals.
Validate levels with market structure (e.g., candlestick patterns).

MTF Trend + Crossover AlertsMulti-Timeframe Trend Dashboard + Crossover Signals
This indicator provides a clean, real-time visual dashboard of trend directions across multiple timeframes (1m, 5m, 15m, 30m, 1H, 4H, 1D), based on moving average crossovers.
🔹 Trend Detection Logic:
When the fast MA is above the slow MA → Bullish trend 🚀
When the fast MA is below the slow MA → Bearish trend 🐻
When both are equal or ranging → Neutral
📊 Dashboard Features:
Displays trend status for each selected timeframe
Color-coded cells (green = bullish, red = bearish, gray = neutral)
Includes emojis for visual clarity
🔔 Buy/Sell Alerts:
On the active chart timeframe, buy and sell signals are plotted when the fast MA crosses above or below the slow MA. You can also enable TradingView alerts based on these events.
🧩 Customizable Inputs:
Fast MA period
Slow MA period
MA type (EMA or SMA)
🔧 Ideal for traders who want a quick snapshot of market structure across multiple timeframes and receive real-time crossover signals on their current chart.

FVG Candle HighlighterThis indicator highlights only the true Fair Value Gap (FVG) creator candle — the middle candle in a 3-bar FVG formation — with zero clutter.
🔹 Bullish FVG: Candle is colored if price gaps above the high two bars back
🔹 Bearish FVG: Candle is colored if price gaps below the low two bars back
✨ No boxes. No zones. Just pure, visual price-action accuracy.
🔧 Powered by Pine Script v6
🧠 Based on institutional-style FVG logic
🎯 Ideal for Smart Money / ICT / Order Block strategies

Reversal Knockout v1.1\ Reversal Knockout v1.1 — User Manual \
Reversal Knockout is a technical indicator designed to detect potential price turning points using a dual approach: a reversal logic with bar coloring and a combined sequence of setups, countdowns, and exhaustion patterns.
\ What does this indicator do?\
\ Colors candles\ based on the relationship between two smoothed moving averages (T3).
\ Identifies overextension conditions\ based on a sequence of 9 consecutive closes aligned with price direction.
\ Confirms exhaustion\ if, after that setup, 13 follow-through conditions (countdown) are met.
\ Highlights special signals called “Knockouts”\ , which represent strong potential reversal scenarios.
\ Candle Coloring\
Candles are automatically colored to make trend and potential reversal points visually easier to interpret:
🔵 Bull Trend: User-defined color (default light blue)
🔴 Bear Trend: User-defined color (default light red)
🟡 Bullish Reversal: When price crosses below the slower average (default yellow)
🟡 Bearish Reversal: When price crosses above the slower average (default yellow)
This logic is based on the relationship between two T3 moving averages (one fast, one slow), calculated with a customizable smoothing factor.
\ Setup and Countdown Logic\
Setups (9):
A bullish setup forms if the price closes below the close from 4 bars earlier for 9 consecutive candles.
A bearish setup forms if the price closes above the close from 4 bars earlier for 9 consecutive candles.
When the ninth close is completed, a green “9” (buy) or purple “9” (sell) is displayed.
Countdowns (13):
After a setup, a follow-through phase begins.
If 13 additional conditions are met (price < low\ for buys or > high\ for sells), a purple “13” is shown, signaling potential exhaustion.
\ Knockout: Explosive Reversal Potential\
The indicator also identifies special reversal patterns called \ Knockout\ .
These signals appear when, in addition to a “9”, the price shows technical excess behavior near key support or resistance zones:
Knockout ▲ (buy): Appears below the candle when a buy signal is detected with specific downside pressure conditions.
Knockout ▼ (sell): Appears above the candle when a sell signal is detected with upside pressure conditions.
These signals stand out as high-probability reversal opportunities.
\ Usage Recommendations\
The indicator is designed to work on any timeframe, but it is recommended to use it alongside market structure and volume analysis.
“Knockout” signals may be used as high-probability trend change alerts, especially after a “13”.
Can be combined with momentum indicators and moving averages for greater effectiveness.

Order Block Matrix [Alpha Extract]The Order Block Matrix indicator identifies and visualizes key supply and demand zones on your chart, helping traders recognize potential reversal points and high-probability trading setups.
This tool helps traders:
Visualize key order blocks with volume profile histograms showing liquidity distribution.
Identify high-volume price levels where institutional activity occurs.
rank historical order blocks and analyze their strength based on volume.
Receive alerts for potential trading opportunities based on price-block interactions.
🔶 CALCULATION
The indicator processes chart data to identify and analyze order blocks:
Order Block Detection
Inputs:
Price action patterns (consolidation areas followed by breakouts).
Volume data from current and lower timeframes.
User-defined lookback periods and thresholds.
Detection Logic:
Identifies consolidation areas using a dynamic range comparison.
Confirms breakout patterns with percentage threshold validation.
Maps volume distribution across price levels within each order block.
🔶Volume Analysis
Volume Profiling:
Divides each order block into configurable grid segments.
Maps volume distribution across price segments within blocks.
Highlights zones with highest volume concentration.
Strength Assessment:
Calculates total block volume and relative strength metrics.
Compares block volume to historical averages.
Determines probability of reversal based on volume patterns.
isConsolidation(len) =>
high_range = ta.highest(high, len) - ta.lowest(high, len)
low_range = ta.highest(low, len) - ta.lowest(low, len)
avg_range = (high_range + low_range) / 2
current_range = high - low
current_range <= avg_range * (1 + obThreshold)
🔶 DETAILS
Visual Features
Volume Profile Histograms:
Color-coded bars showing volume concentration within order blocks.
Gradient coloring based on relative volume (high volume = brighter colors).
Bull blocks (green/teal) and bear blocks (red) with varying opacity.
Block Visualization:
Dynamic box sizing based on volume concentration.
Optional block borders and background fills.
Volume labels showing total block volume.
Screener Table:
Real-time analysis of order block metrics.
Shows block direction, proximity, retest count, and volume metrics.
Color-coded for quick reference.
Interpretation
High Volume Areas: Zones with institutional interest and potential reversal points.
Block Direction: Bullish blocks typically support price, bearish blocks typically resist price.
Retests: Multiple tests of an order block may strengthen or weaken its influence.
Block Age: Newer blocks often have stronger influence than older ones.
Volume Concentration: Brightest segments within blocks represent the highest volume areas.
🔶 EXAMPLES
The indicator helps identify key trading opportunities:
Bullish Order Blocks
Support Zones: Identify strong support levels where price is likely to bounce.
Breakout Confirmation: Validate breakouts with volume analysis to avoid false moves.
Retest Strategies: Enter trades when price retests a bullish order block with high volume.
Bearish Order Blocks
Resistance Zones: Identify strong resistance levels where price is likely to reverse.
Distribution Areas: Detect zones where smart money is distributing to retail.
Short Opportunities: Find optimal short entry points at high-volume bearish blocks.
Combined Strategies
Order Block Stacking: Multiple aligned blocks create stronger support/resistance zones.
Block Mitigation: When price breaks through a block, it often indicates a strong trend continuation.
Volume Profile Applications: Higher volume segments provide more precise entry and exit points.
🔶 SETTINGS
Customization Options
Order Block Detection:
Consolidation Lookback: Adjust the period for consolidation detection.
Breakout Threshold: Set minimum percentage for breakout confirmation.
Historical Lookback Limit: Control how far back to scan for historical order blocks.
Maximum Order Blocks: Limit the number of visible blocks on the chart.
Visual Style:
Grid Segments: Adjust the number of volume profile segments.
Extend Blocks to Right: Enable/disable extending blocks to current price.
Show Block Borders: Toggle border visibility.
Border Width: Adjust thickness of block borders.
Show Volume Text: Enable/disable volume labels.
Volume Text Position: Control placement of volume labels.
Color Settings:
Bullish High/Low Volume Colors: Customize appearance of bullish blocks.
Bearish High/Low Volume Colors: Customize appearance of bearish blocks.
Border Color: Set color for block outlines.
Background Fill: Adjust color and transparency of block backgrounds.
Volume Text Color: Customize label appearance.
Screener Table:
Show Screener Table: Toggle table visibility.
Table Position: Select positioning on the chart.
Table Size: Adjust display size.
The Order Block Matrix indicator provides traders with powerful insights into market structure, helping to identify key levels where smart money is active and where high-probability trading opportunities may exist.

IBD Style Candles [tradeviZion]IBD Style Candles - Visualize Price Bars Like the Pros
Transform your chart with institutional-grade IBD-style bars and customizable moving averages for both daily and weekly timeframes. This indicator helps you visualize price action the way professionals at Investors Business Daily do.
What This Indicator Offers:
IBD-style bar visualization (clean, professional appearance)
Customizable coloring based on price movement or previous close
Automatic timeframe detection for appropriate moving averages
Four customizable moving averages for daily timeframes (10, 21, 50, 200)
Four customizable moving averages for weekly timeframes (10, 20, 30, 40)
Options to use SMAs or EMAs with adjustable colors and line widths
"The IBD-style bars provide a cleaner view of price action, allowing you to focus on market structure without the visual noise of traditional candles."
How to Apply the IBD-Style Bars:
On your TradingView chart, select "Bars" as the chart type from the main chart type selection menu (next to the time interval options).
Right-click on the chart and select "Settings".
Go to the "Symbol" tab.
Uncheck the "Thin Bars" option to display thicker bars.
Set the "Up Color" and "Down Color" opacity to 0 for a clean IBD-style appearance.
Enable "IBD-style Candles" from the script's settings.
To revert to the original chart style, repeat the above steps and restore the default settings.
Moving Average Configuration:
The indicator automatically detects your timeframe and displays the appropriate moving averages:
Daily Timeframe Moving Averages:
10-day moving average (SMA/EMA)
21-day moving average (SMA/EMA)
50-day moving average (SMA/EMA)
200-day moving average (SMA/EMA)
Weekly Timeframe Moving Averages:
10-week moving average (SMA/EMA)
20-week moving average (SMA/EMA)
30-week moving average (SMA/EMA)
40-week moving average (SMA/EMA)
Usage Tips:
Enable "Color bars based on previous close" to identify momentum shifts based on prior candle closes
Customize colors to match your chart theme or preference
Enable only the moving averages relevant to your trading strategy
For cleaner charts, reduce the number of visible moving averages
For stock trading, the 10/21/50/200 daily and 10/40 weekly MAs are most commonly used by institutions
// Example configuration for different timeframes
if timeframe.isweekly
// Weekly configuration
showSMA1_Weekly = true // 10-week MA
showSMA4_Weekly = true // 40-week MA
else
// Daily configuration
showMA2_Daily = true // 21-day MA
showMA3_Daily = true // 50-day MA
showMA4_Daily = true // 200-day MA
While the IBD style provides clarity, remember that no visualization method guarantees trading success. Always combine with proper analysis and risk management.
If you found this indicator helpful, please consider leaving a comment or suggestion for future improvements. Happy trading!

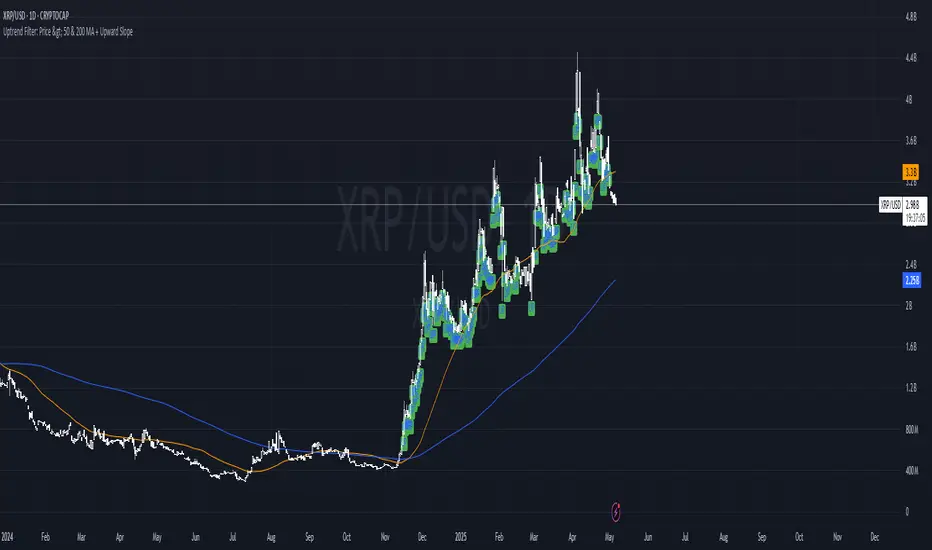
Uptrend Filter: Price > 50 & 200 MA + Upward SlopeThis indicator is designed to help traders instantly identify strong uptrend conditions based on two simple yet powerful criteria:
Price is above both the 50-day and 200-day moving averages
Both moving averages are sloping upward (positive momentum)
When both conditions are met, the indicator plots a green “UP” label below the candle, signaling a valid uptrend setup. This filter is ideal for asset selection in strategy-building, portfolio rotation, or trend-following systems.
🧠 Why it works:
The 50-day MA reflects medium-term momentum.
The 200-day MA represents the long-term trend.
When both are aligned and sloping upward, it confirms strong market structure and trend health.
🧰 Best used for:
Token screening (e.g., filtering altcoins)
Momentum-based entries
Trend confirmation
Risk filtering in strategy backtesting
FVG [TakingProphets]🧠 Purpose
This indicator is built for traders applying Inner Circle Trader (ICT) methodology. It detects and manages Fair Value Gaps (FVGs) — price imbalances that often act as future reaction zones. It also highlights New Day Opening Gaps (NDOGs) and New Week Opening Gaps (NWOGs) that frequently play a role in early-session price behavior.
📚 What is a Fair Value Gap?
A Fair Value Gap forms when price moves rapidly, skipping over a portion of the chart between three candles — typically between the high of the first candle and the low of the third. These zones are considered inefficient, meaning institutions may return to them later to:
-Rebalance unfilled orders
-Enter or scale into positions
-Engineer liquidity with minimal slippage
In ICT methodology, FVGs are seen as both entry zones and targets, depending on market structure and context.
⚙️ How It Works
-This script automatically identifies and manages valid FVGs using the following logic:
-Bullish FVGs: When the low of the current candle is above the high from two candles ago
-Bearish FVGs: When the high of the current candle is below the body of two candles ago
-Minimum Gap Filter: Gaps must be larger than 0.05% of price
-Combine Consecutive Gaps (optional): Merges adjacent gaps of the same type
-Consequent Encroachment Line (optional): Plots the midpoint of each gap
-NDOG/NWOG Tracking: Labels gaps created during the 5–6 PM session transition
-Automatic Invalidation: Gaps are removed once price closes beyond their boundary
🎯 Practical Use
-Use unmitigated FVGs as potential entry points or targets
-Monitor NDOG and NWOG for context around daily or weekly opens
-Apply the midpoint (encroachment) line for precise execution decisions
-Let the script handle cleanup — only active, relevant zones remain visible
🎨 Customization
-Control colors for bullish, bearish, and opening gaps
-Toggle FVG borders and midpoint lines
-Enable or disable combining of consecutive gaps
-Fully automated zone management, no manual intervention required
✅ Summary
This tool offers a clear, rules-based approach to identifying price inefficiencies rooted in ICT methodology. Whether used for intraday or swing trading, it helps traders stay focused on valid, active Fair Value Gaps while filtering out noise and maintaining chart clarity.
