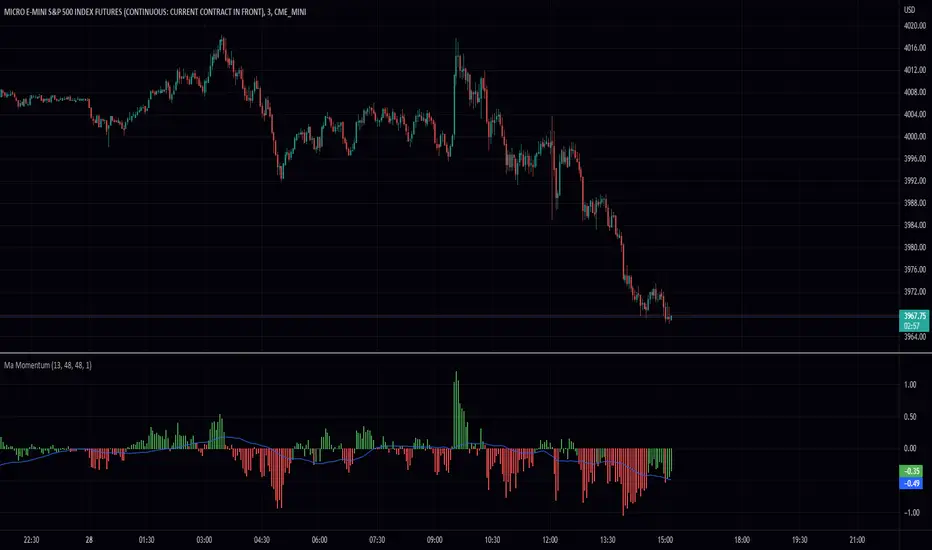
MA MomentumThis simple script takes two ma's sums them and takes the the difference between the current and previous data points. This gives a lovely smoothed momentum indicator. The way it works is if its green its good and if its red its bad. In other words, I take the smooth signal as a filter for the momentum. You can also spot divergences between the indicator and the price to make decisions. Some features include extra smoothing and adjustable ma's. I hope you find this script useful!
Thank you.
Поиск скриптов по запросу "momentum"
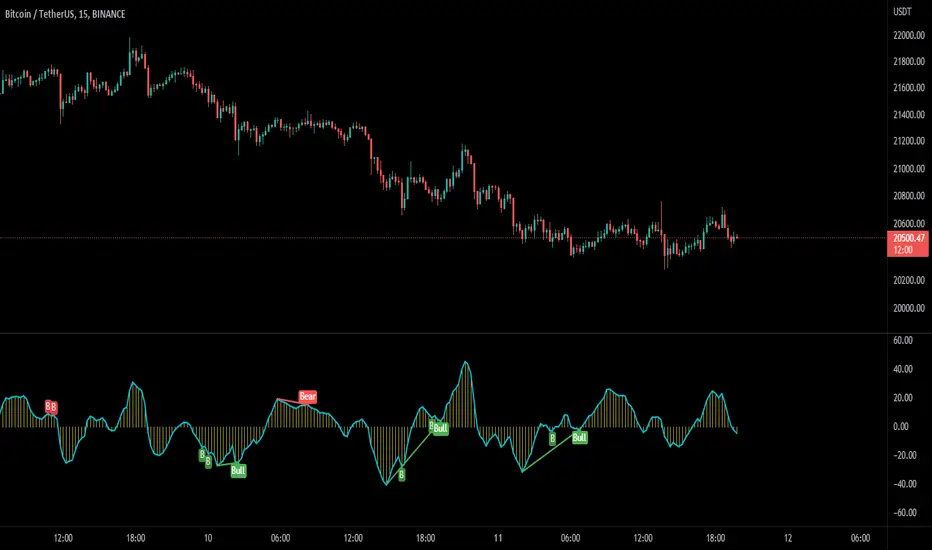
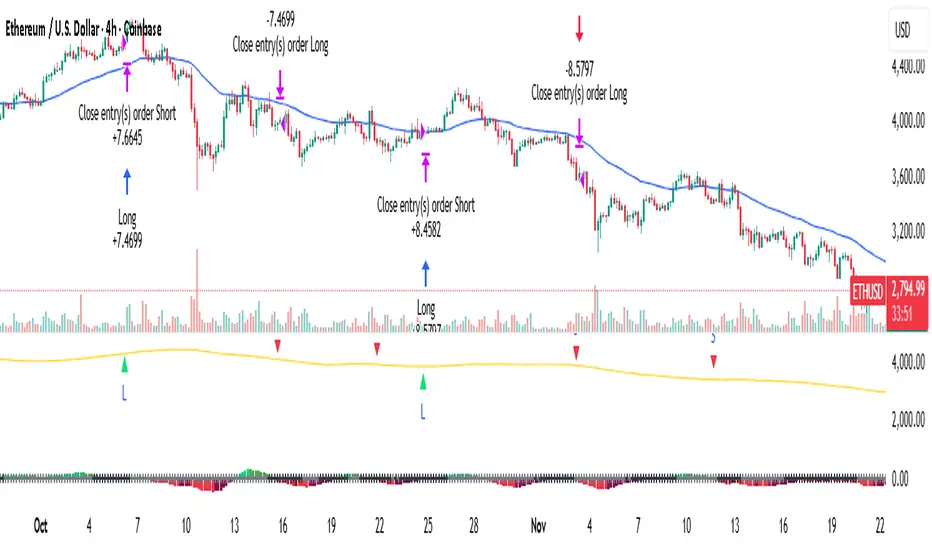
MACD Potential Divergence - FontiramisuIndicator showing potential momentum divergences on MACD Momentum.
The problem with the classic divergence is that when the signal appears, it is sometimes too late to enter a trade .
The potential divergence corrects this problem by signaling the beginning of a potential divergence .
MACD is a momentum indicator that offers relevant insights with divergences.
Potential divergences are indicated with the letter B and a red color for Bearish Div or Green color for Bullish Div .
Potential divergence is confirmed when the line and the label "Bear"' or "Bull" appear.
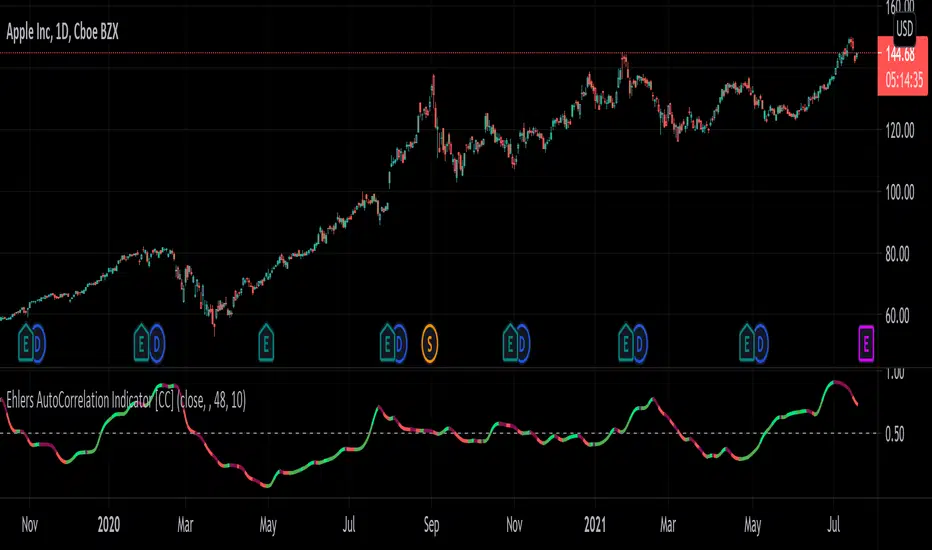
Ehlers AutoCorrelation Indicator [CC]The AutoCorrelation Indicator was created by John Ehlers (Cycle Analytics pgs 94-98) and this can be viewed as both a momentum indicator and a trend indicator. This was his basis for several other indicators that he created which I will be publishing soon but essentially as this indicator goes up then the stock is in an uptrend and also has upward momentum. You will notice that this indicator starts to go down even during an uptrend showing that the underlying trend is going to have an upcoming reversal. He also warns that the halfway mark is a possible reversal point so keep an eye out for that.
Generally speaking a good signal is to enter a long position when the indicator is under the midline and is starting to go up (or when the line is green) and to exit the position when the indicator goes over the midline. I have included strong buy and sell signals in addition to normal ones so darker colors mean strong signals and lighter colors mean normal signals.
Let me know if there are any other indicators you would like me to publish!
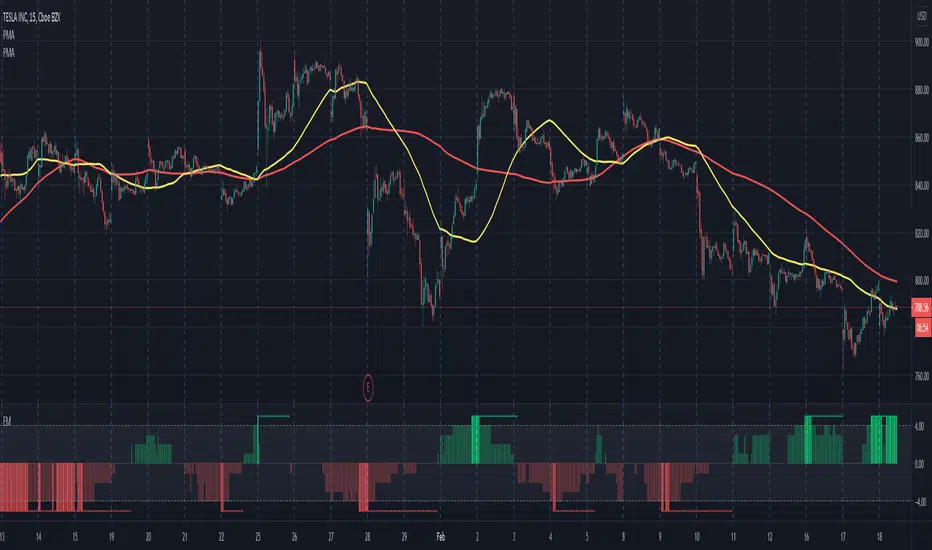
Electrified Momentum Signal (Prototype)This indicator uses an ensemble of different indicators to help in identifying significant changes in momentum.
It's time-frame is constant and is based up on the length of the configurable period. This allows for a consistent signal across multiple time-frames.
This is not a buy or sell signal but can be used for alerts to indicate a change in momentum that might be worth paying attention to.
If looking for an long entry point, a negative (red) value can signal "don't buy yet" or may simple mean "it's risky". In a similar way if looking for a short, a positive (green) value can signal "not now".
Note: "Electrified" does not mean this has anything to do with electric vehicles or the power grid. :P
Simple Momentum Strategy Based on SMA, EMA and VolumeA simple, non short selling (long positions only, i.e. buy low and sell high) strategy. Strategy makes use of simple SMA, EMA and Volume indicators to attempt to enter the market at the most optimum time (i.e. when momentum and price are moving upwards). Optimum time is defined mainly by picking best timing for price moves higher based on upwards momentum.
This script is targeted / meant for an average/typical trader or investor. This is why a non short selling approach was selected for optimisation for this strategy because "typpical", "average" traders and investors usually use basic (i.e. minimum fees / free membership) exchanges that would not usually offer short selling functionality (at least without additional fees). The assumption used here is that only advanced and sophisticated traders and investors would pay for advanced trading platforms that enable short selling, have a risk appetite for short selling and thus use short selling as a strategy.
The results of the strategy are:
In an overall roughly bearish market (backward testing from beginning to end of 2018) i.e. the market immediately following the highs of around 20k USD per BTC, this strategy made a loss of £3231 USD on trades of a maximum of 1 BTC per long position.
But in an overall bullish market, it makes a profit of about $6800 USD from beginning of 2019 onwards by trading a maximum of 1 BTC per long position.
NOTE: All trading involves high risk. Most strategies use past performance and behaviour as indicators of future performance and that is not necessarily indicative of future results. Hypothetical or simulated performance results have certain inherent limitations too. One limitation is that unlike an actual performance record, simulated results do not represent actual trading and since the trades have not actually been executed, the results of those trades themselves do not have any influence on actual market results, which in real life they would have had (no matter how minor). Additionally, simulated results may have under or over-compensated for the impact, if any, of certain market factors, such as lack of liquidity. Simulated trading programs in general are also, by their nature, designed with the benefit of hindsight. No representation is being made that any account will or is likely to achieve profits or losses similar to those shown.

Ultimate Momentum IndicatorThis is an indicator I've been playing with for a while, based on my previous MACD w/ RSI Warning indicator. This one takes it a step further, including information from MACD, RSI, ADX, and Parabolic SAR. These four indicators are represented in this indicator as follows:
MACD: The histogram itself is a normal MACD histogram. Nothing strange about it, and you can adjust the settings for it just as you would a normal MACD.
RSI: Any time the RSI is outside of normal ranges (which can be adjusted in the settings), the bar on the histogram will turn amber to warn you. The actual RSI value is also shown in a label to the left side of the indicator.
ADX: Crosses are drawn along the 0 line to indicate ADX. Blue means the ADX is below the trending level (adjustable in the settings), and orange means it is above that level. Darker colors indicate the ADX has gone up since the previous bar, while lighter colors indicate it has gone down. The actual ADX value is also shown in the label to the left side of the indicator.
Parabolic SAR: At the outside point of each bar in the histogram, a colored dot is drawn. If the dot is green, the Parabolic SAR (settings adjustable) is currently below the closing price. If the dot is red, the SAR is above the closing price.
I must stress that this indicator is not a replacement for any one of the indicators it includes, as it's really only pulling small bits of information from each. The point of this indicator is to give a cohesive picture of momentum at a quick glance. I encourage you to continue to use the normal versions of whichever of the basic indicators you already use, especially if those indicators are a key part of your strategy. This indicator is designed purely as a way to get a bird's eye view of the momentum.
Pretty much every normally adjustable value can be adjusted in the settings for each of the base indicators. You can also set:
The RSI warning levels (30 and 70 by default)
The ADX Crossover, i.e. the point at which you consider the ADX value to indicate a strong trend (25 by default)
The offset for the label which shows the actual RSI & ADX values (109 by default, which happens to line up with my chart layout--yours will almost certainly need to be different to look clean)
All of the colors, naturally
As always, I am open to suggestions on how I might make the indicator look cleaner, or even other indicators I might try to include in the data this indicator produces. My choice of indicators to base this one from is entirely based on the ones I use and know, but I'm sure there are other great indicators that may improve this combination indicator even more!
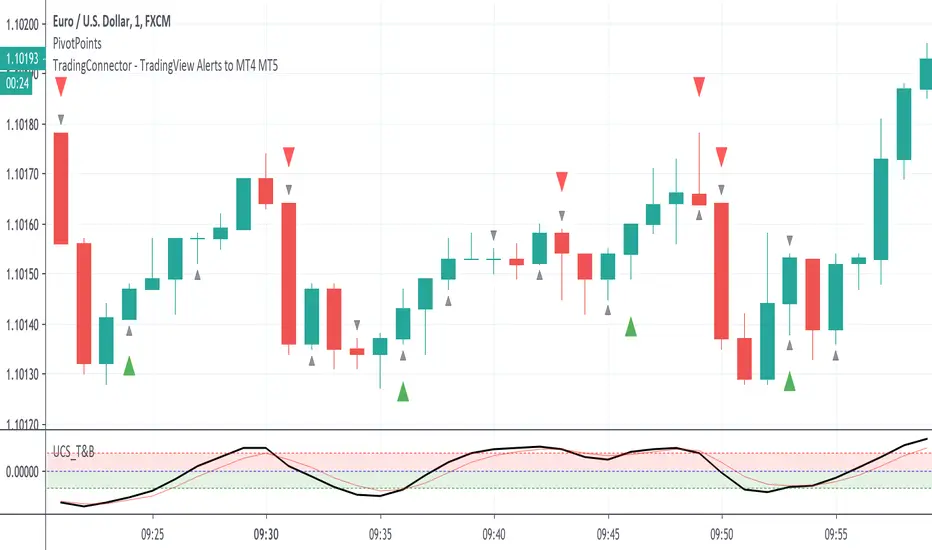
PivotPoints with Momentum confirmation by PeterOWho wouldn't like to be able to tell when the market actually reverses instead of just faking it? Every trader who has tried pivothigh/pivotlow functions for that, surely bumped into so many meaningless reversal signals, that probably got discouraged with this concept entirely.
Yet, pivot points are very important. Only they need to be confirmed at least a little bit (you'll never know for sure, you understand that right?)
This script enhances pivot-points mechanism with by confirming potential pivot point with actual reversal in momentum. If momentum reversal is also noticed in synch with the pivothigh/pivotlow, then you've got yourself a reversal - marked on the chart with red or green triangle. You can visually compare where those triangles are marked as compared to those small black ones, meaning the standard pivothigh(high,1,1)/pivotlow(low,1,1). Check yourself how many times this method would save us from pre-mature entry. On average 2/3 pivot points are filtered out.
This is a non-delayed confirmation - there is no waiting for another candle to close, just looking to another indicator for a match.Trader needs to take a decision immediately because if he hesitates, he will be late for sure. Also sometimes this script produces signal even before a full pivot-point is formed, as pin-bar analysis is also included here.
What this script IS NOT:
- a complete trading map. Don't take trade on each green or red triangle. You still need to do your homework on market direction, trend, phase, wave, etc. But at least you have the "trigger" part done.
- these pivot points are still not "guaranteed". You never know the future even as close as the very next candle, so the market can continue its trend right after it produces reversal signal. The aim of this indicator was only to filter out those potential pivot points, which didn't really look like reversals.
If you think this method could be improved somehow or would like to share your thoughts or approach, don't hesitate to reach out to me or write down in comments.
P.S. Credit goes to UCSGEARS for his Top&Bottom candle script. Amazing work. I used the momentum calculation from there.
Indicator Panel MTF (MACD, RSI, Momentum, Stoch, CCI)This script shows the values of MACD, RSI, Momentum, Stoch, CCI for current and higher time frames in a panel. if higher time frame is equal or smaller than current time frame and it doesn't show the values for HTF.
And also it shows if their values are increasing, decreasing or equal to last value with "▲", "▼", "="
The signal length for all indicators is 9 and used EMA.
histogram value is indicator value - it's signal value. with this value you can see that indicator and its signal getting closer or not. you may think it's as momentum.
Some functions and idea is used from following scripts:
Thanks to Lucf for the following script:
Thanks to Ricardo Santos for the following script:

MTF CMO (Chande Momentum Oscillator)Simple Multi-Timeframe version of the Chande Momentum Oscillator . Many thanks to HPotter whos script I used as a starting point. This displays 1, 2, 3, 4, and 24 period CMOs on the graph. 1, 2, 3, and 4 periods are smoothed by using their simple moving averages. 24 period is unsmoothed. I prefer to set my chart to a 1 hour timeframe and look for bottoming or topping patterns in the momentum. Strongest topping or bottoming patterns are when all timeframes roll over including the 24 period.

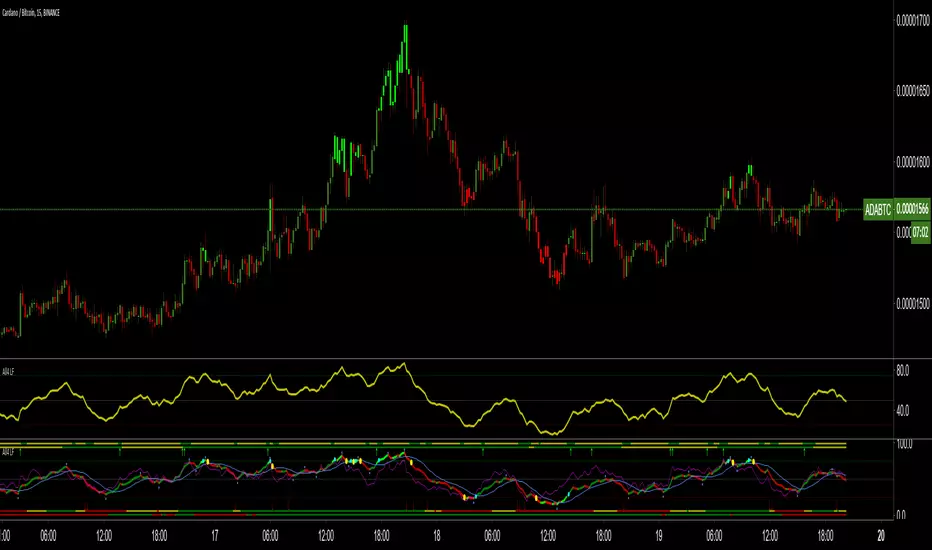
All4 - Multi-Period Momentum [LucF]All4 is a multi-period momentum indicator that includes a volume component. It doesn't use higher timeframes, but rather varying lengths. It is a simple way to get a more global picture of momentum.
It is calculated using a very simple weighted average of a few different indicators. The indicator is comprised of the main line called All4, its MA and a faster line.
The All4 components are the Stoch RSI’s K line, Rsi and MFI (to include a bit of volume information) in the following mix: (St14 + St21 + 2*St42 + 2*St90 + rsi + 2*mfi)/9. The respective K line periods and smoothing lengths are 14-4, 21-10, 42-10 and 90-15. Both the Rsi and MFI periods are 14. All those values are fixed.
The fast line is comprised of a 14 period Rsi and MFI in the following mix: (rsi + 2*mfi)/3. The length of the fast line can be changed.
The indicator also includes 4 status lines. The top 2 show when All4 is volatile and when it is trending. The bottom 2 show when All4 is in bearish/bullish territory, and the state of the 200 period MA.
There are lots of bells and whistles but pretty much everything is configurable, so you can make it as busy or as clean as you wish. I have included both extremes on the chart above.
As can be expected, the mishmash of indicators comprising All4 entails a loss of detail in the signal; it is the trade-off necessary to paint a broader picture.
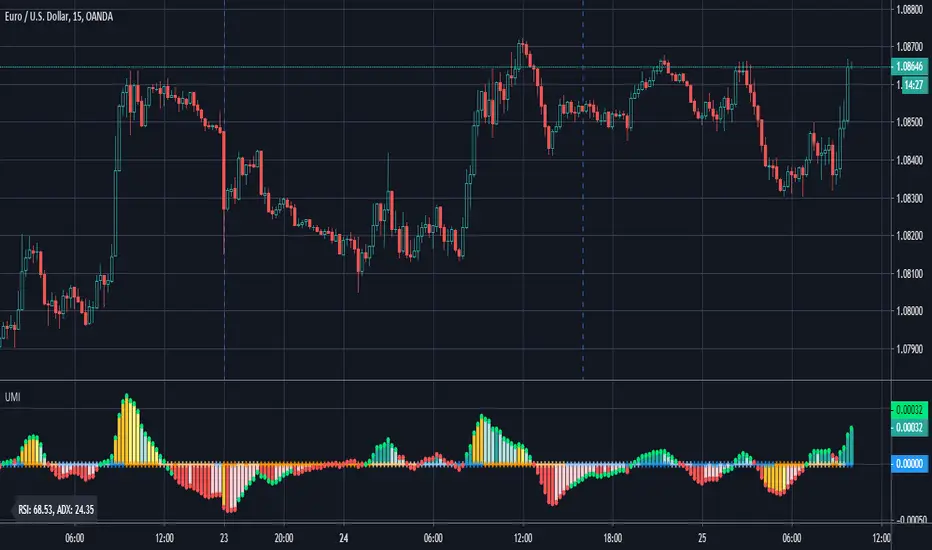
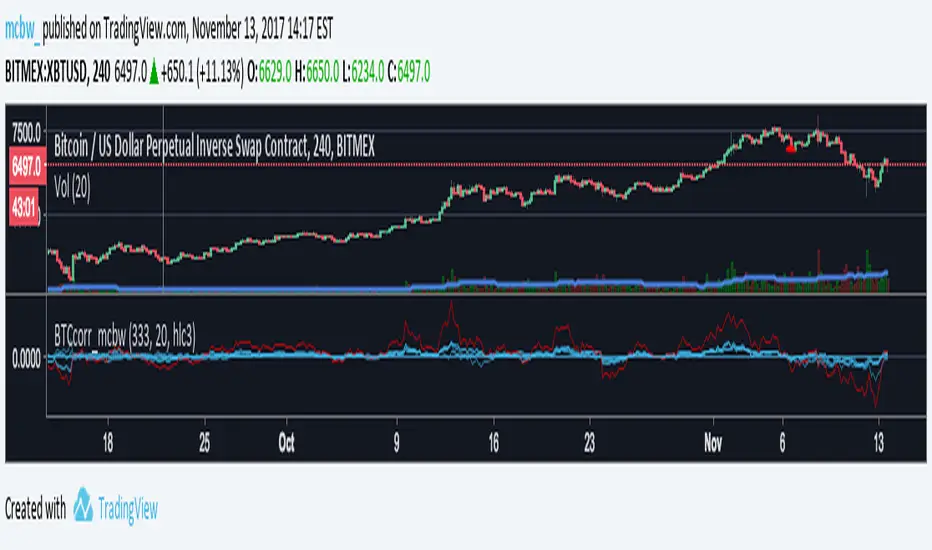
Bitcoin momentum correlation This is a pretty simple indicator, it measures the momentum of bitcoin as compared to usd,eur,eth,dash, and ltc, which you can see in all of the blue lines. If the red line is above zero then it means the overall value of btc is going up, opposite for down. The Ema_window controls how smooth the signal is. If you shorten the Ema_window parameter and open this on higher timeframe btc charts then the zero crossing gives pretty solid signals, despite being pretty choppy. A good way to interpret this is that if all the blue lines are moving in the same direction at once without disagreement, then the value of bitcoin has good momentum.
Mildly more technically:
Momentum is measured in the first derivative of an EMA for each ticker. To normalize the different values against each other they are all divided by their local maximums, which can be chosen in the parameter window, but shouldn't make a huge difference. All the checked values are then summed, as shown in the red line. To include a value into the red line simply keep it checked. Take a look at the script, it's kind of easy on the eyes.
It's pretty handy to look at, but doesn't seem too worthwhile to pursue much further. If someone wants much more out of the script then feel free to message me.
Remember rules #1 & #2
Don't lose money.
Happy trading
MaxWarren's Pine Acceleration - 2nd DerivativeThis is the acceleration of a chart written in pine. It's the second derivative otherwise the derivative of the momentum.
It shows how fast a stock's momentum is changing and in what direction.
As standard I left the controls in the settings for source and length of the estimate.
I will be incorporating this in other more complicated scripts here shortly

Adaptive EMA CrossoverIndicator Name: Adaptive EMA Crossover
Description:
The Adaptive EMA Crossover is a sleek, visual tool designed to help traders identify trend direction and potential entry/exit points with clarity. By employing two Exponential Moving Averages (EMAs) with dynamic coloring, it cuts through the noise of the chart, allowing you to focus on high-probability signals.
🔍 Key Features:
Dual EMA System: Utilizes a fast and a slow EMA to gauge market momentum. The default settings are 12 (fast) and 21 (slow) periods, which can be fully customized.
Adaptive Visuals: Both EMAs change color simultaneously to reflect the dominant trend.
🟢 Bright Turquoise: Indicates an Uptrend (Fast EMA >= Slow EMA).
🔴 Bright Pink: Indicates a Downtrend (Fast EMA < Slow EMA).
Clear Crossover Signals: Prominent dots directly on the chart mark the exact moment a crossover occurs.
Turquoise Dot: A Bullish Crossover signal (Fast EMA crosses above Slow EMA).
Pink Dot: A Bearish Crossover signal (Fast EMA crosses below Slow EMA).
Integrated Alerts: Never miss a trading opportunity! Built-in alert conditions notify you instantly for both bullish and bearish crossovers.
🎯 How to Use:
Trend Identification: The primary colors of the EMAs give an immediate sense of the trend. Trade in the direction of the trend for higher-probability setups.
Signal Confirmation: Use the crossover dots as potential triggers for entry or exit. A turquoise dot in a rising market can signal a buy opportunity, while a pink dot in a falling market can signal a sell or short opportunity.
Combination with Other Tools: For best results, combine this indicator with other forms of analysis like support/resistance levels or volume confirmation to filter out false signals.
⚙️ Inputs:
EMA Small: Period for the faster-moving average (default: 12).
EMA Big: Period for the slower-moving average (default: 21).
This is my first published indicator. I welcome all feedback and suggestions for improvement! Happy Trading!

R Squared - MomentumThis little oscillator just returns the R Squared Value of current price action.
It is designed to show trend direction momentum. Great for confluence!

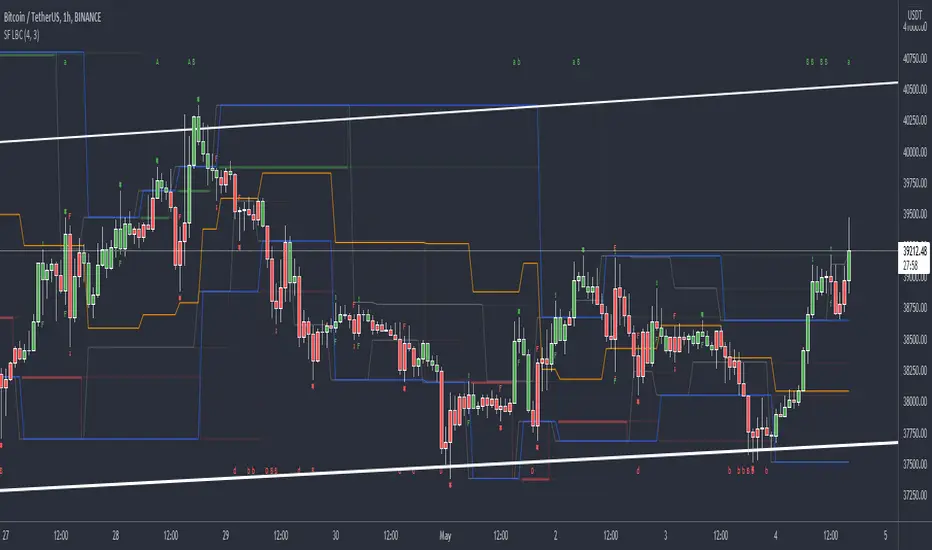
SFP MomentumCustom swing fail detector with levels and breakouts both major and minor plus colored candles based on SFP momentum.
CSRS v2Candlesticked RSI v2 for price action traders!
See the True Momentum.
6 chart type, smooth RSI , add signal lines, find divergences, special alerts
This is 2nd version with major upgrade
Improved and more powerful
fully customizable.
features:
See RSI in 6 type of chart(Candles, Hollow Candles, Siwi Candles, Heikin Ashi, HL Bar, Line)
Monitor Up to 3 RSI , each one at desired resolution, source and length
Smooth each one of chart separately to remove noises
Add up to 3 signal line to primary chart in your desired source and type( SMA , EMA , WMA , HMA )
Find divergences which has special parameters
Gradient color adjustment of line chart
Add alert for reaching to important levels and detected divergences

RAT Momentum Squeeze BETAV1.0
MAs are a great tool to measure the market's momentum. I created this indicator to graphically depict bullish and banishment movements with the moving averages.
Using the 50, 100, & 200 day MA in conjunction with the RSI we are able to find great swing setups. This is used best on the 30min & up to the daily chart.
SMI Stochastic Momentum Index 2x set per Baiynd -Tom1traderStochastic Momemtum Index - a true strength indix tsi with a moving average signal.
This uses the built in with modifications per Anne-Marie Baiynds recommendations - she uses a SIMPLE MOVING AVERAGE
for the signal (signal length at 4x the short length seems to work best to reflect actual price action support or resistance)
Note: Default settings in this code have been updated to her most recent recommendations that I have seen.
video is entitled "The Most Reliable Technical Indicator I Have Ever Used"
Note: I have not discussed this with Ms . Baiynd this is my interpretation of the vids I have seen.
Anne-Marie Baiynd also in talks / videos refers to the use of short / long of 4/20 and 6/40 and have combined both of them here
This overlays both of them with their respective SMAs- a 4/20 lengths and a 6/40 lengths in darker colors and smallest linewidth.
this gives a perspective on slightly higher time frame action.
USAGE: Generally above and below the black dashed zero line is long or short
KEYS: -Plot position relative to zero black, red overbought, green oversold and the gray lines at .25 -.25
Indicator action often more significant out side of the more "neutral" +.25/-.25 area
and near or above/below the red/green dashed lines.
-Steepness of slopes
Slopes of smi plots relate directly to price action where steeper is more momentum.
- -SMI blue relation to its simple moving average orange and the SMI longer dark blue with moving average purple.
MAJOR FEATURE - The average acts as support or resistance to the SMI and the price unless breaking out.
Price is often pausing or reversing iin finding primary/secondary support or resistance as well at those times.
You Can See and anticipate Where Support or Resistance may be Encountered. (much unlike most indicators)
My standard caveat -use at your own risk. Like anyone else I do not know what the next bar/candle is going to do
and I place all of my trades with a management plan in place for the worst case scenario.
That said enjoy your charting and trading.
This was coded starting with the built-in indicator "SMI Ergontic Oscilator / Indicator". You do this by within the Pine Editor select "New" tab and
choose the indicator that you want the code for. This populates the editor with the code for the built in indicator and you can modify it to suit your
purposes and save it / publish it and etc. Thanks for following this and Keep Smiling!

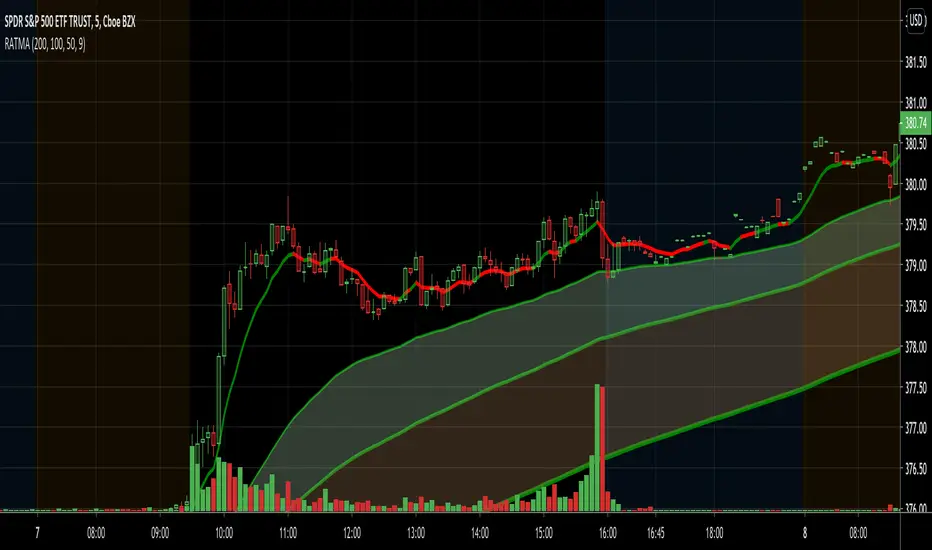
SMA slopeSlope function for SMA in degrees. This slope function you can use or modify for your own strategies. Feel free to change source to calculate the slope of another indicator. In this case you can see that the indicator is above the zero line indicating a positive momentum.

Blackscrum Adaptive Momentum Line (BAML)Overview
The BlackScrum Adaptive Momentum Line (BAML) is a dynamic trend-confirmation tool designed to keep traders aligned with the dominant market direction while filtering out short-term noise.
It adapts automatically to market volatility and candle structure, giving clear visual cues for momentum shifts, trend reversals, and entry confirmation.
🔍 How It Works
BAML tracks price strength relative to its adaptive moving average and volatility envelope.
When momentum turns decisively bullish, the line flips gold, signalling a potential uptrend.
When momentum breaks down, it flips blue, showing trend exhaustion or a developing downtrend.
In sideways or transitional conditions, the line fades to neutral grey, helping traders avoid false entries.
The line uses:
An adaptive EMA core (to stay close to price during fast markets).
A volatility-weighted filter (to delay signals during chop).
Optional smoothing to fine-tune responsiveness.
🎯 How to Use It
Trend Direction:
Gold Line → Uptrend confirmed. Consider long bias, pullback entries, or trend continuation setups.
Blue Line → Downtrend confirmed. Consider short bias or defensive management on longs.
Grey/Flat Line → Neutral/transition phase. Wait for confirmation.
Entry Timing:
Combine BAML with your breakout or swing confirmation rules. For example:
Entry when the line turns gold and price closes above it.
Exit when it flips blue or price breaks back below.
Multi-Timeframe Usage:
Works effectively on any timeframe from 15-minute to 1-day charts.
Aligning higher-timeframe BAML with lower-timeframe triggers offers confluence for trend trades.
⚙️ Key Advantages
✅ Adaptive to volatility and candle structure — fewer fake flips.
✅ Visually clear color coding for fast trend reading.
✅ Compatible with other BlackScrum indicators (Fear & Greed, FOMO Finder, Swing Boxes).
✅ Ideal for swing, position, or momentum traders seeking clarity in volatile crypto or stock markets.
⚠️ Tips
Use alongside volume or sentiment indicators for confirmation.
Avoid counter-trend setups when both higher and lower timeframe BAML lines agree.
Works best in trending environments; during consolidation it acts as a stay-out filter.
🧠 In Summary
The BlackScrum Adaptive Momentum Line turns raw price data into a smooth, trustworthy trend signal.
It’s built to help you stay in strong moves longer, avoid fakeouts, and visually track the transition between fear, neutrality, and euphoria in real time.

MAHI Indicator v9.5 - Smart Momentum HUD + IntradayMAHI Indicator v9.5 — Smart Momentum HUD (Multi-Framework + Intraday Engine)
A Complete Momentum, Trend, and Setup Framework for Swing, Position & Intraday Traders
MAHI v9.5 is the most advanced version yet — a highly optimized, visual, multi-framework trading system that blends momentum, trend alignment, adaptive setup detection, and now Auto-Intraday Mode for short-term traders.
This indicator acts like a Heads-Up Display (HUD) on your chart: it shows trend strength, squeeze zones, dynamic support/resistance, EMAs, setup validation, and early reversal signals in one clean interface — without clutter.
✔ Core Features
📌 1. Smart Momentum Ribbon
A dynamic EMA-based momentum band that visually shifts as trend strength changes.
Helps identify strong vs. weak momentum zones
Adapts to volatility & trend slope
Works on all timeframes (1m to 1M)
📌 2. EMA 9 → 21 Flip System
A precision trend-switching signal:
EMA 9 → 21 BULL = early bullish momentum
EMA 9 → 21 BEAR = early bearish momentum
More reliable than stand-alone MA crossovers
📌 3. Bullish Setup Engine (Standard + Weak)
Automatically identifies when price is entering a reversal-ready state based on:
Position relative to the ribbon
Candle structure
Momentum compression
Slope + exhaustion conditions
Includes:
Bull Setup (Standard) — Higher probability setup
Bull Setup (Weak) — Early or less developed setup
Setup Invalidated — Confirms that the pattern failed
This prevents false confidence & keeps traders disciplined.
📌 4. Strong Buy / Strong Sell Signals
Only appear when multiple confirmations align:
Ribbon bias
EMA slope
Momentum compression
Trend alignment
Filtered to remove noise — especially in lower timeframes.
📌 5. Multi-Timeframe Trend HUD
Top-right panel summarizing:
Overall Trend (Bullish, Bearish, Neutral)
RSI Condition
Daily vs Weekly Alignment
Trading Mode Suggestions (Buy / Sell / LEAPS / Neutral)
This gives instant context.
📌 6. Auto Intraday Engine (NEW in v9.5)
Automatically switches internal logic when you move into intraday timeframes (1m–30m):
Intraday Enhancements:
Adaptive setup detection
Faster momentum sensitivity
EMAs tuned for scalp/swing precision
Tighter invalidation logic
Reduced false positives
Optional strict filtering
Perfect for scalping, day trading & micro-trends
Works instantly — no settings needed.
Just change the chart timeframe and MAHI adjusts.
📌 7. Dynamic High-Timeframe Support (W & M)
Auto-layers weekly & monthly levels:
Helps identify strong bounce zones
Extremely useful for swing & LEAPS traders
📌 8. Weekly Volume Shelf Projection
Lightweight VWAP-style level based on weekly volume aggregation.
Shows probable bottoming areas during pullbacks.
✔ Who This Indicator Is For
Perfect for:
Day traders
Swing traders
Momentum riders
LEAPS & long-term investors
Beginner traders needing a structured system
MAHI adapts to your timeframe and trading style.
✔ Why MAHI Works
MAHI isn’t a single-signal indicator — it’s a framework.
It combines:
Trend
Momentum
Volatility
Setup pattern detection
Validation & invalidation
Multi-timeframe alignment
Dynamic zones
Intraday optimization
This eliminates guesswork and helps traders avoid the emotional traps that cause most losses.
You don’t just get a signal — you get context.
✔ How to Use It
Follow the ribbon bias
Use EMA 9→21 flips as trend confirmation
Look for Bull Setup tags during pullbacks
Avoid trades when you see Setup Invalidated
Respect weekly/monthly HTF support levels
On intraday charts — rely on auto-optimized mode
For swing entries, combine setups with HTF trend HUD
MAHI gives the map. You choose the path.
✔ Final Notes
This version is heavily optimized for performance, clarity, and high-probability signals.
MAHI does not repaint, and works on all assets including:
Stocks
Crypto
ETFs
Forex
Futures

Squeeze Momentum Strategy [PickMyTrade]Squeeze Momentum Strategy
Overview
This strategy is a complete trading system built upon John Carter's renowned "TTM Squeeze" momentum indicator, as featured in his book "Mastering the Trade". The PickMyTrade team has transformed this popular indicator into a fully automated strategy with an additional trend filter for improved accuracy.
What Makes This Different?
While the original TTM Squeeze indicator helps identify volatility contractions and momentum direction, our strategy adds a critical enhancement:
50-Period MA Trend Filter – We only take trades in the direction of the dominant trend:
Long trades: Only when momentum crosses above zero AND price is above the 50 MA
Short trades: Only when momentum crosses below zero AND price is below the 50 MA
This simple addition helps filter out counter-trend signals and improves the win rate significantly.
How It Works
The Squeeze Detection
Black crosses = Squeeze is ON (Bollinger Bands compressed inside Keltner Channel) – Market is coiling, preparing for a breakout
Gray crosses = Squeeze is OFF – Volatility is normal
Blue crosses = No Squeeze condition
Momentum Histogram
Green/Lime bars = Bullish momentum (above zero)
Red/Maroon bars = Bearish momentum (below zero)
Color intensity shows momentum strength increasing/decreasing
Entry Signals
Long Entry (Green Triangle): Momentum crosses above zero + Price > 50 MA
Short Entry (Red Triangle): Momentum crosses below zero + Price < 50 MA
Key Features
Automatic position management (closes opposite positions before new entries)
Visual entry markers on chart
Histogram color-coding for quick momentum assessment
Trend filter to avoid choppy, counter-trend trades
Prop firm friendly (conservative approach)
Works on all timeframes
Recommended Settings
Timeframes: 15M, 1H, 4H, Daily (higher timeframes produce more reliable signals)
Markets: Works best on trending markets (Forex, Crypto, Stocks, Indices)
Risk Management: Default 10% of equity per trade – adjust based on your risk tolerance
Input Parameters
BB Length (20): Bollinger Bands calculation period
BB MultFactor (2.0): Bollinger Bands standard deviation multiplier
KC Length (20): Keltner Channel calculation period
KC MultFactor (1.5): Keltner Channel ATR multiplier
Use TrueRange: Use True Range for KC calculation (recommended: ON)
MA Filter Length (50): Trend filter moving average period
Usage Tips
Wait for the squeeze release (first gray cross after black crosses) for the most explosive moves
Combine with higher timeframe confirmation for better trade quality
Consider exit strategies: Exit when histogram changes color OR use fixed stop-loss/take-profit
Best on trending markets: Avoid ranging/choppy conditions
Credits
Original TTM Squeeze concept: John Carter ("Mastering the Trade")
Strategy enhancement & development: PickMyTrade Team
About PickMyTrade
Strategy Automation:
If you like automation, you can use pickmytrade.io for automating your stock, crypto, futures, and options trading
Supported brokers: Rithmic, TradeStation, TradeLocker, Interactive Brokers, ProjectX
For Tradovate broker automation, visit pickmytrade.trade
Transform your TradingView strategies into fully automated trading systems with real-time execution.
Disclaimer
This strategy is for educational purposes. Past performance does not guarantee future results. Always practice proper risk management and test thoroughly on a demo account before live trading.
Developed by PickMyTrade Team
Classic Dual Momentum – 12-Month Absolute Momentum - AntonacciThis indicator calculates the 12-month absolute momentum exactly as described in Gary Antonacci’s Dual Momentum framework.
It automatically adjusts the lookback period based on the chart’s timeframe:
Daily chart: 252 bars
Weekly chart: 52 bars
Monthly chart: 12 bars
Other timeframes: Estimated automatically using bar time difference
The script computes the 12-month rate of return and displays it as a color-coded column plot:
Green: Positive 12-month momentum
Red: Negative 12-month momentum
A customizable moving average is included to help visualize longer-term trends in the momentum signal.
How It’s Used (from Dual Momentum theory)
This indicator provides the absolute momentum filter used in classic Dual Momentum strategies:
If the 12-month return of an asset is above the risk-free return → trend is positive
If it is below the risk-free return → trend is negative
This absolute momentum check is a key component of the Global Equities Momentum (GEM) model presented in Gary Antonacci’s book Dual Momentum Investing.
Why This Indicator Exists
It gives traders a clean, accurate way to visualize the 12-month trend strength across any timeframe, without the distortions caused by bar length differences.
