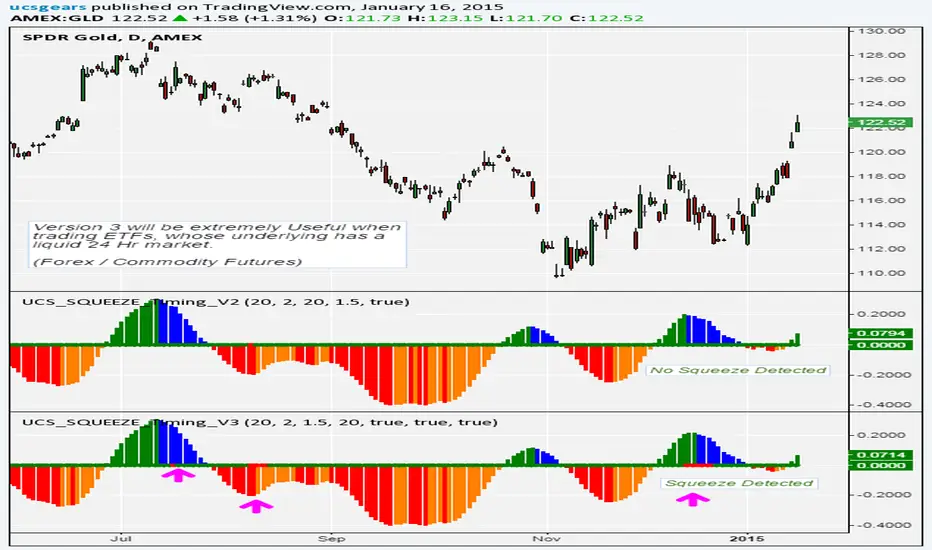
UCS_Squeeze_Timing-V3Another Version with More Features . I am confident enough this works fine now. I am Sure this will be a valuable tool for you guys who love squeezes.
///////////////// This can be further optimized, Let me know with a comment, if you still need this to be optimized. ////////////////////
This update includes
- Added Options to detect squeeze using Heikin Ashi Candle
- Added Options to use BBR or Momentum (ROC) for the Momentum Histogram
- Custom Momentum Smoothing time period
- Removed the Separate Look back periods for BB/KC - Since it doesn't really make sense using different lengths for KC and BB.
HA Closes can be really helpful in trading ETFs like FXE, GLD, FXY, SLV etc, which constantly gaps on daily basis. This helps in smoothing out. And most Importantly it Lines up with the Underlying's Squeeze.
[The Next Major Version is currently being Back tested with better timing triggers etc...... That will replace all other Squeeze indicators in the market - Some Major upgrades have been done to the squeezes to read the consolidation is with support or resistance. Also plan on adding best bet entries and pre-breakout signals. So far so good, this recent contradicting trends in daily / weekly in the market is making the indicator hard to work per theory]
The delay is because, I do not like to post any script (with signals) without sufficient back testing . I will not post these indicator with signals, unless I am sure it works per my theoretical derivations.
-
Thanks for Being Patient and all your support.
Until then - Good Luck Trading.
Поиск скриптов по запросу "momentum"
Squeeze Momentum Indicator [LazyBear]
Fixed a typo in the code where BB multiplier was stuck at 1.5. Thanks @ucsgears for bringing it to my notice.
Updated source: pastebin.com
Use the updated source instead of the what TV shows below.
This is a derivative of John Carter's "TTM Squeeze" volatility indicator, as discussed in his book "Mastering the Trade" (chapter 11).
Black crosses on the midline show that the market just entered a squeeze (Bollinger Bands are with in Keltner Channel). This signifies low volatility, market preparing itself for an explosive move (up or down). Gray crosses signify "Squeeze release".
Mr.Carter suggests waiting till the first gray after a black cross, and taking a position in the direction of the momentum (for ex., if momentum value is above zero, go long). Exit the position when the momentum changes (increase or decrease --- signified by a color change). My (limited) experience with this shows, an additional indicator like ADX / WaveTrend, is needed to not miss good entry points. Also, Mr.Carter uses simple momentum indicator, while I have used a different method (linreg based) to plot the histogram.
More info:
- Book: Mastering The Trade by John F Carter
List of all my indicators:

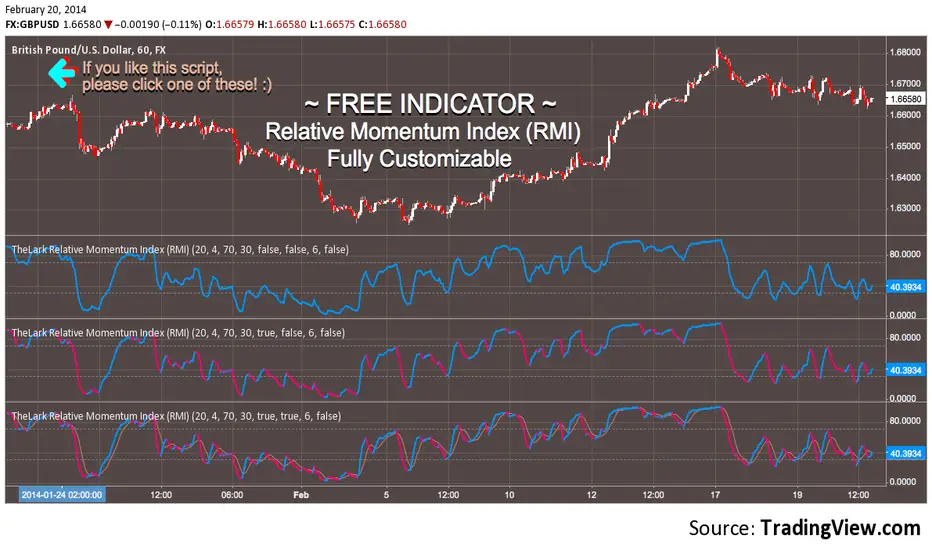
FREE INDICATOR: Relative Momentum Index (RMI)RMI, as requested by glaz
Description:
The Relative Momentum Index was developed by Roger Altman and was introduced in his article in the February, 1993 issue of Technical Analysis of Stocks & Commodities magazine.
While your typical RSI counts up and down days from close to close, the Relative Momentum Index counts up and down days from the close relative to a close x number of days ago. The result is an RSI that is a bit smoother.
Usage:
Use in the same way you would any other RSI. There are overbought and oversold zones, and can also be used for divergence and trend analysis .
Grab the source code here: pastebin.com
Installation video by @ChrisMoody here : vimeopro.com
░░░░░░░░░░░░░░░ Feel free to follow me to keep up with my latest scripts! ░░░░░░░░░░░░░░░
░░░░░░░░░░░░ PLEASE THUMB UP OR STAR IF YOU LIKE THIS INDICATOR! ░░░░░░░░░░░░
I'd like as many people as possible to get it :)
Session Opening Range Breakout (ORBO)This strategy automates a classic Opening Range Breakout (ORBO) approach: it builds a price range for the first minutes after the market opens, then looks for strong breakouts above or below that range to catch early directional moves.
Concept
The idea behind ORBO is simple:
The first minutes after the session open are often highly informative.
Price forms an “opening range” that acts as a mini support/resistance zone.
A clean breakout beyond this zone can lead to high-momentum moves.
This script turns that logic into a fully backtestable strategy in TradingView.
How the strategy works
Opening Range Session
Default session: 09:30–09:50 (exchange time)
During this window, the script tracks:
orHigh → highest high within the session
orLow → lowest low within the session
This forms your Opening Range for the day.
Breakout Logic (after the window ends)
Once the defined session ends:
Long Entry:
If the close crosses above the Opening Range High (orHigh),
→ strategy.entry("OR Long", strategy.long) is triggered.
Short Entry:
If the close crosses below the Opening Range Low (orLow),
→ strategy.entry("OR Short", strategy.short) is triggered.
Only one opening range per day is considered, which keeps the logic clean and easy to interpret.
Daily Reset
At the start of a new trading day, the script resets:
orHigh := na
orLow := na
A fresh Opening Range is then built using the next session’s 09:30–09:50 candles.
This ensures entries are always based on today’s structure, not yesterday’s.
Visuals & Inputs
Inputs:
Opening range session → default: "0930-0950"
Show OR levels → toggle visibility of OR High / Low lines
Fill range body → optional shaded zone between OR High and OR Low
Chart visuals:
A green line marks the Opening Range High.
A red line marks the Opening Range Low.
Optional yellow fill highlights the entire OR zone.
Background shading during the session shows when the range is currently being built.
These visuals make it easy to see:
Where the OR sits relative to current price
How clean / noisy the breakout was
How often price respects or rejects the opening zone
Backtesting & Optimization
Because this is written as a strategy():
You can use TradingView’s Strategy Tester to view:
Win rate
Net profit
Drawdown
Profit factor
Equity curve
Ideas to experiment with:
Change the session window (e.g., 09:15–09:45, 10:00–10:30)
Apply to different:
Markets: indices, FX, crypto, stocks
Timeframes: 1m / 5m / 15m
Add your own:
Stop Loss & Take Profit levels
Time filters (only trade certain days / times)
Volatility filters (e.g., ATR, range size thresholds)
Higher-timeframe trend filter (e.g., only take longs above 200 EMA)

Dashboard AIO Pro: RSI, MACD & Stoch RSI [THF]Description:
This indicator provides a comprehensive "All-in-One" Dashboard that monitors three major momentum oscillators: RSI, MACD, and Stochastic RSI. It displays their real-time values and interprets their signals (Buy/Sell/Neutral) in a clean, customizable table directly on your chart.
Key Features:
Consolidated View: Instead of cluttering your chart with three separate indicator panes, this dashboard summarizes the market state in one compact table.
Dynamic Summary: The script calculates an "Overall Trend" based on a voting system. If 2 or more indicators agree on a direction, the summary updates to show a "Strong Trend".
Fully Customizable Colors: Users can customize the colors for Strong Buy, Buy, Sell, Strong Sell, and Neutral states via the settings menu to match their chart theme.
Alerts Included: Built-in alert conditions for "Strong Buy Consensus" and "Strong Sell Consensus".
How it Works (The Logic):
RSI (14):
Value > 70: Considered Overbought (Bearish signal).
Value < 30: Considered Oversold (Bullish signal).
MACD (12, 26, 9):
Bullish: MACD Line > Signal Line AND Histogram is rising.
Bearish: MACD Line < Signal Line AND Histogram is falling.
Stoch RSI (14, 14, 3, 3):
Evaluates K% line position relative to 80/20 levels and crossovers with D% line.
Overall Summary:
The script assigns a score (+1 for Bullish, 0 for Neutral).
If the total score >= 2, the trend is identified as "Uptrend".
If the indicators show divergent signals, the status remains "Ranging".
Settings:
You can change the length of all indicators (RSI, MACD, Stoch).
You can change the table position and text size.
Color Customization: Dedicated section to change the dashboard colors.

Futures Momentum Scanner – jyoti//@version=5
indicator("Futures Momentum Scanner – Avvu Edition", overlay=false, max_lines_count=500)
//------------------------------
// USER INPUTS
//------------------------------
rsiLen = input.int(14, "RSI Length")
macdFast = input.int(12, "MACD Fast")
macdSlow = input.int(26, "MACD Slow")
macdSignal = input.int(9, "MACD Signal")
stLength = input.int(10, "Supertrend Length")
stMult = input.float(3.0, "Supertrend Multiplier")
//------------------------------
// SUPER TREND
//------------------------------
= ta.supertrend(stMult, stLength)
trendUp = stDirection == 1
//------------------------------
// RSI
//------------------------------
rsi = ta.rsi(close, rsiLen)
rsiBull = rsi > 50 and rsi < 65
//------------------------------
// MACD
//------------------------------
= ta.macd(close, macdFast, macdSlow, macdSignal)
macdBull = macd > signal and macd > 0
//------------------------------
// MOVING AVERAGE TREND
//------------------------------
ema20 = ta.ema(close, 20)
ema50 = ta.ema(close, 50)
ema200 = ta.ema(close, 200)
trendStack = ema20 > ema50 and ema50 > ema200
//------------------------------
// BREAKOUT LOGIC
//------------------------------
prevHigh = ta.highest(high, 20)
breakout = close > prevHigh
//------------------------------
// FINAL SCANNER LOGIC
//------------------------------
bullishCandidate = trendUp and rsiBull and macdBull and trendStack and breakout
//------------------------------
// TABLE OUTPUT FOR SCANNER FEEL
//------------------------------
var table t = table.new(position.top_right, 1, 1)
if barstate.islast
msg = bullishCandidate ? "✔ BUY Candidate" : "– Not a Setup"
table.cell(t, 0, 0, msg, bgcolor=bullishCandidate ? color.new(color.green, 0) : color.new(color.red, 70))
//------------------------------
// ALERT
//------------------------------
alertcondition(bullishCandidate, title="Scanner Trigger", message="This stock meets Avvu's futures scanner criteria!")


QQQ Momentum Regime Rider (EMA + VWAP + ADX + Vol Pullback)My strategy catches intraday momentum, has a phenomenal return of 18% annually

Confirmed Momentum QQQ (RSI/MACD Filter)Gemini and Myself,
How This Targets a Higher Win Rate
The key to the win rate increase is the RSI 20/80 filter.
Long Signal: A long entry is now only taken if the trend is up (SMA cross), the MACD is bullish, and the RSI is not overbought (below 80). By only entering when momentum is not yet exhausted, you increase the chance that the price can travel far enough to hit your 4.0 point Take Profit.
Wider SL: The wider Stop Loss of 2.5 points reduces the chance of being stopped out prematurely by routine market movements (whipsaws), which is the number one killer of win rates in high-frequency trading.
After applying these changes, you will need to run the Strategy Tester again to see the new win rate and the new total number of trades.
Would you like me to help you interpret the new Strategy Tester results once you apply these settings?

⚡ Elite Momentum Pro🎯 Key Features
1. Smart Signal Engine
3 Signal Modes: Aggressive, Balanced, Conservative
7-Point Scoring System - Ensures high-quality signals
Anti-Flip Protection - Prevents rapid signal changes
Multiple confirmations: Supertrend, MACD, RSI, EMA alignment, momentum
2. Advanced Risk Management
3 Take Profit Levels (TP1, TP2, TP3) for scaling out
ATR-Based Dynamic Stops - Adapts to volatility
Customizable Risk:Reward (default 2.5:1)
Visual stop and target levels
3. Clean Visual Design
Color-coded price bars based on trend strength
EMA Ribbon (9, 21, 50, 200) for trend clarity

Options Momentum SignalCustomizable Intraday Options Scalping Alert.
Several important, complementary indicators combined into one simple signal that pops up under a bar to indicate sustained momentum on a trend. It uses a combination of calculations based on the 1m VWAP, price increase in contrast to previous day's close, and customizable Volatility and Volume Data.
It has adjustable values for the % increase from last close (labeled as Pre-Mkt % Threshold), minimal candle body % to filter out weaker signals, RVOL threshold, minimum CVD (it's rolling, so functions in tandem with the CVD lookback value for the number of bars.)
It offers individual boxes that can be checked on or off to help filter out noise. Boxes are: Use 1m VWAP, Use CVD, 3-bar cooldown (reduces back-to-back signals, especially on shorter (1m, 2m, and 5m) charts), VWAP bounce option to catch bounces happening in real time before the candle closes, Use RVOL, and Use Rolling CVD. These can all be checked on or off and will create vastly different signals depending on what you are filtering for.
These indicators were chosen specifically as I feel they help most with option scalping and is intended to be used alongside a few other indicators for confirmation. Personally, I use a couple anchored VWAPs (highest high, session) as well as a FRAMA channel for confirmation. I also use the following to further confirm trends: TradingView’s RVOL, CVD, and Price Pattern Oscillators, in addition to Beardy Fred's TTM Squeeze Pro.
Hope this helps some people!

Zero Lag + Momentum Bias StrategyZero Lag + Momentum Bias Strategy (MTF + Strong MBI + R:R + Partial TP + Alerts)

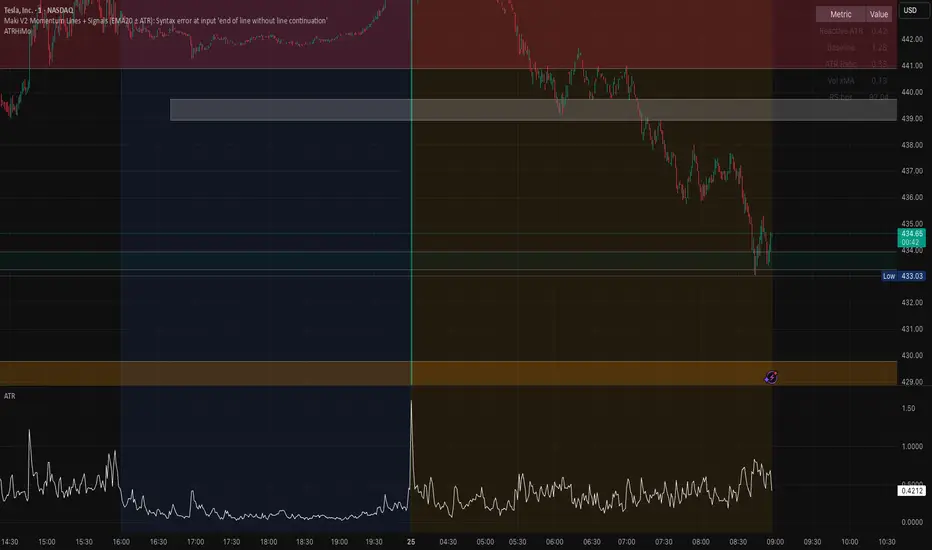
Opening ATR + High Momentum (10/30/60)this is a custom momentum indicator using atr
A fixed, compiling Pine v5 script is below with the three issues corrected: no plots in local scope, a ≤10-character shorttitle, and cleaned ternaries/formatting that remove the “end of line without line continuation” error.
HeatCandleHeatCandle - AOC Indicator
✨ Features
📊 Heat-Map Candles: Colors candles based on the price’s deviation from a Triangular Moving Average (TMA), creating a heat-map effect to visualize price zones.
📏 Zone-Based Coloring: Assigns colors to 20 distinct zones (Z0 to Z19) based on the percentage distance from the TMA, with customizable thresholds.
⚙️ Timeframe-Specific Zones: Tailored zone thresholds for 1-minute, 5-minute, 15-minute, 30-minute, 1-hour, and 4-hour timeframes for precise analysis.
🎨 Customizable Visuals: Gradient color scheme from deep blue (oversold) to red (overbought) for intuitive price movement interpretation.
🛠️ Adjustable Parameters: Configure TMA length and threshold multiplier to fine-tune sensitivity.
🛠️ How to Use
Add to Chart: Apply the "HeatCandle - AOC" indicator on TradingView.
Configure Inputs:
TMA Length: Set the period for the Triangular Moving Average (default: 150).
Threshold Multiplier: Adjust the multiplier to scale zone sensitivity (default: 1.0).
Analyze: Observe colored candles on the chart, where colors indicate the price’s deviation from the TMA:
Dark blue (Z0) indicates strong oversold conditions.
Red (Z19) signals strong overbought conditions.
Track Trends: Use the color zones to identify potential reversals, breakouts, or trend strength based on price distance from the TMA.
🎯 Why Use It?
Visual Clarity: The heat-map candle coloring simplifies identifying overbought/oversold conditions at a glance.
Timeframe Flexibility: Zone thresholds adapt to the selected timeframe, ensuring relevance across short and long-term trading.
Customizable Sensitivity: Adjust TMA length and multiplier to match your trading style or market conditions.
Versatile Analysis: Ideal for scalping, swing trading, or trend analysis when combined with other indicators.
📝 Notes
Ensure sufficient historical data for accurate TMA calculations, especially with longer lengths.
The indicator is most effective on volatile markets where price deviations are significant.
Pair with momentum indicators (e.g., RSI, MACD) or support/resistance levels for enhanced trading strategies.
Happy trading! 🚀📈

Weekly Setup Scanner (Trend + Momentum + Squeeze)Trend → price above weekly 20 EMA.
Momentum → weekly MACD bullish (MACD > Signal).
Volatility → weekly squeeze (Bollinger Bands inside Keltner Channels).
If all 3 conditions align → it flags the setup

High-and-Tight Impulse + Micro ConsolidationThis indicator detects a specific bullish continuation setup on daily charts:
- An impulse move (X% rise within N bars, mostly green candles)
- Immediately followed by a tight consolidation (small ranges, small bodies)
- Closes holding in the top zone of the impulse
On the chart, signals are plotted as orange dots above bars.
Labels show the last detected setup date, and a counter displays total matches in history.
Useful for backtesting "high-and-tight flag" type momentum patterns or any symbol.
Adjust inputs (impulse % threshold, bars, ATR ratios, top zone %) to make it stricter or looser.
Alerts are included when a new setup is detected.
This tool is not financial advice. For educational and research purposes only.
by fiyatherseydir

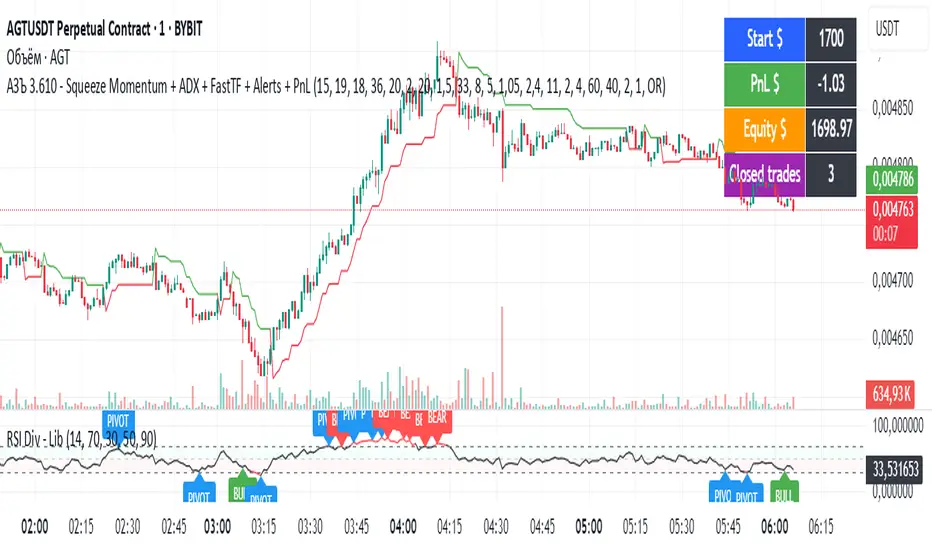
АЗЪ 3.610 - Squeeze Momentum + ADX + FastTF + Alerts + PnLStrata genius squeeze momentum + tester + adx +fast tf
MACD Momentum Slowdown Alert (Bullish + Bearish)little arrows showing on chart when MACD histogram has a slowdown (change of color) in momentum

MACD-V (Volatility-Normalised Momentum) — Spiroglou, 2022Volatility-normalized MACD per Alex Spiroglou (2022):
MACD-V = (EMA12 − EMA26) / ATR26 × 100, so momentum is expressed in ATR units and stays comparable across assets/timeframes.
What you get
• Trend-colored line: green when price ≥ EMA200, red otherwise.
• Guides: ±50 / ±100 / 0; Extremes: ±140 (editable).
• Regime shading: OB ≥ +140 shaded red; OS ≤ −140 shaded green.
• Clean, on-curve markers: small circles on the MACD-V line at the four edge events — OB (enter ≥ +threshold), OBX (cross back down), OS (enter ≤ −threshold), OSX (cross back up).
• Text labels are off by default; optional toggle only for OB/OBX.
• Signal & histogram: EMA(9) of MACD-V and (MACD-V − Signal) columns.
• Alerts: OB/OS entries & exits included.
How to use
• Favor longs when MACD-V > 0 (ideally > +50); respect OB for possible exhaustion.
• Favor shorts when MACD-V < 0 (ideally < −50); respect OS for possible exhaustion.
• Because it’s ATR-normalized, thresholds transfer well across symbols and timeframes.

Clenow Momentum (annualized slope × R²) — v6 (fixed types)Clenow Momentum Indicator calculates the annualised exponential regression slope over a 90 day look back period and multiplies it by the R-squared of that regression

RSI-CCI Momentum ScreenerRSI-CCI Momentum Screener;
How to Use:
Apply this script to 1H or 4H timeframe
Works well for NSE stocks, crypto, or forex
Look for a green label “BUY” that shows when the screener conditions are met

Market DashboardMarket Dashboard — All-in-One Technical Indicator Panel
The Market Dashboard is a powerful visual tool that consolidates key technical indicators into a single on-chart table, helping traders make faster and more informed decisions. This script includes:
RSI — Detects overbought and oversold market conditions
MACD — Shows trend momentum and crossover signals
CVD (Cumulative Volume Delta) — Highlights buyer vs. seller pressure
Volume Analysis — Flags unusually high volume
ATR (Average True Range) — Displays current market volatility
Session Detector — Automatically identifies ASIAN, LONDON, or NEW YORK sessions based on UTC time
Fully Customizable — Adjust table position and text size to fit your chart layout
Designed for traders who want a clean, real-time snapshot of market dynamics, directly on the chart.
