Sig30MALICEHello everyone
Bot is optimalized BINANCE:ALICEUSDTPERP BOT, which select leverage betwen 2x and 4x
TimeFrame : 30min
TP : 80 point
SL : 120 point
the bot works as follows:
the way he opens a position consists of two conditions
1) Moving average (crossovers)
2) RSI
Backtesting is set for counting as 13 contrat, this bot can get more with 50% of equity.
I think this is really solid 30min bot, which is already really important to make something solid on 30min
However keep in mind this is scalper and optimalization scalpers are really hard and have to be set from time to time
This bot is also great for other optimalizations .
.
.
.
.
.
.
Enjoy
Поиск скриптов по запросу "moving average crossover"

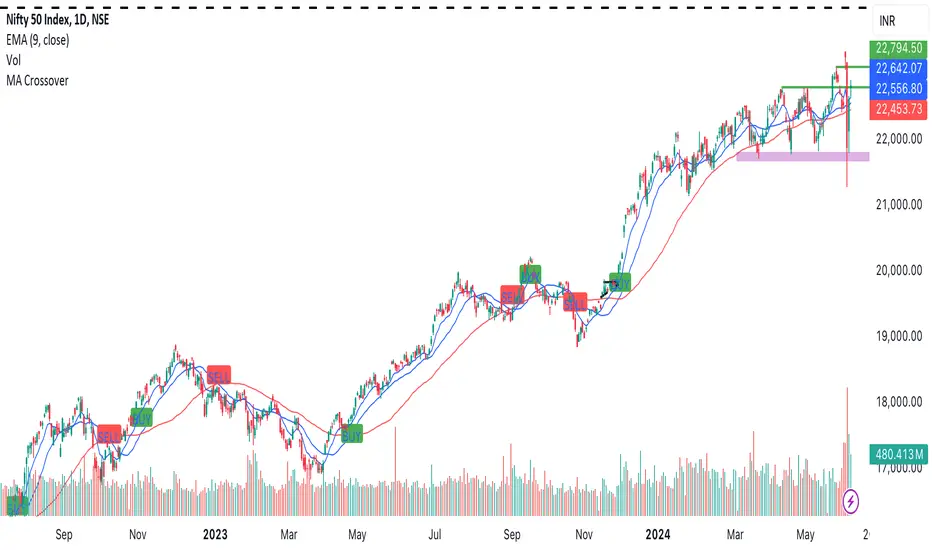
Algo Trading (Nifty & BankNifty)What is Algo Trading ( Nifty & Bank Nifty ) Indicator?
There are many 9 to 5 working professionals who have some spare money to invest each month but they can not do active trading because they are busy with their full time job.
So they wish to have an automated system which could take and close trades for them with a proven back-tested strategy, proper money management, ability to trade within particular timings, pre-defined maximum loss they can bear and so on.
This indicator facilities all such needs of working professionals.
How this indicator generates signals?
This indicator generates signals in 3 ways:
(a) Pricing action validated by Jump in Volume
(b) Moving Average Crossovers
(c) Zeta Force Signals as generated by our proprietary formula for Bank Nifty & Nifty
Once a threshold value is crossed, the Buy/Sell signal (LE & SE) appears on the chart and algo keeps track of the current state. Then this state is remembered for the loss or profit the trade is generating and position is closed either when loss crosses the set limit or when profitable trade starts receding.
What are the various features of this indicator?
(a) You can define your session timing i.e. the time period when you want your trades to be taken. For example: between 1000 hrs to 1330 hrs or so on.
(b) You can choose to close all positions by EOD . ( EOD is defined by the user. For example, if you set the session timing between 9:30 to 11:00 am, then indicator will not take any trades outside
this range).
(c) You can define the total loss you can bear during a particular day. For example, if total loss is 5% for the day, the algo stops taking further trades.
(d) You can set up either manual alerts for each event, for example Buy, Sell, Buy Close, Sell Close where you can customize the message you want to display or you can select the 'Any Alert()
function call' option which will generate pop up messages in TradeTron or Algoji friendly format. These signals can be routed to 3rd party platforms for execution. If you have TradeTron or
Algoji Account, you can enter your API key in algo settings, and after that the messages generated will contain your API Key by default.
What are the limitations of this indicator?
You can not make money with any indicator or algo if market is narrow range bound.
For you to make money, there must be a trend or mini-trend. Sometimes, price starts trending for a while and then reverses back. In such cases, multiple Stop Loss Hits might occur.
Can I use this for Option Trading also?
Deep in the money options behave like Futures only. So yes, you can use this algo for Options Trading by buying Deep in the money options.
Can I use this for trading in stocks or any other instrument?
No. The code has been hard-wired for Bank Nifty & Nifty (Indian Indices) only. A different, generic version of this algo is in the pipeline which can be used for Forex or Commodity and Stocks.

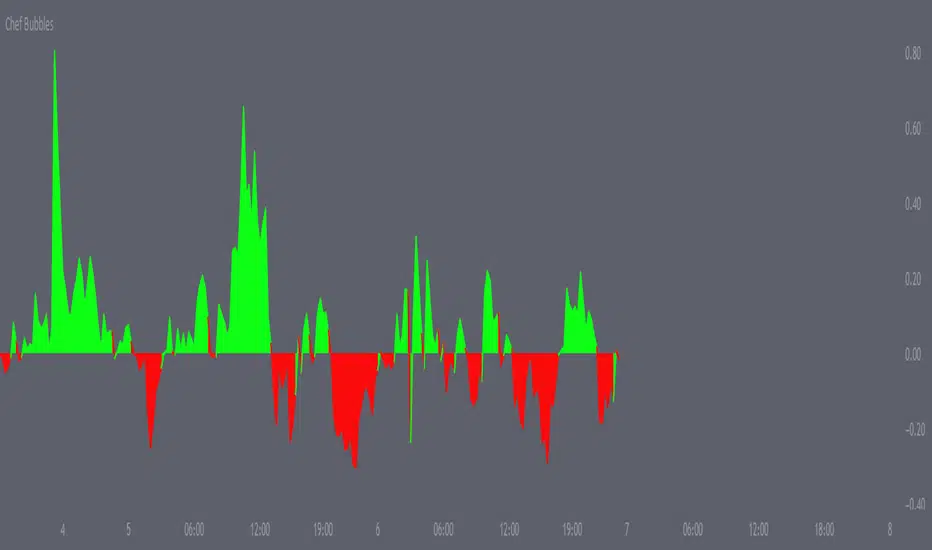
Chef BubblesThis is an enhanced version of Momentum indication Ways that shows 2 ways to calculate momentum and display each one along with their combined average value.
Essentially I've matched the momentum from the lower time frames together to determine when we are getting a push, amazing for scalps, I use it for everything.
Alongside this, I also made sure to add the currency's strength pretty much embedded within the momentum indicator , thus giving you the best momentum indication you can get a good entry point majority of the time if used right. I recommend matching this with my moving average crossover pair.
Open Close Cross Strategy R6.1 revised by yourmattieOriginal version: Open Close Cross Strategy R5 revised by JustUncle.
Change: script changed to a study script with custom alerts.
This revision is an open Public release, with just some minor changes. It is a revision of the Strategy "Open Close Cross Strategy R2" originally published by @JayRogers.
Revised by JustUncleL
Description :
Strategy based around Open-Close Moving Average Crossovers optionally from a higher time frame.
Read more about the indicator original script
Klik here
##USE AT YOUR OWN RISK##
Use this as overlayer on the original strategy to set custom alerts.
Info: with this study script no buy/sell arrows show up op the chart.
Does some know a solution for this issue:
Issue: sometimes it gives a false signal because even when you set "one per bar close" the custom set alert might come halfway the bar....and it might be a false signal when the bar is closed
Does somone know a fix for this? I tried with barstate.iscomfirmed but it didn't work for me.
Ps. I'm not a developer...just changed the scipt by watching a youtube tutorial.
FS_TrendCrossThis indicator is trendfollowing and is based on moving average crossovers with support of ichimoku cloud .
It gives buy and sell signals when certain conditions based on EMAs are met.
This indicator can be used in any trending markets.

PpSignal The Ultimate Moving Average Crossover 3.0 (CFB)CFB tells you how long the market has been in a quality trend. This value can be used to adjust the period length of other indicators, especially stochastic bands.In order to quantify the overall duration of a market's trend, we replaced classical cycle analysis methods (FFT, MEM, MESA) with a form of analysis that works even when no cycles exist. We accomplished this by examining a time series for specific fractal patterns of any size. We then gather all the patterns found and combine them into one overall index, CFB (Composite Fractal Behavior) Index.For good reason, CFB does not analyze time series data for dominant cycles. Classical cycle analysis examines data points (e.g. prices) and estimates the average presence of a cycle in the window. Now suppose a cycle with a period length of 9 days was strong for 50 days and then disappeared for the next 21 days

BullTrading Intraday StopHunt Indicator Phycologically traders tend to sell on lows and buy on highs. BullTrading Intraday StopHunt Indicator is designed to help you avoid such situations by monitoring the market for intraday trading setups.
The indicator plots a "Fractal Envelope © " containing the most significant Support and Resistance levels for analysis and entry level selection.
Trend filtering is provided by a MTF P-SAR (SAR will avoid repainting false signals).
The BullTrading Chaos Trend Wave is used instead the Alligator to trade fractals.
BullTrading Intraday StopHunt Indicator will provide 3 types of signals:
First one is a swing/intraday signal, it will alert you when the price is located at a very sensitive level (buy or sell) filtered by trend. If you check the indicator after the close of the day you can even know this exact level in advance (plot Red or Lime color).
Second signal will alert you the Chaos Trend Wave Moving Average Crossovers filtered by price position (related to the Fractal Envelope) and mayor trend.
Third signal is a scalping signal, it will alert you all the fractal breakouts filtered by price position (related to the Fractal Envelope) and mayor trend.
You will be amazed the huge amount of trade opportunities for a given week trading only one financial instrument.
Obviously the indicator is not perfect and will plot few false signals on mayor trend reversals or big price manipulations. AVOID THE TRAP BY WAITING THE PRICE USING BUY LIMIT AND SELL LIMIT ORDERS.
NOTE: This indicator works on any timeframe, but standard settings are calibrated for 15' charts.

VAGANZA Swings V1 LITE1. Introduction: The Philosophy Behind VAGANZA Swings
The VAGANZA Swings V1 LITE was developed to solve a common problem faced by swing traders: getting caught in low-probability trades during choppy, sideways markets. Many indicators can identify a trend, but few can effectively measure its quality and pinpoint optimal, low-risk entry points within that trend.
This script is not merely a "mashup" of existing indicators. It is a structured, multi-layered filtering system where each component is specifically chosen to address the weaknesses of the others. The core philosophy is to trade only when there is a clear market consensus, confirmed by trend, strength, momentum, and volume. This results in fewer signals, but each signal is designed to be of significantly higher quality.
2. The VAGANZA Confirmation Engine: A Deeper Look at the Logic
A signal is only generated when four distinct market conditions align. This sequential confirmation process is what makes the script unique and robust.
Layer 1: The Trend Regime Filter
What it does: The indicator first establishes the dominant market bias using a dual-speed baseline system. A faster-reacting baseline is compared against a slower, more stable baseline to determine if the market is in a long-term bullish or bearish "regime."
Why it's important: This foundational step ensures we are never fighting the primary market current. BUY signals are disabled during a bearish regime, and SELL signals are disabled during a bullish regime, instantly eliminating 50% of potentially bad trades.
Layer 2: The Trend Strength & Conviction Qualifier
What it does: This is the script's core intelligence. After confirming the trend's direction, this layer uses a directional volatility engine to measure the trend's strength or conviction. It analyzes the expansion between bullish and bearish price movements.
Why it's important: A simple moving average crossover can occur in a weak, drifting market, leading to false signals. This filter requires the trend to be demonstrably powerful (above a predefined strength threshold of 25) before allowing the system to even look for an entry. It's the primary filter for avoiding sideways market traps.
Layer 3: The Dynamic Pullback & Entry Trigger
What it does: Instead of chasing price at its peak, the script waits for a natural "breather" or pullback. It employs a momentum cycle oscillator to identify when the price has become temporarily oversold within a strong uptrend, or overbought within a strong downtrend. The signal is triggered at the precise moment momentum appears to be rejoining the primary trend.
Why it's important: This ensures a more favorable risk-to-reward ratio. By entering on a pullback, traders can avoid buying the top or selling the bottom of a short-term swing, which is a common mistake.
Layer 4: The Volume Participation Check
What it does: As a final confirmation, the script checks the volume on the signal candle. It requires the volume to be higher than its recent average.
Why it's important: A price move without significant volume can be a trap. This final check confirms that there is genuine market participation and conviction behind the signal, suggesting that larger market players are supporting the move.
3. The Synergy of the System (Why This Combination is Original)
The originality of VAGANZA Swings lies not in its individual components, but in their synergistic interaction:
The Trend Regime Filter sets the stage.
The Trend Strength Qualifier prevents signals when the stage is poorly lit (i.e., a weak trend).
The Pullback & Entry Trigger tells the actor exactly when to enter the stage for maximum impact.
The Volume Check ensures the audience is actually watching.
Without the strength filter, the trend filter would fail in ranging markets. Without the pullback trigger, entries would have poor risk-reward. This interdependent, sequential logic provides a unique and useful tool that goes beyond what a single indicator can offer.
4. How to Use This Script
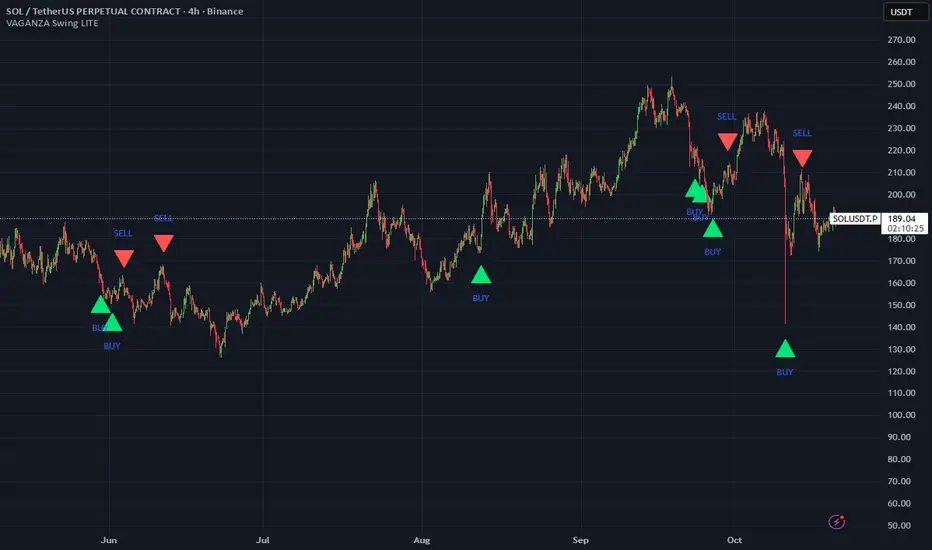
Timeframe: Optimized for the 4-Hour (H4) chart, as this provides a balance between meaningful swings and actionable signals. It can also be used on the Daily (D1) chart for longer-term analysis.
BUY Signal (Green "BUY" Arrow): Appears only when a strong, confirmed uptrend experiences a temporary, oversold pullback and volume confirms renewed buying interest. This is a high-probability signal to consider a long position.
SELL Signal (Red "SELL" Arrow): Appears only when a strong, confirmed downtrend experiences a temporary, overbought rally and volume confirms renewed selling pressure. This is a high-probability signal to consider a short position.
Risk Management: This indicator provides entry signals only. It is crucial that you apply your own risk management rules. Always use a stop-loss and have a clear take-profit strategy for every trade.
Disclaimer: This tool is for decision-support and does not constitute financial advice. All trading involves risk. Past performance is not indicative of future results. Please backtest thoroughly before using this script with real capital.
The Best Strategy Template[LuciTech]Hello Traders,
This is a powerful and flexible strategy template designed to help you create, backtest, and deploy your own custom trading strategies. This template is not a ready-to-use strategy but a framework that simplifies the development process by providing a wide range of pre-built features and functionalities.
What It Does
The LuciTech Strategy Template provides a robust foundation for building your own automated trading strategies. It includes a comprehensive set of features that are essential for any serious trading strategy, allowing you to focus on your unique trading logic without having to code everything from scratch.
Key Features
The LuciTech Strategy Template integrates several powerful features to enhance your strategy development:
•
Advanced Risk Management: This includes robust controls for defining your Risk Percentage per Trade, setting a precise Risk-to-Reward Ratio, and implementing an intelligent Breakeven Stop-Loss mechanism that automatically adjusts your stop to the entry price once a specified profit threshold is reached. These elements are crucial for capital preservation and consistent profitability.
•
Flexible Stop-Loss Options: The template offers adaptable stop-loss calculation methods, allowing you to choose between ATR-Based Stop-Loss, which dynamically adjusts to market volatility, and Candle-Based Stop-Loss, which uses structural price points from previous candles. This flexibility ensures the stop-loss strategy aligns with diverse trading styles.
•
Time-Based Filtering: Optimize your strategy's performance by restricting trading activity to specific hours of the day. This feature allows you to avoid unfavorable market conditions or focus on periods of higher liquidity and volatility relevant to your strategy.
•
Customizable Webhook Alerts: Stay informed with advanced notification capabilities. The template supports sending detailed webhook alerts in various JSON formats (Standard, Telegram, Concise Telegram) to external platforms, facilitating real-time monitoring and potential integration with automated trading systems.
•
Comprehensive Visual Customization: Enhance your analytical clarity with extensive visual options. You can customize the colors of entry, stop-loss, and take-profit lines, and effectively visualize market inefficiencies by displaying and customizing Fair Value Gap (FVG) boxes directly on your chart.
How It Does It
The LuciTech Strategy Template is meticulously crafted using Pine Script, TradingView's powerful and expressive programming language. The underlying architecture is designed for clarity and modularity, allowing for straightforward integration of your unique trading signals. At its core, the template operates by taking user-defined entry and exit conditions and then applying a sophisticated layer of risk management, position sizing, and trade execution logic.
For instance, when a longCondition or shortCondition is met, the template dynamically calculates the appropriate position size. This calculation is based on your specified risk_percent of equity and the stop_distance (the distance between your entry price and the calculated stop-loss level). This ensures that each trade adheres to your predefined risk parameters, a critical component of disciplined trading.
The flexibility in stop-loss calculation is achieved through a switch statement that evaluates the sl_type input. Whether you choose an ATR-based stop, which adapts to market volatility, or a candle-based stop, which uses structural price points, the template seamlessly integrates these methods. The ATR calculation itself is further refined by allowing various smoothing methods (RMA, SMA, EMA, WMA), providing granular control over how volatility is measured.
Time-based filtering is implemented by comparing the current bar's time with user-defined start_hour, start_minute, end_hour, and end_minute inputs. This allows the strategy to activate or deactivate trading during specific market sessions or periods of the day, a valuable tool for optimizing performance and avoiding unfavorable conditions.
Furthermore, the template incorporates advanced webhook alert functionality. When a trade is executed, a customizable JSON message is formatted based on your webhook_format selection (Standard, Telegram, or Concise Telegram) and sent via alert function. This enables seamless integration with external services for real-time notifications or even automated trade execution through third-party platforms.
Visual feedback is paramount for understanding strategy behavior. The template utilizes plot and fill functions to clearly display entry prices, stop-loss levels, and take-profit targets directly on the chart. Customizable colors for these elements, along with dedicated options for Fair Value Gap (FVG) boxes, enhance the visual analysis during backtesting and live trading, making it easier to interpret the strategy's actions.
How It's Original
The LuciTech Strategy Template distinguishes itself in the crowded landscape of TradingView scripts through its unique combination of integrated, advanced risk management features, highly flexible stop-loss methodologies, and sophisticated alerting capabilities, all within a user-friendly and modular framework. While many templates offer basic entry/exit signal integration, LuciTech goes several steps further by providing a robust, ready-to-use infrastructure for managing the entire trade lifecycle once a signal is generated.
Unlike templates that might require users to piece together various risk management components or code complex stop-loss logic from scratch, LuciTech offers these critical functionalities out-of-the-box. The inclusion of dynamic position sizing based on a user-defined risk percentage, a configurable risk-to-reward ratio, and an intelligent breakeven mechanism significantly elevates its utility. This comprehensive approach to capital preservation and profit targeting is a cornerstone of professional trading and is often overlooked or simplified in generic templates.
Furthermore, the template's provision for multiple stop-loss calculation types—ATR-based for volatility adaptation, and candle-based for structural support/resistance—demonstrates a deep understanding of diverse trading strategies. The underlying code for these calculations is already implemented, saving developers considerable time and effort. The subtle yet powerful inclusion of FVG (Fair Value Gap) related inputs also hints at advanced price action concepts, offering a sophisticated layer of analysis and execution that is not commonly found in general-purpose templates.
The advanced webhook alerting system, with its support for various JSON formats tailored for platforms like Telegram, showcases an originality in catering to the needs of modern, automated trading setups. This moves beyond simple TradingView pop-up alerts, enabling seamless integration with external systems for real-time trade monitoring and execution. This level of external connectivity and customizable data output is a significant differentiator.
In essence, the LuciTech Strategy Template is original not just in its individual features, but in how these features are cohesively integrated to form a powerful, opinionated, yet highly adaptable system. It empowers traders to focus their creative energy on developing their core entry/exit signals, confident that the underlying framework will handle the complexities of risk management, trade execution, and external communication with precision and flexibility. It's a comprehensive solution designed to accelerate the development of robust and professional trading strategies.
How to Modify the Logic to Apply Your Strategy
The LuciTech Strategy Template is designed with modularity in mind, making it exceptionally straightforward to integrate your unique trading strategy logic. The template provides a clear separation between the core strategy management (risk, position sizing, exits) and the entry signal generation. This allows you to easily plug in your own buy and sell conditions without altering the robust underlying framework.
Here’s a step-by-step guide on how to adapt the template to your specific trading strategy:
1.
Locate the Strategy Logic Section:
Open the Pine Script editor in TradingView and navigate to the section clearly marked with the comment //Strategy Logic Example:. This is where the template’s placeholder entry conditions (a simple moving average crossover) are defined.
2.
Define Your Custom Entry Conditions:
Within this section, you will find variables such as longCondition and shortCondition. These are boolean variables that determine when a long or short trade should be initiated. Replace the existing example logic with your own custom buy and sell conditions. Your conditions can be based on any combination of indicators, price action patterns, candlestick formations, or other market analysis techniques. For example, if your strategy involves a combination of RSI and MACD, you would define longCondition as (rsi > 50 and macd_line > signal_line) and shortCondition as (rsi < 50 and macd_line < signal_line).
3.
Leverage the Template’s Built-in Features:
Once your longCondition and shortCondition are defined, the rest of the template automatically takes over. The integrated risk management module will calculate the appropriate position size based on your Risk % input and the chosen Stop Loss Type. The Risk:Reward ratio will determine your take-profit levels, and the Breakeven at R feature will manage your stop-loss dynamically. The time filter (Use Time Filter) will ensure your trades only occur within your specified hours, and the webhook alerts will notify you of trade executions.

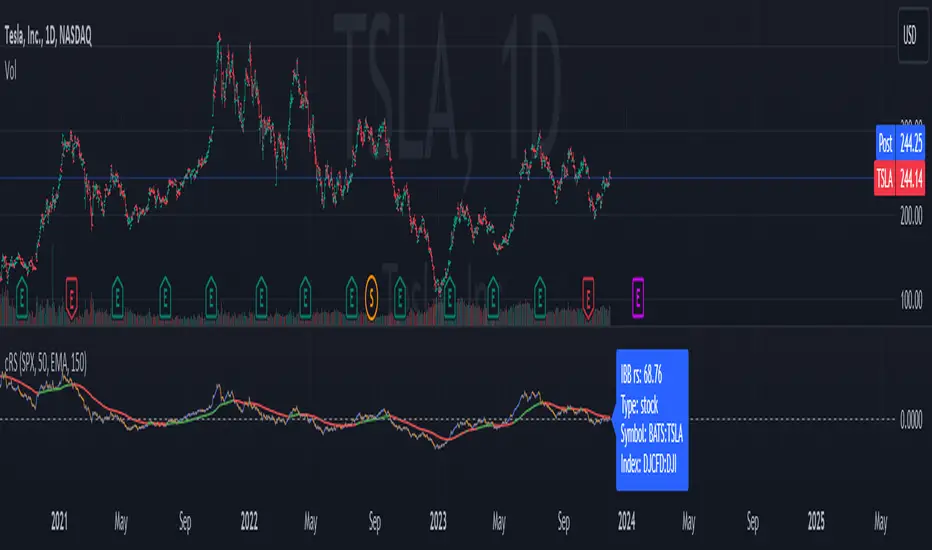
Comparative Relative Strength AutoselectComparative Relative Strength (CRS) is a relative momentum indicator, used to compare a security against an index, or against another security. The comparison is used to show the relative performance to each other.
This script is a Quality of Life improvement, which attempts to match the base symbol to its relevant index on the local stock exchange. Thus automagically selecting the best and most relevant comparative symbol.
Features:
*optional comparative symbol override, in case your favourite index is not included in this script, or you want to force it to function as as a traditional cRS script without the autoselect feature.
* optional moving average crossover line
* optional absolute momentum calculation, calculating the excess return of the basesymbol and comparativesymbol against its own simple moving average.
PpSignal The Ultimate Moving Average Crossover 2.0In this version we move out hauken ashi smoothed, bollinguer band and coral. in this version the script have Vidya MA yelloy red color, step ma, lime maroon color, VMA gren. solver and red color and ppsignal hilo trima ma, with different time frame.
If you work in time frame 5 min to 15 min we recommend use hilo trima or alma in 60 min time frame, if you use 30 min to 60 min en 240 min time frame, and d in weekly time frame.

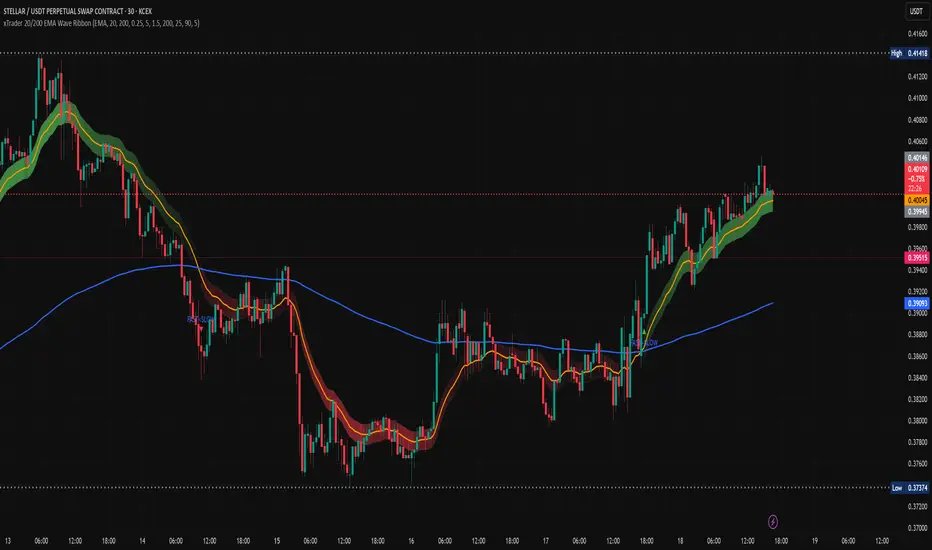
xTrader 20/200 EMA Wave Ribbon🔹 20/200 EMA Wave Ribbon
This indicator expands on the classic 20/200 moving average crossover by turning it into a momentum-aware ribbon. Instead of only showing where two lines cross, it highlights trend bias and momentum strength together in a visual form that adapts across timeframes.
🔑 How It Works
Fast / Slow MAs: Calculates a fast MA (default 20) and a slow MA (default 200). Traders can choose the MA type (EMA, SMA, WMA, RMA).
Bias: When the fast MA is above the slow MA, the ribbon turns 🟢 green (bullish). When it is below, the ribbon turns 🔴 red (bearish).
Wave Ribbon: A band is plotted around the fast MA. Its width comes from a user-defined percent of price, optionally scaled by ATR volatility so the ribbon stays meaningful on both 5m and 1D charts.
MACD-style intensity: Ribbon color adjusts with the separation between fast and slow MAs. Strong expansion makes the ribbon brighter and thicker; contraction makes it softer and thinner. This gives the same “growing and fading” feel traders know from MACD histograms.
Noise Control: Persistence settings can require several bars of agreement before a bias flip is confirmed, reducing whipsaws.
Signals: Optional markers and alerts trigger on bullish and bearish crosses.
📈 Practical Use
Bright, widening ribbon → trend is accelerating; continuation bias is strong.
Dimming ribbon → momentum is weakening; consider scaling out or tightening risk.
Color flip → regime change; possible entry/exit depending on confirmation settings.
Timeframe scaling → ensures ribbon width adapts to volatility, so interpretation is consistent across intraday and higher-timeframe charts.
⚡ What Makes It Different
Unlike open-source EMA cross scripts that only mark crosses:
✅ Plots a dynamic ribbon around the fast MA instead of shading the whole chart.
✅ Uses ATR-based auto-scaling to stay useful on all timeframes.
✅ Applies MACD-style intensity mapping to show not just bias, but trend strength and momentum shifts.
✅ Includes MA type selection (EMA, SMA, WMA, RMA) and persistence logic for confirmation.
⚠️ Disclaimer: This script is for educational and analytical purposes only. It is not financial advice. Always do your own research and use proper risk management before trading.
JeropasMG v17This bot uses a martingale strategy applied to simple moving average crossover signals.
When a buy or sell signal is generated, it opens a position with the configured base size.
If the trade is a loser, the bot increases the size of the next entry by multiplying it by the defined factor (for example, x2), repeating the process until the maximum number of steps allowed is reached.

AURA AI - Multi-Layer Signal System# AURA AI - Multi-Layer Signal System
## Originality and Value Proposition
This indicator implements a proprietary multi-layer signal filtering system designed specifically for educational trading analysis. The core value lies in three advanced algorithmic features developed to address common issues in market analysis:
1. **Adaptive Signal Spacing Algorithm**: Dynamically adjusts signal frequency based on real-time volatility calculations using custom ATR multipliers (0.7x to 1.8x)
2. **Hierarchical Signal Filtering**: Three-tier priority system with conflict prevention, cooldown periods, and cross-validation
3. **Progressive Educational Framework**: Contextual learning system with market concept explanations
## Technical Implementation
The system processes market data through multiple validation layers:
- **Primary Signals**: Multi-condition convergence requiring simultaneous confirmation from trend detection, directional strength analysis, momentum indicators, volume validation, and positioning filters
- **Trend Signals**: Direction-following analysis with moving average crossover confirmation and momentum validation
- **Reversal Signals**: Counter-trend opportunity detection with strict distance requirements and timeout filtering
## Algorithm Components and Processing
- **Adaptive Trend Detection**: Custom trailing stop methodology with configurable sensitivity parameters
- **Directional Strength Analysis**: Smoothed momentum indicators with threshold validation
- **Volume-Weighted Confirmation**: Market participation analysis using comparative volume metrics
- **Multi-Timeframe Validation**: Higher timeframe directional bias with hysteresis algorithms for stable detection
- **Custom Filtering Engine**: Proprietary noise reduction and signal prioritization algorithms
## Educational Framework Design
The indicator includes a comprehensive learning system addressing the gap between technical analysis tools and trader education:
- **Progressive Complexity**: Simplified interface for beginners transitioning to professional-grade controls
- **Contextual Explanations**: Real-time tooltips explaining market conditions and signal rationale
- **Risk Management Integration**: Built-in safeguards teaching proper trading practices
- **Signal Classification**: Clear categorization helping users understand different opportunity types
## Justification for Closed-Source Protection
This indicator warrants protection due to:
1. **Proprietary Filtering Algorithms**: Custom-developed signal prioritization and conflict resolution logic
2. **Adaptive Volatility System**: Original methodology for dynamic parameter adjustment
3. **Educational Integration**: Comprehensive learning framework with contextual market education
4. **Risk-Aware Design**: Built-in overtrading prevention and educational safeguards
The combination of these elements creates a unified analytical and educational system that goes beyond standard indicator combinations.
## Configuration and Usage
**Educational Mode**: Simplified interface focusing on high-probability setups with learning tooltips
**Professional Mode**: Full parameter control for experienced traders with advanced filtering options
Key settings include signal type selection, volatility adaptation parameters, multi-timeframe analysis, and day-of-week filtering for backtesting optimization.
## Market Application and Limitations
This system is designed for educational analysis across multiple markets and timeframes. The adaptive algorithms adjust to different volatility environments, though users should understand that no analytical tool can predict future market movements.
The indicator serves as an educational tool to help traders understand market dynamics while providing structured signal analysis. Proper risk management, position sizing, and market knowledge remain essential for successful trading.
## Important Disclosures
- This indicator provides educational analysis tools, not trading advice
- Past signal performance does not guarantee future results
- No claims are made regarding win rates or profitability
- Users must implement proper risk management practices
- Market conditions can change, affecting any analytical system's relevance

Matrix Trading Strategy**Matrix Trading Strategy** is a multi-signal framework designed to identify and exploit intraday trends with controlled precision. It combines three independent entry engines—Opening Range Breakout (ORB), Ultimate Trend via ATR trailing, and a moving average crossover (MA Cross)—which can operate alone or in any combination, offering traders maximum flexibility.
Risk management is fully parameterizable: position sizing by percent of equity, fixed cash amount, or fixed quantity; SL/TP in pips aligned to the instrument’s tick size (`pipSize`); automatic break-even; ATR-based trailing stop (with an option to anchor to the UT line itself); and configurable partial exits (TP1/TP2). Daily trade limits, entry cooldowns, and forced end-of-session liquidation enforce strict discipline.
Visually, the script plots EMAs, a 1-minute VWAP, ORB levels, the UT trailing line, and signal markers, and it colors candles by RSI for rapid momentum assessment. Ready-to-use alerts for ORB, UT, and MA signals support seamless automation via webhooks.
All together, Matrix Trading is a modular framework that adapts effortlessly to cryptocurrencies, metals, or global indices, delivering realistic executions and transparent metrics in both backtests and live trading.
stockexploderits just for identifying moving average crossover 20 and 50 to identify trend in stocks
easily without taking much time
Engulfing CandlesticksThe Engulfing Candlesticks indicator is a powerful tool for traders and investors to identify potential reversal patterns in financial markets. This indicator is based on the popular candlestick pattern recognition technique, which has been used for centuries to predict market trends and identify trading opportunities.
The Engulfing Candlesticks indicator specifically looks for two types of patterns: Bullish Engulfing and Bearish Engulfing. A Bullish Engulfing pattern occurs when a small bearish candle is followed by a larger bullish candle that completely engulfs the previous candle, indicating a potential reversal from a downtrend to an uptrend. On the other hand, a Bearish Engulfing pattern occurs when a small bullish candle is followed by a larger bearish candle that completely engulfs the previous candle, indicating a potential reversal from an uptrend to a downtrend.
The Engulfing Candlesticks indicator is designed to be easy to use and understand, even for traders who are new to candlestick pattern recognition. The indicator plots a yellow color for Bullish Engulfing patterns and a purple color for Bearish Engulfing patterns, making it easy to visualize and identify potential trading opportunities.
One of the key benefits of the Engulfing Candlesticks indicator is its ability to identify potential reversal patterns early, allowing traders to enter trades at the beginning of a new trend. This can be especially useful in markets that are highly volatile or subject to sudden changes in direction.
In addition to its ability to identify reversal patterns, the Engulfing Candlesticks indicator can also be used as a confirmation tool for other trading strategies. For example, a trader who is using a moving average crossover strategy may use the Engulfing Candlesticks indicator to confirm the validity of the signal.
The Engulfing Candlesticks indicator is also highly customizable, allowing traders to adjust the sensitivity of the indicator to suit their individual trading style. This can be especially useful for traders who are looking to trade in specific market conditions, such as during times of high volatility or in markets with low liquidity.
Overall, the Engulfing Candlesticks indicator is a powerful tool for traders and investors who are looking to identify potential reversal patterns and trading opportunities in financial markets. Its ease of use, customization options, and ability to identify early reversal patterns make it a valuable addition to any trading strategy.
Here are the settings for the Engulfing Candlesticks indicator:
Length: This setting determines the number of bars used to calculate the engulfing pattern. A higher value will result in more precise signals, but may also reduce the number of signals generated.
Color 0: This setting determines the color used for Bullish Engulfing patterns.
Color 1: This setting determines the color used for Bearish Engulfing patterns.
Bar Color: This setting determines whether the indicator will color the bars based on the engulfing pattern.
Alerts: This setting determines whether the indicator will generate alerts when an engulfing pattern is detected.
Note: These settings may vary depending on the specific trading platform or software being used.

Supply and DemandThis is a "Supply and Demand" script designed to help traders spot potential levels of supply (resistance) and demand (support) in the market by identifying pivot points from past price action.
Differences from Other Scripts:
Unlike many pivot point scripts, this one offers a greater degree of customization and flexibility, allowing users to determine how many ranges of pivot points they wish to plot (up to 10), as well as the number of the most recent ranges to display.
Furthermore, it allows users to restrict the plotting of pivot points to specific timeframes (15 minutes, 30 minutes, 1 hour, 4 hours, and daily) using a toggle input. This is useful for traders who wish to focus on these popular trading timeframes.
This script also uses the color.new function for a more transparent plotting, which is not commonly used in many scripts.
How to Use:
The script provides two user inputs:
"Number of Ranges to Plot (1-10)": This determines how many 10-bar ranges of pivot points the script will calculate and potentially plot.
"Number of Last Ranges to Show (1-?)": This determines how many of the most recent ranges will be displayed on the chart.
"Limit to specific timeframes?": This is a toggle switch. When turned on, the script only plots pivot points if the current timeframe is one of the following: 15 minutes, 30 minutes, 1 hour, 4 hours, or daily.
The pivot points are plotted as circles on the chart, with pivot highs in red and pivot lows in green. The transparency level of these plots can be adjusted in the script.
Market and Conditions:
This script is versatile and can be used in any market, including Forex, commodities, indices, or cryptocurrencies. It's best used in trending markets where supply and demand levels are more likely to be respected. However, like all technical analysis tools, it's not foolproof and should be used in conjunction with other indicators and analysis techniques to confirm signals and manage risk.
A technical analyst, or technician, uses chart patterns and indicators to predict future price movements. The "Supply and Demand" script in question can be an invaluable tool for a technical analyst for the following reasons:
Identifying Support and Resistance Levels : The pivot points plotted by this script can act as potential levels of support and resistance. When the price of an asset approaches these pivot points, it might bounce back (in case of support) or retreat (in case of resistance). These levels can be used to set stop-loss and take-profit points.
Timeframe Analysis : The ability to limit the plotting of pivot points to specific timeframes is useful for multiple timeframe analysis. For instance, a trader might use a longer timeframe to determine the overall trend and a shorter one to decide the optimal entry and exit points.
Customization : The user inputs provided by the script allow a technician to customize the ranges of pivot points according to their unique trading strategy. They can choose the number of ranges to plot and the number of the most recent ranges to display on the chart.
Confirmation of Other Indicators : If a pivot point coincides with a signal from another indicator (for instance, a moving average crossover or a relative strength index (RSI) divergence), it could provide further confirmation of that signal, increasing the chances of a successful trade.
Transparency in Plots : The use of the color.new function allows for more transparent plotting. This feature can prevent the chart from becoming too cluttered when multiple ranges of pivot points are plotted, making it easier for the analyst to interpret the data.
In summary, this script can be used by a technical analyst to pinpoint potential trading opportunities, validate signals from other indicators, and customize the display of pivot points to suit their individual trading style and strategy. Always remember, however, that no single indicator should be used in isolation, and effective risk management strategies should always be employed.

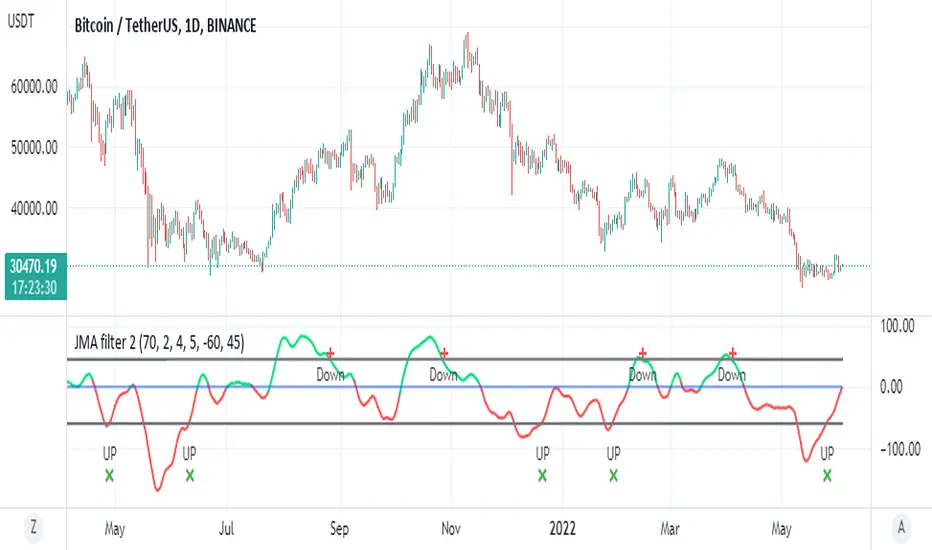
JMA filter 2This is based on ChuckBanger Juric indicator (a modification of it)
things you need to know how to work with this one
to control the wave setting you need to adjust the length , slow ,fast and c in menu for optimal result
positive trend is above zero in green
negative trend bellow zero red
the best part herein this indicator is to finding of high and low based on lower treshold =trel
higher threshold for high =treh
there is signals once it crossed up or down
for each time frame you need to set the threshold for optimal results as it change for each TF it will be different so be careful about it
so rule of thumb is to look for the previous peaks either up or down and to set the threshold according to it
it more sensitive then RSI to my opinion and very good to detect sweet spot either for sell or buy
one can add alerts (not included)
or modify it to make it better
here on Tesla
TICK strategy for SPY optionsImportant notes:
1. This strategy is designed for same day SPY option scalping. All profit shown in back testing report is based on Profit/Loss (P/L) estimates from trading options with approximately 6 months of data. By default, it is set to 10 option contracts. By default the initial capital is set to $5000. Pyramiding is set to 3.
2. This strategy works better with non-extended market data.
3. This strategy is mainly developed for SPY trading on 5 min chart, it probably will not be very profitable with other tickers or time frame without tweaking all the parameters first.
4. This strategy will work with QQQ as well, but please adjust the profit multiplier to match the P/L of QQQ options.
How it works:
When trading the indices, many rely on the TICK for market directions. This strategy is a trend following strategy that uses a combination of conditions using the following indicators:
- TICK
- RSI
- VIX volatility index
- EMA
For entries, the conditions are:
1. TICK moving average crossover with a delayed signal line
2. Bullish or bearish RSI signal, RSI > 50 for bullish, < 50 for bearish
3. VIX must be above a certain threshold to take advantage of high market volatility
4. Price must be on top of EMA line for long, and below for short
For exits, there are 3 scenarios:
1. Stop loss set by a percentage of the daily ATR value
2. Trend changes on the TICK and the RSI
3. Bearish or bullish divergence on price with TICK
This strategy automatically signal to close all trades at 3:50 pm EST at the end of the day.
Extras:
- There is an option to show P/L for reinvesting profits
Enjoy~!!! Let's all make $$$

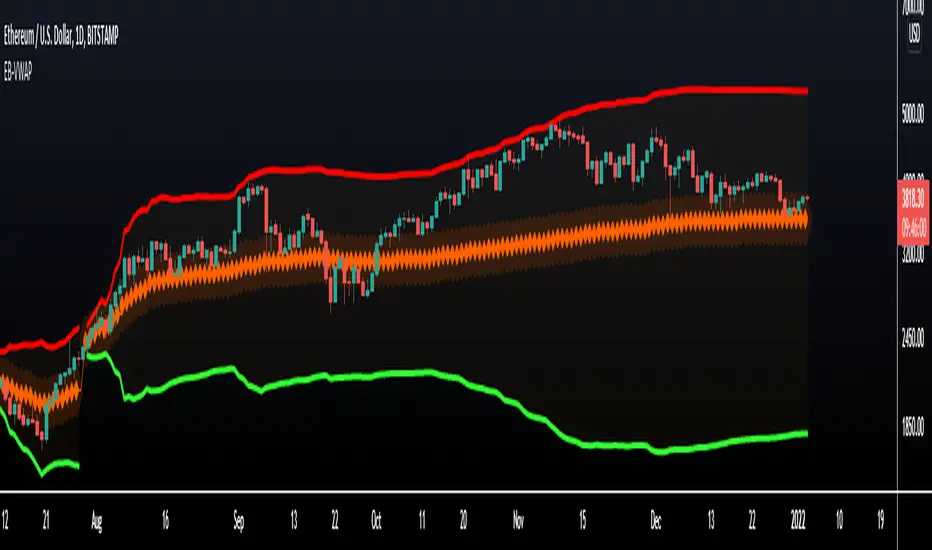
VWAP Bands - Event Based [LuxAlgo]This indicator returns VWAP bands with a degree of smoothness resetting based on various user-selected events. The bands are constructed using a VWAP based naive standard deviation.
The indicator can be anchored or start from the first bar and can be used as trailing support/resistance, in a moving average crossover system, or as source for external indicators.
Settings
Start: VWAP anchor point
Start At First Bar: Display the VWAP from the first bar instead of a specified anchor point
VWAP
Length: Controls certain characteristics of the user-selected event
Mult: Multiplicative factor for the VWAP standard deviation
Source: Price source of the indicator
Event
Event: Determines the event resetting the degree of smoothness of the VWAP
External Cross/Event: Input source used for external crosses/events
Further details about the available events are given below.
Details
Various event conditions are available to the users. When the selected event occurs, the VWAP equals the current closing price.
By default, the event is periodic, that is the VWAP resets periodically, with a period determined by the Length setting.
The Higher High event resets the VWAP when a new higher high occurs.
The Lower Low event resets the VWAP when a new lower low occurs.
The Trend Change event is similar however resets the VWAP only once a higher high or lower low occurs. Higher highs and lower lows are given by Donchian channels with a period determined by the Length setting.
The Start event reset the VWAP at the selected anchor point (or first bar if the "Start At First Bar" setting is selected). This can be useful if one only needs a regular anchored VWAP band indicator.
The External Cross event resets the VWAP when the Source price crosses the series selected in the External Cross/Event setting. In the image above the VWAP resets when the price crosses the volatility stop indicator.
The External Event resets the indicator when a series selected in the External Cross/Event setting is not equal to 0. This allows using a custom event in order to reset the VWAP. In the above example the VWAP is reset during a new session due to the External Session indicator.
KSR Strategyself input Moving Average crossover with trend indicator which eliminates most of false signal
