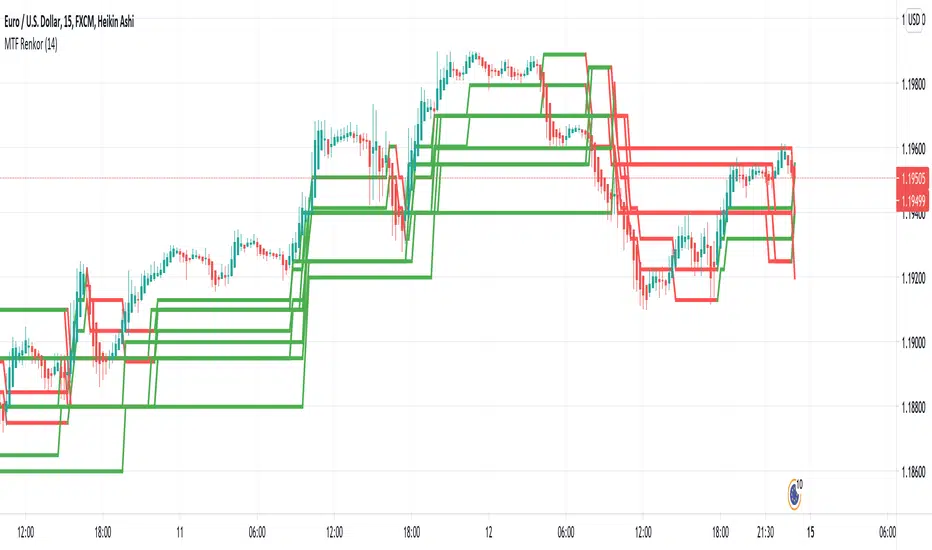
MTF RenkoThis indicator Should be opened on a 15 min chart
It will display the Renko Highs and lows of:
30 min chart
45 min chart
60 min chart
and
120 min chart
Поиск скриптов по запросу "mtf"
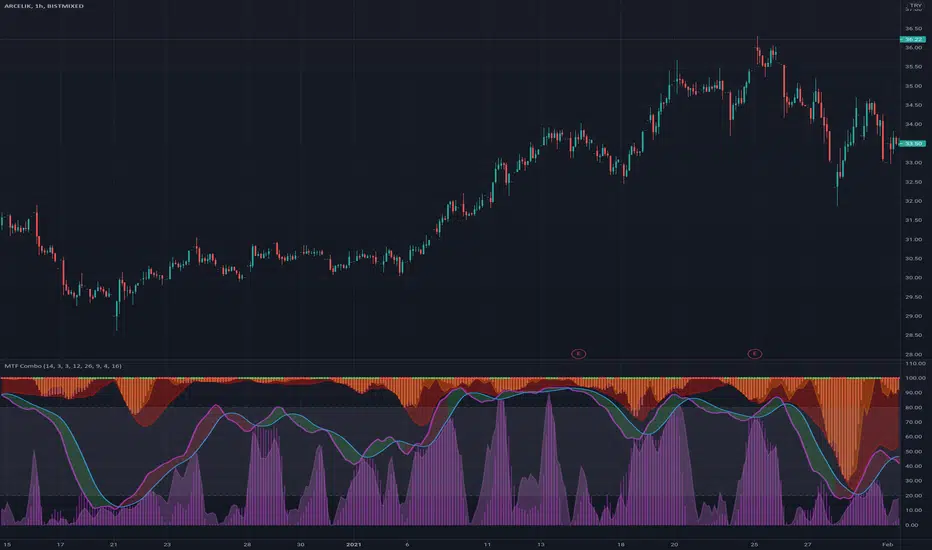
MTF ComboMiddle stochastic is the HTF stochastic of price. The color coding indicates the trend in even higher timeframe.
- The graph on top is the stochastic of ATR (with HTF and current one with RSI and macd histogram).
- The green graph at the bottom is the stochastic of the OBV (with HTF and current one with RSI and macd histogram).
- Purple histogram and area underneath the mid-stochsatic are the macd histogram and the stochastic RSI.
- The dots in the middle are determined by the combined score of all
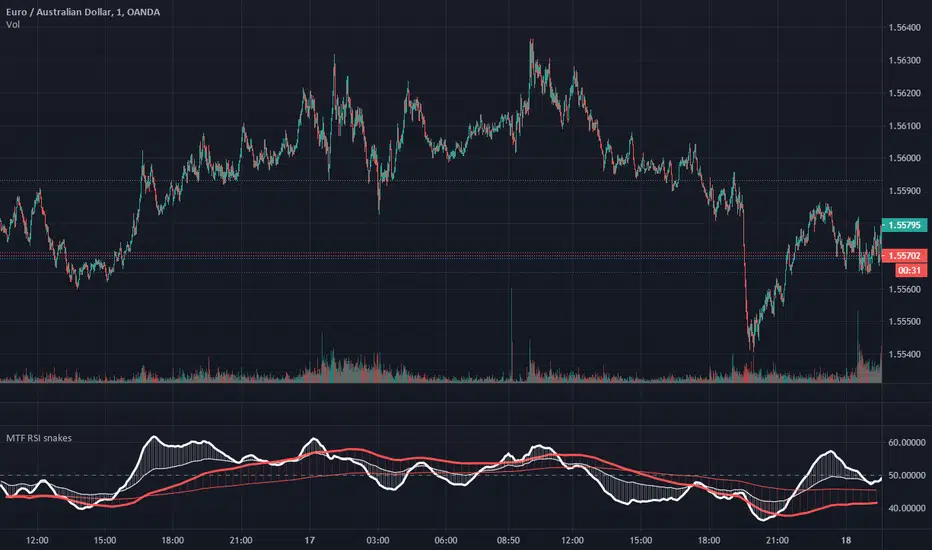
MTF RSI EMA snakesThis simple script plots 2 moving averages of RSI at 2 selected timeframes.
Setting each set of moving averages to a higher timeframe allows for monitoring of momentum at that time frame, and comparison of momentum across timeframes.
Crossovers of the respective averages of different time frames can be used as trade signals.
Having the leading average above the slower average on both timeframes can be an effective trend filter.
MTF Ichimoku Signal [Takazudo]A multi timeframe Ichimoku Signal indicator. This indicator shows the status of each Ichimoku Signals.
1. TK-Cross
Tenkan-Sen & Kijun-Sen cross status
2. Future Kumo
The newest Kumo color
3. Kumo & Current Relation
The relation between current price & Kumo.
4. Kumo & Chikou-Span Relation
The relation between Kumo & Chikou-Span.
5. Chikou-Span & Candle Cross
Chikou-Span & Candle cross status

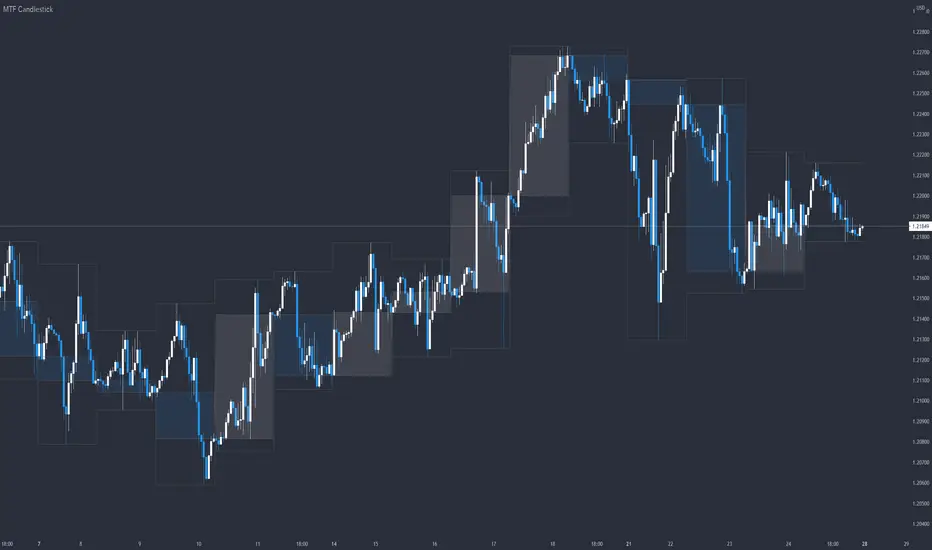
MTF CandlestickOne of the most important thing to understand in order to estimate the trend direction and its continuation is how the lower time frame candlesticks have been formed.
There are many processes by which candlesticks have been formed even if same size.
So in this script, daily candlestick is overlapped on the currently chart as default, and that can be changed.
Only real body is shown so as not to interfere with the currently chart.

MTF EMA 3Set(Multi Time Frame Exponential Moving Averages 3 Set)Multi Time Frame Exponential Moving Averages 3 Set
One indicator displays the three types of moving averages of the top bar.
It can be used for environment recognition.
It is easy to repel when the 4 hour foot and the pivot overlap.
MTF Stochastic with automatic divergenceThis is a stochastic indicator that show the stochastic in your current timeframe and also the stochastic from the timeframe above (if current is 15 mins - the above is 1 hour etc). When the 2 stochastics align the background colour highlights to emphasise that. The idea being that you have your current stochastic pushing down improving your change of a successful entry and the stochastic from above pushing down showing there is momentum in that direction.
In addition, the indicator will show when positive and negative divergence occurs on the current timeframe. Divergence can be a little subjective but it seems to find the important ones.
Finally, it highlights when the current stochastic crosses. I was finding once you squash it down it gets difficult to see so I made that easier.
For me I don't tend to use the divergence feature (which is ironic as i found it very hard to code) but being able to see what is happening on the timeframe above is a very effective filter saving me from bad trades.
The script is a little scruffy in places but neat enough to adapt to other indicators. Somewhere I have the same principle for MACD - one of these days I'll find it and make it available.
Hope thats useful to people and good luck.

MTF Anchored VWAPAnchored VWAP is all the rage, but it's just one indicator. That being said, it seems like people want to add more than one at a time so why eat into your indicator cap. This script will allow you to configure 5 AVWAPS at a time.
This will not plot if the time chosen is not in market hour s. Note: market hours may be outside of YOUR timeframe. i.e, the market may open at 7:30 your time, but it will not plot until you change it to 9:30.
Enjoy

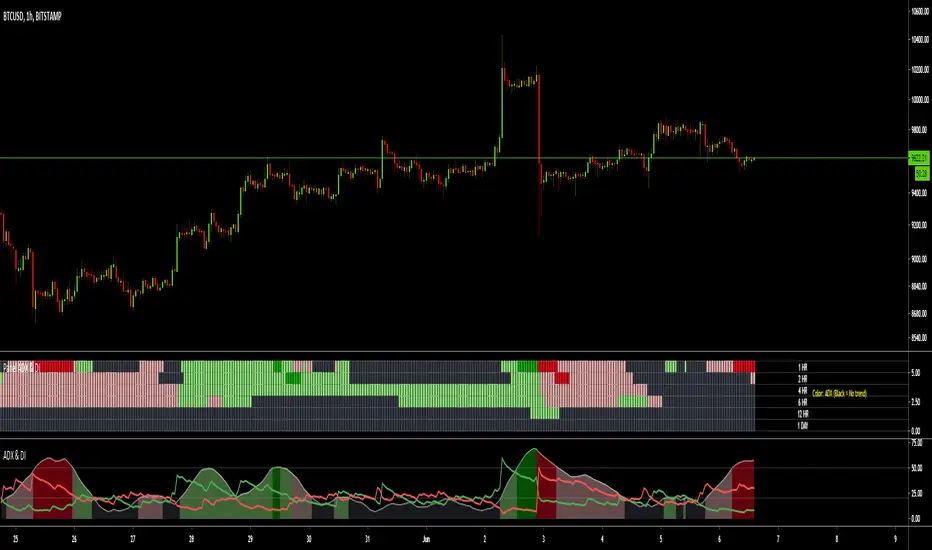
MTF ADX & DI - Monitoring PanelMonitoring panel showing the ADX (Average Directional Index) & DMI (Directional Movement Index) as color code for 6 different timeframes.
This gives a very easy overview on the current state of the market and if it is trending.
- ADX basically describes the strength of a Trend
- DMI give indication on the direction of the trend, usually shown as +DI and -DI
Meanings of the Colors:
ADX is below Low Threshold (no trend) : Black
ADX is above Low Threshold and DI is positive (weak bullish trend) : Light Green
ADX is above High Threshold and DI is positive (strong bullish trend) : Dark Green
ADX is above Low Threshold and DI is negative (weak bearish trend) : Light Red
ADX is above High Threshold and DI is negative (strong bearish trend) : Dark Red
- Low Threshold (default = 20) and High Threshold (default = 50) can be changed in the settings
- Timeframes can be changed, but the description labels are currently hardcoded - if you want to change it, just copy the script and change them
- Currently there are two additional timeframes commented in the code - if you want to use them, just copy the script and uncomment them
Have fun and as always I am open for constructive feedback.
Cheers!
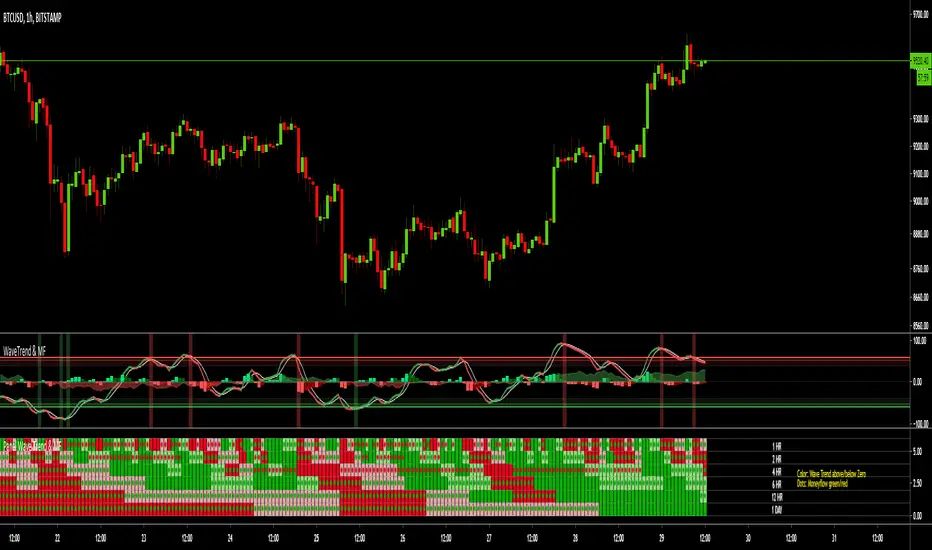
MTF Wave Trend & Money Flow - Monitoring PanelAnother indicator based on the famous "Wave Trend Oscillator" by LazyBear.
Monitoring panel showing the Wave Trend as color for 6 different timeframes. Additionaly the Money Flow (positive or negative) is indicated as green or red dots.
I find it helpful that with one glance the current Wave Trend and Money Flow on many timeframes is visible.
(Timeframes can be changed, but the description labels are currently hardcoded - if you want to change it, just copy the script and change them)
Meanings of the Colors:
WT above Zero and rising : Dark Green
WT above Zero and declining : Light Green
WT below Zero and declining : Dark Red
WT below Zero and rising : Light Red
Money flow positive : Green dot
Monet flow negative : Red dot
(Currently there are two additional timeframes commented in the code - if you want to use them, just copy the script and uncomment them)
Have fun and as always I am open for constructive feedback.
Cheers!
MTF Wave Trend CrossThis indicator is based on the famous "Wave Trend Oscillator" by LazyBear.
I have noticed that the Wave Trend Crosses (not the waves themselves) give a pretty good indication on the current status of the market (above Zero = bullish / below Zero = bearish ).
This new indicator is a Multi TF Version of this where it is possible to define 4 fixed Higher Time Frames and 4 fixed Lower Time Frames.
The results are then plotted above (higher TF) and below (lower TF) of the result of the current TF. (Offset can be flexibly changed in the settings)
This allows to judge the trend based on the various TFs.
Basically the greener it looks, the more bullish the situation is at the moment. More red color indicates a more bearish situation.
Enjoy.

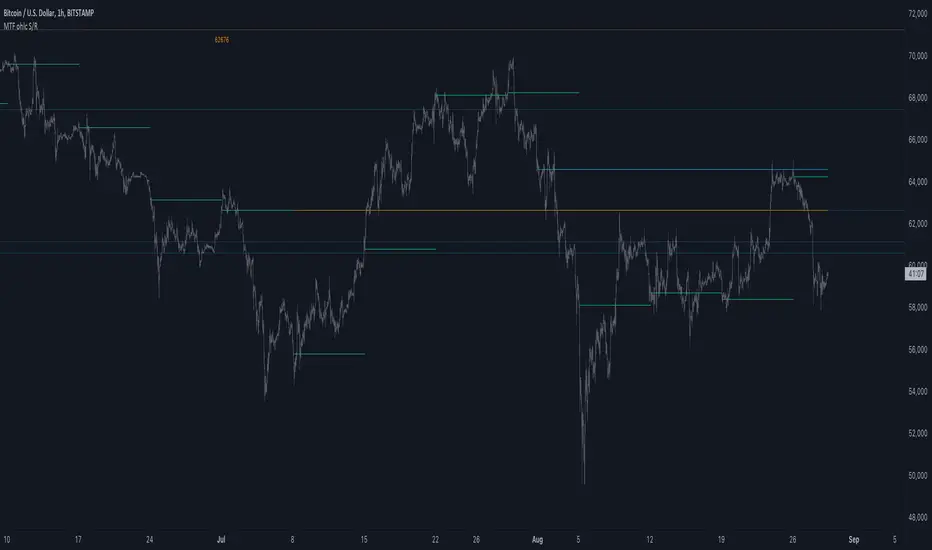
MTF ohlc S/RA very simple idea, a close (or high, low, ohlc4 or open) from a higher Time Frame
will give future Support/Resistance area's
In this example of BTC/USD we see:
- Yearly close 2017 gave Resistance in June 2019
- Yearly close 2018 gave Support in March 2020
We are now pushing to the Resistance of Yearly close 2019...
Since there is a limit for the amount of lines (since it is just too much if everything is plotted)
there are different options:
- 4 different Time Frames, each can be enabled/disabled,
- TF can be chosen,
- source can be changed (close, open, high, low, ohlc4)
- Period can be changed, for example TF Month:
You can choose just to show a particular year, Month,...
You also can choose between which prices you want to see lines,
for example Monthly close, since the beginning till now, but only between $6000 - $8000:
This helps to know the closest S/R around the present price
Other example:
- Lines can be extended to the right, or not
- Labels can be enabled/disabled:
- Linewidth and brightness of the line can be changed, also the style (solid, dashed or dotted line)
Default only 2 very high TF's are enabled (3 Month = one quarter, and 1 Year)
The 3 Month has a dotted line, which helps distinguish the line against the yearly line
- Prices above 1000 are rounded since it seems distracting to see for example 6478,878654,
seems better just to see 6479, prices below 1000 are just seen as intended
Have fun!
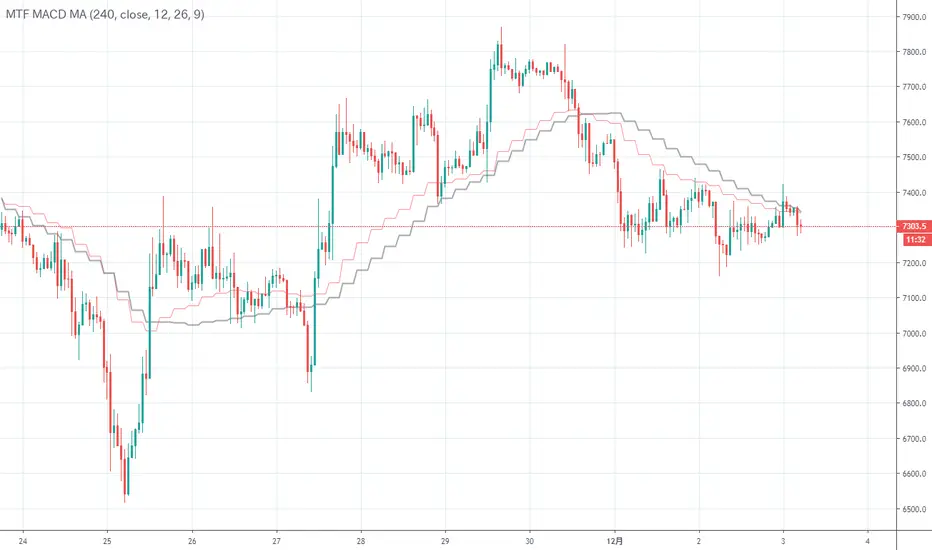
MTF MACD MAI calculated MACD backward and wrote it on the main chart.
The signal line on the upper leg looks good
MACDを逆算してメインチャートに書いてみました。
上位足のシグナルラインが良い感じですね
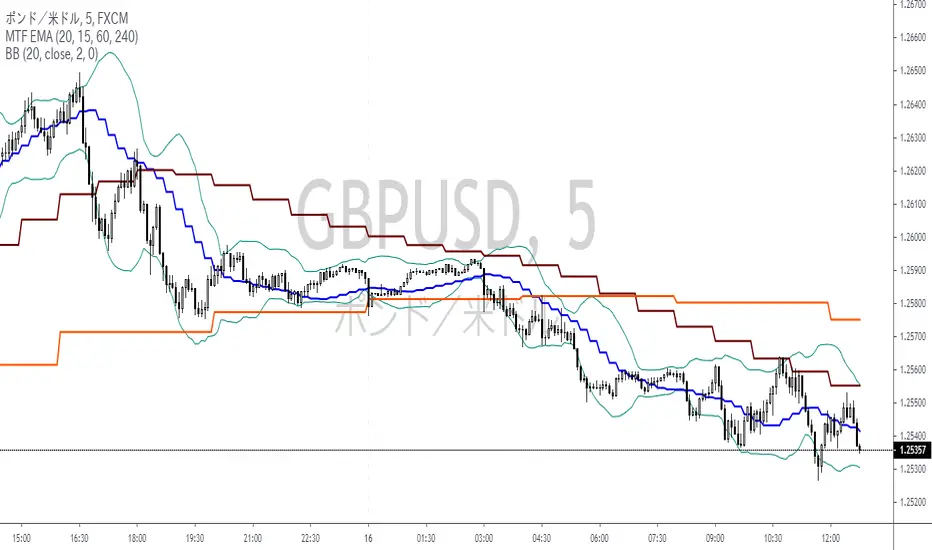
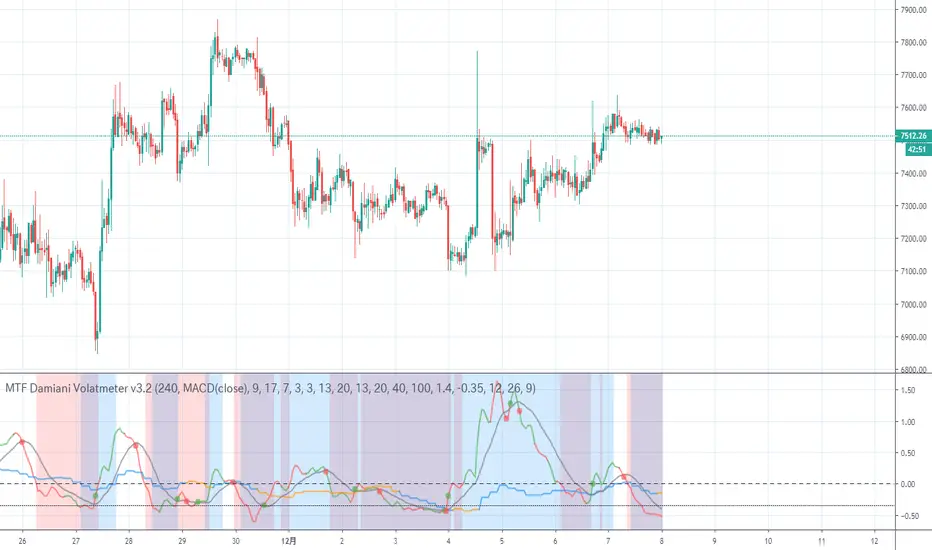
MTF Damiani Volatmeter v3.2Damiani_volatmeter.mq4 v3.2 |
Copyright © 2006,2007 Luis Guilherme Damiani |
It is a transplant of an indicator to judge the range market price.
The original is judged by the two curves, but this indicator shows the difference between the two curves.
If it is 0 or less, it can be judged as a range.
The red and green lines show the strength of this hourly trend, and if the range is below zero, the background is painted red.
The blue and orange lines indicate the strength of the trend of the upper leg, and if the market price is below zero, the background is painted blue.
I think that the background color will be purple if the market price is both strong and below zero.
レンジ相場を判定するインジケーターを移植したものです。
本来のものは2本の曲線で判断するのですが、このインジケーターでは2本の曲線の差を表示しています。
0以下ならレンジと判定できます。
赤と緑の線はこの時間足のトレンドの強さを示し、ゼロ以下のレンジ相場なら、背景を赤く塗っています。
青とオレンジ色の線は上位足のトレンドの強さを示し、ゼロ以下のレンジ相場なら、背景を青く塗っています。
両方ゼロ以下の強いレンジ相場なら背景色が紫色のなると思います。
MTF CMO (Chande Momentum Oscillator)Simple Multi-Timeframe version of the Chande Momentum Oscillator . Many thanks to HPotter whos script I used as a starting point. This displays 1, 2, 3, 4, and 24 period CMOs on the graph. 1, 2, 3, and 4 periods are smoothed by using their simple moving averages. 24 period is unsmoothed. I prefer to set my chart to a 1 hour timeframe and look for bottoming or topping patterns in the momentum. Strongest topping or bottoming patterns are when all timeframes roll over including the 24 period.


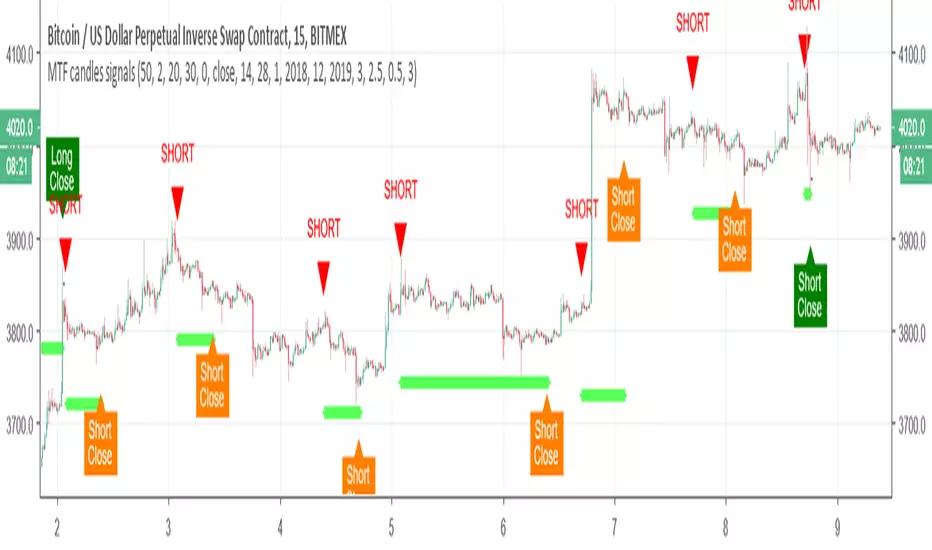
MTF candles by yatrader2 signalsthis is the signal version of this study
alerts included
for more detail look at original study
MTF SMAThis script overcomes the issues with TV multitimeframe being wrong due to its bugs. It generates higher timeframe SMA on a lower timeframe chart. Enter the number of minutes of the higher timeframe as a setting.
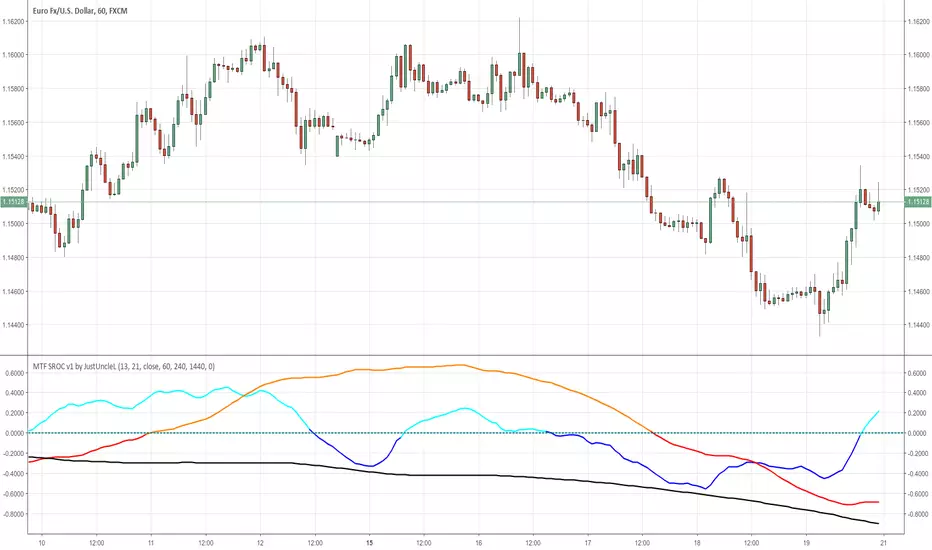
MTF SROC v1 by JustUncleLDescription:
This study plots Smoothed Rate of Change (SROC) indicators for up to 4 different time frames. The indicator does not use higher time frame data, so will not re-paint. The SROC is a momentum indicator and can be used in ranging or trending markets, please refer to the reference for further details of how to use the indicators.
References:
www.incrediblecharts.com

MTF MAA multi timeframe version of the SMA.
You can select one of the proposed timeframes in the input box or you can modify the code at line 5 :
>>>
>>> tf = input("D", title = "TimeFrame", type = resolution)
>>>
Change the D by your desired timeframe => 1, 7, 555 (minutes up to 1440) => D, 2D... => W, 2W... => M, 2M....
