Reversal Score System v3 [Rulph]RSS3 - Reversal Score System v3
RSS3 is a multi-component reversal detection system that quantifies momentum exhaustion and trend weakness through a normalized Score from -1 (maximum bullish pressure) to +1 (maximum bearish pressure). It is designed to work across crypto, stocks, forex and futures, from intraday to 4H/D timeframes.
A full article with real trade examples (BTC, NVDA, GBP/USD, E-mini S&P) is available here:
How to Make 18% in a Week: RSS3 Reversal Trading Across 4 Markets
━━━━━━━━━━━━━━━━━━━━━━━━━━━━━━━━━━
CORE COMPONENTS
━━━━━━━━━━━━━━━━━━━━━━━━━━━━━━━━━━
1. Volatility Pressure Index (VPI)
VPI measures market stress using a composite of:
• RSI deviation from the neutral 50 level (directional momentum bias)
• Annualized volatility (VIX-style) to detect volatility expansion
• Normalized candle range vs recent history
• Price position relative to Bollinger Bands (statistical extension)
These inputs are weighted and normalized into a single pressure reading:
• High VPI → overbought stress zone
• Low VPI → oversold compression zone
Concept: VPI answers " Is the market stretched beyond sustainable levels? "
Example: BTC 15m bearish with high VPI before the drop
2. Trend Direction Force Index (TDFI)
TDFI measures directional trend strength using:
• Spread between a fast MMA and a slower SMMA (trend acceleration/deceleration)
• Average impulse between the two MAs (momentum persistence)
• Normalized trend strength with a weighting scheme
• Positive TDFI → bullish directional pressure
• Negative TDFI → bearish directional pressure
• Extreme values (> 0.7 or < -0.7) highlight overextended trends
Concept: TDFI answers " How strong is the current directional move, and is it overextended? "
Example: ES 4H showing strong TDFI before reversal
3. Final Score
The final Score combines VPI and TDFI with divergence bonuses:
Score = (VPI_weight × VPI) + (TDFI_weight × TDFI) - Bull_Div_Bonus + Bear_Div_Bonus
Key ideas:
• VPI and TDFI are first normalized, then combined
• Divergences modulate Score via bonuses/penalties
• Recent and stronger divergences have more influence (decaying over time)
This produces a single, continuous measure of reversal pressure from -1 to +1.
Example: Score swinging from extreme bearish to extreme bullish zones
━━━━━━━━━━━━━━━━━━━━━━━━━━━━━━━━━━
DIVERGENCES AND SEQUENTIAL LABELS
━━━━━━━━━━━━━━━━━━━━━━━━━━━━━━━━━━
RSS3 automatically detects classic divergences separately for VPI and TDFI:
• Bullish divergence: price makes a lower low, indicator makes a higher low
• Bearish divergence: price makes a higher high, indicator makes a lower high
Each divergence is tracked for:
• VPI (v-series)
• TDFI (t-series)
Sequential labeling:
• v1, v2, v3... = 1st, 2nd, 3rd VPI divergence in the current direction
• t1, t2, t3... = 1st, 2nd, 3rd TDFI divergence in the current direction
• v2t1 = double divergence (2nd VPI + 1st TDFI on the same pivot)
The sequence resets when direction changes (bullish → bearish or vice versa).
This allows you to distinguish:
• early warnings (v1/t1)
• reinforced late-stage signals (v3, v4, …)
• strong confluence (vXtY double divergences)
Example: Sequential v/t labels building up before a major reversal
━━━━━━━━━━━━━━━━━━━━━━━━━━━━━━━━━━
MULTI‑TIMEFRAME FILTER (MTF)
━━━━━━━━━━━━━━━━━━━━━━━━━━━━━━━━━━
The MTF filter uses a higher timeframe to control counter-trend entries:
Modes:
• Off – no filtering
• Reduce – divergence bonus is reduced when signal is against HTF trend
• Block – counter-trend divergences are completely hidden
Use cases:
• On intraday charts, use 4H/D as HTF to avoid shorting strong uptrends
• On 4H, use Daily/Weekly as HTF context for swing trades
This protects capital by avoiding low-probability mean-reversion attempts in strong trends.
Example: BTC 1h counter-trend signals filtered by MTF (grayed out)
━━━━━━━━━━━━━━━━━━━━━━━━━━━━━━━━━━
HOW TO USE RSS3
━━━━━━━━━━━━━━━━━━━━━━━━━━━━━━━━━━
Typical entry logic:
1. Wait for a divergence (green = bullish, red = bearish)
2. Check Score:
• |Score| > 0.5 → stronger, higher-confidence signal
• Score near ±1.0 → extreme exhaustion zone
3. Optionally wait +2 bars after divergence to confirm the pivot
Typical exits:
• Conservative: opposite divergence appears
• More aggressive: Score crosses through 0 or reaches the opposite ±0.5 zone
• Always combine with a volatility-based stop (e.g., 2–3 × ATR)
Recommended timeframes:
• 5–15m: active intraday/swing setups
• 1–4h: swing trading
• D/W: position trading
RSS3 is not a complete trading strategy. It is an advanced reversal and exhaustion engine intended to be combined with:
• support/resistance
• volume/flow tools
• existing trend or breakout systems
━━━━━━━━━━━━━━━━━━━━━━━━━━━━━━━━━━
WHAT MAKES RSS3 ORIGINAL
━━━━━━━━━━━━━━━━━━━━━━━━━━━━━━━━━━
RSS3 is not a simple mashup of standard indicators. It introduces:
• Composite volatility index (VPI) combining RSI deviation, volatility, range and Bollinger position
• Composite trend force index (TDFI) based on MA spread and impulse
• Unified Score from -1 to +1 for reversal strength
• Decay-weighted divergence bonuses with amplitude sensitivity
• Dual-source divergences (VPI + TDFI) with sequential v/t labeling
• MTF-aware filtering that can reduce or block counter-trend signals
Real trade examples and detailed commentary:
English article with 4 markets
Disclaimer: All trading involves risk. This tool does not guarantee profits. Always backtest and manage risk according to your rules.
-----------------------------------------------------------------------------------------------------------
RSS3 - Reversal Score System v3 (Система оценки разворотов)
RSS3 — это многокомпонентная система поиска разворотов, которая количественно оценивает истощение импульса и ослабление тренда через нормализованный Score от -1 (максимальное бычье давление) до +1 (максимальное медвежье давление). Индикатор рассчитан на работу с криптовалютами, акциями, форексом и фьючерсами на разных таймфреймах — от интрадей до 4H/D.
Подробная статья с реальными примерами сделок на NVTK, BTCUSDT и CNY/RUB доступна здесь:
Как заработать 18% за неделю на разворотах: система RSS3
━━━━━━━━━━━━━━━━━━━━━━━━━━━━━━━━━━
КЛЮЧЕВЫЕ КОМПОНЕНТЫ
━━━━━━━━━━━━━━━━━━━━━━━━━━━━━━━━━━
1. Volatility Pressure Index (VPI)
VPI измеряет "напряжение" рынка через комбинацию:
• отклонения RSI от нейтрального уровня 50 (направленный моментум)
• годовой волатильности (по типу VIX) — фиксирует расширение волатильности
• нормализованного диапазона свечей относительно недавней истории
• положения цены относительно полос Боллинджера (статистическое перерастяжение)
Все компоненты взвешиваются и нормализуются в единый индекс давления:
• высокий VPI → зона перекупленности и стресса
• низкий VPI → зона перепроданности и сжатия
Идея: VPI отвечает на вопрос " насколько рынок перерастянут относительно нормального состояния? ".
Пример: NVTK 1H — медвежья дивергенция VPI перед падением
2. Trend Direction Force Index (TDFI)
TDFI оценивает силу направленного движения через:
• расхождение между быстрой MMA и более медленной SMMA (ускорение/замедление тренда)
• средний импульс между двумя скользящими (устойчивость импульса)
• нормализованную силу тренда с весовой схемой
• положительный TDFI → бычье направленное давление
• отрицательный TDFI → медвежье направленное давление
• экстремальные значения (> 0.7 или < -0.7) показывают чрезмерно растянутый тренд
Идея: TDFI отвечает на вопрос " насколько силён текущий тренд и не заходит ли он слишком далеко? ".
Пример: NVTK 1h — сильный TDFI
3. Финальный Score
Финальный Score объединяет VPI и TDFI с учётом бонусов за дивергенции:
Score = (VPI_weight × VPI) + (TDFI_weight × TDFI) - Bull_Div_Bonus + Bear_Div_Bonus
Основные идеи:
• VPI и TDFI предварительно нормализуются
• дивергенции корректируют Score через бонусы/штрафы
• более свежие и сильные дивергенции дают больший вклад (с затуханием во времени)
Результат — единый непрерывный индикатор давления на разворот в диапазоне от -1 до +1.
Пример: BTCUSDT 2H — переход Score из медвежьей зоны в бычью
━━━━━━━━━━━━━━━━━━━━━━━━━━━━━━━━━━
ДИВЕРГЕНЦИИ И ПОСЛЕДОВАТЕЛЬНЫЕ МЕТКИ v/t
━━━━━━━━━━━━━━━━━━━━━━━━━━━━━━━━━━
RSS3 автоматически определяет классические дивергенции отдельно для VPI и TDFI:
• бычья дивергенция — цена делает более низкий минимум, индикатор — более высокий минимум
• медвежья дивергенция — цена делает более высокий максимум, индикатор — более низкий максимум
Для каждой дивергенции ведутся отдельные счётчики:
• для VPI — последовательность v1, v2, v3…
• для TDFI — последовательность t1, t2, t3…
Примеры маркировки:
• v1 — первая дивергенция VPI в текущем направлении
• t2 — вторая дивергенция TDFI
• v2t1 — двойная дивергенция (2‑я VPI + 1‑я TDFI на одном пивоте)
Счётчики сбрасываются при смене направления (бычья → медвежья и наоборот).
Это позволяет отличать:
• ранние сигналы-предупреждения (v1/t1)
• поздние, усиленные сигналы (v3, v4 и далее)
• зоны сильной конфлюенции (vXtY двойные дивергенции)
Пример: CNY/RUB 15m — накопление v/t меток перед разворотом
━━━━━━━━━━━━━━━━━━━━━━━━━━━━━━━━━━
МУЛЬТИ-ТАЙМФРЕЙМОВЫЙ ФИЛЬТР (MTF)
━━━━━━━━━━━━━━━━━━━━━━━━━━━━━━━━━━
MTF-фильтр использует старший таймфрейм, чтобы уменьшать или блокировать контртрендовые сигналы.
Режимы:
• Off — фильтрация отключена
• Reduce — сила дивергенции против старшего тренда уменьшается
• Block — контртрендовые дивергенции полностью скрываются
Примеры:
• на 15m/30m — использовать 4H/D как старший ТФ
• на 1H/4H — использовать Daily/Weekly для свинг-позиций
Это помогает не лезть против сильного тренда только потому, что локально появилась дивергенция.
Пример: NVTK 1H — MTF-фильтр блокирует контртрендовые сигналы (серые маркеры)
━━━━━━━━━━━━━━━━━━━━━━━━━━━━━━━━━━
КАК ИСПОЛЬЗОВАТЬ RSS3
━━━━━━━━━━━━━━━━━━━━━━━━━━━━━━━━━━
Вход:
1) дождаться дивергенции (зелёный треугольник — бычья, красный — медвежья)
2) проверить Score:
• |Score| > 0.5 усиливает значимость сигнала
• значения около ±1.0 указывают на экстремальные зоны истощения
3) при необходимости подождать +2 бара после дивергенции для подтверждения пивота
Выход:
• консервативно — по дивергенции в обратную сторону
• агрессивнее — при пересечении Score через 0 или выходе в противоположную зону ±0.5
• стоп-лосс — от волатильности (например, 2–3 × ATR)
Рекомендуемые таймфреймы:
• 5–15m — активный интрадей/свинг (подходит для CNY/RUB и других ликвидных инструментов)
• 1H — акции типа NVTK, связка с MTF-фильтром по 2H/4H
• 2H–4H — BTCUSDT и фьючерсы для свинг-позиций
RSS3 — это не готовая стратегия, а продвинутый модуль поиска разворотов и зон истощения, который лучше всего работает в связке:
• с уровнями поддержки/сопротивления,
• объёмными/ордерфлоу-индикаторами,
• трендовыми и пробойными системами.
━━━━━━━━━━━━━━━━━━━━━━━━━━━━━━━━━━
ЧТО ДЕЛАЕТ RSS3 ОРИГИНАЛЬНЫМ
━━━━━━━━━━━━━━━━━━━━━━━━━━━━━━━━━━
RSS3 — это не просто "микс" стандартных индикаторов. В нём реализованы:
• составной волатильностный индекс VPI (RSI-отклонение, волатильность, диапазон, полосы Боллинджера)
• составной трендовый индекс TDFI (спред и импульс между скользящими средними)
• единый Score от -1 до +1 для оценки силы разворота
• бонусы за дивергенции с учётом амплитуды и затухания во времени
• двойные дивергенции (VPI + TDFI) с последовательной маркировкой v/t
• MTF-фильтр, который может ослаблять или полностью блокировать контртрендовые сигналы
Детальные примеры сделок на NVTK, BTCUSDT и CNY/RUB:
Русская статья по RSS3
Дисклеймер: Торговля на финансовых рынках связана с риском. Индикатор не гарантирует доходности. Всегда тестируйте и соблюдайте собственные правила риск-менеджмента.
Поиск скриптов по запросу "mtf"

Multi-Timeframe Trend MA&BB Suite: 6x Moving Averages by Jenn.ioMulti-Timeframe Trend MA & BB Suite: 6x Moving Averages + 5x MTF View by Jenn.io
Indicator Overview
This indicator is a comprehensive, all-in-one trend and volatility tool designed for traders who rely on Moving Averages (MAs) and Bollinger Bands (BBs). It stands out by allowing users to plot up to six fully customized MAs on the current chart, while simultaneously projecting the values of those same MAs from up to five higher timeframes (MTF).
It's the essential tool for top-down analysis and identifying high-probability confluence zones.
Key Features and Customization
1. The Core: 6x MAs and Bollinger Bands: six Independent MAs: Plot up to six separate Moving Averages on your current chart. Each MA is fully customizable in terms of:
Type: Choose from SMA, EMA, SMMA (RMA), WMA, or VWMA.
Source and Length: Set the calculation source (Close, Open, etc.) and the lookback period.
Style: Customize color, thickness, and line style (Solid, Dashed, Dotted).
Integrated Bollinger Bands (BB): Includes standard Bollinger Bands with customization for length, standard deviation, MA type, and the option to enable or disable the band fill color.
2. Advanced: Multi-Timeframe (MTF) Projection
a. 5x MTF Timeframes: The user can enable and fully customize up to five distinct higher timeframes (e.g., Daily, Weekly, Monthly, 4H, 15m).
b. Dynamic MTF Visualization: The indicator fetches the value of the 6 MAs from these higher timeframes and displays them on the current chart using one of three customizable modes:
Extended Mode: Projects the MTF MA value as a continuous line extending to the right, simulating where the MA is moving on the higher chart.
Floating Segment: Draws a short, visible line segment near the current price action, showing the MA value without cluttering the whole chart.
Floating Label: Displays the MA value as a text label anchored to the right of the current bar, providing clean, non-obtrusive data.
Recommended Usage
1. MTF Confluence: Look for instances where the MTF MA lines align closely with the MAs or BBs of your current timeframe. These areas represent strong support/resistance zones.
2. Trend Filter: Use the Extended Mode MTF lines to quickly determine the higher-timeframe trend without changing your chart. For example, if the Daily 200 EMA is above the current price, the bias is bearish.
3. Precision Entries: Use the Floating Label Mode to see the precise MA value from a higher timeframe. This is useful for placing limit orders near key structural levels.

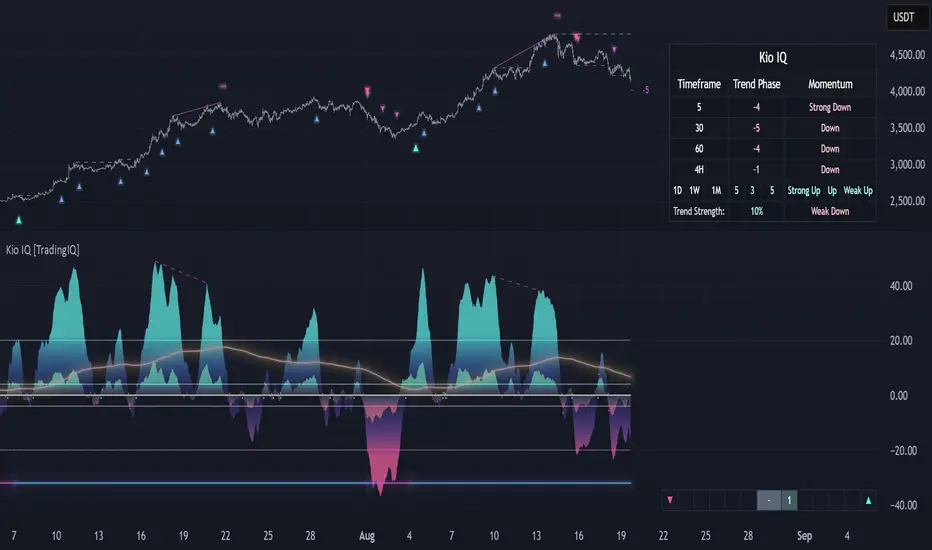
Kio IQ [TradingIQ]Introducing: “Kio IQ ”
Kio IQ is an all-in-one trading indicator that brings momentum, trend strength, multi-timeframe analysis, trend divergences, pullbacks, early trend shift signals, and trend exhaustion signals together in one clear view.
🔶 The Philosophy of Kio IQ
Markets move in trends—and capturing them reliably is the key to consistency in trading. Without a tool to see the bigger picture, it’s easy to mistake a pullback for a breakout, a fakeout for the real deal, or random market noise as a meaningful price move.
Kio IQ cuts through that random market noise—scanning multiple timeframes, analyzing short, medium, and long-term momentum, and telling you on the spot whether a move is strong, weak, a trap, or simply a small move within a larger trend.
With Kio IQ, price action reveals its next move.
You’ll instantly see:
Which way it’s pushing — up, down, or stuck in the middle.
How hard it’s pushing — from fading weakness to full-blown strength.
When the gears are shifting — early warnings, explosive moves, smart pullbacks, or signs it’s running out of steam.
🔶 Why This Matters
Markets move in phases—sometimes they’re powering in one direction, sometimes they’re slowing down, and sometimes they’re reversing.
Knowing which phase you’re in can help you:
Avoid chasing a move that’s about to run out of steam.
Jump on a move when it’s just getting started.
Spot pullbacks inside a bigger trend (good for entries).
See when different timeframes are all pointing the same way.
🔶 What Kio IQ Shows You
Simple color-coded phases: “Strong Up,” “Up,” “Weak Up,” “Weak Down,” “Down,” “Strong Down.”
Clear visual signals
Full Shift: Strong momentum in one direction.
Half Shift: Momentum is building but not full power yet.
Pullback Shift: A small move against the trend that may be ending.
Early Scout / Lookout: First hints of a possible shift.
Exhaustion: Momentum is very stretched and may slow down.
Divergences: When price moves one way but momentum moves the opposite way—often a warning of a change.
Multi-Timeframe Table: See the trend strength for multiple timeframes (5m, current, 30m, 4h, 1D, and optional 1W/1M) all in one place.
Trend Strength %: A single number that tells you how strong the trend is across all timeframes.
Optional meters: A “momentum bar” and “trend strength gauge” for quick checks.
🔶 How It Works Behind the Scenes
Kio IQ measures price movement in different “speeds”:
Slow view: Big picture trend.
Medium view: The main engine for detecting the current phase.
Fast view: Catches recent changes in momentum.
Super-fast view: Finds tiny pullbacks inside the bigger move.
It compares these views to decide whether the market is strong up, weak up, weak down, strong down, or in between. Then it blends data from multiple timeframes so you see the whole picture, not just the current chart.
🔶 What You’ll See on the Chart
🔷 Full Shift Oscillator (FSO)
The image above highlights the Full Shift Oscillator (FSO).
The FSO is the cornerstone of Kio IQ, delivering mid-term momentum analysis. Using a proprietary formula, it captures momentum on a smooth, balanced scale — responsive enough to avoid lag, yet stable enough to prevent excessive noise or false signals.
The Key Upside Level for the FSO is +20, while the Key Downside Level is -20.
The image above shows the FSO above +20 and below -20, and the corresponding price movement.
FSML above +20 confirms sustained upside momentum — the market is being driven by consistent, broad-based buying pressure, not just a price spike.
FSML below -20 confirms sustained downside momentum — sellers are firmly in control across the market.
We do not chase the first sudden price move. Entries are only considered when the market demonstrates persistence, not impulse.
🔷 Half Shift Oscillator (HSO)
The image above highlights the Half Shift Oscillator (HSO).
The HSO is the FSO’s wingman — faster, more reactive, and designed to catch the earliest signs of strength, weakness, or momentum shifts.
While HSO reacts first, it is not a standalone confirmation of a major momentum change or trade-worthy strength.
Using the same proprietary formula as the FSO but scaled down, the HSO delivers smooth, balanced short-term momentum analysis. It is more responsive than the FSO, serving as the scout that spots potential setups before the main signal confirms.
The Key Upside Level for the FSO is +4, while the Key Downside Level is -4.
🔷 PlayBook Strategy: Shift Sync
Shift Sync is a momentum alignment play that triggers when short-term and mid-term momentum lock into the same direction, signaling strong directional control.
🔹 UpShift Sync – Bullish Alignment
HSO > +4 – Short-term momentum is firmly bullish.
FSO > +20 – Mid-term momentum confirms the bullish bias.
When both thresholds are met, buyers are in control and price is primed for continuation higher.
🔹 DownShift Sync – Bearish Alignment
HSO < -4 – Short-term momentum is firmly bearish.
FSO < -20 – Mid-term momentum confirms the bearish bias.
When both thresholds are met, sellers dominate and price is primed for continuation lower.
Execution:
Look for an entry opportunity in the direction of the alignment when conditions are met.
Avoid choppy conditions where alignment is frequently lost.
Why It Works
Think of the market as a tug-of-war between traders on different timeframes. Short-term traders (captured by the HSO) are quick movers — scalpers, intraday players, and algos hunting immediate edge. Mid-term traders (captured by the FSO) are swing traders, funds, and institutions who move slower but carry more weight.
Most of the time, these groups pull in opposite directions, creating chop and fakeouts. But when they suddenly lean the same way, the rope gets yanked hard in one direction. That’s when momentum has the highest chance to drive price further with minimal resistance.
Shift Sync works because it isolates those rare moments when multiple market “tribes” agree on direction — and when they do, price doesn’t just move, it flies.
Best Market Conditions
Shift Sync works best when the higher timeframe trend (daily, weekly, or monthly) is moving in the same direction as the alignment. This higher timeframe confluence increases follow-through potential and reduces the likelihood of false moves.
The image above shows an example of an UpShift Sync signal where the momentum table shows that the 1D momentum is bullish.
The image above shows bonus confluence, where the 1M and 1W momentum are also bullish.
The image above shows an example of a DownShift Sync signal where the momentum table shows that the 1D momentum is bearish. Bonus confluence also exists, where the 1W and 1M chart are also bearish.
Common Mistakes
Chasing late signals – Avoid entering if the Shift Sync trigger has been active for a long time. Instead, wait for a Shift Sync Pullback to look for opportunities to join in the direction of the trend.
Ignoring higher timeframe bias – Taking Shift Sync setups against the daily, weekly, or monthly trend reduces follow-through potential and increases the risk of a failed move.
🔷 Micro Shift Oscillator (MSO)
The image above highlights the Micro Shift Oscillator (MSO)
The MSO is the finishing touch to the FSO and HSO — the fastest and most reactive of the three. It’s built to spot pullback opportunities when the FSO and HSO are aligned, helping traders join strong price moves at the right time.
The MSO may reveal the earliest signs of a momentum shift, but that’s not its primary role. Its purpose is to identify retracement and pullback opportunities within the overarching trend, allowing traders to join the move while momentum remains intact.
🔷 Playbook Strategy: Shift Sync Pullback
Key Levels:
MSO Upside Trigger: +3
MSO Downside Trigger: -3
🔹 UpShift Pullback
Momentum Confirmation:
FSO > +20 – Mid-term momentum is strongly bullish.
HSO > +4 – Short-term momentum confirms alignment with the FSO.
Pullback Trigger:
MSO ≤ -3 – Signals a short-term retracement within the ongoing bullish trend and marks the earliest re-entry opportunity.
Entry Zone:
The blue arrow on the top chart shows where momentum remains intact while price pulls back into a zone primed for a move higher.
Setup Validity: Both FSO and HSO must remain above their bullish thresholds during the pullback.
Invalid Example:
If either the FSO or HSO drop below their bullish thresholds, momentum alignment breaks. No trade is taken.
🔹 DownShift Pullback
Momentum Confirmation:
FSO < -20 – Mid-term momentum is strongly bearish.
HSO < -4 – Short-term momentum aligns with the FSO, confirming seller dominance.
Pullback Trigger:
MSO ≥ +3 – Indicates a short-term retracement against the bearish trend, pointing to possible short-entry opportunities.
Entry Zone:
The purple arrow on the top chart marks valid pullback conditions — all three oscillators meet their bearish thresholds, and price is positioned to continue lower.
Setup Validity: Both FSO and HSO must remain below their bearish thresholds during the pullback.
Invalid Example:
If either oscillator rises above the bearish threshold, momentum alignment is lost and the MSO signal is ignored.
Why It Works
Even in strong trends, price rarely moves in a straight line. Supply and demand dynamics naturally create retracements as traders take profits, bet on reversals, or hedge positions.
While many momentum traders fear these pullbacks, they’re often the fuel for the next leg of the move — offering a “second chance” to join the trend at a more favorable price.
The Shift Sync Pullback pinpoints moments when both short-term (HSO) and mid-term (FSO) momentum remain firmly aligned, even as price moves temporarily against the trend. This alignment suggests the retracement is a pause, not a reversal.
By entering during a controlled pullback, traders often secure better entries, tighter stops, and stronger follow-through potential when the trend resumes.
Best Market Conditions:
Works best when the higher timeframe (daily, weekly, or monthly) is trending in the same direction as the pullback setup.
Consistent momentum is ideal — avoid erratic, news-driven chop.
Following a recent breakout (Gate Breaker setup) when momentum is still fresh.
Common Mistakes
Ignoring threshold breaks – Entering when either HSO or FSO dips through their momentum threshold often leads to taking trades in weakening trends.
Trading against higher timeframe bias – A pullback against the daily or weekly trend is more likely to fail; use higher timeframe confluence as a filter.
🔷 Macro Shift Oscillator (MaSO)
The chart above shows the MaSO in isolation.
While the MaSO is not part of any active Kio IQ playbook strategies, it delivers the clearest view of the prevailing macro trend.
MaSO > 0 – Macro trend is bullish. Readings above +4 signal extreme bullish conditions.
MaSO < 0 – Macro trend is bearish. Readings below -4 signal extreme bearish conditions.
Use the MaSO for context, not entries — it frames the environment in which all other signals occur
🔷 Shift Gates – Kio IQ Momentum Barriers
The image above shows UpShift Gates.
UpShift Gates mark the highest price reached during periods when the FSO is above +20 — moments when mid-term momentum is firmly bullish and buyers are in control.
UpShift Gates are upside breakout levels — key swing highs formed before a pullback during periods of strong bullish momentum. When price reclaims an UpShift Gate with momentum confirmation, it signals a potential continuation of the uptrend.
The image above shows DownShift Gates.
DownShift Gates Mark The Lowest Price Reached During Periods When The FSO Is Below -20 — Moments When Mid-Term Momentum Is Firmly Bearish And Sellers Are In Control.
DownShift Gates are downside breakout levels — key swing lows formed before an upside pullback during periods of strong bearish momentum. When price reclaims a DownShift Gate with momentum confirmation, it signals a potential continuation of the downtrend.
🔷 Playbook Strategy: Gate Breakers
Core Rule:
Long signal when price decisively closes beyond an UpGate (for longs) or DownGate (for shorts). The breakout must show commitment — no wick-only tests.
🔹 UpGate Breaker (UpGate)
Trigger: Price closes above the UpShift Gate level.
Bonus Confluence: MaSO > 0 at the moment of the break — confirms that the macro trend bias is in favor of the breakout.
Invalidation: Avoid taking the signal if the gate level forms part of a DownShift Rift (bearish divergence) — this signals underlying weakness despite the break.
The chart above shows valid UpGate Breakers.
The chart above shows an invalidated UpGate Breaker setup.
🔹 DownGate Breaker (DownGate)
Trigger: Price closes below the DownShift Gate level.
Bonus Confluence: MaSO < 0 at the moment of the break — confirms that the macro trend bias is in favor of the breakdown.
Invalidation: Avoid taking the trade if the gate level forms part of an UpShift Rift (bullish divergence) — this signals underlying strength despite the break.
The chart above shows a valid DownGate Breaker.
Why It Works
Key swing levels like Shift Gates attract a high concentration of resting orders — stop losses from traders caught on the wrong side and breakout orders from momentum traders waiting for confirmation.
When price decisively clears a gate with a strong close, these orders trigger in quick succession, creating a burst of directional momentum.
Adding the MaSO filter ensures you’re breaking gates with the prevailing macro bias, improving the odds that the move will continue rather than stall.
The divergence-based invalidation rule (Rift filter) prevents entries when underlying momentum is moving in the opposite direction, helping avoid “fake breakouts” that trap traders.
Best Market Conditions:
Works best in markets with clear trend structure and visible Shift Gates (not during chop).
Strongest when higher timeframe (1D, 1W, 1M) momentum aligns with the breakout direction.
MaSO > 0 for bullish breakouts, MaSO < 0 for bearish breakouts
Most reliable after a period of consolidation near the gate, where pressure builds before the break.
Common Mistakes
Trading wick-only tests – A breakout without a decisive candle close beyond the gate often fails.
Ignoring MaSO bias – Taking a break in the opposite macro direction greatly reduces follow-through odds.
Skipping the Rift filter – Entering when the gate forms part of a divergence setup exposes you to higher reversal risk.
Chasing extended moves – If price is already far beyond the gate by the time you see it, risk/reward is poor; wait for the next setup or a retest.
🔷 Shift Rifts - Kio IQ Divergences
This chart shows an UpShift Rift — a bullish divergence where price action and momentum part ways, signaling a potential trend reversal or acceleration.
Setup:
Price Action: Price is marking lower lows, indicating short-term weakness.
FSO Reading: The Full Shift Oscillator (FSO) is marking higher lows over the same period, showing underlying momentum strengthening despite falling prices.
The rift between price and the FSO suggests selling pressure is losing force while buyers quietly regain control.
When confirmed by broader trend alignment in Kio IQ’s multi-timeframe momentum table, the UpShift Rift becomes a setup for a bullish move.
This chart shows a DownShift Rift — a bearish divergence where price action and momentum split, signaling a potential downside reversal.
Setup:
Price Action: Price is marking higher highs, suggesting continued strength on the surface.
FSO Reading: The Full Shift Oscillator (FSO) is marking lower highs over the same period, revealing weakening momentum beneath the price advance.
The rift between price and momentum signals that buying pressure is fading, even as price makes new highs. This disconnect often precedes a momentum shift in favor of sellers.
When aligned with multi-timeframe bearish signals in Kio IQ’s momentum table, the DownShift Rift becomes a strong setup for downside continuation or reversal.
🔷 Playbook Strategy: Rift Reversal
The Rift Reversal is a divergence-based reversal play that signals when momentum is fading and an trend reversal is likely. It’s designed to catch early turning points before the broader market catches on.
Trader’s Note:
This strategy is not intended for beginners — it requires confidence in reading divergence and trusting momentum shifts even when price action still appears weak. Best suited for traders experienced in managing reversals, as entries often occur before the broader market confirms the move.
🔹 UpRift Reversal
Core Setup:
Price Action – Forms a lower low.
Momentum Rift – The FSO forms a higher low, signaling bullish divergence and weakening selling pressure.
Trigger:
A confirmed UpRift Reversal signal is printed when:
Bullish Divergence is detected — price makes a new low, but the oscillator fails to confirm.
Momentum begins turning up from the divergence low (marked on chart as ⇝)
The image above shows a valid UpRift Reversal play.
🔹 DownRift Reversal
Core Setup:
Price Action – Forms a higher high.
Momentum Rift – The FSO forms a lower high, signaling bearish divergence and weakening buying pressure.
Trigger
A confirmed DownRift Reversal signal is printed when:
Bearish Divergence is detected — price makes a new high, but the oscillator fails to confirm.
Momentum begins turning down from the divergence high (marked on chart as ⇝).
Why It Works
Shift Rifts work because momentum often fades before a price reverses.
Price is the final scoreboard — it reflects what has already happened. Momentum, on the other hand, is a leading indicator of pressure. When the FSO begins to move in the opposite direction of price, it signals that the dominant side in the market is losing steam, even if the scoreboard hasn’t flipped yet.
In an UpShift Rift, sellers keep pushing price lower, but each push has less force — buyers are quietly building pressure under the surface.
In a DownShift Rift, buyers keep marking new highs, but they’re spending more effort for less result — sellers are starting to take control.
These disconnects happen because large participants often scale into or out of positions gradually, creating momentum shifts before price reflects it. Shift Rifts capture those turning points early.
Best Market Conditions:
Best in markets that have been trending strongly but are starting to show signs of exhaustion.
Works well after a prolonged move into key support/resistance, where large players may take profits or reverse positions.
Higher win potential when the Rift aligns with higher timeframe momentum bias in Kio IQ’s multi-timeframe table.
Common Mistakes
Forcing Rifts in choppy markets – In sideways chop, small oscillations can look like divergences but lack conviction.
Ignoring multi-timeframe bias – Trading an UpShift Rift when higher timeframes are strongly bearish (or vice versa) reduces follow-through odds.
Entering too early – Divergences can extend before reversing; wait for momentum to confirm a turn (⇝) before making a trading decision.
Confusing normal pullbacks with Rifts – Not every dip in momentum is a divergence; the Rift requires a clear and opposing trend between price and FSO.
🔷 Shift Count – Momentum Stage Tracker
Purpose:
Shift Count measures how far a bullish or bearish push has progressed, from its first spark to potential exhaustion.
It tracks momentum in defined steps so traders can instantly gauge whether a move is just starting, picking up steam, fully extended, or at risk of reversing.
How It Works
Bullish Momentum:
Start (1–2) → New momentum emerging, early entry window.
Acceleration (3–4) → Momentum in full swing, best for holding or adding to a position.
Extreme Bullish Momentum / Final Stages (5) → Watch for signs of reversal or take partial profits.
Exhaust – Can only occur after 5 is reached, signaling that the rally may be losing steam.
Bearish Momentum:
Start (-1 to -2) → New selling pressure emerging.
Acceleration (-3 to -4) → Bear trend accelerating.
Extreme Bearish Momentum / Final Stages (-5) → Watch for reversal or scale out.
Exhaust – Can only occur after -5 is reached, signaling that the sell-off may be running out of force.
The chart above shows a full 5-UpShift count.
The chart above shows a full 5-DownShift count.
Why It’s Useful
Markets often move in momentum “steps” before reversing or taking a breather.
Shift Count makes these steps visible, helping traders:
Spot the early stages of a potential move.
Identify when a move is picking up steam.
Identify when a move is mature and vulnerable to reversal.
Combine with other Kio IQ strategies for better-timed entries and exits.
Why This Works
It’s visually obvious where you are in the momentum cycle without overthinking.
You can build rules like:
Only enter in Start phase when higher timeframe agrees.
Manage positions aggressively once in Acceleration phase.
Be ready to exit or fade in Exhaust phase.
Best Market Conditions
Trending markets where pullbacks are shallow.
Works best when combined with Shift Sync Pullback or Gate Breaker triggers to confirm timing.
Higher timeframe direction confluence.
Common Mistakes
Treating Exhaust as always a reversal — sometimes strong markets push past 5/-5 multiple times.
Ignoring higher timeframe bias — a “Start” on a 1-minute chart against a strong daily trend is much riskier.
🔷 Playbook Strategy: Exhaust Flip
Core idea: When Shift Count reaches 5 (or -5) and then prints Exhaust, momentum has likely climaxed, whether temporarily or leading to a full reversal. We take the first qualified signal against the prior move.
Trader’s Note:
This strategy is not intended for beginners — it requires confidence in trusting momentum shifts even when price action still appears strong. Best suited for traders experienced in managing reversals, as entries often occur before the broader market confirms the move.
🔹 UpExhaust Flip (fade a bullish run)
Setup:
Shift Count hits 5, then an Exhaust print occurs.
Invalidation
The local high is broken to the upside.
The chart above explains the UpExhaust Flip strategy in greater detail.
🔹 DownExhaust Flip (fade a bearish run)
Setup:
Shift Count hits -5, then an Exhaust print occurs.
Invalidation
The local low is broken to the downside.
The chart above explains the DownExhaust Flip strategy in greater detail.
Bonus Confluence (optional, not required)
Rift assist: An UpShift Rift (for longs) or DownShift Rift (for shorts) near Exhaust strengthens the flip.
MaSO context: Neutral or opposite-leaning MaSO helps. Avoid flips straight against a strong MaSO bias unless you have a structure break.
Why It Works
Exhaust marks climax behavior: the prior side has pushed hard, then failed to extend after meeting significant pushback. Liquidity gets thin at the edges; aggressive profit-taking meets early contrarians. A small confirmation (micro structure break or HSO turn) is often enough to flip the tape for a snapback.
Best Market Conditions
After extended, one-sided runs (multiple Shift Count steps without meaningful pullbacks).
Near Shift Gates or obvious swing extremes where trapped orders cluster.
When higher-timeframe momentum is neutral or softening (you’re fading the last thrust of a decisive move, not a fresh trend).
Common Mistakes
Fading too early: Taking the trade at 5 without waiting for the Exhaust.
Fading freight trains: Fighting a fresh Shift Sync in the same direction right after Exhaust (often just a pause).
No structure reference: Entering without a clear micro swing to anchor risk.
🔷 MTF Shift Table
The MTF Shift Table table provides a compact, multi-timeframe view of market momentum shifts. Each cell represents the current shift count within a given timeframe, while the classification label indicates whether momentum is strong, weak, or normal.
The chart above further outlines the MTF Shift Table.
Why It Works
Markets rarely move in a perfectly linear fashion — momentum develops, stalls, and transitions at different speeds across different timeframes. This table allows you to:
See momentum alignment at a glance – If multiple higher and lower timeframes show a sustained shift count in the same direction, the move has greater structural support.
Spot divergences early – A shorter timeframe reversing against a longer-term sustained count can warn of potential pullbacks or trend exhaustion before price confirms.
Identify “momentum stacking” opportunities – When shift counts escalate across timeframes in sequence, it often signals a stronger and more durable move.
Avoid false enthusiasm – A single timeframe spike without agreement from other periods may be noise rather than genuine momentum.
The Trend Score provides a concise, at-a-glance evaluation of an asset’s directional strength across multiple timeframes. It distills complex momentum and Shift data into a single, easy-to-read metric, allowing traders to quickly determine whether the prevailing conditions favor bullish or bearish continuation. The Trend Scale scales from -100 to 100.
How to Use It in Practice
Trend Confirmation – Confirm that your intended trade direction is backed by multiple timeframes maintaining consistent momentum.
Risk Timing – Reduce position size or take partial profits when lower timeframes begin shifting against the dominant momentum classification.
Multi-timeframe Confluence – Combine with other system signals (e.g., FSO, HSO) for higher-probability entries.
This table effectively turns a complex multi-timeframe read into a single, glanceable heatmap of momentum structure, enabling quicker and more confident decision-making.
The MTF Shift Table is the confluence backbone of every playbook strategy for Kio IQ.
🔷 Momentum Meter
The Momentum Meter is a composite gauge built from three of Kio IQ’s core momentum engines:
HSO – Short-term momentum scout
FSO – Mid-term momentum backbone
MaSO – Macro trend context
By combining these three readings, the meter provides the most strict and lagging momentum classification in Kio IQ.
It only flips direction when a composite score of all three oscillators reach defined thresholds, filtering out short-lived counter-moves and false starts.
Why It Works
Many momentum tools flip too quickly — reacting to short-lived spikes that don’t represent real directional commitment. The Momentum Meter avoids this by requiring alignment across short, mid, and macro momentum engines before it shifts bias.
This triple-confirmation rule filters out noise, catching only those moments when traders of all speeds — scalpers, swing traders, and long-term participants — are leaning in the same direction. When that happens, price movement tends to be more sustained and less prone to immediate reversal.
In other words, the Momentum Meter doesn’t just tell you “momentum looks good” — it tells you momentum looks good to everyone who matters, across all horizons.
How It Works
Blue = All three engines align bullish.
Pink = All three engines align bearish.
The meter ignores smaller pullbacks or temporary oscillations that might flip the faster indicators — it waits for total alignment before changing state.
Because of this strict confirmation requirement, the Momentum Meter reacts slower but delivers higher-conviction shifts.
How to Interpret Readings
Blue (Bullish Alignment):
Sustained buying pressure across short, mid, and macro views. Often marks the “full confirmation” stage of a move.
Pink (Bearish Alignment):
Sustained selling pressure across all views. Confirms sellers are in control.
Practical Uses
Trend Followers – Use as a “stay-in” confirmation once a position is already open.
Swing Traders – Great for filtering out low-conviction setups; if the Momentum Meter disagrees with your intended direction, conditions aren’t fully aligned.
Confluence and Direction Filter – The Momentum Meter can be used as a form of confluence i.e. blue = longs only, pink = shorts only.
Limitations
Will always turn after the faster oscillators (HSO/MSO). This is intentional.
Works best in trending markets — in choppy conditions it may lag shifts significantly.
Should be used as a bias filter, not a standalone entry signal.
🔷 Trend Strength Meter
The Trend Strength Meter is a compact visual gauge that scores the current trend’s strength on a scale from -5 to +5:
+5 = Extremely strong bullish trend
0 = Neutral, no clear trend
-5 = Extremely strong bearish trend
This is an optional tool in Kio IQ — designed for quick reference rather than as a primary trading trigger.
Why it works
Single-indicator trend reads can be misleading — they might look strong on one metric while quietly weakening on another. The Trend Strength Meter solves this by blending multiple inputs (momentum alignment, structure persistence, and multi-timeframe data) into one composite score.
This matters because trend health isn’t just about direction — it’s about persistence. A +5 or -5 score means the market is not only trending but holding that trend with structural support across multiple timeframes.
By tracking both direction and staying power, the Trend Strength Meter flags when a move is at risk of fading before price action fully confirms it — giving you a head start on adjusting your position or taking profits.
How It Works
The Trend Strength Meter evaluates multiple market inputs — including momentum alignment, price structure, and persistence — to assign a numeric value representing how firmly the current move is holding.
The scoring logic:
Positive values indicate bullish conditions.
Negative values indicate bearish conditions.
Higher magnitude (closer to ±5) = stronger conviction in that direction.
Values near zero suggest the market is in a transition or range.
How to Interpret Readings
+4 to +5 (Strong Up) – Trend is well-established, often with multi-timeframe agreement.
+1 to +3 (Up) – Bullish bias present, but not at maximum conviction.
0 (Neutral) – No dominant trend; could be consolidation or pre-shift phase.
-1 to -3 (Down) – Bearish bias present but moderate.
-4 to -5 (Strong Down) – Trend is firmly bearish, with consistent downside momentum.
Why It Works
A single timeframe or momentum reading can give a false sense of trend health.
The Trend Strength Meter aggregates multiple layers of market data into one simplified score, making it easy to see whether a move has the underlying support to continue — or whether it’s more likely to stall.
Because the score considers both direction and persistence, it can flag when a move is losing strength even before price structure fully shifts.
🔷 Kio IQ – Supplemental Playbook Strategies
These phases are part of the Kio IQ Playbook—situational tools that can help you anticipate potential momentum changes.
While they can be useful for planning and tactical adjustments, they are not primary trade triggers and should be treated as early, lower-conviction cues.
🔹 1. Scouting Phase (Light Early Cue)
Purpose: Provide the earliest possible hint that momentum may be shifting.
Upshift Trigger: FSO crosses above the 0 line.
Downshift Trigger: FSO crosses below the 0 line.
Why It Works
The 0 line in the Full Shift Oscillator (FSO) acts as a neutral momentum boundary.
When the FSO moves above 0, it suggests that medium-term momentum has shifted to bullish territory.
When it moves below 0, it suggests that medium-term momentum has shifted to bearish territory.
This crossover is often the first measurable sign of a momentum reversal or acceleration, well before slower indicators confirm it.
Think of it as "momentum poking its head above water"—you’re spotting the change before it becomes obvious on price alone.
Best Use
Works best when confirmed later by Lookout Phase or other primary Kio IQ signals.
Ideal for scouting in anticipation of potential opportunities.
Helpful when monitoring multiple assets and you want a quick filter for shifts worth watching.
Can act as a trade trigger when the MTF Shift Table shows confluence (i.e., UpShift Scouting Signal + Bullish MTF Table + High Trend Strength Score).
Common Mistakes
Acting on Scouting Phase signals against the MTF Shift Table as a stand-alone trade trigger. Without higher timeframe alignment or additional confirmation, many Scouting Phase crossovers can fade quickly or reverse, leading to premature entries.
Ignoring market context
A bullish Scouting Phase in a strong downtrend can easily fail.
Always check higher timeframe trend alignment.
Overreacting to noise: On lower timeframes, small fluctuations can create false scouting signals.
Best Practices
Filter with trend: Only act on Scouting Phases that align with the dominant higher timeframe trend.
Watch volatility: In low-volatility conditions, false scouting triggers are more likely.
🔹 2. Lookout Phase (Early Momentum Alert)
Purpose:
The Lookout Phase signals an early alert that momentum is potentially strengthening in a given direction. It’s more meaningful than the Scouting Phase, but still considered a preliminary cue.
Triggers:
Upshift: FSO crosses above the HSO.
Downshift: FSO crosses below the HSO.
Why It Works:
The Lookout Phase is designed to identify moments when mid-term momentum (FSO) overtakes short-term momentum (HSO). Since the FSO is smoother and reacts more gradually, its crossover of the faster-reacting HSO can indicate a shift from short-lived fluctuations to a more sustained directional move.
This makes it a valuable early read on momentum transitions—especially when supported by higher-timeframe context.
Best Practices:
Always check the MTF Shift Table for higher-timeframe alignment before acting on a Lookout Phase signal.
Look for confluence with the Momentum Meter
Treat Lookout Phase entries as probing positions—small, exploratory trades that can be scaled into if follow-through develops.
Common Mistakes:
Treating Lookout Phase signals as a definitive trade trigger without context
Entering solely on a Lookout Phase crossover, without considering the MTF Shift Table or broader market structure, can result in chasing short-lived momentum bursts that fail to follow through.
Ignoring prevailing higher-timeframe momentum
Trading a Lookout Phase signal that is counter to the dominant trend or higher-timeframe bias increases the risk of whipsaws and false moves.
🔶 Summary
Kio IQ is an all-in-one trading indicator that combines momentum, trend strength, multi-timeframe analysis, divergences, pullbacks, and exhaustion alerts into a clear, structured view. It helps traders cut through market noise by showing whether a move is strong, weak, a trap, or simply part of a larger trend. With tools like the Full Shift Oscillator, Multi-Timeframe Shift Table, Shift Gates, and Rift Divergences, Kio IQ simplifies complex market behavior into easy-to-read signals. It’s designed to help traders spot early shifts, align with momentum, and recognize when trends are building or losing steam—all in one place.
Платный скрипт
Affirmify AI — Entry PrecisionAffirmify AI — Entry Precision is a multi-factor directional model with entry-quality filter and ATR-based SL/TP, synced with the Affirmify core engine.
What is Affirmify AI — Entry Precision?
Affirmify AI — Entry Precision is the TradingView front-end of the Affirmify core model.
It combines:
multi-timeframe trend filters
momentum & volatility conditions
an entry-quality check (candle body vs ATR)
ATR-based SL/TP engine
The script is designed to mirror the logic of the Affirmify Python backend used on AffirmifyHub.com.
Core idea
1.Score (core direction):
Built from ADX, EMA trend, RSI zone, MACD histogram, DI+/DI- and ATR volatility penalty.
Score ≥ +2 → BUY bias
Score ≤ −2 → SELL bias
Between −1 and +1 → no clear direction.
2.Higher-timeframe (MTF) confirmation:
Same style of scoring on a higher TF (default 4H).
If MTF direction conflicts with the main timeframe, the script will show “MTF conflict / NO TRADE” and block signals.
3.Entry quality filter:
Checks if the candle body is large enough vs ATR (Min body size (x ATR)).
Output:
CONFIRMED – direction + volatility + body are aligned
WAIT FOR BETTER ENTRY – direction ok, but body is too small
NO QUALITY ENTRY – conditions are not met.
4.ATR-based SL/TP engine:
Internal engine (uses ATR × multiplier or minimal tick distance).
Values are shown on the panel only (no lines drawn on chart), so the chart stays clean.
Panel overview
The panel in the top-right shows:
Action – BUY / SELL / NO TRADE
Status – CONFIRMED / WAIT FOR BETTER ENTRY / NO SIGNAL / MTF conflict
Entry – last confirmed entry price
SL / TP – suggested ATR-based stop-loss and take-profit
Higher TF – higher timeframe filter state (ON/OFF and TF used)
Score – core multi-factor score on the current timeframe
Vol – “Normal volatility” or “Low volatility (ATR penalized)”
Inputs – quick guide
Trend & Filters
EMA Fast / Mid / Slow – EMAs used for trend & bias detection
ADX Length – period for ADX (trend strength)
RSI Length – period for RSI zone filter
ATR Length – ATR used for volatility & body/SL/TP logic
Low ATR threshold (% of price) – defines when the market is considered “low volatility”.
Higher timeframe confirmation
Use higher timeframe filter – enable / disable MTF confirmation
Higher TF – e.g. 240 (4H), 60 (1H), etc.
Entry Precision
Min body size (x ATR) – minimum body vs ATR required for a CONFIRMED entry.
SL / TP
Min SL = ATR x – minimal ATR distance for SL
Min TP = ATR x – minimal ATR distance for TP
Min SL in ticks / Min TP in ticks – hard floor, based on instrument tick size.
Visuals
Show info panel – show / hide the top-right dashboard
Show status badges – textual badges above the last candle
Draw ENTRY/SL/TP (panel only, legacy) – kept for compatibility; does not draw lines in this version.
Alerts
The script provides three alert conditions:
Affirmify: BUY confirmed
Triggered when BUY direction is aligned and entry quality is CONFIRMED (no MTF conflict).
Affirmify: SELL confirmed
Triggered when SELL direction is aligned and entry quality is CONFIRMED (no MTF conflict).
Affirmify: wait for better entry
Direction is valid, but candle body is not yet strong enough – potential setup forming.
You can connect these alerts to your own automation, bots or dashboards.
How to use it (typical workflow)
Select your symbol and timeframe (most users focus on 1H / 4H).
Wait for the panel to show a clear Action (BUY or SELL) with a solid Score (≥ +2 or ≤ −2).
Look for Status = CONFIRMED for actual entries.
Use the panel SL / TP values as a starting point for your own risk management.
Avoid trades when:
Status shows “NO SIGNAL” or “NO CLEAR DIRECTION”
MTF conflict is active
Volatility is extremely low for your style.
Access & subscription
This is an invite-only script connected to the AffirmifyHub ecosystem.
Access is managed via private subscription on AffirmifyHub.com.
After activation you will receive TradingView access to this indicator from the author account.
For questions about access, licensing or private use, please contact the author via TradingView DM or through AffirmifyHub.
Important notice
This tool does not guarantee profits and should never be used as a standalone decision engine.
Always combine it with:
your own price action reading
multi-timeframe context
strict position sizing and risk management.
Markets are risky – never trade money you cannot afford to lose.Multi-factor directional model with entry-quality filter and ATR-based SL/TP levels, synced with the Affirmify core Python engine.

Dix$ons Tackle BoxDixsons Tackle Box — Multi-Tool Trend & Levels Suite (MA/EMA + VWAP + BB + Adaptive Trend Channels + Auto Fibs)
---
**Dixsons Tackle Box** is an all-in-one overlay for traders who want a clean chart with *stacked edge* instead of stacked indicators.
It combines:
* A **5-slot MA/EMA pack** with live slope % labels and MTF smoothing
* A **full VWAP engine** with event-based anchors, trend angle coloring, and VWAP bands
* **Bollinger Bands** with volatility-aware coloring and optional gradient background
* A **Short-Term & Long-Term Adaptive Trend Channel (ATC)** with automatic period detection, log-regression channels, and performance tables
* A **Dixson Auto Fibonacci suite**: ATR-based “rail” Fibs + Lookback Fibs off HH/LL, both driving a shared, fully customizable Fib bank
Everything is controlled logically by feature groups under the **“Tackle Box”** section, so you can quickly turn modules on/off and tune the tool to your style (scalp, intraday, swing, or position).
> **Important:** This is an analysis/visualization tool only. Nothing here is financial advice or an automatic trading system. Always test and manage risk yourself.
---
## 1. MA/EMA Pack — 5 Smart Averages with Slope %
**Group:** `Tackle Box` + per-slot groups `MA/EMA 1` … `MA/EMA 5`
**Main toggle:** `Enable MA's`
**Per-slot master row:** `_maRow1` … `_maRow5`
### What it does
This module gives you **five independent MA/EMA slots**, each with:
* Its own **type** (MA or EMA)
* **Length**, **color**, **line width**, and **plot style** (`Solid`, `Step`, or `Circles`)
* **Timeframe per slot** (MTF)
* Rich **label controls** (slope %, length/type text, timeframe text, etc.)
* **Label size** per slot (`tiny → huge`)
On top of that, each average has a **live slope % readout**, normalized by instrument tick size, so you can compare trend steepness across assets.
### Key features
* **Master slot row (1–5):**
In the `Tackle Box` group you have `_maRow1`–`_maRow5` toggles. These gate each slot globally, so you can quickly show/hide specific MAs without digging into each slot.
* **MTF Smoothed Mode:**
* `MTF Smoothed Mode` (on by default) makes higher-timeframe MAs **update only when the HTF bar closes (and on the last bar)**.
* That reduces the stair-stepping noise you often get when pulling HTF data onto an LTF chart, while still giving you accurate levels and a smooth, tradeable line.
* **Per-slot label text controls:**
Each MA group has toggles to control exactly what the label shows:
* `Show Label` – show/hide label entirely
* `Slope` – append slope % to the label
* `Len+Type` – show e.g. `50EMA` or `200MA`
* `TF` – show HTF name if the slot is on an MTF
* `'slope' text` – optionally include the word `slope` in the label
* **Slope % (angle) logic:**
Slope for each MA uses a normalized **“angle %” in **, based on the 1-bar change vs `syminfo.mintick`.
* Big positive values = strong uptrend
* Big negative values = strong downtrend
* Near zero = flat/neutral
This makes it easy to build rules like:
* “Only trade long if the **50EMA slope** is above +20% and price is above VWAP”
* “Take profit if slope on my faster MA collapses back toward 0.”
### Typical use
* Slot 1–2: **fast intraday EMAs** (e.g., 9 / 20 EMA)
* Slot 3–4: **structural EMAs/MAs** (e.g., 50 / 200)
* Slot 5: a **dedicated MTF trend filter** (e.g., 5-minute or 1-hour EMA on a 1-minute chart)
---
## 2. VWAP Engine + Bands — Anchor-Aware, Angle-Aware VWAP
**Group:** `Enable VWAP` + `------ VWAP Settings ------`, `Bands Settings`, `Color Settings`
### Core VWAP
* **Anchors:**
`Anchor Period` lets you choose where each VWAP reset starts:
* `Session` (day session VWAP, perfect for intraday)
* `Week`, `Month`, `Quarter`, `Year`, `Decade`, `Century`
* Corporate events: `Earnings`, `Dividends`, `Splits`
This lets you build VWAP logic around:
* **Intraday mean reversion** (Session VWAP + bands)
* **Swing anchor VWAPs** (Weekly/Monthly)
* **Event-based anchors** (earnings/dividend/split reaction)
* **Hide on DWM:**
`Hide VWAP on 1D or Above` lets you keep intraday VWAP from cluttering higher-TF charts.
* **Angle/Trend Detection:**
The VWAP engine computes a **regression slope** over each anchor segment and converts it to an **angle %**:
* `Angle Lookback (bars)` controls how many bars are used
* `Angle Trend Threshold (%)` sets the threshold where a slope is considered “trending”
With `Color VWAP by Trend` enabled:
* Uptrend > threshold → VWAP turns **trend up color** (e.g., lime)
* Downtrend < −threshold → VWAP turns **trend down color** (e.g., red)
* Inside threshold → VWAP uses a neutral color
You can also set separate **line widths** for neutral vs trend state and transparency to give a “Hull-style” visual feel.
* **VWAP Labels:**
You get a single, de-duplicated VWAP label on the last bar with:
* Optional **name** (`VWAP`)
* Optional **price** (`$xxx.xx`)
* Optional **angle %** and optional `"slope"` word
* Global **label size** for VWAP + bands
### VWAP Bands
* **Calc modes:**
`Bands Calculation Mode`:
* `Standard Deviation` – classic VWAP ± n * σ
* `Percentage` – bands as a fixed % of VWAP
* **Bands 1-3:**
Each band has:
* Visibility toggle, independent multiplier (`×`)
* Separate **upper/lower colors** per band
* Optional **fill** between upper/lower for each band
* Label toggles:
* `Show All Labels`
* `Show Band #X Label`
* `Band Labels: Show Names` (VWAP+1, VWAP-1, etc.)
* `Band Labels: Show Prices`
This lets you configure anything from a minimalist “just VWAP + 1 band” view to a full 3-band ladder.
### VWAP Highlight Fill
* **Premium/discount shading**:
Optional fill that shades:
* Region **above VWAP** when price is above (e.g., greenish)
* Region **below VWAP** when price is below (e.g., reddish)
This makes it extremely easy to see when price is trading at **premium vs discount** relative to the current anchor VWAP.
### Typical use
* Intraday scalpers: Session VWAP + 1–2 bands + highlight fill
* Swing traders: Weekly/Monthly VWAP + only the main line and label
* Event traders: Earnings-anchored VWAP, tracking post-earnings drift
---
## 3. Bollinger Bands — Volatility-Aware BB with Gradient Fill
**Group:** `Enable Bollinger Bands` + `------ Bollinger Band settings ------`
### What it adds
A clean Bollinger Band overlay designed to play nicely with the VWAP/MA stack:
* `Bollinger Bands Length` (default 20)
* `Bollinger Bands Multiplier` (default 2.0)
* `BB Basis Color` & **line width**
* Upper/lower bands colored based on **width change**:
* Expanding volatility → `BB Expanding Color`
* Contracting volatility → `BB Contracting Color`
You can also toggle:
* `Show Center Line MA Label` – prints something like `20ma` on the last bar.
* `Enable Gradient Background Fill` – draws a gradient between price and the bands:
* `Gradient Fill Up Color` for below-price fill
* `Gradient Fill Down Color` for above-price fill
### Why it’s unique here
Instead of just static bands, this implementation **flags volatility regimes** (expansion vs contraction) via color and optional gradient. That pairs nicely with ATR Fibs and VWAP:
* Use **BB contraction (squeeze)** + flat VWAP angle to anticipate breakouts.
* Use BB + VWAP bands to filter which “touches” are genuinely overextended.
---
## 4. Dixson Adaptive Trend Channel (ATC) — Short-Term & Long-Term Log Channels
**Master toggle:** `Enable Adaptive Trend Channel`
**Groups:** `------ Dixson ATC Settings ------`, `Short-Term Channel Settings`, `Long-Term Channel Settings`, `Short-Term Midline Settings`, `Long-Term Midline Settings`, `Channel Trend Background Fill Settings`, `Short-Term Table Settings`, `Long-Term Table Settings`
### Under the hood
ATC is a **log-scale regression channel engine** that automatically:
1. Scans a set of candidate periods.
* **Short-term:** 20 → 200 bars
* **Long-term:** 300 → 1200 bars
2. For each period, it computes:
* Log-price regression slope & intercept
* Standard deviation of residuals
* A Pearson-style R value (trend “strength”)
3. Picks the period with the **highest correlation (|R|)** and uses that as the **detected trend length**.
This yields a **data-driven channel** that adapts to whatever trend the market is actually respecting.
> For long-term stats, annualized return only makes sense on **daily/weekly** charts. On intraday charts, treat the “Annual Return” purely as informational.
### Short-Term Channel
Controls in `Short-Term Channel Settings` + `Short-Term Midline Settings`:
* `Show Short-Term Channel` – on/off
* `Deviation Multiplier (Short-Term)` – how wide the channel is (in standard deviations)
* **Upper/Lower colors**, line width, style (Solid/Dotted/Dashed), transparency
* `Line Extension Style` – Extend Right / Extend Both / Extend None / Extend Left
Optional **Short-Term Midline**:
* Toggle + color, style, width, transparency
* Tracks the regression line itself (center of the channel)
Background fill:
* `Enable ST Background Fill` with separate **ST Uptrend** / **ST Downtrend** colors
* Trend direction is inferred from regression slope sign
### Long-Term Channel
Mirrors the ST controls with its own group:
* `Show Long-Term Channel`
* `Deviation Multiplier (Long-Term)`
* Upper/Lower channel colors, thickness, style, transparency
* `Line Extension Style`
* Optional Long-Term midline + colors/styles
* Optional **background fill** with separate colors for up vs down
You can run **both channels at once**, giving a panel of:
* **Macro trend structure** (Long-Term ATC)
* **Current swing trend** (Short-Term ATC)
* MAs, VWAP, and Auto Fibs on top for entries/exits
### Trend Info Tables
Each channel has its own table options:
* `Show Detected Period` (bars used)
* `Show Trend Strength` – either:
* Descriptive text: “Extremely Weak” → “Ultra Strong”, or
* Raw Pearson R value if `Show Pearson R` is enabled
* `Show Annualized Return` (when timeframe is daily/weekly)
* Table position (`Top Left`, `Bottom Right`, etc.)
* Text size (`Small`, `Normal`, `Large`)
These tables quantify:
* Over what lookback the trend is being measured
* How “clean” that trend is
* What the approximate annualized performance of that trend has been
---
## 5. Dixson Auto Fibonacci Suite — ATR Fibs + Lookback Fibs + Shared Fib Bank
**Master toggle:** `Enable Auto Fibonacci`
**Groups:** `Dixson Auto Fibonacci`, `ATR Auto Fib`, `Previous ATR Fib`, `Lookback Auto Fib`, `Lookback Anchor Overrides`, `Fibonacci Levels`
You get **two separate engines** (ATR-based and Lookback-based) that both draw from the **same customizable Fib bank**, with optional log scaling.
---
### 5.1 Global Auto Fib Settings
* `Logarithmic Scale`
* When ON, Fib levels are interpolated in log-space (better for assets that move in percentages).
* When OFF, interpolation is linear in price.
This applies to **both** the ATR and Lookback engines.
---
### 5.2 ATR Auto Fib (Rail-Based, Supertrend-Driven)
**Groups:** `ATR Auto Fib`, `Previous ATR Fib`
The ATR engine builds **“rails”** that hug price without letting candles touch them, then projects Fib levels between these anchors.
#### How it works
1. Uses built-in `ta.supertrend` with:
* `ATR Period`
* `ATR Multiplier`
2. Builds dynamic **upper and lower rails** around price:
* Uses ATR to define a **proximity gap** (`Proximity (×ATR)`) so rails stay **just outside the wicks** (no-touch behavior).
* Smooths raw highs/lows slightly (RMA) to avoid spiky rails.
* Ensures the upper rail is always ≥ high+gap and lower rail ≤ low−gap.
3. The **direction** (uptrend/downtrend) is inferred from the Supertrend direction:
* On trend flips, the script:
* Captures the prior rail pair as a **“previous segment”**
* Starts a new rail segment in the new direction
4. From these rails, the script draws **directional Fib “ladders”**:
* For the **current ATR Fib**:
* The Fib is drawn from one anchor to the other depending on the trend sign.
* Rays are projected `Ray Length` bars to the right of `Current Offset`.
* For the **previous ATR Fib**:
* The last completed segment’s start/end rails are used as anchors
* Rays are projected using `Prev Fib Offset` and `Prev Fib Length`
#### Current ATR Fib controls
* `Enable ATR Fib` – toggles current ATR Fib bank
* `ATR Period`, `ATR Multiplier` – control the “engine” behind the rails and ST logic
* `Current Offset`, `Ray Length` – where and how far rays are drawn
* `Show Level Text`, `Show Price`, `Display % not ratio` – label style
* `Label Size (Current ATR Fib)` – for all current ATR Fib labels
Visual extras:
* `Plot Hi/Low Anchor Lines` – shows upper/lower rails
* `Plot ATR Trailing Stop` – shows clamped Supertrend as a continuous line
#### Previous ATR Fib controls
* `Enable Prev ATR Fib` – toggles previous segment ladders
* Independent `Prev Fib Offset`, `Prev Fib Length`
* Separate label controls:
* `Show Level Text (Prev)`
* `Show Price (Prev)`
* `Display % not ratio (Prev)`
* `Label Size (Previous ATR Fib)`
Use the **current ATR Fib** as your active trading “ladder” and the **previous ATR Fib** to track recently broken structure and potential retest zones.
---
### 5.3 Lookback Auto Fib — HH/LL-Driven Fib Bank, MTF + Manual Overrides
**Group:** `Lookback Auto Fib` + `Lookback Anchor Overrides`
This engine draws Fibs between **highest high** and **lowest low** within a given lookback window on a chosen timeframe.
#### How it works
1. Select higher timeframe:
* `Lookback Timeframe` (empty = chart timeframe)
2. Choose your range:
* `Lookback Bars` – number of bars on the selected TF to scan for extremes
3. Optionally allow look-ahead:
* `Look-ahead Bars (repainting)`
* `0` = no look-ahead (no forward info, no repainting)
* `>0` = uses `barmerge.lookahead_on` for forward-looking extremes (can repaint)
4. For that range, the script finds:
* Highest high + its bar offset
* Lowest low + its bar offset
5. Trend direction is determined by **which extreme is more recent**:
* Recent high → **down** direction (high → low)
* Recent low → **up** direction (low → high)
6. Manual direction overrides:
* `Force Uptrend` / `Force Downtrend` – override the auto decision
7. Manual anchor overrides:
* `Manual Anchor High (LB)`
* `Manual Anchor Low (LB)`
If both are set, those become the anchors and direction is deduced from which is higher.
8. The engine then draws a **directional Fib ladder**:
* Anchors between high/low based on direction
* Rays extend `Lookback Fib Length` bars from `Lookback Fib Offset`
#### Label controls
* `Show Level Text`, `Show Price`, `Display % not ratio`
* `Label Size (Lookback Fib)`
* Labels are prefixed with `LB` to distinguish them from ATR Fibs.
This engine is ideal for:
* **Swing structure mapping:** Drawing Fibs across the last major swing on the HTF.
* **Confluence:** Aligning Lookback Fibs with ATR Fibs, ATC channel boundaries, and VWAP bands.
---
### 5.4 Shared Fibonacci Levels — Fully Custom Fib Bank for Both Engines
**Group:** `Fibonacci Levels`
The ATR and Lookback engines **both** use the same Fib bank:
* **Ratios provided by default:**
* 0.000
* 0.146
* 0.236
* 0.382
* 0.500
* 0.618
* 0.650
* 0.707
* 0.786
* 0.886
* 1.000
* 1.130
* 1.272
* 1.618
* 2.000
Each ratio has its own:
* `Enable Level X.XXX`
* `Level X.XXX` (the actual ratio – fully editable)
* `Thickness X.XXX` (line width)
* `Style X.XXX` (Solid / Dashed / Dotted)
* `Color X.XXX` (line + label color)
Adjusting a level here **instantly updates both** ATR and Lookback ladders. This makes it very easy to:
* Run “standard” Fib sets for classic retracements
* Or define your **own Fib presets** (e.g., 0.25 / 0.5 / 0.75, or custom extension clusters)
---
## How to Use & Suggested Workflows
**Scalpers / 0DTE / Intraday:**
* Enable:
* MA/EMA pack (fast EMAs + one MTF slot)
* VWAP (Session anchor) + 1–2 VWAP bands + highlight fill
* ATR Auto Fib (current + previous)
* Optionally hide:
* Lookback Fibs
* Long-Term ATC (unless you want HTF bias on your intraday chart)
Use slope labels, VWAP angle %, and ATR Fib ladders to structure trades around pullbacks, mean reversion, and breakouts.
**Swing / Position traders:**
* Turn on:
* Long-Term ATC (with table)
* Short-Term ATC for swing structure
* Lookback Auto Fib on a higher timeframe (e.g., D on 4H chart)
* Keep VWAP anchored to Week or Month, and MA slots for key reference MAs.
Use ATC channels for **trend structure**, Lookback Fibs for **swing levels**, and long VWAPs for **value zones**.
---
## Final Notes & Disclaimer
* Works on **all symbols** and **all timeframes**, but some stats (like “Annualized Return”) are only meaningful on **daily/weekly** data.
* Some options (like Look-ahead mode for Lookback Fibs) can **repaint** on purpose. These are clearly labeled — use them only if you understand and want forward-looking behavior.
* This script does **not** place trades. It is a visual / analytical tool only.
* Nothing in this indicator or description is financial advice. Always do your own research, forward-test, and manage risk appropriately.
If you have **invite-only access** to **Dixsons Tackle Box**, you’re getting the full Dixson overlay stack in one place — designed to be the central “hub” for your chart, not just another line on it.

Smart Risk - Three Institutional Models📘 Smart Risk – Three Institutional Entry Models
A precision-engineered institutional framework that blends liquidity, structure, and multi-time-frame confirmation.
🧠 Concept Overview
The Smart Risk indicator models how institutional traders and algorithms engineer entries around liquidity, imbalance, and structural shifts .
It unifies t hree distinct institutional entry models —each built around core Smart Money Concepts (SMC)—and enhances them with a Multi-Time-Frame Confluence (MTF) engine for directional alignment.
This tool doesn’t simply merge indicators.
It connects l iquidity sweeps, order-block reactions, breaker validation, and fair-value-gap mitigation into one cohesive trading logic—filtering every setup through trend, structure, and volume confirmation.
⚙️ How It Works
Setup #1 – Liquidity Sweep + Order Block Revisit + FVG Mitigation
Identifies engineered stop-hunts where price sweeps external liquidity and returns to a prior Order Block or Fair Value Gap (FVG).
Signals reversal-style entries with high probability of mean-reversion or mitigation.
Setup #2 – Supply/Demand + Mitigation / Breaker / FVG Continuation
Captures continuation trades inside trending structure.
When trend bias (via moving-average context) aligns with breaker or mitigation blocks, signals confirm institutional continuation sequences.
Setup #3 – Sweep + Classic FVG Reaction
Tracks clean displacement gaps following a liquidity sweep—ideal for scalpers and intraday reversals where imbalances act as magnets for price.
Each setup can be independently enabled or disabled from the panel.
A built-in signal-cooldown prevents repetitive triggers on the same leg.
🕒 Multi-Time-Frame Confluence
The new MTF module aligns lower-time-frame precision entries with higher-time-frame market structure.
When enabled, each setup only validates if the HTF trend confirms the same directional bias as the LTF pattern—e.g. a 5-minute bullish FVG signal requires a bullish 1-hour structure.
This ensures institutional logic respects global liquidity flow and avoids counter-trend traps.
MTF Controls:
• ✅ Enable MTF Confluence toggle
• ⏱️ Lower Time-Frame (LTF) selector (default 5 min)
• ⏱️ Higher Time-Frame (HTF) selector (default 1 hour)
• 🔄 Automatic SMA-based HTF trend detection
🎨 Visualization & Dashboard
• Order Block / Supply–Demand Zones — highlight institutional footprints
• Fair Value Gaps (FVGs) — reveal displacement inefficiencies
• Liquidity Sweeps (X / $) — mark engineered stops
• BOS & CHoCH — confirm structure continuation or reversal
• Compact Dashboard — live “Armed” state for each setup and MTF bias
Color-coded background cues emphasize active trade phases without clutter.
🧩 Core Algorithm Highlights
• Dynamic swing and pivot structure detection
• Breaker / Mitigation / Volume confirmation filters
• Fair-Value-Gap logic with directional alignment
• Cooldown control for signal throttling
• Multi-Time-Frame bias filter for contextual precision
⸻
📈 How to Use
1. Apply indicator to any asset or timeframe.
2. Select which institutional setups you want active.
3. Optionally enable MTF Confluence (5 min → 1 hr recommended).
4. Wait for BOS/CHoCH confirmation + zone alignment before entry.
5. Use OB and FVG zones for entry/exit planning with risk management.
⸻
💡 Originality Statement
This script introduces a multi-layered institutional logic engine that merges liquidity, mitigation, and imbalance behavior into a unified framework—augmented with time-frame synchronization and signal-cooldown management.
All logic, calculations, and visualization structure were built from scratch for this model.
It is not a mash-up of existing public indicators and offers measurable analytical value through MTF-aware trade validation.
⸻
⚠️ Disclaimer
This tool is intended for educational and analytical purposes only.
It does not provide financial advice or guaranteed trading outcomes.
Always back-test, validate setups, and apply proper risk management.

Opening Range Breakout with Multi-Timeframe Liquidity]═══════════════════════════════════════
OPENING RANGE BREAKOUT WITH MULTI-TIMEFRAME LIQUIDITY
═══════════════════════════════════════
A professional Opening Range Breakout (ORB) indicator enhanced with multi-timeframe liquidity detection, trading session visualization, volume analysis, and trend confirmation tools. Designed for intraday trading with comprehensive alert system.
───────────────────────────────────────
WHAT THIS INDICATOR DOES
───────────────────────────────────────
This indicator combines multiple trading concepts:
- Opening Range Breakout (ORB) - Customizable time period detection with automatic high/low identification
- Multi-Timeframe Liquidity - HTF (Higher Timeframe) and LTF (Lower Timeframe) key level detection
- Trading Sessions - Tokyo, London, New York, and Sydney session visualization
- Volume Analysis - Volume spike detection and strength measurement
- Multi-Timeframe Confirmation - Trend bias from higher timeframes
- EMA Integration - Trend filter and dynamic support/resistance
- Smart Alerts - Quality-filtered breakout notifications
───────────────────────────────────────
HOW IT WORKS
───────────────────────────────────────
OPENING RANGE BREAKOUT (ORB):
Concept:
The Opening Range is a period at the start of a trading session where price establishes an initial high and low. Breakouts beyond this range often indicate the direction of the day's trend.
Detection Method:
- Default: 15-minute opening range (configurable)
- Custom Range: Set specific session times with timezone support
- Automatically identifies ORH (Opening Range High) and ORL (Opening Range Low)
- Tracks ORB mid-point for reference
Range Establishment:
1. Session starts (or custom time begins)
2. Tracks highest high and lowest low during the period
3. Range confirmed at end of opening period
4. Levels extend throughout the session
Breakout Detection:
- Bullish Breakout: Close above ORH
- Bearish Breakout: Close below ORL
- Mid-point acts as bias indicator
Visual Display:
- Shaded box during range formation
- Horizontal lines for ORH, ORL, and mid-point
- Labels showing level values
- Color-coded fills based on selected method
Fill Color Methods:
1. Session Comparison:
- Green: Current OR mid > Previous OR mid
- Red: Current OR mid < Previous OR mid
- Gray: Equal or first session
- Shows day-over-day momentum
2. Breakout Direction (Recommended):
- Green: Price currently above ORH (bullish breakout)
- Red: Price currently below ORL (bearish breakout)
- Gray: Price inside range (no breakout)
- Real-time breakout status
MULTI-TIMEFRAME LIQUIDITY:
Two-Tier System for comprehensive level identification:
HTF (Higher Timeframe) Key Liquidity:
- Default: 4H timeframe (configurable to Daily, Weekly)
- Identifies major institutional levels
- Uses pivot detection with adjustable parameters
- Suitable for swing highs/lows where large orders rest
LTF (Lower Timeframe) Key Liquidity:
- Default: 1H timeframe (configurable)
- Provides precision entry/exit levels
- Finer granularity for intraday trading
- Captures minor swing points
Calculation Method:
- Pivot high/low detection algorithm
- Configurable left bars (lookback) and right bars (confirmation)
- Timeframe multiplier for accurate multi-timeframe detection
- Automatic level extension
Mitigation System:
- Tracks when levels are swept (broken)
- Configurable mitigation type: Wick or Close-based
- Option to remove or show mitigated levels
- Display limit prevents chart clutter
Asset-Specific Optimization:
The indicator includes quick reference settings for different assets:
- Major Forex (EUR/USD, GBP/USD): Default settings optimal
- Crypto (BTC/ETH): Left=12, Right=4, Display=7
- Gold: HTF=1D, Left=20
TRADING SESSIONS:
Four Major Sessions with Full Customization:
Tokyo Session:
- Default: 04:00-13:00 UTC+4
- Asian trading hours
- Often sets daily range
London Session:
- Default: 11:00-20:00 UTC+4
- Highest liquidity period
- Major institutional activity
New York Session:
- Default: 16:00-01:00 UTC+4
- US market hours
- High-impact news events
Sydney Session:
- Default: 01:00-10:00 UTC+4
- Earliest Asian activity
- Lower volatility
Session Features:
- Shaded background boxes
- Session name labels
- Optional open/close lines
- Session high/low tracking with colored lines
- Each session has independent color settings
- Fully customizable times and timezones
VOLUME ANALYSIS:
Volume-Based Trade Confirmation:
Volume MA:
- Configurable period (default: 20)
- Establishes average volume baseline
- Used for spike detection
Volume Spike Detection:
- Identifies when volume exceeds MA * multiplier
- Default: 1.5x average volume
- Confirms breakout strength
Volume Strength Measurement:
- Calculates current volume as percentage of average
- Shows relative volume intensity
- Used in alert quality filtering
High Volume Bars:
- Identifies bars above 50th percentile
- Additional confirmation layer
- Indicates institutional participation
MULTI-TIMEFRAME CONFIRMATION:
Trend Bias from Higher Timeframes:
HTF 1 (Trend):
- Default: 1H timeframe
- Uses EMA to determine intermediate trend
- Compares current timeframe EMA to HTF EMA
HTF 2 (Bias):
- Default: 4H timeframe
- Uses 50 EMA for longer-term bias
- Confirms overall market direction
Bias Classifications:
- Bullish Bias: HTF close > HTF 50 EMA AND Current EMA > HTF1 EMA
- Bearish Bias: HTF close < HTF 50 EMA AND Current EMA < HTF1 EMA
- Neutral Bias: Mixed signals between timeframes
EMA Stack Analysis:
- Compares EMA alignment across timeframes
- +1: Bullish stack (lower TF EMA > higher TF EMA)
- -1: Bearish stack (lower TF EMA < higher TF EMA)
- 0: Neutral/crossed
Usage:
- Filters false breakouts
- Confirms trend direction
- Improves trade quality
EMA INTEGRATION:
Dynamic EMA for Trend Reference:
Features:
- Configurable period (default: 20)
- Customizable color and width
- Acts as dynamic support/resistance
- Trend filter for ORB trades
Application:
- Above EMA: Favor long breakouts
- Below EMA: Favor short breakouts
- EMA cross: Potential trend change
- Distance from EMA: Momentum gauge
SMART ALERT SYSTEM:
Quality-Filtered Breakout Notifications:
Alert Types:
1. Standard ORB Breakout
2. High Quality ORB Breakout
Quality Criteria:
- Volume Confirmation: Volume > 1.2x average
- MTF Confirmation: Bias aligned with breakout direction
Standard Alert:
- Basic breakout detection
- Price crosses ORH or ORL
- Icon: 🚀 (bullish) or 🔻 (bearish)
High Quality Alert:
- Both volume AND MTF confirmed
- Stronger probability setup
- Icon: 🚀⭐ (bullish) or 🔻⭐ (bearish)
Alert Information Includes:
- Alert quality rating
- Breakout level and current price
- Volume strength percentage (if enabled)
- MTF bias status (if enabled)
- Recommended action
One Alert Per Bar:
- Prevents alert spam
- Uses flag system to track sent alerts
- Resets on new ORB session
───────────────────────────────────────
HOW TO USE
───────────────────────────────────────
OPENING RANGE SETUP:
Basic Configuration:
1. Select time period for opening range (default: 15 minutes)
2. Choose fill color method (Breakout Direction recommended)
3. Enable historical data display if needed
Custom Range (Advanced):
1. Enable Custom Range toggle
2. Set specific session time (e.g., 0930-0945)
3. Select appropriate timezone
4. Useful for specific market opens (NYSE, LSE, etc.)
LIQUIDITY LEVELS SETUP:
Quick Configuration by Asset:
- Forex: Use default settings (Left=15, Right=5)
- Crypto: Set Left=12, Right=4, Display=7
- Gold: Set HTF=1D, Left=20
HTF Liquidity:
- Purpose: Major support/resistance levels
- Recommended: 4H for day trading, 1D for swing trading
- Use as profit targets or reversal zones
LTF Liquidity:
- Purpose: Entry/exit refinement
- Recommended: 1H for day trading, 4H for swing trading
- Use for position management
Mitigation Settings:
- Wick-based: More sensitive (default)
- Close-based: More conservative
- Remove or Show mitigated levels based on preference
TRADING SESSIONS SETUP:
Enable/Disable Sessions:
- Master toggle for all sessions
- Individual session controls
- Show/hide session names
Session High/Low Lines:
- Enable to see session extremes
- Each session has custom colors
- Useful for range trading
Customization:
- Adjust session times for your broker
- Set timezone to match your location
- Customize colors for visibility
VOLUME ANALYSIS SETUP:
Enable Volume Analysis:
1. Toggle on Volume Analysis
2. Set MA length (20 recommended)
3. Adjust spike multiplier (1.5 typical)
Usage:
- Confirm breakouts with volume
- Identify climactic moves
- Filter false signals
MULTI-TIMEFRAME SETUP:
HTF Selection:
- HTF 1 (Trend): 1H for day trading, 4H for swing
- HTF 2 (Bias): 4H for day trading, 1D for swing
Interpretation:
- Trade only with bias alignment
- Neutral bias: Be cautious
- Bias changes: Potential reversals
EMA SETUP:
Configuration:
- Period: 20 for responsive, 50 for smoother
- Color: Choose contrasting color
- Width: 1-2 for visibility
Usage:
- Filter trades: Long above, Short below
- Dynamic support/resistance reference
- Trend confirmation
ALERT SETUP:
TradingView Alert Creation:
1. Enable alerts in indicator settings
2. Enable ORB Breakout Alerts
3. Right-click chart → Add Alert
4. Select this indicator
5. Choose "Any alert() function call"
6. Configure delivery method (mobile, email, webhook)
Alert Filtering:
- All alerts include quality rating
- High Quality alerts = Volume + MTF confirmed
- Standard alerts = Basic breakout only
───────────────────────────────────────
TRADING STRATEGIES
───────────────────────────────────────
CLASSIC ORB STRATEGY:
Setup:
1. Wait for opening range to complete
2. Price breaks and closes above ORH or below ORL
3. Volume > average (if enabled)
4. MTF bias aligned (if enabled)
Entry:
- Bullish: Buy on break above ORH
- Bearish: Sell on break below ORL
- Consider retest entries for better risk/reward
Stop Loss:
- Bullish: Below ORL or range mid-point
- Bearish: Above ORH or range mid-point
- Adjust based on volatility
Targets:
- Initial: Range width extension (ORH + range width)
- Secondary: HTF liquidity levels
- Final: Session high/low or major support/resistance
ORB + LIQUIDITY CONFLUENCE:
Enhanced Setup:
1. Opening range established
2. HTF liquidity level near or beyond ORH/ORL
3. Breakout occurs with volume
4. Price targets the liquidity level
Entry:
- Enter on ORB breakout
- Target the HTF liquidity level
- Use LTF liquidity for position management
Management:
- Partial profits at ORB + range width
- Move stop to breakeven at LTF liquidity
- Final exit at HTF liquidity sweep
ORB REJECTION STRATEGY (Counter-Trend):
Setup:
1. Price breaks above ORH or below ORL
2. Weak volume (below average)
3. MTF bias opposite to breakout
4. Price closes back inside range
Entry:
- Failed bullish break: Short below ORH
- Failed bearish break: Long above ORL
Stop Loss:
- Beyond the failed breakout level
- Or beyond session extreme
Target:
- Opposite end of opening range
- Range mid-point for partial profit
SESSION-BASED ORB TRADING:
Tokyo Session:
- Typically narrower ranges
- Good for range trading
- Wait for London open breakout
London Session:
- Highest volume and volatility
- Strong ORB setups
- Major liquidity sweeps common
New York Session:
- Strong trending moves
- News-driven volatility
- Good for momentum trades
Sydney Session:
- Quieter conditions
- Suitable for range strategies
- Sets up Tokyo session
EMA-FILTERED ORB:
Rules:
- Only take bullish breaks if price > EMA
- Only take bearish breaks if price < EMA
- Ignore counter-trend breaks
Benefits:
- Reduces false signals
- Aligns with larger trend
- Improves win rate
───────────────────────────────────────
CONFIGURATION GUIDE
───────────────────────────────────────
OPENING RANGE SETTINGS:
Time Period:
- 15 min: Standard for most markets
- 30 min: Wider range, fewer breakouts
- 60 min: For slower markets or swing trades
Custom Range:
- Use for specific market opens
- NYSE: 0930-1000 EST
- LSE: 0800-0830 GMT
- Set timezone to match exchange
Historical Display:
- Enable: See all previous session data
- Disable: Cleaner chart, current session only
LIQUIDITY SETTINGS:
Left Bars (5-30):
- Lower: More frequent, sensitive levels
- Higher: Fewer, more significant levels
- Recommended: 15 for most markets
Right Bars (1-25):
- Confirmation period
- Higher: More reliable, less frequent
- Recommended: 5 for balance
Display Limit (1-20):
- Number of active levels shown
- Higher: More context, busier chart
- Recommended: 7 for clarity
Extension Options:
- Short: Levels visible near formation
- Current: Extended to current bar (recommended)
- Max: Extended indefinitely
VOLUME SETTINGS:
MA Length (5-50):
- Shorter: More responsive to spikes
- Longer: Smoother baseline
- Recommended: 20 for balance
Spike Multiplier (1.0-3.0):
- Lower: More sensitive spike detection
- Higher: Only extreme spikes
- Recommended: 1.5 for day trading
MULTI-TIMEFRAME SETTINGS:
HTF 1 (Trend):
- 5m chart: Use 15m or 1H
- 15m chart: Use 1H or 4H
- 1H chart: Use 4H or 1D
HTF 2 (Bias):
- One level higher than HTF 1
- Provides longer-term context
- Don't use same as HTF 1
EMA SETTINGS:
Length:
- 20: Responsive, more signals
- 50: Smoother, stronger filter
- 200: Long-term trend only
Style:
- Choose contrasting color
- Width 1-2 for visibility
- Match your trading style
───────────────────────────────────────
BEST PRACTICES
───────────────────────────────────────
Chart Timeframe Selection:
- ORB Trading: Use 5m or 15m charts
- Session Review: Use 1H or 4H charts
- Swing Trading: Use 1H or 4H charts
Quality Over Quantity:
- Wait for high-quality alerts (volume + MTF)
- Avoid trading every breakout
- Focus on confluence setups
Risk Management:
- Position size based on range width
- Wider ranges = smaller positions
- Use stop losses always
- Take partial profits at targets
Market Conditions:
- Best results in trending markets
- Reduce position size in choppy conditions
- Consider session overlaps for volatility
- Avoid trading near major news if inexperienced
Continuous Improvement:
- Track win rate by session
- Note which confluence factors work best
- Adjust settings based on market volatility
- Review performance weekly
───────────────────────────────────────
PERFORMANCE OPTIMIZATION
───────────────────────────────────────
This indicator is optimized with:
- max_bars_back declarations for efficient processing
- Conditional calculations based on enabled features
- Proper memory management for drawing objects
- Minimal recalculation on each bar
Best Practices:
- Disable unused features (sessions, MTF, volume)
- Limit historical display to reduce rendering
- Use appropriate timeframe for your strategy
- Clear old drawing objects periodically
───────────────────────────────────────
EDUCATIONAL DISCLAIMER
───────────────────────────────────────
This indicator combines established trading concepts:
- Opening Range Breakout theory (price action)
- Liquidity level detection (pivot analysis)
- Session-based trading (time-of-day patterns)
- Volume analysis (confirmation technique)
- Multi-timeframe analysis (trend alignment)
All calculations use standard technical analysis methods:
- Pivot high/low detection algorithms
- Moving averages for trend and volume
- Session time filtering
- Timeframe security functions
The indicator identifies potential trading setups but does not predict future price movements. Success requires proper application within a complete trading strategy including risk management, position sizing, and market context.
───────────────────────────────────────
USAGE DISCLAIMER
───────────────────────────────────────
This tool is for educational and analytical purposes. Opening Range Breakout trading involves substantial risk. The alert system and quality filters are designed to identify potential setups but do not guarantee profitability. Always conduct independent analysis, use proper risk management, and never risk capital you cannot afford to lose. Past performance does not indicate future results. Trading intraday breakouts requires experience and discipline.
───────────────────────────────────────
CREDITS & ATTRIBUTION
───────────────────────────────────────
ORIGINAL SOURCE:
This indicator builds upon concepts from LuxAlgo's-ORB

3CRGANG - CANDLE CLOSE TIMER3CRGANG - CANDLE CLOSE TIMER
This indicator displays a timer for the current candle’s close and a multi-timeframe (MTF) timer table, showing the time remaining for various timeframes. It supports customizable timezones, visualization settings, and alerts for new candle openings and pre-close notifications, with filters for trading sessions and holidays.
Features:
Candle Timer: Displays the time remaining until the current candle closes, with color-coded visuals based on candle direction (green for up, red for down, gold when nearing close).
MTF Timer Table: Shows time remaining for multiple timeframes (M5, M15, M30, H1, H4, D, W, M, Q, Y) with a gradient-colored progress bar (green to red as time decreases).
Timezone Support: Choose from a wide range of timezones to align timer and alerts with your local time.
Visualization Options: Select device template (Desktop, Tablet, Mobile) and color theme (Light or Dark) for optimal display.
Alerts: Configurable alerts for new candle openings and pre-close thresholds across multiple timeframes, with session and holiday filters.
Session and Holiday Filters: Supports major exchanges (NYSE, LSE, FSE, SSX, TSE, HKSE) with holiday schedules and half-day considerations.
Do Not Disturb (DND): Set DND periods to suppress alerts during specific hours.
Time Settings:
Timezone: Select from a list of global timezones (e.g., UTC+3 Jerusalem, UTC-4 New York).
Time Format: Choose between Standard (12-hour with AM/PM) or Military (24-hour) time.
Visualization Setup:
Device: Select Desktop, Tablet, or Mobile template to adjust table sizes.
Color Theme: Choose Light or Dark theme for visual elements.
Timer Dashboard:
Timer Table Position: Set the position of the main timer table (e.g., top-right, bottom-center).
MTF Timer Dashboard:
Hide MTF Timer Table: Toggle visibility (off by default on Mobile template).
MTF Timer Table Position: Set position for the MTF timer table.
Offset Table Position: Adjust the Y-axis offset for the MTF table.
Notifications Settings:
Enable Alerts: Toggle alerts for Yearly, Quarterly, Monthly, Weekly, Daily, H4, H1, M30, and M15 timeframes.
Pre-Alert Threshold: Set the percentage of candle duration remaining for pre-close alerts (0–100%).
DND Settings:
Weekend Alerts: Enable/disable alerts during weekends.
DND Mode: Set start and end times for suppressing alerts.
Session Alerts Filter:
Holiday Alerts: Enable/disable alerts on exchange holidays.
Exchange Alerts: Toggle alerts for NYSE, LSE, FSE, SSX, TSE, and HKSE sessions.
Notes:
The indicator supports various asset types (stocks, forex, futures, crypto, commodities, indices) with tailored session detection.
The MTF timer table is hidden on Mobile template by default to optimize screen space.
Alerts respect user-defined session filters, holiday schedules, and DND settings for major exchanges.
Ensure sufficient chart history for accurate timeframe calculations.
Use the settings to customize timer display, alert behavior, and session filters to match your trading strategy.

SMC Analysis - Fair Value Gaps (Enhanced)SMC Analysis - Fair Value Gaps (Enhanced) Script Summary
Overview
The "SMC Analysis - Fair Value Gaps (Enhanced)" script, written in Pine Script (version 6), is a technical analysis indicator designed for TradingView to identify and visualize Fair Value Gaps (FVGs) on a price chart. It supports both the main timeframe and multiple higher timeframes (MTF) for comprehensive market analysis. FVGs are price gaps formed by a three-candle pattern, indicating potential areas of market inefficiency where price may return to fill the gap.
Key Features
FVG Detection:
Identifies bullish FVGs: Occur when the high of a candle two bars prior is lower than the low of the current candle, with the middle candle being bullish (close > open).
Identifies bearish FVGs: Occur when the low of a candle two bars prior is higher than the high of the current candle, with the middle candle being bearish (close < open).
Visualizes FVGs as colored boxes on the chart (green for bullish, red for bearish).
Mitigation Tracking:
Tracks when FVGs are touched (price overlaps the gap range) or mitigated (price fully closes the gap).
Strict Mode: Marks an FVG as mitigated when price touches the gap range.
Normal Mode: Requires a full breakthrough (price crossing the gap’s bottom for bullish FVGs or top for bearish FVGs) for mitigation.
Optionally converts FVG box borders to dashed lines and increases transparency when partially touched.
Multi-Timeframe (MTF) Support:
Analyzes FVGs on three user-defined higher timeframes (default: 15m, 60m, 240m).
Displays MTF FVGs with distinct labels and slightly more transparent colors.
Ensures no duplicate processing of MTF bars to maintain performance.
Customization Options:
FVG Length: Adjustable duration for how long FVGs are displayed (default: 20 bars).
Show/Hide FVGs: Toggle visibility for main timeframe and each MTF.
Color Customization: User-defined colors for bullish and bearish FVGs (default: green and red).
Display Options: Toggle for showing dashed lines after partial touches and strict mitigation mode.
Performance Optimization:
Limits the number of displayed boxes (50 for main timeframe, 20 per MTF) to prevent performance issues.
Automatically removes older boxes to maintain a clean chart.
Functionality
Visualization: Draws boxes around detected FVGs, with customizable colors and text labels ("FVG" for main timeframe, "FVG " for MTF).
Dynamic Updates: Extends or terminates FVG boxes based on mitigation status and user settings.
Efficient Storage: Uses arrays to manage FVG data (boxes, tops, bottoms, indices, mitigation status, and touch status) separately for main and MTF analyses.
Use Case
This indicator is designed for traders using Smart Money Concepts (SMC) to identify areas of market inefficiency (FVGs) for potential price reversals or continuations. The MTF support allows analysis across different timeframes, aiding in confirming trends or spotting higher-timeframe support/resistance zones.

GOD Complex Analysis Table By QTX Algo SystemsGOD Complex Analysis Table by QTX Algo Systems
Overview
The GOD Complex Analysis Table is a powerful visual companion for traders using the GOD Complex ecosystem. It displays detailed confluence scores for each trade type (Reversal Long, Reversal Short, Continuation Long, Continuation Short), offering a breakdown of required vs. extra signals, as well as multi-timeframe (MTF) scores and bias.
This tool is designed to help discretionary traders better understand how multiple conditions across timeframes align to support high-quality trade setups. It is not a standalone signal generator but rather an advanced diagnostic table that reveals the logic driving the GOD Complex entries.
How It Works
Each row in the table represents a trade type (e.g., Reversal Long), and includes:
Required Score – Based on must-have conditions for that trade type (e.g., oversold levels, statistical extremes, key momentum shifts).
Extra Score – Bonus confluence points from higher timeframe agreement, slope shifts, or secondary confirmation indicators.
Total Score – Combined Required + Extra score (max 200), useful for comparing relative strength across trade types.
Breakdown Columns – Show exactly which conditions are currently satisfied or missing, categorized as Required or Extra.
MTF Scores – Score-based analysis across 5m to 1M timeframes, highlighting how confluence changes with zoomed-out perspectives.
MTF Bias Row – Net bullish vs. bearish confluence per timeframe (positive = green, negative = red).
Indicators Used (All Proprietary QTX Tools)
VBM (Volatility-Based Momentum): Confirms directional trend and volatility environment.
VBSMI (Volatility-Based SMI): Adapts momentum oscillator based on market conditions and tilt logic.
SEA (Statistically Extreme Areas): Identifies when price reaches statistically rare volatility/range zones.
SPB (Statistical Price Bands): Tracks dynamically adjusted support/resistance based on percentile deviation.
COI (Continuation Opportunity Indicator): Detects pullback exhaustion and momentum re-acceleration opportunities.
Each trade type (Reversal or Continuation) is scored based on these tools across local and higher timeframes.
Key Table Features
🔍 Reversal Scoring Logic
Reversal trades must meet key oversold/overbought criteria (e.g., VBSMI extremes, SEA/SPB triggers) and be supported by trend weakness or exhaustion in the COI/VBM logic. High confluence across timeframes boosts the score.
📈 Continuation Scoring Logic
Continuations require strong trend alignment (VBM, COI), confirmation of momentum (VBSMI cross + slope), and lack of statistical extremes (no SEA/SPB hits). HTF agreement increases the score further.
🧠 Multi-Timeframe (MTF) Scoring
MTF scores are generated by evaluating each trade type’s core confluence across timeframes (e.g., 5m, 1H, 1D, etc.). This helps traders gauge how well a setup aligns with the broader market structure.
📊 Bias Coloring
The MTF Bias row shows net directional strength. Green = bullish bias. Red = bearish bias. Gray = neutral.
🔎 Factors Breakdown
View factors for each trade type. These factors explain which required and extra conditions are currently contributing or missing.
Customization Options
Table position (top/bottom, left/right)
Table size (small, medium, large)
Show/hide trade type rows
Enable/disable breakdown details
Toggle MTF Score section
Use Cases
Analyze high-confluence setups for discretionary trade planning
Cross-check live trades to understand setup quality
Confirm MTF alignment before entries
Study historical patterns to build intuition and strategy
Disclaimer
This indicator is for educational purposes only. It does not provide financial advice or trade recommendations. Always backtest and validate strategies before use.
CVD Smart ReversalCVD Smart Reversal - Indicator Description
═══════════════════════════════════════════════════════════════
🎯 OVERVIEW
Advanced reversal detection system based on Cumulative Volume Delta (CVD) analysis with intelligent quality filtering. Each signal is rated 1-5 stars based on multiple confirmation factors.
═══════════════════════════════════════════════════════════════
🌟 KEY FEATURES
1. Quality Score System (⭐1-5)
• 5 independent criteria evaluate each signal
• Filter weak setups - show only 3+ star signals
• Higher scores = higher probability setups
2. Adaptive Thresholds
• Automatically adjusts to market volatility
• High volatility = stricter criteria
• Works across all market conditions
3. Volume Context Analysis
• Compares current vs historical volume
• Calculates buy/sell pressure (requires >60%)
• Filters reversals with weak volume
4. Multi-Timeframe Confirmation (Optional)
• Validates signals on higher timeframe
• Ensures trading with the trend
• Reduces counter-trend entries
5. Smart Signal Management
• Minimum 5-bar spacing between signals
• Automatic label cleanup (max 20)
• Clean chart, no clutter
═══════════════════════════════════════════════════════════════
📊 HOW IT WORKS
CVD Calculation:
Custom volume delta calculation using intrabar polarity estimation.
Signal Detection:
Combines CVD reversal, candlestick patterns (Hammer, Shooting Star, Engulfing, Pin Bar), and divergence analysis.
Quality Scoring:
Each signal scores 0-5 points based on:
• CVD strength (statistical deviation)
• Pattern quality (professional recognition)
• Divergence presence
• Volume context (ratio + pressure)
• Trend confirmation (MTF or acceleration)
═══════════════════════════════════════════════════════════════
🎮 USAGE MODES
Sniper Mode (High Quality):
• Min Score: 4-5 stars
• MTF: ON
• Result: 2-5 signals/day, highest win-rate
Active Mode (Balanced):
• Min Score: 3 stars
• MTF: OFF
• Result: 5-15 signals/day, good balance
Scalping Mode (High Frequency):
• Min Score: 2 stars
• Divergence: Weak
• Result: Many signals, fast execution needed
═══════════════════════════════════════════════════════════════
💡 BEST PRACTICES
• Use on liquid markets with reliable volume data
• Combine with key support/resistance levels
• Pay attention to quality scores - 4-5★ have significantly higher success
• Enable MTF confirmation for intraday trading
• Use stricter settings during high-impact news events
═══════════════════════════════════════════════════════════════
⚙️ DEFAULT SETTINGS
• Quality Filter: ON
• Minimum Score: 3 stars
• MTF Confirmation: OFF
• Volume Analysis: ON
• Divergence Strength: Medium
These settings provide 5-15 quality signals per day on active instruments.
═══════════════════════════════════════════════════════════════
🔔 ALERTS
Four alert types available:
• Strong Bullish Reversal (4-5★ only)
• Strong Bearish Reversal (4-5★ only)
• Regular Bullish Reversal (all qualified)
• Regular Bearish Reversal (all qualified)
═══════════════════════════════════════════════════════════════
⚠️ LIMITATIONS
• Requires volume data (not suitable for markets without volume)
• MTF confirmation adds lag by design
• Lower timeframes may need adjusted settings
• Quality filter reduces signal frequency by design
═══════════════════════════════════════════════════════════════
🎯 ORIGINALITY
This indicator combines multiple unique elements:
• Multi-factor quality scoring (not found in other CVD tools)
• Adaptive volatility-based thresholds
• Volume pressure calculation with directional filter
• Integrated MTF confirmation within scoring system
• Smart label management with automatic cleanup
The quality scoring system transforms CVD analysis from binary signals into a ranked opportunity system, allowing traders to prioritize setups based on confluence strength.
═══════════════════════════════════════════════════════════════
📈 DISPLAY ELEMENTS
• Background highlighting on signal bars
• Triangle markers at entry points
• Labels showing CVD, Delta, Divergence, Quality Score, Volume flag
• Real-time info panel with CVD metrics
• Clean visual presentation
═══════════════════════════════════════════════════════════════
✅ SUITABLE FOR
• Crypto (BTC, ETH, etc.)
• Stocks (AAPL, TSLA, SPY, etc.)
• Futures (ES, NQ, CL, etc.)
• Forex (brokers with volume data)
• All timeframes (1m to 1D)
═══════════════════════════════════════════════════════════════

Smart Liquidity 📊 # 💎 Smart Liquidity Indicator - User Guide
## 📋 Overview
**Smart Liquidity Indicator** is an advanced technical analysis tool for analyzing liquidity and volume in financial markets. It combines several powerful analytical tools to help you make informed trading decisions.
---
## 🎯 Main Components
### 1. 📊 Volume Profile
- **Function**: Displays volume distribution across different price levels
- **Benefit**: Identify strong support and resistance zones based on trading activity
- **Elements**:
- Colored boxes representing volume density at each level
- Labels showing HIGH/LOW of the price range
- PEAK FLOW line indicating the strongest volume level
### 2. 📦 Order Blocks
- **Function**: Identify bullish and bearish Order Block zones
- **Benefit**: Potential areas for price reversal or trend continuation
- **Displayed Information**:
- Delta %: Zone strength (difference between buying and selling pressure)
- Liquidity: Accumulated liquidity in the zone
- Buy/Sell ratios within the zone
### 3. 📈 SuperTrend (Market Direction)
- **Two lines for confirmation**:
- **🎯 Current SuperTrend** (Green/Red): Current timeframe direction
- **🔄 MTF SuperTrend** (Light Green/Red): Higher timeframe direction (4H default)
- **Benefit**: Trade with the overall market trend
### 4. 📊 Dashboard (Information Panel)
- Display current market status
- Trend and momentum information
- Active Order Blocks statistics
---
## 🚀 How to Use
### 1️⃣ **Reading Volume Profile**
- **Dense boxes** = High volume accumulation areas = Strong support/resistance
- **PEAK FLOW line** = Strongest price level (POC - Point of Control)
- **HIGH/LOW Labels** = Boundaries of the analyzed price range
### 2️⃣ **Analyzing Order Blocks**
- **Positive Delta (+)** = Strong buying pressure → Reliable bullish zone
- **Negative Delta (-)** = Strong selling pressure → Reliable bearish zone
- **Delta near 0** = Balance → Weak zone, avoid it
### 3️⃣ **Using SuperTrend**
- **Current TF (Green bullish / Red bearish)**: Current timeframe direction
- **MTF (Light Green bullish / Light Red bearish)**: Higher timeframe direction
- **Best Trading**: When both lines agree on the same direction
### 4️⃣ **Suggested Strategy**
```
✅ Strong Entry Signal:
1. Order Block with strong Delta (>30% or <-30%)
2. Current SuperTrend and MTF in the same direction
3. Volume Profile confirms the level (dense box or PEAK)
4. Price tests the zone for the first time
❌ Avoid Entry When:
- Weak Delta (between -10% and +10%)
- Conflict between Current and MTF SuperTrend
- Zone tested multiple times (weakened)
```
---
## 🎨 Understanding Colors
### Order Blocks
- 🟢 **Green**: Bullish Order Block
- 🔴 **Red**: Bearish Order Block
### SuperTrend
- 🟢 **Green**: Current SuperTrend bullish (same color as Order Blocks)
- 🔴 **Red**: Current SuperTrend bearish (same color as Order Blocks)
- 🟢 **Light Green**: MTF SuperTrend bullish
- 🔴 **Light Red**: MTF SuperTrend bearish
**Note**: Each SuperTrend has different transparency levels based on trend strength
### Volume Profile
- **Gradient from light to dark**: Represents volume density (darker = higher volume)
---
## ⚡ Performance Tips
### For Maximum Speed (Current Settings):
✅ **Enabled**:
- Order Blocks: 2 zones per side
- Volume Profile: 20 levels
- SuperTrends: Both active
- Strength Delta: Displayed
❌ **Disabled** (for speed):
- Gradient Fill
- Predictive Zones
- Background Fill
- MTF Calculations (in internal calculations)
### If Indicator is Slow:
1. Reduce `Profile Rows` from 20 → 15
2. Reduce `Lookback Period` from 50 → 40
3. Reduce `Max Zones` from 2 → 1
4. Turn off `Show OB Labels` if not needed
---
## 🔄 Additional Tools
### ♻️ Reset Now
- **Location**: Visual Tweaks
- **Usage**: If Volume Profile is cluttered, enable it to redraw
- **Note**: Disable after use
### 🎯 Draw Mode
- **Live**: Direct drawing on the last candle
- **Confirmed**: Draw only on closed candles (more stable)
---
## ⚠️ Disclaimer
### 🚨 Important Notice
**This indicator is a technical analysis tool only and is not considered financial advice or a trading recommendation.**
#### 📌 Please Note:
1. **Just an Analytical Tool**:
- The indicator provides technical information based on historical data
- Past results do not guarantee future results
2. **Personal Responsibility**:
- You are solely responsible for your own trading decisions
- Conduct your own research before making any investment decision
- Use appropriate risk management (Stop Loss, Position Sizing)
3. **No Guarantees**:
- There is no guarantee of profit or success in trading
- Financial markets carry high risks
- You may lose your entire invested capital
4. **Consult a Professional**:
- Consult a licensed financial advisor before making important investment decisions
- Ensure you fully understand the risks associated with trading
5. **Proper Use**:
- The indicator is designed as an assistive tool, not an automated trading system
- Preferably combine it with your own analysis and other tools
- Do not rely on a single signal alone
#### ⚖️ Acceptance:
By using this indicator, you acknowledge and agree that:
- The indicator developer is not responsible for any financial losses
- All trading decisions are your personal responsibility
- You understand the risks associated with trading in financial markets
---
## 💡 Final Advice
**"The best traders use tools wisely, not blindly"**
- Learn how the indicator works before relying on it
- Test settings on a demo account first
- Always use Stop Loss
- Don't risk more than you can afford to lose
---
## 📞 Contact and Support
**If you need any help or have any questions, feel free to contact me.**
I'm here to help you understand and use the indicator correctly! 🤝
---
**Good Luck & Trade Safe! 🚀📈**

SuperTrend Cyan — Split ST & Triple Bands (A/B/C)SuperTrend Cyan — Split ST & Triple Bands (A/B/C)
✨ Concept:
The SuperTrend Cyan indicator expands the classical SuperTrend logic into a split-line + triple-band visualization for clearer structure and volatility mapping.
Instead of a single ATR-based line, this tool separates SuperTrend direction from volatility envelopes (A/B/C), providing a layered view of both regime and range compression.
✨ The design goal:
Preserve the simplicity of SuperTrend
Add volatility context via multi-band envelopes
Provide a compact MTF (Multi-Timeframe) summary for broader trend alignment
✨ How It Works
1. SuperTrend Core (Active & Opposite Lines)
Uses ATR-based bands (Factor × ATR-Length).
Active SuperTrend is plotted according to current regime.
Opposite SuperTrend (optional) shows potential reversal threshold.
2. Triple Band System (A/B/C)
Each band (A, B, C) scales from the median price (hl2) by different ATR multipliers.
A: Outer band (wider, long-range context)
B: Inner band (mid-range activity)
C: Core band (closest to price, short-term compression)
Smoothness can be controlled with EMA.
Uptrend fills are lime-toned, downtrend fills are red-toned, with adjustable opacity (gap intensity).
3. Automatic Directional Switch
When the regime flips from up → down (or vice versa), the overlay automatically switches between lower and upper bands for a clean transition.
4. Multi-Timeframe SuperTrend Table
Displays SuperTrend direction across 5m, 15m, 1h, 4h, and 1D frames.
Green ▲ = Uptrend, Red ▼ = Downtrend.
Useful for checking cross-timeframe trend alignment.
✨ How to Read It
Green SuperTrend + Lime Bands
- Uptrend regime; volatility expanding upward
Red SuperTrend + Red Bands
- Downtrend regime; volatility expanding downward
Narrow gaps (A–C)
- Low volatility / compression (potential squeeze)
Wide gaps
- High volatility / active trend phase
Opposite ST line close to price
- Early warning for regime transition
✨ Practical Use
Identify trend direction (SuperTrend color & line position).
Assess volatility conditions (band width and gap transparency).
Watch for MTF alignment: consistent up/down signals across 1h–4h–1D = strong structural trend.
Combine with momentum indicators (e.g., RSI, DFI, PCI) for confirmation of trend maturity or exhaustion.
✨ Customization Tips
ST Factor / ATR Length
- Adjust sensitivity of SuperTrend direction changes
Band ATR Length
- Controls overall smoothness of volatility envelopes
Band Multipliers (A/B/C)
- Define how wide each volatility band extends
Gap Opacity
- Affects visual contrast between layers
MTF Table
- Enable/disable multi-timeframe display
✨ Educational Value
This script visualizes the interaction between trend direction (SuperTrend) and volatility envelopes, helping traders understand how price reacts within layered ATR zones.
It also introduces a clean MTF (multi-timeframe) perspective — ideal for discretionary and system traders alike.
✨ Disclaimer
This indicator is provided for educational and research purposes only.
It does not constitute financial advice or a trading signal.
Use at your own discretion and always confirm with additional tools.
───────────────────────────────
📘 한국어 설명 (Korean translation below)
───────────────────────────────
✨개념
SuperTrend Cyan 지표는 기존의 SuperTrend를 확장하여,
추세선 분리(Split Line) + 3중 밴드 시스템(Triple Bands) 으로
시장의 구조적 흐름과 변동성 범위를 동시에 시각화합니다.
단순한 SuperTrend의 강점을 유지하면서도,
ATR 기반의 A/B/C 밴드를 통해 변동성 압축·확장 구간을 직관적으로 파악할 수 있습니다.
✨ 작동 방식
1. SuperTrend 코어 (활성/반대 라인)
ATR×Factor를 기반으로 추세선을 계산합니다.
현재 추세 방향에 따라 활성 라인이 표시되고, “Show Opposite” 옵션을 켜면 반대편 경계선도 함께 보입니다.
2. 트리플 밴드 시스템 (A/B/C)
hl2(중간값)를 기준으로 ATR 배수에 따라 세 개의 밴드를 계산합니다.
A: 외곽 밴드 (가장 넓고 장기 구조 반영)
B: 중간 밴드 (중기적 움직임)
C: 코어 밴드 (가격에 가장 근접, 단기 변동성 반영)
EMA 스무딩으로 부드럽게 조정 가능.
업트렌드 구간은 라임색, 다운트렌드는 빨간색 음영으로 표시됩니다.
3. 자동 전환 시스템
추세가 전환될 때(Up ↔ Down), 밴드 오버레이도 자동으로 교체되어 깔끔한 시각적 구조를 유지합니다.
4. MTF SuperTrend 테이블
5m / 15m / 1h / 4h / 1D 프레임별 SuperTrend 방향을 표시합니다.
초록 ▲ = 상승, 빨강 ▼ = 하락.
복수 타임프레임 정렬 확인용으로 유용합니다.
✨ 해석 방법
초록 SuperTrend + 라임 밴드
- 상승 추세 및 확장 구간
빨강 SuperTrend + 레드 밴드
- 하락 추세 및 확장 구간
밴드 폭이 좁음
- 변동성 축소 (스퀴즈)
밴드 폭이 넓음
- 변동성 확장, 추세 강화
반대선이 근접
- 추세 전환 가능성 높음
✨ 활용 방법
SuperTrend 색상으로 추세 방향을 확인
A/B/C 밴드 폭으로 변동성 수준을 판단
MTF 테이블을 통해 복수 타임프레임 정렬 여부 확인
RSI, DFI, PCI 등 다른 지표와 함께 활용 시, 추세 피로·모멘텀 변화를 조기에 파악 가능
✨ 교육적 가치
이 스크립트는 추세 구조(SuperTrend) 와 변동성 레이어(ATR Bands) 의 상호작용을
시각적으로 학습하기 위한 교육용 지표입니다.
또한, MTF 구조를 통해 시장의 “위계적 정렬(hierarchical alignment)”을 쉽게 인식할 수 있습니다.
✨ 면책
이 지표는 교육 및 연구 목적으로만 제공됩니다.
투자 판단의 책임은 사용자 본인에게 있으며, 본 지표는 매매 신호를 보장하지 않습니다.

Extreme Pressure Zones Indicator (EPZ) [BullByte]Extreme Pressure Zones Indicator(EPZ)
The Extreme Pressure Zones (EPZ) Indicator is a proprietary market analysis tool designed to highlight potential overbought and oversold "pressure zones" in any financial chart. It does this by combining several unique measurements of price action and volume into a single, bounded oscillator (0–100). Unlike simple momentum or volatility indicators, EPZ captures multiple facets of market pressure: price rejection, trend momentum, supply/demand imbalance, and institutional (smart money) flow. This is not a random mashup of generic indicators; each component was chosen and weighted to reveal extreme market conditions that often precede reversals or strong continuations.
What it is?
EPZ estimates buying/selling pressure and highlights potential extreme zones with a single, bounded 0–100 oscillator built from four normalized components. Context-aware weighting adapts to volatility, trendiness, and relative volume. Visual tools include adaptive thresholds, confirmed-on-close extremes, divergence, an MTF dashboard, and optional gradient candles.
Purpose and originality (not a mashup)
Purpose: Identify when pressure is building or reaching potential extremes while filtering noise across regimes and symbols.
Originality: EPZ integrates price rejection, momentum cascade, pressure distribution, and smart money flow into one bounded scale with context-aware weighting. It is not a cosmetic mashup of public indicators.
Why a trader might use EPZ
EPZ provides a multi-dimensional gauge of market extremes that standalone indicators may miss. Traders might use it to:
Spot Reversals: When EPZ enters an "Extreme High" zone (high red), it implies selling pressure might soon dominate. This can hint at a topside reversal or at least a pause in rallies. Conversely, "Extreme Low" (green) can highlight bottom-fish opportunities. The indicator's divergence module (optional) also finds hidden bullish/bearish divergences between price and EPZ, a clue that price momentum is weakening.
Measure Momentum Shifts: Because EPZ blends momentum and volume, it reacts faster than many single metrics. A rising MPO indicates building bullish pressure, while a falling MPO shows increasing bearish pressure. Traders can use this like a refined RSI: above 50 means bullish bias, below 50 means bearish bias, but with context provided by the thresholds.
Filter Trades: In trend-following systems, one could require EPZ to be in the bullish (green) zone before taking longs, or avoid new trades when EPZ is extreme. In mean-reversion systems, one might specifically look to fade extremes flagged by EPZ.
Multi-Timeframe Confirmation: The dashboard can fetch a higher timeframe EPZ value. For example, you might trade a 15-minute chart only when the 60-minute EPZ agrees on pressure direction.
Components and how they're combined
Rejection (PRV) – Captures price rejection based on candle wicks and volume (see Price Rejection Volume).
Momentum Cascade (MCD) – Blends multiple momentum periods (3,5,8,13) into a normalized momentum score.
Pressure Distribution (PDI) – Measures net buy/sell pressure by comparing volume on up vs down candles.
Smart Money Flow (SMF) – An adaptation of money flow index that emphasizes unusual volume spikes.
Each of these components produces a 0–100 value (higher means more bullish pressure). They are then weighted and averaged into the final Market Pressure Oscillator (MPO), which is smoothed and scaled. By combining these four views, EPZ stands out as a comprehensive pressure gauge – the whole is greater than the sum of parts
Context-aware weighting:
Higher volatility → more PRV weight
Trendiness up (RSI of ATR > 25) → more MCD weight
Relative volume > 1.2x → more PDI weight
SMF holds a stable weight
The weighted average is smoothed and scaled into MPO ∈ with 50 as the neutral midline.
What makes EPZ stand out
Four orthogonal inputs (price action, momentum, pressure, flow) unified in a single bounded oscillator with consistent thresholds.
Adaptive thresholds (optional) plus robust extreme detection that also triggers on crossovers, so static thresholds work reliably too.
Confirm Extremes on Bar Close (default ON): dots/arrows/labels/alerts print on closed bars to avoid repaint confusion.
Clean dashboard, divergence tools, pre-alerts, and optional on-price gradients. Visual 3D layering uses offsets for depth only,no lookahead.
Recommended markets and timeframes
Best: liquid symbols (index futures, large-cap equities, major FX, BTC/ETH).
Timeframes: 5–15m (more signals; consider higher thresholds), 1H–4H (balanced), 1D (clear regimes).
Use caution on illiquid or very low TFs where wick/volume geometry is erratic.
Logic and thresholds
MPO ∈ ; 50 = neutral. Above 50 = bullish pressure; below 50 = bearish.
Static thresholds (defaults): thrHigh = 70, thrLow = 30; warning bands 5 pts inside extremes (65/35).
Adaptive thresholds (optional):
thrHigh = min(BaseHigh + 5, mean(MPO,100) + stdev(MPO,100) × ExtremeSensitivity)
thrLow = max(BaseLow − 5, mean(MPO,100) − stdev(MPO,100) × ExtremeSensitivity)
Extreme detection
High: MPO ≥ thrHigh with peak/slope or crossover filter.
Low: MPO ≤ thrLow with trough/slope or crossover filter.
Cooldown: 5 bars (default). A new extreme will not print until the cooldown elapses, even if MPO re-enters the zone.
Confirmation
"Confirm Extremes on Bar Close" (default ON) gates extreme markers, pre-alerts, and alerts to closed bars (non-repainting).
Divergences
Pivot-based bullish/bearish divergence; tags appear only after left/right bars elapse (lookbackPivot).
MTF
HTF MPO retrieved with lookahead_off; values can update intrabar and finalize at HTF close. This is disclosed and expected.
Inputs and defaults (key ones)
Core: Sensitivity=1.0; Analysis Period=14; Smoothing=3; Adaptive Thresholds=OFF.
Extremes: Base High=70, Base Low=30; Extreme Sensitivity=1.5; Confirm Extremes on Bar Close=ON; Cooldown=5; Dot size Small/Tiny.
Visuals: Heatmap ON; 3D depth optional; Strength bars ON; Pre-alerts OFF; Divergences ON with tags ON; Gradient candles OFF; Glow ON.
Dashboard: ON; Position=Top Right; Size=Normal; MTF ON; HTF=60m; compact overlay table on price chart.
Advanced caps: Max Oscillator Labels=80; Max Extreme Guide Lines=80; Divergence objects=60.
Dashboard: what each element means
Header: EPZ ANALYSIS.
Large readout: Current MPO; color reflects state (extreme, approaching, or neutral).
Status badge: "Extreme High/Low", "Approaching High/Low", "Bullish/Neutral/Bearish".
HTF cell (when MTF ON): Higher-timeframe MPO, color-coded vs extremes; updates intrabar, settles at HTF close.
Predicted (when MTF OFF): Simple MPO extrapolation using momentum/acceleration—illustrative only.
Thresholds: Current thrHigh/thrLow (static or adaptive).
Components: ASCII bars + values for PRV, MCD, PDI, SMF.
Market metrics: Volume Ratio (x) and ATR% of price.
Strength: Bar indicator of |MPO − 50| × 2.
Confidence: Heuristic gauge (100 in extremes, 70 in warnings, 50 with divergence, else |MPO − 50|). Convenience only, not probability.
How to read the oscillator
MPO Value (0–100): A reading of 50 is neutral. Values above ~55 are increasingly bullish (green), while below ~45 are increasingly bearish (red). Think of these as "market pressure".
Extreme Zones: When MPO climbs into the bright orange/red area (above the base-high line, default 70), the chart will display a dot and downward arrow marking that extreme. Traders often treat this as a sign to tighten stops or look for shorts. Similarly, a bright green dot/up-arrow appears when MPO falls below the base-low (30), hinting at a bullish setup.
Heatmap/Candles: If "Pressure Heatmap" is enabled, the background of the oscillator pane will fade green or red depending on MPO. Users can optionally color the price candles by MPO value (gradient candles) to see these extremes on the main chart.
Prediction Zone(optional): A dashed projection line extends the MPO forward by a small number of bars (prediction_bars) using current MPO momentum and acceleration. This is a heuristic extrapolation best used for short horizons (1–5 bars) to anticipate whether MPO may touch a warning or extreme zone. It is provisional and becomes less reliable with longer projection lengths — always confirm predicted moves with bar-close MPO and HTF context before acting.
Divergences: When price makes a higher high but EPZ makes a lower high (bearish divergence), the indicator can draw dotted lines and a "Bear Div" tag. The opposite (lower low price, higher EPZ) gives "Bull Div". These signals confirm waning momentum at extremes.
Zones: Warning bands near extremes; Extreme zones beyond thresholds.
Crossovers: MPO rising through 35 suggests easing downside pressure; falling through 65 suggests waning upside pressure.
Dots/arrows: Extreme markers appear on closed bars when confirmation is ON and respect the 5-bar cooldown.
Pre-alert dots (optional): Proximity cues in warning zones; also gated to bar close when confirmation is ON.
Histogram: Distance from neutral (50); highlights strengthening or weakening pressure.
Divergence tags: "Bear Div" = higher price high with lower MPO high; "Bull Div" = lower price low with higher MPO low.
Pressure Heatmap : Layered gradient background that visually highlights pressure strength across the MPO scale; adjustable intensity and optional zone overlays (warning / extreme) for quick visual scanning.
A typical reading: If the oscillator is rising from neutral towards the high zone (green→orange→red), the chart may see strong buying culminating in a stall. If it then turns down from the extreme, that peak EPZ dot signals sell pressure.
Alerts
EPZ: Extreme Context — fires on confirmed extremes (respects cooldown).
EPZ: Approaching Threshold — fires in warning zones if no extreme.
EPZ: Divergence — fires on confirmed pivot divergences.
Tip: Set alerts to "Once per bar close" to align with confirmation and avoid intrabar repaint.
Practical usage ideas
Trend continuation: In positive regimes (MPO > 50 and rising), pullbacks holding above 50 often precede continuation; mirror for bearish regimes.
Exhaustion caution: E High/E Low can mark exhaustion risk; many wait for MPO rollover or divergence to time fades or partial exits.
Adaptive thresholds: Useful on assets with shifting volatility regimes to maintain meaningful "extreme" levels.
MTF alignment: Prefer setups that agree with the HTF MPO to reduce countertrend noise.
Examples
Screenshots captured in TradingView Replay to freeze the bar at close so values don't fluctuate intrabar. These examples use default settings and are reproducible on the same bars; they are for illustration, not cherry-picking or performance claims.
Example 1 — BTCUSDT, 1h — E Low
MPO closed at 26.6 (below the 30 extreme), printing a confirmed E Low. HTF MPO is 26.6, so higher-timeframe pressure remains bearish. Components are subdued (Momentum/Pressure/Smart$ ≈ 29–37), with Vol Ratio ≈ 1.19x and ATR% ≈ 0.37%. A prior Bear Div flagged weakening impulse into the drop. With cooldown set to 5 bars, new extremes are rate-limited. Many traders wait for MPO to curl up and reclaim 35 or for a fresh Bull Div before considering countertrend ideas; if MPO cannot reclaim 35 and HTF stays weak, treat bounces cautiously. Educational illustration only.
Example 2 — ETHUSD, 30m — E High
A strong impulse pushed MPO into the extreme zone (≥ 70), printing a confirmed E High on close. Shortly after, MPO cooled to ~61.5 while a Bear Div appeared, showing momentum lag as price pushed a higher high. Volume and volatility were elevated (≈ 1.79x / 1.25%). With a 5-bar cooldown, additional extremes won't print immediately. Some treat E High as exhaustion risk—either waiting for MPO rollover under 65/50 to fade, or for a pullback that holds above 50 to re-join the trend if higher-timeframe pressure remains constructive. Educational illustration only.
Known limitations and caveats
The MPO line itself can change intrabar; extreme markers/alerts do not repaint when "Confirm Extremes on Bar Close" is ON.
HTF values settle at the close of the HTF bar.
Illiquid symbols or very low TFs can be noisy; consider higher thresholds or longer smoothing.
Prediction line (when enabled) is a visual extrapolation only.
For coders
Pine v6. MTF via request.security with lookahead_off.
Extremes include crossover triggers so static thresholds also yield E High/E Low.
Extreme markers and pre-alerts are gated by barstate.isconfirmed when confirmation is ON.
Arrays prune oldest objects to respect resource limits; defaults (80/80/60) are conservative for low TFs.
3D layering uses negative offsets purely for drawing depth (no lookahead).
Screenshot methodology:
To make labels legible and to demonstrate non-repainting behavior, the examples were captured in TradingView Replay with "Confirm Extremes on Bar Close" enabled. Replay is used only to freeze the bar at close so plots don't change intrabar. The examples use default settings, include both Extreme Low and Extreme High cases, and can be reproduced by scrolling to the same bars outside Replay. This is an educational illustration, not a performance claim.
Disclaimer
This script is for educational purposes only and does not constitute financial advice. Markets involve risk; past behavior does not guarantee future results. You are responsible for your own testing, risk management, and decisions.

DynamoSent DynamoSent Pro+ — Professional Listing (Preview)
— Adaptive Macro Sentiment (v6)
— Export, Adaptive Lookback, Confidence, Boxes, Heatmap + Dynamic OB/OS
Preview / Experimental build. I’m actively refining this tool—your feedback is gold.
If you spot edge cases, want new presets, or have market-specific ideas, please comment or DM me on TradingView.
⸻
What it is
DynamoSent Pro+ is an adaptive, non-repainting macro sentiment engine that compresses VIX, DXY and a price-based activity proxy (e.g., SPX/sector ETF/your symbol) into a 0–100 sentiment line. It scales context by volatility (ATR%) and can self-calibrate with rolling quantile OB/OS. On top of that, it adds confidence scoring, a plain-English Context Coach, MTF agreement, exportable sentiment for other indicators, and a clean Light/Dark UI.
Why it’s different
• Adaptive lookback tracks regime changes: when volatility rises, we lengthen context; when it falls, we shorten—less whipsaw, more relevance.
• Dynamic OB/OS (quantiles) self-calibrates to each instrument’s distribution—no arbitrary 30/70 lines.
• MTF agreement + Confidence gate reduce false positives by highlighting alignment across timeframes.
• Exportable output: hidden plot “DynamoSent Export” can be selected as input.source in your other Pine scripts.
• Non-repainting rigor: all request.security() calls use lookahead_off + gaps_on; signals wait for bar close.
Key visuals
• Sentiment line (0–100), OB/OS zones (static or dynamic), optional TF1/TF2 overlays.
• Regime boxes (Overbought / Oversold / Neutral) that update live without repaint.
• Info Panel with confidence heat, regime, trend arrow, MTF readout, and Coach sentence.
• Session heat (Asia/EU/US) to match intraday behavior.
• Light/Dark theme switch in Inputs (auto-contrasted labels & headers).
⸻
How to use (examples & recipes)
1) EURUSD (swing / intraday blend)
• Preset: EURUSD 1H Swing
• Chart: 1H; TF1=1H, TF2=4H (default).
• Proxies: Defaults work (VIX=D, DXY=60, Proxy=D).
• Dynamic OB/OS: ON at 20/80; Confidence ≥ 55–60.
• Playbook:
• When sentiment crosses above 50 + margin with Δ ≥ signalK and MTF agreement ≥ 0.5, treat as trend breakout.
• In Oversold with rising Coach & TF agreement, take fade longs back toward mid-range.
• Alerts: Enable Breakout Long/Short and Fade; keep cooldown 8–12 bars.
2) SPY (daytrading)
• Preset: SPY 15m Daytrade; Chart: 15m.
• VIX (D) matters more; preset weights already favor it.
• Start with static 30/70; later try dynamic 25/75 for adaptive thresholds.
• Use Coach: in US session, when it says “Overbought + MTF agree → sell rallies / chase breakouts”, lean momentum-continuation after pullbacks.
3) BTCUSD (crypto, 24/7)
• Preset: BTCUSD 1H; Chart: 1H.
• DXY and BTC.D inform macro tone; keep Carry-forward ON to bridge sparse ticks.
• Prefer Dynamic OB/OS (15/85) for wider swings.
• Fade signals on weekend chop; Breakout when Confidence > 60 and MTF ≥ 1.0.
4) XAUUSD (gold, macro blend)
• Preset: XAUUSD 4H; Chart: 4H.
• Weights tilt to DXY and US10Y (handled by preset).
• Coach + MTF helps separate trend legs from news pops.
⸻
Best practices
• Theme: Switch Light/Dark in Inputs; the panel adapts contrast automatically.
• Export: In another script → Source → DynamoSent Pro+ → DynamoSent Export. Build your own filters/strategies atop the same sentiment.
• Dynamic vs Static OB/OS:
• Static 30/70: fast, universal baseline.
• Dynamic (quantiles): instrument-aware; use 20/80 (default) or 15/85 for choppy markets.
• Confidence gate: Start at 50–60% to filter noise; raise when you want only A-grade setups.
• Adaptive Lookback: Keep ON. For ultra-liquid indices, you can switch it OFF and set a fixed lookback.
⸻
Non-repainting & safety notes
• All request.security() calls use lookahead=barmerge.lookahead_off and gaps=barmerge.gaps_on.
• No forward references; signals & regime flips are confirmed on bar close.
• History-dependent funcs (ta.change, ta.percentile_linear_interpolation, etc.) are computed each bar (not conditionally).
• Adaptive lookback is clamped ≥ 1 to avoid lowest/highest errors.
• Missing-data warning triggers only when all proxies are NA for a streak; carry-forward can bridge small gaps without repaint.
⸻
Known limits & tips
• If a proxy symbol isn’t available on your plan/exchange, you’ll see the NA warning: choose a different symbol via Symbol Search, or keep Carry-forward ON (it defaults to neutral where needed).
• Intraday VIX is sparse—using Daily is intentional.
• Dynamic OB/OS needs enough history (see dynLenFloor). On short histories it gracefully falls back to static levels.
Thanks for trying the preview. Your comments drive the roadmap—presets, new proxies, extra alerts, and integrations.

CCI Stochastic - YOSI
CCI Stochastic (Pro v6) – MTF, Adaptive Bands & Live Label
What it does
This indicator applies a Stochastic calculation on the CCI (K/D lines) to highlight momentum shifts, overbought/oversold zones, and adaptive market regimes. It comes with optional higher-timeframe confirmation, adaptive volatility bands, a live value label, and built-in alerts.
Key Features
Core Signal: Choose between D or K line of the Stoch-CCI.
Extreme Zones: Customizable OB/OS thresholds (default 80/20) and a midline (50), with dynamic background shading.
Adaptive Bands (optional): Mean ± k·standard deviation of the signal, to capture cyclic extremes.
MTF Confirmation (optional): Fetches the same signal from a higher timeframe via request.security.
Arrows/Signals:
Enter – Cross above OS (Buy) / below OB (Sell).
Center – Cross of the 50 midline (momentum shift).
Exit – Exit from extreme zones.
Alerts: All arrow signals + adaptive band crosses.
Live Value Label: Shows the latest signal value near the last bar, customizable decimals/offset/background colors.
Visuals: Red line above OB, green below OS, gray neutral; adaptive band fills.
Use Cases
Momentum / Reversals: Enter with OS/OB crosses confirmed by MTF.
Trend validation: Combine with moving averages (e.g., EMA200) or support/resistance.
Mean Reversion: Fade extreme zones, especially with adaptive band or OB/OS exit alerts.
Inputs
CCI Period, Stoch Period, Smooth K/D – core calculation.
Overbought / Oversold – thresholds (default 80/20).
Line to plot – K or D.
Show Arrows (Enter, Center, Exit) – visual control.
Adaptive Bands – length and k multiplier.
Higher TF – optional confirmation timeframe.
Live Label – decimals, offset, colors.
Quick Tips
For scalping/short-term setups: tighten OB/OS (e.g., 85/15) to filter noise.
In high volatility: increase adaptLen or decrease k to smooth bands.
Reduce false signals: require local + MTF alignment (e.g., only long if MTF > 50).
Disclaimer
This is a technical analysis tool – not a standalone buy/sell signal. Always use with proper risk management, key levels, and confluence from multiple factors.
מה זה עושה?
האינדיקטור מחשב Stochastic על CCI (קו K/D) ומציג אזורי קיצון, חציות ומשטרי שוק. הוא כולל אופציה לאישור מטיימפריים גבוה, בנדים אדפטיביים, תווית ערך חיה והתרעות מוכנות.
יכולות עיקריות
סיגנל מרכזי: בחירה בין קו D או K של Stoch-CCI.
אזורי קיצון: קווים ניתנים להגדרה (ברירת מחדל 80/20) וקו אמצע 50, עם צביעת רקע דינמית כשנכנסים לקיצון.
Adaptive Bands (אופציונלי): ממוצע ± k·סטיית תקן של הסיגנל—מסייע לזהות overheat ומחזוריות.
אישור MTF (אופציונלי): אותו סיגנל מטיימפריים גבוה באמצעות request.security.
חיצים/סיגנלים:
Enter – חציה מלמטה מעל OS (קנייה) / מלמעלה מתחת OB (מכירה).
Center – חציה של 50 (שינוי מומנטום).
Exit – יציאה מאזורים קיצוניים (OS/OB).
Alerts: לכל הסיגנלים לעיל + כניסה/יציאה לבנדים האדפטיביים.
תווית ערך חיה: מציגה את ערך הסיגנל האחרון ליד הנקודה (ספרות ו־offset ניתנים להגדרה).
עיצוב קריא: צבע קו אדום מעל OB, ירוק מתחת OS, אפור ניטרלי; מילוי אזורים.
שימוש מומלץ
מומנטום/היפוכים: כניסה עם חציה מה-OS/OB ואישור מה-MTF.
ממוצע נע/רמות מחיר: חברו לאימות מגמה (למשל EMA200 או תמיכה/התנגדות).
Mean Reversion: חיפוש חזרה מאזורי קיצון, במיוחד כשיש התרעת יציאה מ-OB/OS או נגיעה בבנד אדפטיבי.
קלטים מרכזיים
CCI Period, Stoch Period, Smooth K/D – פרמטרי חישוב.
Overbought / Oversold – ספי קיצון (ברירת מחדל 80/20).
Line to plot – בחירה בין K או D.
Show Arrows/Center/Exit/Enter – שליטה בתצוגת החיצים.
Adaptive Bands (len, k) – חלון ורגישות לבנדים.
Higher TF – טיימפריים לאישור (אופציונלי).
Live Label – ספרות, היסט ברים, צבעי רקע.
טיפים מהירים
בסקלפים/טווחים קצרים: הקשיחו ספי קיצון (למשל 85/15) להפחתת רעש.
בשוק תנודתי: העלו את adaptLen או הורידו את k כדי לקבל בנדים רגישים פחות.
להקטנת אותות שווא: דרשו התאמה בין הסיגנל המקומי ל-MTF (לדוגמה, לונג רק כשה-MTF מעל 50).
הערה חשובה
זהו כלי ניתוח טכני—לא אות קנייה/מכירה בפני עצמו. שלבו אותו עם ניהול סיכונים (SL/TP), בדיקת רמות מפתח ואימות ממספר אינדיקטורים או טיימפריימים.
