Order Block Indicatoruses consolidation to determine supply and demand areas. Uses the lowest candle to determine the initiating candle for the order block.Индикатор Pine Script®от bakinyemi2442
Order Block Finder (5-min Demand Zones)This highlights potential bullish order blocks on a 5-min chart when: Candle is bullish Small body (suggesting accumulation or absorption) Lowest low in last X barsИндикатор Pine Script®от joederochie8739
Turk Pivot Candle Order BlocksOrder Blocks based on pivot reversal candle When a pivot High or Pivot Low is found and confirmed, a box will be plotted on the open and close values of that pivot candle You also have the ability to change the amount of candles the box stretches over as well as the colors of the bullish and bearish boxes How To Use:- Pivot points often provide Support and Resistance points on their own, one way of marking up order blocks is by taking the pivot candle and marking that up as a resistance area where you could be looking for price to reverse Индикатор Pine Script®от turk_shariq55654
Order Block v1Hello Traders :) I am Only Fibonacci. While coding this indicator, I examined many concepts and decided to blend them. I took the method shared by most traders and added different perspectives and options. First of all, you can choose how many order block regions you want to see on the screen. Note: The levels displayed on the screen are the sum of bears and bulls. You can also choose whichever you want to see, bearish or bullish. You can specify the precision of pivot points. Whether you want to select a zone with a body or a zone with a wick, you can see this in the settings. You can extend the regions infinitely with the right extension option.Индикатор Pine Script®от only_fibonacciОбновлено 99 2.8 K
Order Block Smart Entry (v6)very useful indicator, analyze multiframes to identify the trend, then find out the valid order block and after analyzing lower time frame entry gives the singal. Индикатор Pine Script®от shanionline11224
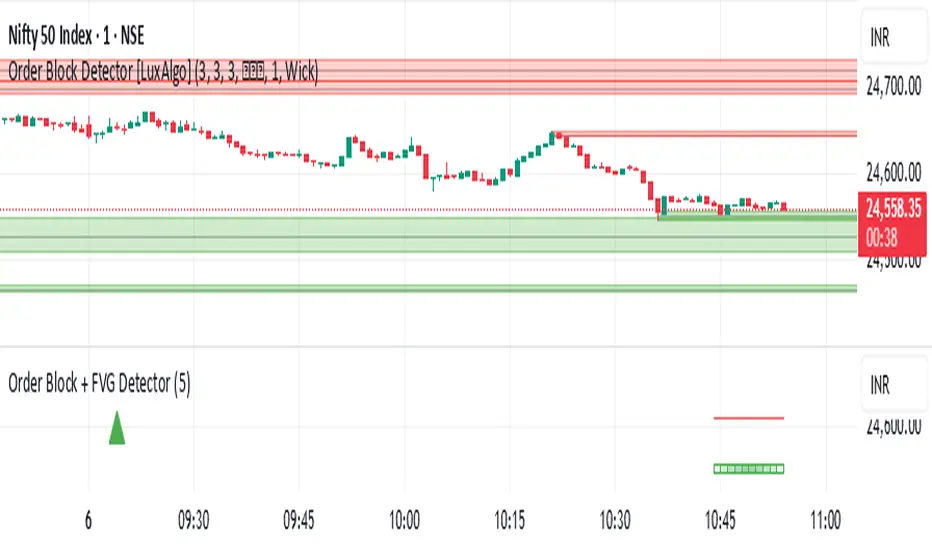
Order Block + FVG Detector- chakrashows OBs with entry and exits and volumes. It also shows the volumes in each Order block Индикатор Pine Script®от saiboss199
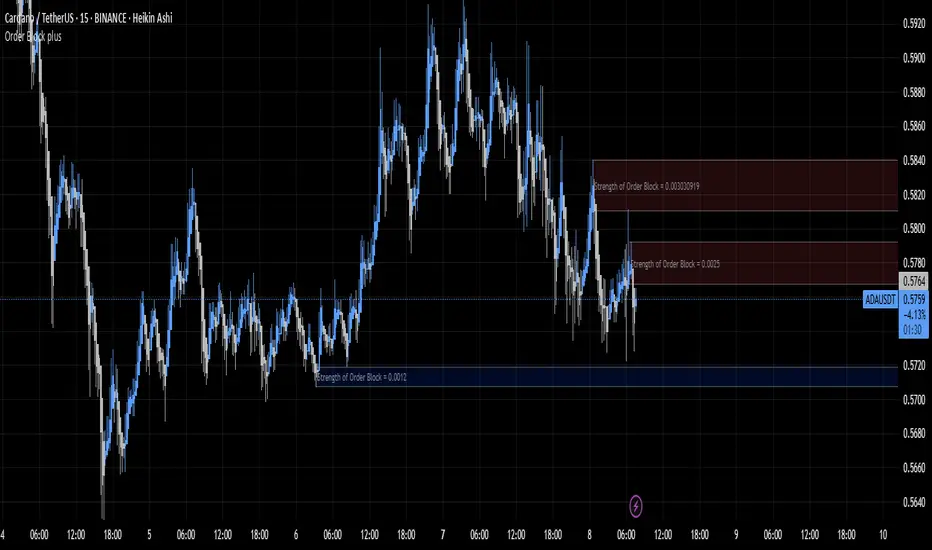
Order Block plusIndicator Description: “Order Block Plus” This indicator is designed for traders who aim to identify the strength and position of supply and demand zones on the chart and receive key signals for entry or exit. Below is a detailed explanation of its functionality: Features and Applications: 1. Identifying Supply and Demand Zones: • Supply (Resistance) and Demand (Support) zones are visually displayed on the chart. • Each zone is marked with a specific color (Yellow for supply, Blue for demand) for easy identification. 2. Breakout and Reversal Signals: • The indicator detects Breakout and Reversal patterns and highlights them with alerts. • Example: Detecting price breaking above or below key levels. 3. Candlestick Pattern Support: • Identifies powerful patterns such as Bullish Engulf, Bearish Engulf, Three White Soldiers, and Three Black Crows. 4. Displaying Zone Strength: • The indicator shows the strength of supply and demand zones using text displayed inside each zone. 5. Alerts: • Provides alerts for zone breakouts, breakdowns, and new zone formations. • Example: Alerts for breaking a demand or supply zone. How to Use: 1. Adding to the Chart: • The indicator can be applied to any time frame and is suitable for Forex, stocks, or cryptocurrency charts. 2. Identifying Trading Opportunities: • Demand zones indicate strong support levels where prices are likely to rise. • Supply zones indicate resistance levels where prices are likely to fall. 3. Examining Zone Strength: • The strength of each zone is displayed with text inside the zone. Indicator Settings: • Zone Colors: • The default colors for supply and demand zones are yellow and blue, but they can be customized. • Alerts: • Configurable alerts for breakouts or reversals. Advantages: • Automatic detection of key price levels. • Accurate and timely alerts for trades. • Customizable for professional traders. Note: This indicator is designed for technical analysis and should be used alongside a suitable trading strategy.Индикатор Pine Script®от traderr_smartОбновлено 44476
Price Action Volumetric Order Blocks [UAlgo]"Price Action Volumetric Order Blocks" indicator aims to identify significant price zones in the market based on a combination of price action and volume analysis. It utilizes the concept of "Order Blocks," which are areas on the chart where large orders are believed to have been placed, influencing price behavior. By analyzing price swings and volume activity, the indicator attempts to highlight potential support and resistance levels. 🔶 Key Features Swing Length: This input allows you to adjust the timeframe used to identify price swings for order block detection. A longer swing length will focus on larger timeframes and potentially capture stronger order blocks. Show Last X Order Blocks: This controls the number of order blocks displayed on the chart. You can choose to visualize a specific number of the most recent order blocks. Violation Check: This setting determines how the indicator identifies potential order block violations. You can choose between "Wick" or "Close" violations. A "Wick" violation occurs when the price (wick) extends beyond the order block boundaries, while a "Close" violation signifies that the closing price breaches the order block. Hide Overlap: This option allows you to manage the display of overlapping order blocks. If set to "True," only non-overlapping order blocks will be shown, potentially offering a clearer visualization. Colors: You can customize the color scheme for bullish (upward) and bearish (downward) order blocks to enhance visual clarity on the chart. 🔶 Interpreting the Indicator Order Blocks: The teal-colored boxes represent bullish order blocks, indicating areas of demand where buying pressure is likely to be strong. Red-colored boxes represent bearish order blocks, indicating areas of supply where selling pressure is likely to be dominant. These zones often signal potential reversal points or consolidation areas. Strength Calculations: The indicator calculates the relative strength of bullish and bearish blocks based on volume. A higher bullish strength indicates stronger buying pressure, while higher bearish strength suggests more selling pressure. Traders can use this information to gauge the strength of a price level and predict future price movements. Market Structure Lines: The indicator displays horizontal lines to depict the current market structure, labeled as "MSB" (Market Sell Balance) or "BOS" (Break of Structure). These lines can help visualize the prevailing trend direction. Order Block Violations: When a price wick or close breaches an order block (depending on the chosen violation type), the corresponding order block visualization is removed from the chart. This can signify a potential weakening of the identified support or resistance zone. 🔶 Disclaimer Use with Caution: This indicator is provided for educational and informational purposes only and should not be considered as financial advice. Users should exercise caution and perform their own analysis before making trading decisions based on the indicator's signals. Not Financial Advice: The information provided by this indicator does not constitute financial advice, and the creator (UAlgo) shall not be held responsible for any trading losses incurred as a result of using this indicator. Backtesting Recommended: Traders are encouraged to backtest the indicator thoroughly on historical data before using it in live trading to assess its performance and suitability for their trading strategies. Risk Management: Trading involves inherent risks, and users should implement proper risk management strategies, including but not limited to stop-loss orders and position sizing, to mitigate potential losses. No Guarantees: The accuracy and reliability of the indicator's signals cannot be guaranteed, as they are based on historical price data and past performance may not be indicative of future results.Индикатор Pine Script®от UAlgoОбновлено 1212 3.6 K
Trapped Traders Order BlocksHow It Works The Trapped Traders Order Blocks indicator identifies specific price action patterns that suggest large market participants ("big money") have been trapped in losing positions after significant price sweeps, creating potential opportunities for reversals. The indicator detects both "bullish trap blocks" (where bearish traders are trapped) and "bearish trap blocks" (where bullish traders are trapped). Here’s the step-by-step process for each: Bullish Trap Block (Bears Trapped): A bearish candle (Candle A) must sweep the high of the previous candle (Candle B), meaning its high exceeds the high of the prior candle. This bearish candle must have a longer upper wick than its lower wick, indicating rejection of higher prices. The candle must not be a doji (i.e., it must have a significant body, defined as the body being at least 10% of the candle's range). The next candle (Candle C) must close above the body of the bearish candle (Candle A), suggesting that price has immediately moved against the bearish sweep, potentially trapping bearish traders who entered short positions expecting a downward move. The body of the bearish candle (Candle A) is marked as a "bullish trap block." A box is drawn around this candle's body, and a label ("Bullish Trap") is placed below it. Bearish Trap Block (Bulls Trapped): A bullish candle (Candle A) must sweep the low of the previous candle (Candle B), meaning its low is below the low of the prior candle. This bullish candle must have a longer lower wick than its upper wick, indicating rejection of lower prices. The candle must not be a doji. The next candle (Candle C) must close below the body of the bullish candle (Candle A), suggesting that price has immediately moved against the bullish sweep, potentially trapping bullish traders who entered long positions expecting an upward move. The body of the bullish candle (Candle A) is marked as a "bearish trap block." A box is drawn around this candle's body, and a label ("Bearish Trap") is placed above it. Dynamic Box Extension: For both bullish and bearish trap blocks, the box extends dynamically to the current bar unless it exceeds a user-defined age (default is 52 bars), at which point it stops at the maximum age. Sweep Detection: Bullish Sweep (of any trap block, bullish or bearish): The current candle's open is above the top of the box. The low is below the top of the box. The close is above the top of the box. The lower wick is longer than the upper wick (indicating rejection of lower prices). The close is above 50% of the candle's range (ensuring a strong bullish bias). When a bullish sweep occurs, a label ("Bullish Sweep") is placed at the low of the candle, pointing upward, and an alert is triggered. Bearish Sweep (of any trap block, bullish or bearish): The current candle's open is below the bottom of the box. The high is above the bottom of the box. The close is below the bottom of the box. The upper wick is longer than the lower wick (indicating rejection of higher prices). The close is below 50% of the candle's range (ensuring a strong bearish bias). When a bearish sweep occurs, a label ("Bearish Sweep") is placed at the high of the candle, pointing downward, and an alert is triggered. When to Be Used The Trapped Traders Order Blocks indicator is best used in the following scenarios: Reversal Trading: Use this indicator to identify potential reversal points in the market. Bullish trap blocks suggest that trapped bears may unwind their short positions, leading to a potential bullish move. Bearish trap blocks suggest that trapped bulls may unwind their long positions, leading to a potential bearish move. Look for sweeps of these blocks as confirmation of a directional move. A bullish sweep indicates a potential upward move, while a bearish sweep indicates a potential downward move. Range-Bound Markets: In sideways or ranging markets, trapped blocks can highlight key levels where large players have been caught off-guard. These levels often act as support or resistance, and a sweep of the block can signal a breakout or continuation in the direction of the sweep. Confluence with Other Indicators: Combine the trapped blocks with other technical analysis tools, such as support/resistance levels, Fibonacci retracements, or volume analysis, to increase the probability of a successful trade. For example, a bullish trap block near a strong support level with a bullish sweep can provide a high-probability setup for a long position, while a bearish trap block near a strong resistance level with a bearish sweep can signal a short opportunity. Timeframes: The indicator is most effective on higher timeframes such as 1-day (1D), 1-week (1W), and 1-month (1M) charts. These timeframes are more likely to capture significant moves involving large market participants, reducing noise and false signals compared to lower timeframes. While it can be used on lower timeframes (e.g., 1-hour or 4-hour), the signals may be less reliable due to increased market noise. Logic Behind It The logic behind the Trapped Traders Order Blocks indicator is rooted in market psychology and the behavior of large market participants ("big money"). When a large sweep candle occurs where price spikes in one direction but then quickly reverses it often indicates that traders have entered positions in the direction of the sweep, expecting a continuation. However, if the price immediately moves against them, these traders are now trapped in losing positions. Bullish Trap Block (Bears Trapped): A large bearish sweep candle (spiking upward but closing lower) suggests that bearish traders (bears) have entered short positions at the top of the move, expecting a downward continuation. If the next candle closes above the bearish candle's body, these bears are trapped in losing positions. The body of the bearish candle becomes a "bullish trap block" because the trapped bears are likely to have placed their stop-loss orders or break-even exit orders just above the high of the sweep candle or within the body of the candle. As price revisits this level in the future, these trapped traders may attempt to unwind their positions by buying back their shorts, which can drive the price higher. This unwinding process often attracts new buyers, leading to a potential bullish reversal or continuation. The bullish sweep conditions (e.g., close > box top, longer lower wick, and close above 50% of the range) ensure that the price action at the block level shows strong bullish momentum and rejection of lower prices, confirming the potential for a move higher. Bearish Trap Block (Bulls Trapped): A large bullish sweep candle (spiking downward but closing higher) suggests that bullish traders (bulls) have entered long positions at the bottom of the move, expecting an upward continuation. If the next candle closes below the bullish candle's body, these bulls are trapped in losing positions. The body of the bullish candle becomes a "bearish trap block" because the trapped bulls are likely to have placed their stop-loss orders or break-even exit orders just below the low of the sweep candle or within the body of the candle. As price revisits this level in the future, these trapped traders may attempt to unwind their positions by selling their longs, which can drive the price lower. This unwinding process often attracts new sellers, leading to a potential bearish reversal or continuation. The bearish sweep conditions (e.g., close < box bottom, longer upper wick, and close below 50% of the range) ensure that the price action at the block level shows strong bearish momentum and rejection of higher prices, confirming the potential for a move lower. Summary Bullish Trap Block: Occurs when bears get trapped after a bearish sweep candle is immediately followed by a bullish candle, indicating a potential reversal as trapped bears may unwind their positions. Bearish Trap Block: Occurs when bulls get trapped after a bullish sweep candle is immediately followed by a bearish candle, indicating a potential bearish reversal. Use Case: Ideal for identifying reversal opportunities, especially in range-bound markets or at key support/resistance levels on higher timeframes like 1D, 1W, and 1M, and can be combined with other indicators for confluence. Logic: Large sweep candles followed by an immediate reversal suggest that big money has been trapped, and these traders may unwind their positions at break-even in the near future, driving price in the opposite direction of their initial trade. This indicator provides a visual and actionable way to identify these trapped trader scenarios, with customizable settings for box display, sweep visuals, and alerts to help traders capitalize on these opportunities, particularly on higher timeframes where the signals are most reliable.Индикатор Pine Script®от mindyourbuisnessОбновлено 2424 2.5 K
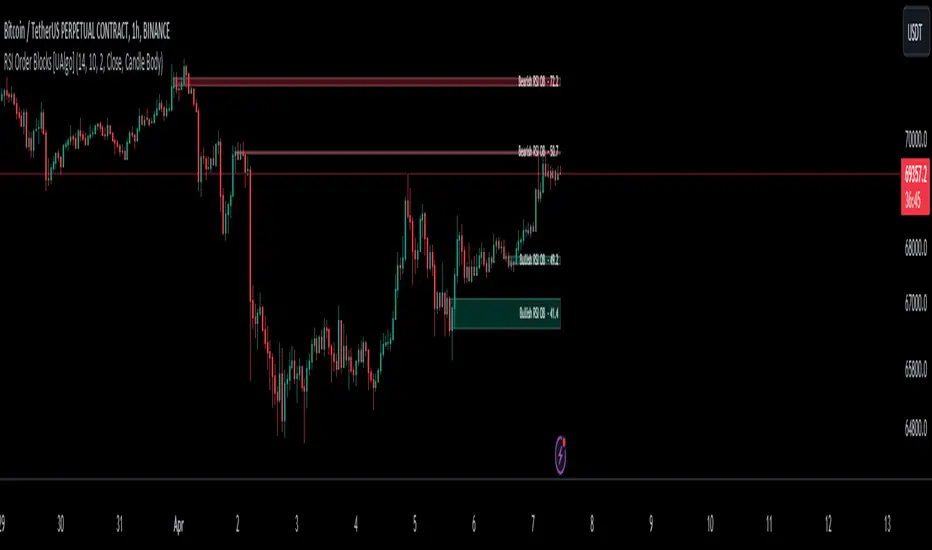
RSI Order Blocks [UAlgo]The "RSI Order Blocks " identifies and visualizes potential order blocks based on the Relative Strength Index (RSI) indicator. These zones may indicating potential support or resistance levels. 🔶 Key Features : RSI-based Order Block Identification: The script utilizes the RSI indicator to identify potential order blocks. It detects pivot highs and lows in the RSI, which are indicative of potential reversal points, and marks these areas as potential order blocks. Order Block Visualization: Identified order blocks are visually represented on the chart, making it easy for traders to recognize and interpret these significant price zones. Both bullish and bearish order blocks are differentiated by color, enhancing clarity and ease of analysis. Additionally, within each order block, the RSI value of that block is also shown. RSI Overbought/Oversold Filter: Optionally, users can apply a filter based on RSI levels to refine the detection of order blocks. This filter prevents the creation of order blocks when the RSI is within specified overbought or oversold conditions (default between 30 and 70), helping traders focus on areas of potentially significant price action. An Example with the OB/OS Filter Feature Turned Off: An Example with the OB/OS Filter Feature Turned On: Mitigation of Broken Order Blocks: Provides flexibility in selecting the mitigation method (based on close or wick) for determining order block breaches. Customizable Parameters: The script offers a range of customizable parameters to tailor the detection and visualization of order blocks to suit individual trading preferences. Users can adjust parameters such as RSI Length, Order Block Detection Sensitivity, Mitigation Method, and order block style to fine-tune the analysis according to their trading strategy. 🔶 Disclaimer : Not Financial Advice: This indicator is intended for educational and informational purposes only. It does not constitute financial advice or recommendations to buy, sell, or hold any financial instruments. Use at Own Risk: Trading involves substantial risk of loss and is not suitable for all investors. Users of this indicator should exercise caution and conduct their own research and analysis before making any trading decisions. Performance Not Guaranteed: Past performance is not indicative of future results. While the indicator aims to assist traders in analyzing market trends, there is no guarantee of accuracy or success in trading operations.Индикатор Pine Script®от UAlgoОбновлено 2727 2.2 K
Volume Profile Bar-Magnified Order Blocks [MyTradingCoder]Introducing "Volume Profile Bar-Magnified Order Blocks", an innovative and unique trading indicator designed to provide traders with a comprehensive understanding of market dynamics. This tool takes the concept of identifying order blocks on your chart and elevates it by integrating a detailed volume profile within each order block zone. Unlike standard order block indicators, Volume Profile Bar-Magnified Order Blocks pulls data from lower timeframe bars and assigns it to various segments of the order block. By providing this volume profile inside the order block, the indicator supplies a deeper, multi-dimensional view of market activity that can enhance your trading decisions. Crucially, users have the ability to fine-tune the detection of order blocks. This is made possible through a single input setting called "Tuning". This integer value allows you to control the significance and frequency of the order blocks. Higher numbers will produce more significant order blocks, though they will appear less frequently. Lower numbers, on the other hand, will yield less significant order blocks, but they will occur more often. This enables you to adjust the sensitivity of the indicator according to your specific trading strategy and style. Key Settings: Number of Segments: Customize the level of detail in your volume profile by selecting the number of segments you want inside each order block. Tuning: Adjust the sensitivity of order block detection to align with your trading strategy. Higher values produce more significant but less frequent order blocks, while lower values yield less significant but more frequent order blocks. Color Inputs: Personalize the look of your chart by selecting the colors for various elements of the indicator. This ensures a seamless integration with your current chart aesthetics and improves visual clarity. Here is a s creenshot that beautifully demonstrates the power of this indicator. You'll see how the price rejects perfectly off the highest volume segment in an order block, showcasing the indicator's potential for pinpointing high-impact price levels. While Volume Profile Bar-Magnified Order Blocks offers many unique features, it should be used in conjunction with other indicators and forms of analysis for a complete trading strategy. As with all tools, it does not guarantee profitable trades but is intended to give traders more information to base their decisions on. Use it to complement your existing analysis and enhance your understanding of market behavior. Experience a new level of clarity in your trading with Volume Profile Bar-Magnified Order Blocks - an indicator that goes beyond the surface to help you navigate the markets more effectively.Индикатор Pine Script®от JacobMaglebyОбновлено 152152 4.8 K
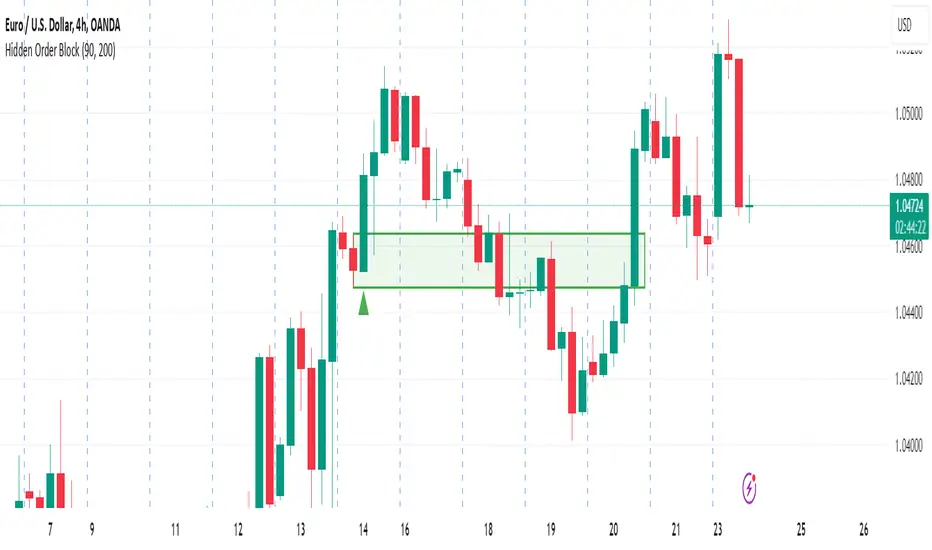
Hidden Order BlockThe Crystal Order Block Indicator is designed to help traders identify institutional order blocks with precision and reliability. By analyzing price action and volume behavior, this tool highlights high-probability zones where smart money has likely placed orders. 🔹 Key Features: ✅ Automated Order Block Detection – Identifies valid bullish & bearish order blocks based on price structure and volume dynamics. ✅ Unmitigated Order Block Filtering – Highlights fresh order blocks that haven’t been tapped, helping traders find high-probability trade setups. ✅ Smart Money Concepts (SMC) & ICT-Based Logic – Uses institutional trading principles to refine entry and exit points. ✅ Multi-Timeframe Compatibility – Works effectively on all timeframes, making it suitable for scalping, intraday, and swing trading. ✅ Customizable Alerts – Stay notified when a new order block forms, ensuring you never miss an opportunity. ✅ Risk Management Enhancement – Helps traders set precise stop-loss and take-profit levels based on institutional trading zones. 📌 How It Works: The indicator scans price movements and detects areas where significant buying or selling pressure occurred, forming institutional order blocks. It then checks for mitigated vs. unmitigated order blocks, ensuring only the most relevant zones are displayed. ✔️ Bullish Order Blocks: Marked when a strong buying zone is detected, often acting as support. ✔️ Bearish Order Blocks: Identified in areas of strong selling pressure, often acting as resistance. The indicator is optimized for Smart Money trading strategies, making it a valuable tool for traders who follow ICT, SMC, and VSA concepts. 🎯 How to Use It Effectively: 🔹 Entry Strategy: Wait for price to retest a fresh order block and confirm entry with additional confluences (e.g., volume spikes, price action signals). 🔹 Exit Strategy: Use order blocks as take-profit targets or stop-loss levels, improving risk-reward ratios. 🔹 Timeframe Recommendation: Best results on M30 and higher, but can be used on lower timeframes with additional confirmations. 🚀 What’s New in the Updated Version? 🔹 More Accurate Order Block Detection – Improved filtering for better precision. 🔹 Mitigation Tracking – Helps traders focus on fresh order blocks for higher success rates. 🔹 Better Visualization – Enhanced clarity for quick decision-making. This indicator is a must-have for traders who want to trade like institutions and refine their trading strategy using smart money concepts.Индикатор Pine Script®от Crystalforex22211
Multi-Timeframe Order BlocksDesigned to identify and visualize key supply and demand zones based on order block theory across multiple timeframes. The indicator detects order blocks by analyzing sequential candle patterns and price movement thresholds to highlight potential reversal or continuation zones where institutional buying or selling activity may have occurred. The indicator works by scanning for clusters of consecutive bullish or bearish candles followed by a significant price move, which signals the formation of an order block. It then plots these zones as colored boxes on the chart—green for demand (bullish order blocks) and red for supply (bearish order blocks). The zones can be based on candle bodies or wicks, depending on user preference, and the indicator supports multi-timeframe analysis by allowing optional higher timeframe inputs. How It Works: Sequential Candle Detection: The indicator looks for a specified number of consecutive bullish or bearish candles (configurable by the user) to identify potential order blocks. Price Movement Threshold: It checks if the price movement after the order block formation exceeds a user-defined percentage threshold, ensuring only significant zones are marked. Zone Plotting: Once an order block is confirmed, the indicator draws a supply or demand zone as a box on the chart, using either candle bodies or wicks for zone boundaries. Multi-Timeframe Support: Users can optionally specify higher timeframes to incorporate broader market context, enhancing the reliability of the zones. Zone Management: The indicator limits the number of zones displayed to avoid clutter, automatically removing the oldest zones when the maximum count is exceeded. How to Interpret: Demand Zones (Green Boxes): These represent areas where buying pressure was strong enough to create a bullish order block. Price often finds support here, making these zones potential entry points for long trades or areas to watch for price bounces. Supply Zones (Red Boxes): These indicate areas of strong selling pressure forming bearish order blocks. Price may face resistance in these zones, which can be used as potential exit points for longs or entry points for shorts. Multi-Timeframe Confirmation: Zones identified on higher timeframes tend to be stronger and more reliable. Use the optional higher timeframe inputs to align your trades with broader market trends. Use with Other Indicators: Combine order block zones with volume, momentum, or trend indicators to improve trade confirmation and risk management. Zone Breaks: A decisive break and close beyond a supply or demand zone may signal a shift in market sentiment and potential trend continuation or reversal. Disclaimer This indicator is provided for educational and informational purposes only and does not constitute financial advice. Trading involves significant risk, and it is possible to lose more than your initial investment. Users should conduct their own research and consider their financial situation carefully before making any trading decisions. The developer and publisher of this indicator are not responsible for any trading losses or damages incurred. Always use proper risk management and consult with a licensed financial advisor if needed.Индикатор Pine Script®от RWCS_LTD1156
Volume Order Blocks [BigBeluga]Volume Order Blocks is a powerful indicator that identifies significant order blocks based on price structure, helping traders spot key supply and demand zones. The tool leverages EMA crossovers to determine the formation of bullish and bearish order blocks while visualizing their associated volume and relative strength. 🔵 Key Features: Order Block Detection via EMA Crossovers: Plots bullish order blocks at recent lows when the short EMA crosses above the long EMA. Plots bearish order blocks at recent highs when the short EMA crosses below the long EMA. Uses customizable sensitivity through the “Sensitivity Detection” setting to fine-tune block formation. Volume Collection and Visualization: Calculates the total volume between the EMA crossover bar and the corresponding high (bearish OB) or low (bullish OB). Displays the absolute volume amount next to each order block for clear volume insights. Percentage Volume Distribution: Shows the percentage distribution of volume among bullish or bearish order blocks. 100% represents the cumulative volume of all OBs in the same category (bullish or bearish). Order Block Removal Conditions: Bullish order blocks are removed when the price closes below the bottom of the block. Bearish order blocks are removed when the price closes above the top of the block. Helps maintain chart clarity by only displaying relevant and active levels. Midline Feature: Dashed midline inside each order block indicates the midpoint between the upper and lower boundaries. Traders can toggle the midline on or off through the settings. Shadow Trend: Shadow Trend dynamically visualizes trend strength and direction by adapting its color intensity based on price movement. 🔵 Usage: Supply & Demand Zones: Use bullish and bearish order blocks to identify key market reversal or continuation points. Volume Strength Analysis: Compare volume percentages to gauge which order blocks hold stronger market significance. Breakout Confirmation: Monitor block removal conditions for potential breakout signals beyond support or resistance zones. Trend Reversals: Combine EMA crossovers with order block formation for early trend reversal detection. Risk Management: Use OB boundaries as potential stop-loss or entry points. Volume Order Blocks is an essential tool for traders seeking to incorporate volume-based supply and demand analysis into their trading strategy. By combining price action, volume data, and EMA crossovers, it offers a comprehensive view of market structure and potential turning points.Индикатор Pine Script®от BigBeluga2222 7.3 K
ICT Concept [TradingFinder] Order Block | FVG | Liquidity Sweeps🔵 Introduction The "ICT" style is one of the subsets of "Price Action" technical analysis. ICT is a method created by "Michael Huddleston", a professional forex trader and experienced mentor. The acronym ICT stands for "Inner Circle Trader". The main objective of the ICT trading strategy is to combine "Price Action" and the concept of "Smart Money" to identify optimal entry points into trades. However, finding suitable entry points is not the only strength of this approach. With the ICT style, traders can better understand price behavior and adapt their trading approach to market structure accordingly. Numerous concepts are discussed in this style, but the key practical concepts for trading in financial markets include "Order Block," "Liquidity," and "FVG". 🔵 How to Use 🟣Order Block Order blocks are a specific type of "Supply and Demand" zones formed when a series of orders are placed in a block. These orders could be created by banks or other major players. Banks typically execute large orders in blocks during their trading sessions. If they were to enter the market directly with a small quantity, significant price movements would occur before the orders are fully executed, resulting in less profit. To avoid this, they divide their orders into smaller, manageable positions. Traders should look for "buy" opportunities in "demand order blocks" areas and "sell" opportunities in "supply order blocks". 🟣Liquidity These levels are where traders aim to exit their trades. "Market Makers" or smart money usually collects or distributes their trading positions near levels where many retail traders have placed their "Stop Loss" orders. When the liquidity resulting from these losses is collected, the price often reverses direction. A "Stop Hunt" is a move designed to neutralize liquidity generated by triggered stop losses. Banks often use significant news events to trigger stop hunts and acquire the liquidity released in the market. If, for example, they intend to execute heavy buy orders, they encourage others to sell through stop hunts. As a result, if there is liquidity in the market before reaching the order block region, the credibility of that order block is higher. Conversely, if liquidity is near the order block, meaning the price reaches the order block before reaching the liquidity area, the credibility of that order block is lower. 🟣FVG (Fair Value Gap) To identify the "Fair Value Gap" on the chart, one must analyze candle by candle. Focus on candles with large bodies, examining one candle and the one before it. The candles before and after this central candle should have long shadows, and their bodies should not overlap with the body of the central candle. The distance between the shadows of the first and third candles is called the FVG range. These zone function in two ways : •Supply and Demand zone: In this case, the price reacts to these zone, and its trend reverses. •Liquidity zone: In this scenario, the price "fills" the zone and then reaches the order block. Important Note: In most cases, FVG zone with very small width act as supply and demand zone, while zone with a significant width act as liquidity zone, absorbing the price. 🔵 Setting 🟣Order Block Refine Order Block : When the option for refining order blocks is Off, the supply and demand zones encompass the entire length of the order block (from Low to High) in their standard state and remain unaltered. On the option for refining order blocks triggers the improvement of supply and demand zones using the error correction algorithm. Refine Type : The enhancement of order blocks via the error correction algorithm can be executed through two methods: Defensive and Aggressive. In the Aggressive approach, the widest possible range is taken into account for order blocks. Show High Levels : If major high levels are to be displayed, set the option for showing high level to Yes. Show Low Levels : If major low levels are to be displayed, set the option for showing low level to Yes. Show Last Support : If showing the last support is desired, set the option for showing last support to Yes. Show Last Resistance : If showing the last resistance is desired, set the option for showing last resistance to Yes. 🟣 FVG FVG Filter : When FVG filtering is activated, the number of FVG areas undergoes filtration based on the specified algorithm. FVG Filter Types : 1. Very Aggressive : Apart from the initial condition, an additional condition is introduced. For an upward FVG, the maximum price of the last candle should exceed the maximum price of the middle candle. Similarly, for a downward FVG, the minimum price of the last candle should be lower than the minimum price of the middle candle. This mode eliminates a minimal number of FVGs. 2. Aggressive : In addition to the conditions of the Very Aggressive mode, this mode considers the size of the middle candle; it should not be small. Consequently, a larger number of FVGs are eliminated in this mode. 3. Defensive : Alongside the conditions of the Very Aggressive mode, this mode takes into account the size of the middle candle, which should be relatively large with the majority of it comprising the body. Furthermore, to identify upward FVGs, the second and third candles must be positive, whereas for downward FVGs, the second and third candles must be negative. This mode filters out a considerable number of FVGs, retaining only those of suitable quality. 4. Very Defensive : In addition to the conditions of the Defensive mode, the first and third candles should not be very small-bodied doji candles. This mode filters out the majority of FVGs, leaving only the highest quality ones. Show Demand FVG: Enables the display of demand-related boxes, which can be toggled between off and on. Show Supply FVG: Enables the display of supply-related boxes along the path, which can also be toggled between off and on. 🟣 Liquidity Statics Liquidity Line Sensitivity : A value ranging from 0 to 0.4. Increasing this value reduces the sensitivity of the "Statics Liquidity Line Detection" function and increases the number of identified lines. The default value is 0.3. Dynamics Liquidity Line Sensitivity : A value ranging from 0.4 to 1.95. Increasing this value enhances the sensitivity of the "Dynamics Liquidity Line Detection" function and decreases the number of identified lines. The default value is 1. Statics Period Pivot : Default value is set to 8. By adjusting this value, you can specify the period for static liquidity line pivots. Dynamics Period Pivot : Default value is set to 3. By adjusting this value, you can specify the period for dynamic liquidity line pivots. You can activate or deactivate liquidity lines as necessary using the buttons labeled "Show Statics High Liquidity Line," "Show Statics Low Liquidity Line," "Show Dynamics High Liquidity Line," and "Show Dynamics Low Liquidity Line". Индикатор Pine Script®от TFlabОбновлено 3535 6.1 K
Crystal Order BlockThe Crystal Order Block Indicator is a powerful tool designed to help traders identify key institutional order blocks with high precision. This indicator is ideal for traders following Smart Money Concepts (SMC) and Institutional Trading Strategies, providing clear insights into potential high-probability trade setups. 🔹 Key Features: ✔ Automatic Order Block Detection: Identifies valid bullish & bearish order blocks. ✔ Unmitigated Order Blocks Highlighted: Focuses on fresh order blocks for improved trade opportunities. ✔ Trend-Focused Trading: Works best when combined with market structure analysis. ✔ Multi-Timeframe Support: Suitable for scalping, swing trading, and intraday trading. ✔ Risk Management Enhancement: Helps traders refine entries and exits based on institutional price movements. 📈 How to Use the Crystal Order Block Indicator: 🔹 Identifying Order Blocks: ➡ The indicator automatically detects order blocks formed by institutional trading activity. ➡ Unmitigated order blocks are highlighted, indicating areas where price may react. 🔹 High-Probability Trade Setups: ➡ Buy Setup: Look for a bullish order block in an uptrend, confirming strength. ➡ Sell Setup: Identify a bearish order block in a downtrend for potential short trades. 🔹 Order Block Mitigation: ➡ The updated version filters out mitigated order blocks, allowing traders to focus on fresh trading opportunities. 📊 Best Practices & Timeframes: 🔸 Works on all timeframes, but higher accuracy is observed on M30 and above. 🔸 Best suited for Smart Money Trading, Institutional Trading, and Price Action Strategies. 🔸 Should be used with liquidity concepts and market structure analysis for enhanced precision. ⚠ Important Note: This indicator is a technical tool designed to assist traders in market analysis. It does not guarantee success and should be used alongside proper risk management and trading discipline. Индикатор Pine Script®от Crystalforex2244786
Support Resistance with Order BlocksIndicator Description Professional Price Level Detection for Smart Trading. Master the Markets with Precision Support/Resistance and Order Block Analysis . It provides traders with clear visual cues for potential reversal and breakout areas, combining both retail and institutional trading concepts into one powerful tool. The Support & Resistance with Order Blocks indicator is a versatile Pine Script tool designed to empower traders with clear, actionable insights into key market levels. By combining advanced pivot-based support and resistance (S/R) detection with order block (OB) filtering, this indicator delivers clean, high-probability zones for entries, exits, and reversals. With customizable display options (boxes or lines) and intuitive settings, it’s perfect for traders of all styles—whether you’re scalping, swing trading, or investing long-term. Overlay it on your TradingView chart and elevate your trading strategy today! ________________________________________ Key Features ✅ Dynamic Support/Resistance - Auto-adjusting levels based on price action ✅ Smart Order Block Detection - Identifies institutional buying/selling zones ✅ Dual Display Modes - Choose between Boxes or Clean Lines for different chart styles ✅ Customizable Sensitivity - Adjust detection parameters for different markets ✅ Broken Level Markers - Clearly shows when key levels are breached ✅ Timeframe-Adaptive - Automatically adjusts for daily/weekly charts 1. Dynamic Support & Resistance Detection Identifies critical S/R zones using pivot high/low calculations with adjustable look back periods. Visualizes active S/R zones with distinct colors and labels ("Support" or "Resistance" for boxes, lines for cleaner charts). Marks broken S/R levels as "Br S" (broken support) or "Br R" (broken resistance) when historical display is enabled, aiding in breakout and reversal analysis. 2. Smart Order Block Identification Detects bullish and bearish order blocks based on significant price movements (default: ±0.3% over 5 candles). Highlights institutional buying/selling zones with customizable colors, displayed as boxes or lines. Filters out overlapping OB zones to keep your chart clutter-free. 3. Dual Display Options Boxes or Lines: Choose to display S/R and OB as boxes for detailed zones or lines for a minimalist view. Line Width Customization: Adjust line widths for S/R and OB (1–5 pixels) for optimal visibility. Color Customization: Tailor colors for active/broken S/R and bullish/bearish OB zones. 4. Advanced Overlap Filtering Ensures S/R zones don’t overlap with OB zones or other S/R levels, providing only the most relevant levels. Limits the number of active zones (default: 10) to maintain chart clarity. 5. Historical S/R Visualization Optionally display broken S/R levels with distinct colors and labels ("Br S" or "Br R") to track historical price reactions. Broken levels are dynamically updated and removed (or retained) based on user settings. 6. Timeframe Adaptability Automatically adjusts pivot detection for daily/weekly timeframes (40-candle look back) versus shorter timeframes (20-candle look back). Works seamlessly across all asset classes (stocks, forex, crypto, etc.) and timeframes. ________________________________________ How It Works • Support & Resistance: Uses ta.pivothigh and ta.pivotlow to detect significant price pivots, with a user-defined look back (default: 5 candles post-pivot). Plots S/R as boxes (with labels "Support" or "Resistance") or lines, extending to the current bar for real-time relevance. Broken S/R levels are marked with adjusted colors and labels ("S" or "R" for boxes, "Br S" or "Br R" for lines when historical display is enabled). • Order Blocks: Identifies OB based on strong price movements over 4 candles, plotted as boxes or lines at the candle’s midpoint. Validates OB to prevent overlap, ensuring only significant zones are displayed. Removes OB zones when price breaks through, keeping the chart focused on active levels. • Customization: Toggle S/R and OB visibility, adjust detection sensitivity, and set maximum active zones (4–50). Fine-tune line widths and colors for a personalized chart experience. ________________________________________ Why Use This Indicator? • Precision Trading: Pinpoint high-probability entry/exit zones with filtered S/R and OB levels. • Clean Charts: Overlap filtering and zone limits reduce clutter, focusing on key levels. • Versatile Display: Switch between boxes for detailed zones or lines for simplicity, with adjustable line widths. • Institutional Edge: Leverage OB detection to align with institutional activity for smarter trades. • User-Friendly: Intuitive settings and clear visuals make it accessible for beginners and pros alike. ________________________________________ Settings Overview________________________________________ ⚙ Input Parameters Settings Overview Display Options: Display Type: Choose "Boxes" or "Lines" for S/R and OB visualization. S/R Line Width: Set line thickness for S/R lines (1–5 pixels, default: 2). OB Line Width: Set line thickness for OB lines (1–5 pixels, default: 2). Order Block Options: Show Order Block: Enable/disable OB display. Bull/Bear OB Colors: Customise border and fill colors for bullish and bearish OB zones. Support/Resistance Options: Show S/R: Toggle active S/R zones. Show Historical S/R: Display broken S/R levels, marked as "Br S" or "Br R" for lines. Detection Period: Set candle lookback for pivot detection (4–50, default: 5). Max Active Zones: Limit active S/R and OB zones (4–50, default: 10). Colors: Customise active and broken S/R colors for clear differentiation. ________________________________________ How to Use 1. Add to Chart: Apply the indicator to your TradingView chart. 2. Customize Settings: o Select "Boxes" or "Lines" for your preferred display style. o Adjust line widths, colors, and detection parameters to suit your trading style. o Enable "Show Historical S/R" to track broken levels with "Br S" and "Br R" labels. 3. Analyze Levels: o Use support zones (green) for buy entries and resistance zones (red) for sell entries. o Monitor OB zones for institutional activity, signaling potential reversals or continuations. o Watch for "Br S" or "Br R" labels to identify breakout opportunities. 4. Combine with Other Tools: Pair with trend indicators, volume analysis, or price action for a robust strategy. 5. Monitor Breakouts: Trade breakouts when price breaches S/R or OB zones, with historical labels providing context. ________________________________________ Example Use Cases • Swing Trading: Use S/R and OB zones to identify entry/exit points, with historical broken levels for context. • Breakout Trading: Trade price breaks through S/R or OB, using "Br S" and "Br R" labels to confirm reversals. • Scalping: Adjust detection period for faster S/R and OB identification on lower timeframes. ________________________________________ • Performance: Optimized for all timeframes, with best results on 5M, 15M, 30M, 1H, 4H, or daily charts for swing trading. • Compatibility: Works with any asset class and TradingView chart. ________________________________________ Get Started Transform your trading with Support & Resistance with Order Blocks! Add it to your chart, customize it to your style, and trade with confidence. For questions or feedback, drop a comment on TradingView or message the author. Happy trading! 🚀 ________________________________________ Disclaimer: This indicator is for educational and informational purposes only. Always conduct your own analysis and practice proper risk management before trading. Индикатор Pine Script®от Trend_MyFrendОбновлено 99 1.7 K
Breaker Blocks + Order Blocks confirm [TradingFinder] BBOB Alert🔵 Introduction In the realm of technical analysis, various tools and concepts are employed to identify key levels on price charts. These tools assist traders in analyzing market trends with greater precision, enabling them to optimize their trading decisions. Among these tools, the Order Block and Breaker Block hold a significant place, serving as effective instruments for analyzing market structure. 🟣 Order Block An Order Block refers to zones on a chart where large financial institutions and high-volume traders place their orders. Due to the substantial volume of buy or sell orders in these areas, they are often regarded as pivotal points for potential price reversals or temporary pauses in a trend. Order Blocks are particularly crucial when prices react to these zones after a strong market move, acting as strong support or resistance levels. 🟣 Breaker Block On the other hand, a Breaker Block refers to areas on a chart that previously functioned as Order Blocks but where the price has managed to break through and continue in the opposite direction. These zones are typically recognized as key points where market trends might shift, helping traders identify potential reversal points in the market. 🟣 Overlapping Block (BBOB) Now, imagine a scenario where these two essential concepts in technical analysis—Order Blocks and Breaker Blocks—overlap on a chart. Although this overlap is not specifically discussed within the ICT (Inner Circle Trader) trading framework, exploring and utilizing this overlap can provide traders with powerful insights into strong support and resistance zones. The combination of these two robust concepts can highlight critical areas in trading, potentially offering significant advantages in making informed trading decisions. In this article, we will delve into the concept of this overlap, explaining how to utilize it in trading strategies. Additionally, we will analyze the potential outcomes and benefits of incorporating this concept into your trading decisions. Bullish Overlapping Block (BBOB) : Bearish Overlapping Block (BBOB) : 🔵 How to Use The overlap between Order Blocks and Breaker Blocks is a compelling and powerful concept that can help traders identify key levels on the chart with a high probability of success. This overlap is particularly valuable because it combines two well-regarded concepts in technical analysis—zones of high order volume and critical market shifts. 🟣 Here’s how to effectively use this overlap in your trading 1. Dentifying the Overlapping Block : To make the most of the overlap between Order Blocks and Breaker Blocks, begin by identifying these zones separately. Order Blocks are areas where price typically reacts and reverses after a strong market move. Breaker Blocks are areas where a previous Order Block has been breached, and the price continues in the opposite direction. When these two zones overlap on a chart, it’s crucial to pay close attention to this area, as it represents a high-probability reaction zone. 2. Analyzing the Overlapping Block : After identifying the overlap zone, carefully analyze price action within this region. Candlestick patterns and price behavior can provide essential clues. If the price reaches this overlap zone and strong reversal patterns such as Pin Bars or Engulfing patterns are observed, it’s likely that this zone will act as a pivotal reversal point. In such cases, entering a trade with confidence becomes more feasible. 3. Entering the Trade : When sufficient signs of price reaction are present in the overlap zone, you can proceed to enter the trade. If the overlap zone is within an uptrend and bullish reversal signals are evident, a long position might be appropriate. Conversely, if the overlap zone is in a downtrend and bearish reversal signals are observed, a short position would be more suitable. 4. Risk Management : One of the most critical aspects of trading in overlap zones is managing risk. To protect your capital, place your stop loss near the lowest point of the Order Block (for buy trades) or the highest point (for sell trades). This approach minimizes potential losses if the overlap zone fails to hold. 5. Price Targets : After entering the trade, set your price targets based on other key levels on the chart. These targets could include other support and resistance zones, Fibonacci levels, or pivot points. Bullish Overlapping Block : Bearish Overlapping Block : 🟣 Benefits of the Overlapping Block Between Order Block and Breaker Block 1. Enhanced Precision in Identifying Key Levels : The overlap between these two zones usually acts as a highly reliable area for price reactions, increasing the accuracy of identifying entry and exit points. 2. Reduced Trading Risk : Given the high importance of the overlap zone, the likelihood of making incorrect decisions is reduced, contributing to overall lower trading risk. 3. Increased Probability of Success : The overlap between Order Blocks and Breaker Blocks combines two powerful concepts, enhancing the likelihood of success in trades, as multiple indicators confirm the importance of the area. 4. Creation of Better Trading Opportunities : Overlap zones often provide traders with more robust trading opportunities, as these areas typically represent strong reversal points in the market. 5. Compatibility with Other Technical Tools : This concept seamlessly integrates with other technical analysis tools such as Fibonacci retracements, trend lines, and chart patterns, offering a more comprehensive market analysis. 🔵 Setting 🟣 Global Setting Pivot Period of Order Blocks Detector : Enter the desired pivot period to identify the Order Block. Order Block Validity Period (Bar) : You can specify the maximum time the Order Block remains valid based on the number of candles from the origin. Mitigation Level Order Block : Determining the basic level of a Order Block. When the price hits the basic level, the Order Block due to mitigation. Mitigation Level Breaker Block : Determining the basic level of a Breaker Block. When the price hits the basic level, the Breaker Block due to mitigation. Mitigation Level Overlapping Block : Determining the basic level of a Overlapping Block. When the price hits the basic level, the Overlapping Block due to mitigation. 🟣 Overlapping Block Display Show All Overlapping Block : If it is turned off, only the last Order Block will be displayed. Demand Overlapping Block : Show or not show and specify color. Supply Overlapping Block : Show or not show and specify color. 🟣 Order Block Display Show All Order Block : If it is turned off, only the last Order Block will be displayed. Demand Main Order Block : Show or not show and specify color. Demand Sub (Propulsion & BoS Origin) Order Block : Show or not show and specify color. Supply Main Order Block : Show or not show and specify color. Supply Sub (Propulsion & BoS Origin) Order Block : Show or not show and specify color. 🟣 Breaker Block Display Show All Breaker Block : If it is turned off, only the last Breaker Block will be displayed. Demand Main Breaker Block : Show or not show and specify color. Demand Sub (Propulsion & BoS Origin) Breaker Block : Show or not show and specify color. Supply Main Breaker Block : Show or not show and specify color. Supply Sub (Propulsion & BoS Origin) Breaker Block : Show or not show and specify color. 🟣 Order Block Refinement Refine Order Blocks : Enable or disable the refinement feature. Mode selection. 🟣 Alert Alert Name : The name of the alert you receive. Alert Overlapping Block Mitigation : On / Off Message Frequency : This string parameter defines the announcement frequency. Choices include: "All" (activates the alert every time the function is called), "Once Per Bar" (activates the alert only on the first call within the bar), and "Once Per Bar Close" (the alert is activated only by a call at the last script execution of the real-time bar upon closing). The default setting is "Once per Bar". Show Alert Time by Time Zone : The date, hour, and minute you receive in alert messages can be based on any time zone you choose. For example, if you want New York time, you should enter "UTC-4". This input is set to the time zone "UTC" by default. 🔵 Conclusion The overlap between Order Blocks and Breaker Blocks represents a critical and powerful area in technical analysis that can serve as an effective tool for determining entry and exit points in trading. These zones, due to the combination of two key concepts in technical analysis, hold significant importance and can help traders make more confident trading decisions. Although this concept is not specifically discussed in the ICT framework and is introduced as a new idea, traders can achieve better results in their trades through practice and testing. Utilizing the overlap between Order Blocks and Breaker Blocks, in conjunction with other technical analysis tools, can significantly improve the chances of success in trading. Индикатор Pine Script®от TFlabОбновлено 99 5.6 K
Simple ICT Order Blocks and Fair Value Gaps by Gowtham KannakajeThis scripts identifies ICT Order Block and ICT Fair Value Gaps Fair Value Gap: - Fair Value Gap toggle is off by default - Users can choose to color the bars having Fair Value Gaps or can select to define the Fair Value Gap using boxes. - Bar color and box colors can be customized Order Blocks: - Order Block box and candle color toggle is on by default - Users can choose to color the Order Block candles or can select to define the Order Blocks using boxes. - Bar color and box colors can be customized for bullish and bearish Order Block separately Note: - Order Blocks are considered valid only if the candle forming the Fair Value Gap closes away from the Order Block. - Since Trading View limits the number of boxes to 500, it is advised to use the Color Candle option to identify the Order Blocks or Fair Value Gaps which are very old. New concept Definitions: Naked OB : An order block whose immediate next candle forms a Fair Value Gap. Here, the Order Block high or low contributes to the formation of Fair Value Gap. Covered OB : An order block whose immediate next candle doesn't form a Fair Value Gap. Here, the Order Block high or low doesn't contribute to the formation of Fair Value Gap. Instead it will have other candles in between the Order Block and Fair Value Gap. Disclaimer: The usage of this indicator might or might not contribute to your profits and losses and the author is not responsible for the same. Happy Trading.Индикатор Pine Script®от GowthamKannakajeОбновлено 130130 3 K
High Probability Order Blocks [AlgoAlpha]🟠 OVERVIEW This script detects and visualizes high-probability order blocks by combining a volatility-based z-score trigger with a statistical survival model inspired by Kaplan-Meier estimation. It builds and manages bullish and bearish order blocks dynamically on the chart, displays live survival probabilities per block, and plots optional rejection signals. What makes this tool unique is its use of historical mitigation behavior to estimate and plot how likely each zone is to persist, offering traders a probabilistic perspective on order block strength—something rarely seen in retail indicators. 🟠 CONCEPTS Order blocks are regions of strong institutional interest, often marked by large imbalances between buying and selling. This script identifies those areas using z-score thresholds on directional distance (up or down candles), detecting statistically significant moves that signal potential smart money footprints. A bullish block is drawn when a strong up-move (zUp > 4) follows a down candle, and vice versa for bearish blocks. Over time, each block is evaluated: if price “mitigates” it (i.e., closes cleanly past the opposite side and confirmed with a 1 bar delay), it’s considered resolved and logged. These resolved blocks then inform a Kaplan-Meier-like survival curve, estimating the likelihood that future blocks of a given age will remain unbroken. The indicator then draws a probability curve for each side (bull/bear), updating it in real time. 🟠 FEATURES Live label inside each block showing survival probability or “N.E.D.” if insufficient data. Kaplan-Meier survival curves drawn directly on the chart to show estimated strength decay. Rejection markers (▲ ▼) if price bounces cleanly off an active order block. Alerts for zone creation and rejection signals, supporting rule-based trading workflows. 🟠 USAGE Read the label inside each block for Age | Survival% (or N.E.D. if there aren’t enough samples yet); higher survival % suggests blocks of that age have historically lasted longer. Use the right-side survival curves to gauge how probability decays with age for bull vs bear blocks, and align entries with the side showing stronger survival at current age. Treat ▲ (bullish rejection) and ▼ (bearish rejection) as optional confluence when price tests a boundary and fails to break. Turn on alerts for “Bullish Zone Created,” “Bearish Zone Created,” and rejection signals so you don’t need to watch constantly. If your chart gets crowded, enable Prevent Overlap ; tune Max Box Age to your timeframe; and adjust KM Training Window / Minimum Samples to trade off responsiveness vs stability.Индикатор Pine Script®от AlgoAlphaОбновлено 1515 3.2 K
Cody Order Block Finder with RegressionThe Cody Order Block Finder with Regression Channel is a comprehensive trading tool that combines order block identification with linear regression analysis. This dual-approach indicator is designed to help traders identify potential institutional order flow zones within the context of established market trends, providing a structured methodology for trade entry and exit decisions. Free Telegram Trading Community t.me Order Block Detection System Identifies potential institutional buying and selling zones based on specific candle patterns Configurable detection parameters including required subsequent candles and minimum percentage moves Three visual color schemes (Dark, Bright, Neon) for different chart backgrounds Options to display order blocks using wick ranges or body ranges Advanced filtering capabilities including size-based and ATR-based filters Historical display controls with options to show all order blocks or only the most recent instances Linear Regression Channel Customizable regression length from 1 to 5000 periods Upper and lower deviation channels with adjustable multipliers Pearson's R correlation coefficient display for trend strength assessment Flexible extension options for channel lines (left, right, both, or none) Visual channel fills between regression lines for clear trend identification Technical Specifications Detection Logic Bullish order blocks: Identified by a bearish candle followed by a specified number of consecutive bullish candles with minimum percentage movement Bearish order blocks: Identified by a bullish candle followed by a specified number of consecutive bearish candles with minimum percentage movement Size validation through configurable percentage thresholds Optional ATR filtering for volatility-adjusted order block identification Visual Elements Triangle markers indicating order block locations above or below relevant candles Extended lines marking order block boundaries with configurable right-side extension Informative labels displaying order block size percentages Dynamic trend labels based on regression slope analysis Adjustable transparency and coloring for all visual elements Alert System Context-aware alerts that only trigger in confirmed trends Buy alerts: Bullish order blocks detected during uptrends (positive regression slope) Sell alerts: Bearish order blocks detected during downtrends (negative regression slope) Customizable alert messages with trend context information Performance Optimization Maximum 500 lines and 500 labels for system resource management Efficient array-based line management for historical display controls Conditional calculations to reduce processing overhead Application for Traders This indicator serves multiple trading methodologies: Trend-following traders can use regression channels for trend identification Institutional flow traders can identify potential order block zones Swing traders can locate high-probability reversal areas Risk management through size and volatility filtering The combination of order block detection with regression trend analysis provides traders with a comprehensive tool for identifying potential trade setups that align with both institutional activity and broader market trends. The extensive customization options allow adaptation to various trading styles and market conditions.Индикатор Pine Script®от tonewayclothing44576
[TehThomas] - Order Blocks█ OVERVIEW This Order Blocks indicator identifies institutional-level support and resistance zones using fractal pattern recognition combined with Fair Value Gap (FVG) filtering. Order blocks represent areas where large institutional orders have been placed, creating significant price reactions when retested. This indicator uses a 5-bar fractal pattern to detect market structure breaks and highlights the last bearish or bullish candle before a strong impulse move. █ KEY FEATURES - Fractal-Based Detection: Uses 5-candle fractal patterns to identify key market structure highs and lows - FVG Filtering: Optional Fair Value Gap confirmation ensures order blocks are followed by true market imbalances - Automatic Mitigation: Order blocks are automatically removed when price breaks through them - Overlap Prevention: Prevents cluttered charts by avoiding overlapping order block zones - Customizable Display: Full control over colors, labels, line heights (body/wick), and maximum blocks shown - Dual Polarity: Detects both bullish (OB+) and bearish (OB-) order blocks independently █ HOW IT WORKS The indicator scans price action for fractal patterns where the middle candle forms a local extreme (highest high or lowest low among 5 bars). When price breaks above a fractal high or below a fractal low, the script identifies the last opposing candle in the impulse move as the order block. For bearish order blocks, it finds the highest bullish candle before a fractal low is broken, marking institutional selling pressure. For bullish order blocks, it locates the lowest bearish candle before a fractal high is breached, indicating institutional buying. When FVG filtering is enabled, the indicator confirms that a Fair Value Gap (a 3-candle imbalance where price leaves an unfilled gap) occurred within the specified distance from the order block. This combination increases the probability that institutional traders are present in these zones. █ SETTINGS Bullish Order Block Settings - Show/hide bullish order blocks - Customize fill color and border color - Toggle OB+ label display Bearish Order Block Settings - Show/hide bearish order blocks - Customize fill color and border color - Toggle OB- label display Label Settings - Label size: Tiny, Small, Normal, or Large - Label text color customization General Settings - Bars Back to Check (10-200): Lookback period for order block detection - Filter by FVG: Requires Fair Value Gap confirmation - Max Bars Between OB and FVG (1-6): Distance tolerance for FVG filtering - Line Height: Choose between Body or Wick for order block boundaries - Prevent Overlapping OBs: Avoids drawing overlapping zones - Max Order Blocks to Display (1-50): Limits active blocks on chart - Length of Boxes (10-100): Horizontal projection length █ HOW TO USE 1. Add the indicator to your TradingView chart 2. Configure settings based on your trading timeframe and style 3. Watch for OB+ labels (bullish order blocks) as potential support zones where price may bounce 4. Watch for OB- labels (bearish order blocks) as potential resistance zones where price may reverse 5. Wait for price retracement to the order block zone before taking entries 6. Use confirmation signals like volume spikes or reversal patterns at the order block 7. Place stop loss just outside the order block boundary to manage risk 8. Monitor mitigation: Order blocks disappear when price breaks through them completely █ TRADING STRATEGY EXAMPLES Bullish Order Block Strategy Wait for a market structure shift from bearish to bullish. When price creates a bullish impulse breaking a fractal high, identify the OB+ zone. Enter long positions when price retraces to test the bullish order block, placing stop loss 10-20 pips below the zone's low. Target previous highs or resistance levels. Bearish Order Block Strategy Monitor for market structure shift from bullish to bearish. After price creates a bearish impulse breaking a fractal low, locate the OB- zone. Enter short positions when price retraces to test the bearish order block, placing stop loss 10-20 pips above the zone's high. Target previous lows or support levels. FVG-Confirmed Entries Enable FVG filtering to only display order blocks validated by Fair Value Gaps. These aligned setups increase probability as they combine institutional order placement with market inefficiencies. Trade retracements to these high-confluence zones for better risk-reward ratios. █ IDEAL FOR - ICT Traders: Follows Inner Circle Trader methodology for institutional order flow - Smart Money Concepts: Tracks where large players place orders - Swing Traders: Identifies key support/resistance for multi-day holds - Price Action Traders: Pure chart-based approach without lagging indicators - Breakout Traders: Confirms structure breaks with fractal patterns - Forex, Crypto, and Stock Markets: Works on all liquid markets and timeframes █ TECHNICAL SPECIFICATIONS - Max Boxes: 500 - Max Labels: 500 - Detection Method: 5-bar fractal pattern recognition - Mitigation Logic: Automatic removal when price breaks order block boundaries - Time Projection: Uses time offset calculations for box extension - Array Management: Dynamic array cleanup to prevent memory issues █ NOTES & DISCLAIMERS - Order blocks work best when combined with overall market context and trend analysis - Not all order blocks result in price reversals; use proper risk management - FVG filtering may reduce the number of signals but increases quality - Fractal patterns require 5 bars to form, causing a 2-bar delay in detection - Works optimally on higher timeframes (4H, Daily) for institutional footprints - This indicator does not guarantee profitable trades; always use stop losses - Past performance of order blocks does not predict future results - Compatible with other ICT concepts like liquidity sweeps and market structure Индикатор Pine Script®от TehThomasОбновлено 88510
ICT Order Blocks v2 (Debug)Josh has a very large PP xD Understanding Order Blocks (OBs) - The ICT Perspective This document delves into the concept of Order Blocks (OBs) from the perspective of the ICT methodology. It outlines what OBs are, their significance in trading, and how the "ICT Order Blocks v2 (Refined)" indicator functions to identify and visualize these critical price levels. By understanding OBs, traders can better navigate market movements and make informed decisions based on institutional trading behavior. What is an Order Block (OB)? Within ICT methodology, an Order Block represents a specific price candle where significant buying or selling interest from institutions (Smart Money) is believed to have occurred. They are potential areas where price might return and react. Bullish Order Block: Typically the last down-closing candle before a strong, impulsive upward move (displacement). It suggests institutions may have absorbed selling pressure and initiated long positions here. Bearish Order Block: Typically the last up-closing candle before a strong, impulsive downward move (displacement). It suggests institutions may have distributed long positions or initiated short positions here. Why are OBs Significant (ICT View)? Institutional Footprint: They mark potential zones of large order execution. Support/Resistance: Unmitigated OBs can act as sensitive price levels where reactions are expected. Bullish OBs may provide support; Bearish OBs may provide resistance. Origin of Moves: They often mark the origin point of significant price swings. Liquidity Engineering: Institutions might drive price back to OBs to mitigate earlier positions or to engineer liquidity before continuing a move. Common Refinements ICT often emphasizes higher probability OBs that are associated with: Displacement: The move away from the OB is sharp and decisive. Fair Value Gaps (FVGs): An FVG forming immediately after the OB strengthens its validity. OB Mitigation: This refers to price returning to the level of the Order Block after its formation. Price might react at the edge (proximal line) or the 50% level (mean threshold) of the OB. An OB is often considered fully mitigated or invalidated if price trades decisively through its entire range, especially with a candle body closing beyond it. How the "ICT Order Blocks v2 (Refined)" Indicator Works This indicator automates the detection and visualization of the most recent unmitigated Order Block of each type (Bullish/Bearish), incorporating optional filters. Detection: It looks at the relationship between the candle two bars ago ( ), the previous candle ( ), and potentially the current candle ( ). Bullish OB: Identifies if candle was a down-close (close < open ) AND candle broke above the high of candle (high > high ). Bearish OB: Identifies if candle was an up-close (close > open ) AND candle broke below the low of candle (low < low ). Accuracy Filters (Optional Inputs): These filters help identify potentially higher-probability OBs: Require Fair Value Gap (FVG)?: If enabled, the indicator checks if an FVG formed immediately after the OB candle ( ). Specifically, it looks for a gap between candle and candle (low > high for Bullish OB confirmation, high < low for Bearish). Require Strong Close Breakout?: If enabled, it requires the breakout candle ( ) to close beyond the range of the OB candle ( ). (close > high for Bullish, close < low for Bearish). This suggests stronger confirmation. Storing the Most Recent OB: When an OB is detected and passes any enabled filters, its details (high, low, formation bar index) are stored. Crucially, this indicator only tracks the single most recent valid unmitigated OB of each type (one Bullish, one Bearish) using var variables. If a newer valid OB forms, it replaces the previously stored one. Drawing Boxes: If a valid Bullish OB is being tracked (and Show Bullish OBs is enabled), it draws a box (box.new) using the high and low of the identified OB candle ( ). The same process applies to Bearish OBs (Show Bearish OBs enabled). The boxes automatically extend to the right (extend.right) and their right edge is updated on each new bar (box.set_right) until they are mitigated. Labels ("Bull OB" / "Bear OB") are displayed inside the boxes. Mitigation & Box Deletion: The indicator checks if the current closing price (close ) has moved entirely beyond the range of the tracked OB. Mitigation Rule Used: A Bullish OB is considered mitigated if close < bull_ob_low. A Bearish OB is considered mitigated if close > bear_ob_high. Once an OB is marked as mitigated, the indicator stops tracking it and its corresponding box is automatically deleted (box.delete) from the chart. This indicator provides a dynamic visualization of the most recent, potentially significant Order Blocks that meet the specified criteria, helping traders identify key areas of interest based on ICT principles.Индикатор Pine Script®от joshuaburton096162