Combo Strategies 123 Reversal and Accelerator Oscillator (AC) This is combo strategies for get
a cumulative signal. Result signal will return 1 if two strategies
is long, -1 if all strategies is short and 0 if signals of strategies is not equal.
First strategy
This System was created from the Book "How I Tripled My Money In The
Futures Market" by Ulf Jensen, Page 183. This is reverse type of strategies.
The strategy buys at market, if close price is higher than the previous close
during 2 days and the meaning of 9-days Stochastic Slow Oscillator is lower than 50.
The strategy sells at market, if close price is lower than the previous close price
during 2 days and the meaning of 9-days Stochastic Fast Oscillator is higher than 50.
Second strategy
The Accelerator Oscillator has been developed by Bill Williams
as the development of the Awesome Oscillator. It represents the
difference between the Awesome Oscillator and the 5-period moving
average, and as such it shows the speed of change of the Awesome
Oscillator, which can be useful to find trend reversals before the
Awesome Oscillator does.
WARNING:
- This script to change bars colors.
Поиск скриптов по запросу "oscillator"
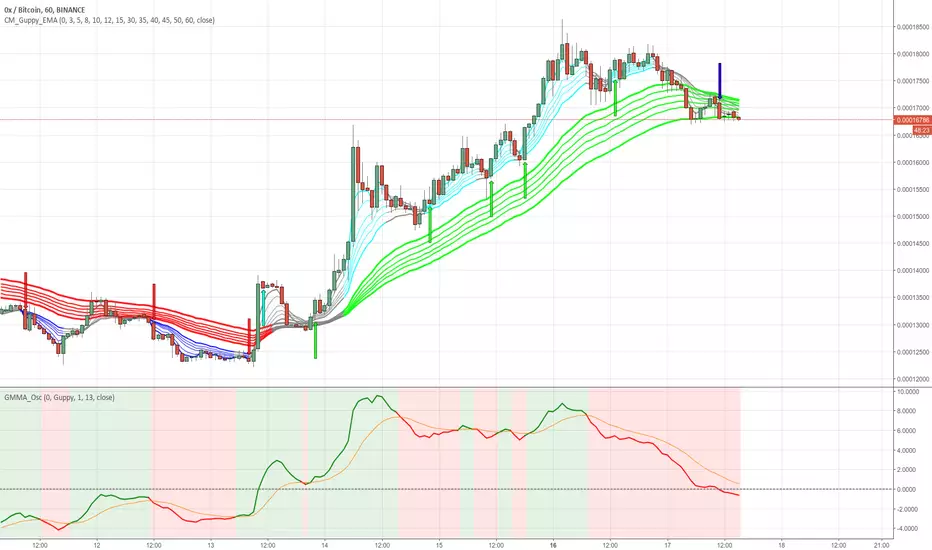
GMMA Oscillator v1 by JustUncleLOn request, here is my version of the Guppy GMMA Oscillator (and SuperGuppy Oscillator) to match with my Guppy and Super Guppy indicators.
Description:
The Guppy Multiple Moving Average (GMMA) is a technical indicator that displays two sets of moving averages. The first set contains six exponential moving averages that use faster periods to monitor the trading activity of short-term traders. The second set contains six exponential moving averages that use slower periods to monitor the trading activity of long-term investors.
The GMMA Oscillator is a technical indicator developed by Leon Wilson. The oscillator line, which percentage difference between the Fast and Slow GMMA sets. The second line is the signal line and it is simply the exponential moving average of the oscillator line.
As with many trend following indicators, a bullish signal occurs when the oscillator line crosses above the signal line and a bearish signal when the oscillator line crosses below the signal line.
Options:
Select between Guppy MMA or SuperGuppy MMA calculated Oscillator.
Option to apply smoothing to the Oscillator line (recommendation 3)
Option to change Signal line period length
Option to use Anchor Time frame to match the Guppy or SuperGuppy chart
Option to show coloured Bullish/Bearish trading Zones
Crossover alerts are also generated to be picked up by the TradingView's Alarm Sub-system.
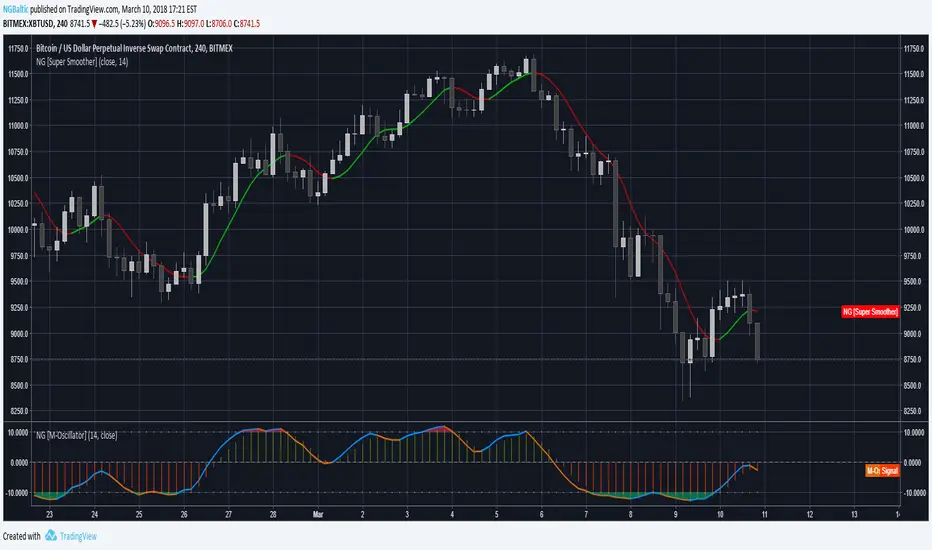
M-OscillatorThe M-Oscillator is a bounded oscillator that moves between (-14) and (+14), it gives early buy/sell signals, spots divergences, displays overbought/oversold levels, and provides re-entry points, and it also work as a trend identifier.
Interpretation
• M-Oscillator is plotted along the bottom of the price chart; it fluctuates between positive and negative 14.
• Movement above 10 is considered overbought, and movement below -10 is oversold.
• In sharp moves to the upside, the M-Oscillator fluctuates between 5 and 14, while in down side it fluctuates between -5 and -14.
• In an uptrend, the M-Oscillator fluctuates between zero and 14 and vice versa.
Trading tactics
Overbought/Oversold: We define the overbought area as anywhere above the 10 level.
The oversold area is below -10. When the M-Oscillator goes above 10 (overbought) and then re-crosses it to the downside, a sell signal is triggered.
When the M-Oscillator surpasses -10 to the downside and then re-crosses back above this level, a buy signal is triggered.
This tactic is only successful during sideways markets; during an uptrend, the oscillator will remain in its overbought territory for long period of times.
During a downtrend, it will remain in oversold for a long time.
Divergence
Divergence is one of the most striking features of the M-Oscillator.
It is a very important aspect of technical analysis that enhances trading tactics enormously; it shows hidden weakness or strength in the market, which is not apparent in the price action.
A positive divergence occurs when the price is declining and makes a lower low, while M-Oscillator witnesses a higher low.
A negative divergence occurs when the price is rising and makes a higher High, while the M-Oscillator makes a lower high, which indicates hidden weakness in the market.
Divergences are very important as they give us early hints of trend reversal (weekly chart)
ARO Pro — Adaptive Regime OscillatorARO Pro — Adaptive Regime Oscillator (v6)
ARO Pro turns your chart into a context-aware decision system. It classifies every bar as Trending (up or down) or Ranging in real time, then switches its math to match the regime: trend strength is measured with an ATR-normalized EMA spread, while range behavior is tracked with a center-based RSI oscillator. The result is cleaner entries, fewer false signals, and faster reads on regime shifts—without repainting.
⸻
How it works (under the hood)
1. Regime Detection (Kaufman ER):
ARO computes Kaufman’s Efficiency Ratio (ER) over a user-defined length.
- ER > threshold → Trending (direction from EMA fast vs. EMA slow)
- ER ≤ threshold → Ranging
2. Adaptive Oscillator Core:
- Trend mode: (EMA(fast) − EMA(slow)) / ATR * 100 → momentum normalized by volatility.
- Range mode: RSI(length) − 50 → mean-reversion pressure around zero.
3. Volatility Filter (optional):
Blocks signals if ATR as % of price is below a floor you set. This reduces noise in thin or quiet markets.
4. MTF Trend Filter (optional & non-repainting):
Confirms signals only if a higher timeframe EMA(fast) > EMA(slow) for longs (or < for shorts). Implemented with lookahead_off and gaps_on.
5. Confirmation & Alerts:
Signals are locked only on bar close (barstate.isconfirmed) and offered via three alert types: ARO Long, ARO Short, ARO Regime Shift.
⸻
What you see on the chart
• Background heat:
• Green = Trending Up, Red = Trending Down, Gray = Range.
• ARO line (panel): Adaptive oscillator (trend/value colors).
• Signal markers: ▲ Long / ▼ Short on confirmed bars.
• Guide lines: Upper/Lower thresholds (±K) and zero line.
• Info Panel (table): Regime, ER, ATR %, ARO, HTF status (OK/BLOCK/OFF), and a Confidence light.
• Debug Overlay (optional): Quick view of thresholds and raw conditions for tuning.
⸻
Inputs (quick reference)
• Signals: Fast/Slow EMA, RSI length, ER length & threshold, oscillator smoothing, signal threshold.
• Filters: ATR length, minimum ATR% (volatility floor), toggle for volatility filter.
• Visuals: Background on/off, Info Panel on/off, Debug overlay on/off.
• MTF (safe): Toggle + HTF timeframe (e.g., 240, D, W).
⸻
Interpreting signals
• Long: Trend regime AND fast EMA > slow EMA AND ARO ≥ +threshold (confirmed bar, filters passing).
• Short: Trend regime AND fast EMA < slow EMA AND ARO ≤ −threshold (confirmed bar, filters passing).
• Regime Shift: Alert when ER moves the market from Range → Trend or flips trend direction.
⸻
Practical use cases & examples
1) Intraday momentum alignment (scalps to day trades)
• Timeframes: 5–15m with HTF filter = 4H.
• Flow:
1. Wait for Trend Up background + HTF OK.
2. Enter on ▲ Long when ARO crosses above +threshold.
3. Stops: 1–1.5× ATR(14) below trigger bar or below last micro swing.
4. Exits: Partial at 1× ATR, trail remainder with an ATR stop or when ARO reverts to zero/Regime Shift.
• Why it works: You’re trading with the dominant higher-timeframe structure while avoiding low-volatility fakeouts.
2) Swing trend following (cleaner trend legs)
• Timeframes: 1H–4H with HTF filter = 1D.
• Flow:
1. Only act in Trend background aligned with HTF.
2. Add on subsequent ▲ signals as ARO maintains positive (or negative) territory.
3. Reduce or exit on Regime Shift (Trend → Range or direction flip) or when ARO crosses back through zero.
• Stops/targets: Initial 1.5–2× ATR; move to breakeven once the trade gains 1× ATR; trail with a multiple-ATR or structure lows/highs.
3) Range tactics (fade the extremes)
• Timeframes: 15m–1H or 1D on mean-reverting names.
• Flow:
1. Act only when background = Range.
2. Fade moves when ARO swings from ±extremes back toward zero near well-defined S/R.
3. Exit at the opposite band or zero line; abort if a Regime Shift to Trend occurs.
• Tip: Increase ER threshold (e.g., 0.35–0.40) to label more bars as Range on choppy instruments.
4) Event days & macro filters
• Approach: Raise the volatility floor (Min ATR%) on macro days (FOMC, CPI).
• Effect: You’ll ignore “fake” micro swings in the minutes leading up to releases and catch only post-event confirmed momentum.
⸻
Parameter tuning guide
• ER Threshold:
• Lower (0.20–0.30) = more Trend bars, more signals, higher noise.
• Higher (0.35–0.45) = stricter trend confirmation, fewer but cleaner signals.
• Signal Threshold (±K):
• Raise to reduce whipsaws; lower for earlier but noisier triggers.
• Volatility Floor (ATR%):
• Thin/quiet assets benefit from a higher floor (e.g., 0.3–0.6).
• Highly liquid futures/forex can work with lower floors.
• HTF Filter:
• Keep it ON when you want higher win consistency; turn OFF for tactical counter-trend plays.
⸻
Alerts (recommended setup)
• “ARO Long” / “ARO Short”: Entry-style alerts on confirmed signals.
• “ARO Regime Shift”: Context alert to scale in/out or switch playbooks (trend vs. range).
All alerts are non-repainting and fire only when the bar closes.
⸻
Best practices & combinations
• Price action & S/R: Use ARO to define when to engage, and price structure to define where (breakout levels, pullback zones).
• VWAP/Session tools: In intraday trends, ▲ signals above VWAP tend to carry; avoid shorts below session VWAP in strong downtrends.
• Risk first: Size by ATR; never let a single ARO event override your max risk per trade.
• Portfolio filter: On indices/ETFs, enable HTF filter and a stricter ER threshold to ride regime legs.
⸻
Non-repaint and implementation notes
• The script does not repaint:
• Signals are computed and locked on bar close (barstate.isconfirmed).
• All higher-timeframe data uses request.security(..., lookahead_off, gaps_on).
• No future indexing or negative offsets are used.
• The Info Panel and Debug overlay are purely visual aids and do not change signal logic.
⸻
Limitations & tips
• Chop sensitivity: In hyper-choppy symbols, consider raising ER threshold and the signal threshold, and enable HTF filter.
• Instrument personality: EMAs/RSI lengths and volatility floor often need a quick 2–3 minute tune per asset class (FX vs. crypto vs. equities).
• No guarantees: ARO improves context and timing, but it is not a promise of profitability—always combine with risk management.
⸻
Quick start (TL;DR)
1. Timeframes: 5–15m intraday (HTF = 4H); 1H–4H swing (HTF = 1D).
2. Use defaults, then tune ER threshold (0.25–0.40) and Signal threshold (±20).
3. Enable Volatility Floor (e.g., 0.2–0.5 ATR%) on quiet assets.
4. Trade ▲ / ▼ only in matching Trend background; fade extremes only in Range background.
5. Set alerts for Long, Short, and Regime Shift; manage risk with ATR stops.
⸻
Author’s note: ARO Pro is designed to be clear, adaptive, and operational out of the box. If you publish variants (e.g., different ER logic, alternative trend cores), please credit the original and document any changes so users can compare behavior reliably.

Hurst Exponent Oscillator [PhenLabs]📊 Hurst Exponent Oscillator -
Version: PineScript™ v5
📌 Description
The Hurst Exponent Oscillator (HEO) by PhenLabs is a powerful tool developed for traders who want to distinguish between trending, mean-reverting, and random market behaviors with clarity and precision. By estimating the Hurst Exponent—a statistical measure of long-term memory in financial time series—this indicator helps users make sense of underlying market dynamics that are often not visible through traditional moving averages or oscillators.
Traders can quickly know if the market is likely to continue its current direction (trending), revert to the mean, or behave randomly, allowing for more strategic timing of entries and exits. With customizable smoothing and clear visual cues, the HEO enhances decision-making in a wide range of trading environments.
🚀 Points of Innovation
Integrates advanced Hurst Exponent calculation via Rescaled Range (R/S) analysis, providing unique market character insights.
Offers real-time visual cues for trending, mean-reverting, or random price action zones.
User-controllable EMA smoothing reduces noise for clearer interpretation.
Dynamic coloring and fill for immediate visual categorization of market regime.
Configurable visual thresholds for critical Hurst levels (e.g., 0.4, 0.5, 0.6).
Fully customizable appearance settings to fit different charting preferences.
🔧 Core Components
Log Returns Calculation: Computes log returns of the selected price source to feed into the Hurst calculation, ensuring robust and scale-independent analysis.
Rescaled Range (R/S) Analysis: Assesses the dispersion and cumulative deviation over a rolling window, forming the core statistical basis for the Hurst exponent estimate.
Smoothing Engine: Applies Exponential Moving Average (EMA) smoothing to the raw Hurst value for enhanced clarity.
Dynamic Rolling Windows: Utilizes arrays to maintain efficient, real-time calculations over user-defined lengths.
Adaptive Color Logic: Assigns different highlight and fill colors based on the current Hurst value zone.
🔥 Key Features
Visually differentiates between trending, mean-reverting, and random market modes.
User-adjustable lookback and smoothing periods for tailored sensitivity.
Distinct fill and line styles for each regime to avoid ambiguity.
On-chart reference lines for strong trending and mean-reverting thresholds.
Works with any price series (close, open, HL2, etc.) for versatile application.
🎨 Visualization
Hurst Exponent Curve: Primary plotted line (smoothed if EMA is used) reflects the ongoing estimate of the Hurst exponent.
Colored Zone Filling: The area between the Hurst line and the 0.5 reference line is filled, with color and opacity dynamically indicating the current market regime.
Reference Lines: Dash/dot lines mark standard Hurst thresholds (0.4, 0.5, 0.6) to contextualize the current regime.
All visual elements can be customized for thickness, color intensity, and opacity for user preference.
📖 Usage Guidelines
Data Settings
Hurst Calculation Length
Default: 100
Range: 10-300
Description: Number of bars used in Hurst calculation; higher values mean longer-term analysis, lower values for quicker reaction.
Data Source
Default: close
Description: Select which data series to analyze (e.g., Close, Open, HL2).
Smoothing Length (EMA)
Default: 5
Range: 1-50
Description: Length for smoothing the Hurst value; higher settings yield smoother but less responsive results.
Style Settings
Trending Color (Hurst > 0.5)
Default: Blue tone
Description: Color used when trending regime is detected.
Mean-Reverting Color (Hurst < 0.5)
Default: Orange tone
Description: Color used when mean-reverting regime is detected.
Neutral/Random Color
Default: Soft blue
Description: Color when market behavior is indeterminate or shifting.
Fill Opacity
Default: 70-80
Range: 0-100
Description: Transparency of area fills—higher opacity for stronger visual effect.
Line Width
Default: 2
Range: 1-5
Description: Thickness of the main indicator curve.
✅ Best Use Cases
Identifying if a market is regime-shifting from trending to mean-reverting (or vice versa).
Filtering signals in automated or systematic trading strategies.
Spotting periods of randomness where trading signals should be deprioritized.
Enhancing mean-reversion or trend-following models with regime-awareness.
⚠️ Limitations
Not predictive: Reflects current and recent market state, not future direction.
Sensitive to input parameters—overfitting may occur if settings are changed too frequently.
Smoothing can introduce lag in regime recognition.
May not work optimally in markets with structural breaks or extreme volatility.
💡 What Makes This Unique
Employs advanced statistical market analysis (Hurst exponent) rarely found in standard toolkits.
Offers immediate regime visualization through smart dynamic coloring and zone fills.
🔬 How It Works
Rolling Log Return Calculation:
Each new price creates a log return, forming the basis for robust, non-linear analysis. This ensures all price differences are treated proportionally.
Rescaled Range Analysis:
A rolling window maintains cumulative deviations and computes the statistical “range” (max-min of deviations). This is compared against the standard deviation to estimate “memory”.
Exponent Calculation & Smoothing:
The raw Hurst value is translated from the log of the rescaled range ratio, and then optionally smoothed via EMA to dampen noise and false signals.
Regime Detection Logic:
The smoothed value is checked against 0.5. Values above = trending; below = mean-reverting; near 0.5 = random. These control plot/fill color and zone display.
💡 Note:
Use longer calculation lengths for major market character study, and shorter ones for tactical, short-term adaptation. Smoothing balances noise vs. lag—find a best fit for your trading style. Always combine regime awareness with broader technical/fundamental context for best results.

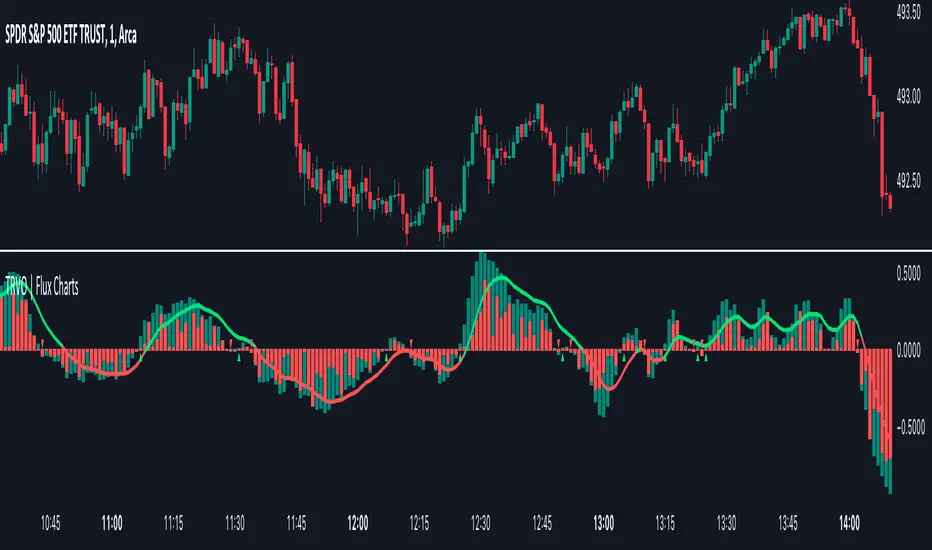
Time Relative Volume Oscillator | Flux Charts💎 GENERAL OVERVIEW
The relative volume indicator aims to improve upon the default existing relative volume indicator by comparing volumes between previous trading sessions rather than previous candles. As such, it works best on lower time frames as there is more data to compare with. The purpose of the indicator is to show how the current bar’s volume compares to the volume at the same time on previous trading days.
There exists a couple different modes and combinations that each provide a different perspective on the trading volume.
Oscillator mode
Oscillator mode starts with the same relative volume calculation, but adds two EMAs of different lengths that diverge and converge. Like the MACD, it plots the difference as a histogram. This functions as an easy way to view when relative volume is increasing or decreasing.
How to use:
The oscillator oscillates between -1 and 1. It moves along with volume direction, so this mode can be used to view the current volume direction in a lagging fashion. In oscillating markets, this indicator can give an idea of how buy/sell volume is moving and where it currently stands. Small arrows mark where reversals are predicted, when the histogram crosses over 0. The biggest pitfall of this mode is that, in a straight trending market, the two EMAs converge and it gives a false reversal signal.
Delta mode
Delta volume mode is a step up from the buy/sell volume mode. It separates both sides into the top and bottom, while also displaying the actual volume behind it in a semi transparent overlay. The best feature, however, is the delta oscillator. This oscillator fluctuates depending on how buy/sell volume is changing and plots bullish/bearish labels when the dominant side (bullish/bearish) changes. The signals, while a bit common, can sometimes dictate large direction changes, started by a dominant volume switch.
On top of different display modes, there is also one more volume mode: buy/sell volume. Instead of only showing the total volume and relative volume, it calculates and separates buying and selling volume.
This volume mode displays differently in all three viewing modes, but the basic principle is the same. It adds a vital piece of information to the chart without adding clutter. The calculation for buy/sell volume uses the candle wicks and body to compare bullish and bearish movement.
Classic mode
Classic mode takes the default volume indicator and improves upon it by also displaying the relative volume on top of the actual volume. Relative volume is calculated similarly between the three display modes: simply by comparing the current bar’s volume to the volume at the same time during previous trading days. Classic mode displays this “relative volume” as well as a simple EMA over top of the actual trading volume.
Originality
The script improves upon the existing relative volume indicator by using previous trading days rather than previous candles to generate the relative volume. On top of that, the calculation methods are unique, using different formulas like variations of the sigmoid function to smooth noise. The main issue this script aims to fix is that towards the start or end of the day relative volume indicators all see spikes as volume grows into close. The new relative volume calculations fix this problem and show what the “true” relative volume is because they compare the current bar to the “same” bar on previous trading sessions.
Machine Learning Momentum Oscillator [ChartPrime]The Machine Learning Momentum Oscillator brings together the K-Nearest Neighbors (KNN) algorithm and the predictive strength of the Tactical Sector Indicator (TSI) Momentum. This unique oscillator not only uses the insights from TSI Momentum but also taps into the power of machine learning therefore being designed to give traders a more comprehensive view of market momentum.
At its core, the Machine Learning Momentum Oscillator blends TSI Momentum with the capabilities of the KNN algorithm. Introducing KNN logic allows for better handling of noise in the data set. The TSI Momentum is known for understanding how strong trends are and which direction they're headed, and now, with the added layer of machine learning, we're able to offer a deeper perspective on market trends. This is a fairly classical when it comes to visuals and trading.
Green bars show the trader when the asset is in an uptrend. On the flip side, red bars mean things are heading down, signaling a bearish movement driven by selling pressure. These color cues make it easier to catch the sentiment and direction of the market in a glance.
Yellow boxes are also displayed by the oscillator. These boxes highlight potential turning points or peaks. When the market comes close to these points, they can provide a heads-up about the possibility of changes in momentum or even a trend reversal, helping a trader make informed choices quickly. These can be looked at as possible reversal areas simply put.
Settings:
Users can adjust the number of neighbours in the KNN algorithm and choose the periods they prefer for analysis. This way, the tool becomes a part of a trader's strategy, adapting to different market conditions as they see fit. Users can also adjust the smoothing used by the oscillator via the smoothing input.

Risk-Adjusted Return OscillatorThe Risk-Adjusted Return Oscillator (RAR) is designed to aid traders in predicting future price action by analysing the risk-adjusted performance of an asset. This oscillator is displayed directly on the price chart, unlike other oscillators.
By considering the risk-return relationship, the indicator helps identify periods of overvaluation or undervaluation, allowing traders to anticipate potential price reversals or trend accelerations.
HOW TO USE
The Risk-Adjusted Return Oscillator analyses the risk-adjusted performance of an asset to detect price reversals and accelerations. Here's how to interpret its signals:
Ranging Market:
Overbought Signal: When the RAR curve reaches the overbought level (upper red line), it suggests a potential reversal signal. It indicates that the asset may be overvalued, and a price correction or trend reversal could occur.
Oversold Signal: When the RAR curve reaches the oversold level (lower red line), it indicates a potential reversal signal. It suggests that the asset may be undervalued, and a price correction or trend reversal could take place.
Trending Market:
Overbought Signal: In a trending market, an overbought signal (RAR curve reaching upper red line) suggests trend acceleration. It indicates that the existing trend is gaining strength, and buying pressure is increasing.
Oversold Signal: In a trending market, an oversold signal (RAR curve reaching lower red line) also signifies trend acceleration. It suggests that the prevailing trend is intensifying, and selling pressure is increasing.
Thus, it's important to consider the market context when interpreting overbought and oversold signals. In ranging markets, these signals act as potential reversal points. However, in trending markets, they indicate trend acceleration, reinforcing the current price direction.
SETTINGS
Period Length: Adjust the number of bars used to calculate returns and standard deviation.
Smoothing: Define the smoothing period for the RAR curve.
Show Overbought/Oversold Signals: Choose whether to display triangular shapes for overbought and oversold conditions.

Combo 2/20 EMA & Accelerator Oscillator (AC) This is combo strategies for get a cumulative signal.
First strategy
This indicator plots 2/20 exponential moving average. For the Mov
Avg X 2/20 Indicator, the EMA bar will be painted when the Alert criteria is met.
Second strategy
The Accelerator Oscillator has been developed by Bill Williams
as the development of the Awesome Oscillator. It represents the
difference between the Awesome Oscillator and the 5-period moving
average, and as such it shows the speed of change of the Awesome
Oscillator, which can be useful to find trend reversals before the
Awesome Oscillator does.
WARNING:
- For purpose educate only
- This script to change bars colors.

McClellan Oscillator Jack Corsellis [LazyBear Modified]Developed by Sherman and Marian McClellan, the McClellan Oscillator is a breadth indicator derived from Net Advances, the number of advancing issues less the number of declining issues.
Subtracting the 39-day exponential moving average of Net Advances from the 19-day exponential moving average of Net Advances forms the oscillator.
As the formula reveals, the McClellan Oscillator is a momentum indicator that works similar to MACD .
McClellan Oscillator signals can be generated with breadth thrusts, centerline crossovers, overall levels and divergences.
The original code was written by LazyBear ( code here: )
We have modified this code:
1. Added the ability to display and configure the overbought and undersold lines which are key to properly using this indicator. These are set to default +40 and -75 respectively.
2. This version uses USI:ADV(advances- issues) and USI:DECL (declines - issues) as the default.
Dynamic Momentum Oscillator (DYNAMO) by M.YALCINIn July 1996 Futures magazine, E. Marshall Wall introduces the Dynamic Momentum Oscillator (Dynamo). Please refer to this article for interpretation.
The Dynamo oscillator is a normalizing function that adjusts the values of a standard oscillator for trendiness by taking the difference between the value of the oscillator and a moving average of the oscillator and then subtracting that value from the oscillator midpoint.
Dynamo Oscillator is calculated according to:
Dynamo = Mc - ( MAo - O )
where:
Mc = the midpoint of the oscillator
MAo = a moving average of the oscillator
O = the oscillator
Usage:
This concept can be applied to most oscillators to improve their results.
This example applies it to an RSI oscillator in MetaStock:
50-(Mov(RSI(14),21,S)-RSI(14))
where:
Mc = RSI's midpoint = 50
MAo = Moving average of the RSI = Mov(RSI(14),21,S
O= RSI Oscillator = RSI(14)
Also with this indicator, you can adjust the moving average type and RSI calculation types dynamically.

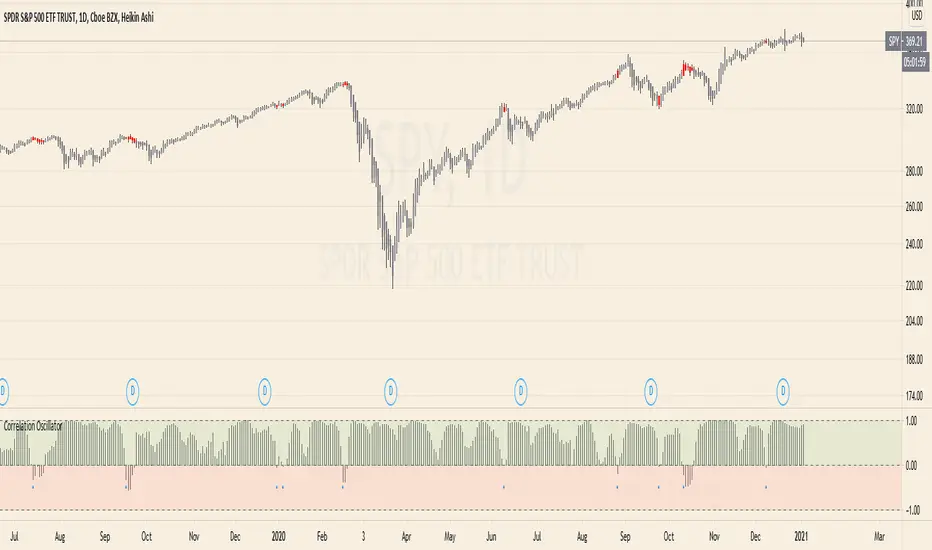
Correlation Oscillator - Anomaly AlertsThis script plots the correlation for two symbols as an oscillator:
A correlation of 1 means that both values move in the same direction together.
A correlation of -1 means that both values are perfectly negative correlated.
Parameter:
Length of the Correlation
The two symbols you want to calculate the correlation for
Barcolor: Defines whether Bar-coloring is set on.
The Number of bars lookback for anomaly: Say both are normally positively correlated it is an anomaly when the correlation turns negative and vica-versa.
Alerts: You can also set an Alert when an anomaly is detected.(blue dots on oscillator)
This has many use-cases:
For example VVIX and VIX are normally positive correlated.
When this turns negative, this can mean that we are on a turning point:
--> VVIX is rising while VIX is falling, risk of future Volatility is increasing (Top)
--> VIX is rising while VVIX is falling, risk of future Volatility is decreasing (Bottom)
Another use-case is just checking the correlation of stocks in your portfolio to diversify.
Waters-Williams A/D OscillatorThis is the A/D oscillator, design by Jim Waters and Larry Williams. As any other oscillator, it measures the strength of the buy and sell pressure.
If a candle opens at the low, and closes at it's high, the signal given by the oscillator is 100. If it opens at high and closes at low, the signal will be 0. Since it completely disregard other values, it is common to use a smoothed version of it, which is the average of the last n values, just like the stochastic oscillator.
Tho it doesn't have much use for positioners or swing traders, day traders and scalpers can use it in confluence with volume to enter in a counter trend trade.
Aroon Oscillator StrategyThis is simple strategy based on Aroon Oscillator. I have found that using length 144 or 169 on hourly chart shows excellent results.
Tested on SPY , QQQ and AAPL. Especially when you look at AAPL results , it has 60% profitable in recent trades. ( Dont assume this will be same for other stocks or ETFs)
Aroon Oscillator setting : 169 ( 169 is square root of 13 ... you can also use fib level 144 , which is square root of 12 )
BUY
When Aroon Oscillator crosses above zero line
Add
if Long position is already opened, and current close is less than BUY price and RSI 13 crossing above 30 line
Exit
when Aroon Oscialltor crosses below zero line
Stop Loss
default stop loss has been set to 5%
Note: I have not plotted RSI to the chart. Please include RSI 13 to see how position gets added ... Also add ema 169 to see how the price is aligned with the Aroon Oscillator
Warning
For the educational purposes only

%G OscillatorIntroduction
Rescaling often involve bringing a series of values in a certain range, there have been many rescaling methods proposed in technical analysis such as the stochastic oscillator, relative strength index or the William %R to name a few. Rescaling the price allow the user to see when the security is overbought or oversold, in the case of the stochastic oscillator it can also determine the price position relative to the highest and lowest price over a user defined period window.
Computing highest and lowest over a certain period window involve calculating what is called a rolling maximum/minimum, those calculations have tried to be efficient but they can still remain relatively complex. This is why i propose a similar rescaling indicator that don't use rolling maximum/minimum for its calculation, the indicator can be interpreted like the stochastic oscillator since they are similar.
The Indicator
The indicator is based on the current price position relative to past observations, for example, if the indicator is equal to 80, this mean that the current price is greater than 80% of the k past observations, where k = 1, 2, 3...length .
The indicator offer many benefits such as a custom rescaling range, unlike the stochastic oscillator this step is directly integrated in the core calculations of the indicator, this can be done by changing the code in line 7 :
a = src > src ? Max : Min
where Max should be the maximum value of the indicator and Min the minimum value, therefore the indicator would lay in a range of (Max,Min).
here the indicator is in a range of (5,2), this mean that :
a = src > src ? 5 : 2
Conclusion
I proposed an alternative to the stochastic oscillator. Both indicators return similar results, advantages of the proposed indicators are its simple calculation and its ability to return custom ranges. I hope it find its use in the community.
Thanks for reading !

APEX - Aroon / Aroon Oscillator [v1]Simple Script that combines Aroon and Aroon Oscillator with MTF functionality for APEX.
Aroon
The Aroon also know as Aroon Up/Down will help you determine the trend of the asset of if the asset is ranging. The indicator consists of two lines the AroonDown and the Aroon Up.When Aroon Up reaches 100, a new uptrend may have begun. If it remains persistently between 70 and 100, and the Aroon-Down remains between 0 and 30, then a new uptrend is underway.If the Aroon-Up crosses above the Aroon-Down, then a new uptrend may start soon. Conversely, if Aroon-Down crosses above the Aroon-Up, then a new downtrend may start soon. When Aroon-Up reaches 100, a new uptrend may have begun. If it remains persistently between 70 and 100, and the Aroon-Down remains between 0 and 30, then a new uptrend is underway.
Aroon Oscillator
The Aroon Oscillator is the difference between Aroon-Up and Aroon-Down. These two indicators are usually plotted together for easy comparison, but chartists can also view the difference between these two indicators with the Aroon Oscillator. This indicator fluctuates between -100 and +100 with zero as the middle line. An upward trend bias is present when the oscillator is positive, while a downward trend bias exists when the oscillator is negative.

DAO - Demand Advanced Oscillator# DAO - Demand Advanced Oscillator
## 📊 Overview
DAO (Demand Advanced Oscillator) is a powerful momentum oscillator that measures buying and selling pressure by analyzing consecutive high-low relationships. It helps identify market extremes, divergences, and potential trend reversals.
**Values range from 0 to 1:**
- **Above 0.70** = Overbought (potential reversal down)
- **Below 0.30** = Oversold (potential reversal up)
- **0.30 - 0.70** = Neutral zone
---
## ✨ Key Features
✅ **Automatic Divergence Detection**
- Bullish divergences (price lower low + DAO higher low)
- Bearish divergences (price higher high + DAO lower high)
- Visual lines connecting divergence points
✅ **Multi-Timeframe Analysis**
- View higher timeframe DAO on current chart
- Perfect for trend alignment strategies
✅ **Signal Line (EMA)**
- Customizable EMA for trend confirmation
- Crossover signals for momentum shifts
✅ **Real-Time Statistics Dashboard**
- Current DAO value
- Market status (Overbought/Oversold/Neutral)
- Trend direction indicator
✅ **Complete Alert System**
- Overbought/Oversold signals
- Bullish/Bearish divergences
- Signal line crosses
- Level crosses
✅ **Fully Customizable**
- Adjustable periods and levels
- Customizable colors and zones
- Toggle features on/off
---
## 📈 Trading Signals
### 1. Divergences (Most Powerful)
**Bullish Divergence:**
- Price makes lower low
- DAO makes higher low
- Signal: Strong reversal up likely
**Bearish Divergence:**
- Price makes higher high
- DAO makes lower high
- Signal: Strong reversal down likely
### 2. Overbought/Oversold
**Overbought (>0.70):**
- Market may be overextended
- Consider taking profits or looking for shorts
- Can remain overbought in strong trends
**Oversold (<0.30):**
- Market may be oversold
- Consider buying opportunities
- Can remain oversold in strong downtrends
### 3. Signal Line Crossovers
**Bullish Cross:**
- DAO crosses above signal line
- Momentum turning positive
**Bearish Cross:**
- DAO crosses below signal line
- Momentum turning negative
### 4. Level Crosses
**Cross Above 0.30:** Exiting oversold zone (potential uptrend)
**Cross Below 0.70:** Exiting overbought zone (potential downtrend)
---
## ⚙️ Default Settings
📊 Oscillator Period: 14
Number of bars for calculation
📈 Signal Line Period: 9
EMA period for signal line
🔴 Overbought Level: 0.70
Upper threshold
🟢 Oversold Level: 0.30
Lower threshold
🎯 Divergence Detection: ON
Auto divergence identification
⏰ Multi-Timeframe: OFF
Higher TF overlay (optional)
All parameters are fully customizable!
---
## 🔔 Alerts
Six pre-configured alerts available:
1. DAO Overbought
2. DAO Oversold
3. DAO Bullish Divergence
4. DAO Bearish Divergence
5. DAO Signal Cross Up
6. DAO Signal Cross Down
**Setup:** Right-click indicator → Add Alert → Choose condition
---
## 💡 How to Use
### Best Practices:
✅ Focus on divergences (strongest signals)
✅ Combine with support/resistance levels
✅ Use multiple timeframes for confirmation
✅ Wait for price action confirmation
✅ Practice proper risk management
### Avoid:
❌ Trading on indicator alone
❌ Fighting strong trends
❌ Ignoring market context
❌ Overtrading
### Recommended Settings by Trading Style:
**Day Trading:** Period 7-10, All alerts ON
**Swing Trading:** Period 14-21, Divergence alerts
**Scalping:** Period 5-7, Signal crosses
**Position Trading:** Period 21-30, Weekly/Daily TF
---
## 🌍 Markets & Timeframes
**Works on all markets:**
- Forex (all pairs)
- Stocks (all exchanges)
- Cryptocurrencies
- Commodities
- Indices
- Futures
**Works on all timeframes:** 1m to Monthly
---
## 📊 How It Works
DAO calculates the ratio of buying pressure to total market pressure:
1. **Calculate Buying Pressure (DemandMax):**
- If current high > previous high: DemandMax = difference
- Otherwise: DemandMax = 0
2. **Calculate Selling Pressure (DemandMin):**
- If previous low > current low: DemandMin = difference
- Otherwise: DemandMin = 0
3. **Apply Smoothing:**
- Calculate SMA of DemandMax over N periods
- Calculate SMA of DemandMin over N periods
4. **Final Formula:**
```
DAO = SMA(DemandMax) / (SMA(DemandMax) + SMA(DemandMin))
```
This produces a normalized value (0-1) representing market demand strength.
---
## 🎯 Trading Strategies
### Strategy 1: Divergence Trading
- Wait for divergence label
- Confirm at support/resistance
- Enter on confirming candle
- Stop loss beyond recent swing
- Target: opposite level or 0.50
### Strategy 2: Overbought/Oversold
- Best for ranging markets
- Wait for extreme readings
- Enter on reversal from extremes
- Target: middle line (0.50)
### Strategy 3: Trend Following
- Identify trend direction first
- Use DAO to time entries in trend direction only
- Enter on pullbacks to oversold (uptrend) or overbought (downtrend)
- Trade with the trend
### Strategy 4: Multi-Timeframe
- Enable MTF feature
- Trade only when both timeframes align
- Higher TF = trend direction
- Lower TF = precise entry
---
## 📂 Category
**Primary:** Oscillators
**Secondary:** Statistics, Volatility, Momentum
---
## 🏷️ Tags
dao, oscillator, momentum, overbought-oversold, divergence, reversal, demand-indicator, price-exhaustion, statistics, volatility, forex, stocks, crypto, multi-timeframe, technical-analysis
---
## ⚠️ Disclaimer
**This indicator is for educational purposes only.** It does not constitute financial advice. Trading involves substantial risk of loss. Always conduct your own research, use proper risk management, and consult with financial professionals before making trading decisions. Past performance does not guarantee future results.
---
## 📄 License
Open source - Free to use for personal trading, modify as needed, and share with attribution.
---
**Version:** 1.0
**Status:** Production Ready ✅
**Pine Script:** v5
**Trademark-Free:** 100% Safe to Publish
---
*Made with 💙 for traders worldwide*

Trend Strength Oscillator📌 Trend Strength Oscillator
📄 Description
Trend Strength Oscillator measures the directional strength of price relative to an adaptive dynamic trend band. It evaluates how far the current price is from the midpoint of a trend channel and normalizes this value by recent volatility range, allowing traders to detect trend strength, direction, and potential exhaustion in any market condition.
📌 Features
🔹 Adaptive Trend Band Logic: Uses a modified ATR and time-dependent spread formula to dynamically adjust upper and lower trend bands.
🔹 Trendline Midpoint Calculation: The central trendline is defined as the average between upper and lower bands.
🔹 Relative Positioning: Measures how far the close is from the center of the band as a percentage.
🔹 Range Normalization: Uses a normalized range to account for recent volatility, reducing noise in the oscillator reading.
🔹 Oscillator Output (±100 scale):
+100 indicates strong bullish momentum
-100 indicates strong bearish momentum
0 is the neutral centerline
🛠️ How to Use
✅ Trend Strength > +50: Indicates a strong bullish phase.
✅ Trend Strength < -50: Indicates a strong bearish phase.
⚠️ Crossing above 0: Potential bullish trend initiation.
⚠️ Crossing below 0: Potential bearish trend initiation.
📉 Values near 0: Suggest trend weakness or ranging conditions.
Best suited timeframes: 1H, 4H, Daily
Ideal combination with: RSI, MACD, volume-based oscillators, moving average crosses
✅ TradingView House Rules Compliance
This indicator is written in Pine Script v5 and fully open-source.
The script does not repaint, does not generate false alerts, and does not access external or private data.
It is intended strictly as a technical analysis tool, and not a buy/sell signal generator.
Users are encouraged to combine this tool with other confirmations and independent judgment in trading decisions.
=========================================================
📌 Trend Strength Oscillator
📄 설명 (Description)
Trend Strength Oscillator는 가격이 동적 추세 밴드 내 어디에 위치해 있는지를 정량적으로 분석하여, 추세의 방향성과 강도를 시각적으로 보여주는 오실레이터 지표입니다. 최근 변동성을 반영한 밴드를 기반으로 가격 위치를 정규화하여, 과매수·과매도 상태나 추세의 소멸 가능성까지 탐지할 수 있도록 설계되었습니다.
📌 주요 특징 (Features)
🔹 적응형 추세 밴드 계산: ATR과 시간 경과를 기반으로 상단/하단 밴드를 동적으로 조정
🔹 중심 추세선 산출: 상단과 하단 밴드의 평균값을 중심선으로 활용하여 기준 축 제공
🔹 상대 위치 계산: 현재 종가가 중심선에서 얼마나 떨어져 있는지를 정규화하여 추세 강도 계산
🔹 변동성 기반 정규화: 최근 밴드 범위를 기준으로 상대 거리를 0~100 사이 값으로 변환
🔹 오실레이터 출력 (범위: ±100):
+100에 가까울수록 강한 상승 추세
-100에 가까울수록 강한 하락 추세
0에 가까울수록 횡보 구간 가능성
🛠️ 사용법 (How to Use)
✅ +50 이상: 강한 상승 추세 지속 중
✅ -50 이하: 강한 하락 추세 지속 중
⚠️ 0선 돌파 상향: 상승 추세 시작 가능성
⚠️ 0선 돌파 하향: 하락 추세 시작 가능성
🟡 0 근처 유지: 추세 약화 또는 횡보장 가능성
추천 시간대: 1시간봉, 4시간봉, 일봉
보조 지표로 추천: RSI, MACD, OBV, 이동평균 크로스 등과 함께 활용 시 효과적
✅ 트레이딩뷰 하우스룰 준수사항 (TradingView House Rules Compliance)
본 지표는 Pine Script v5로 작성된 오픈소스 공개용 스크립트입니다.
리페인트(Repaint) 현상이 없으며, **허위 경고(Spam Alerts)**나 성능 저하 요소도 없습니다.
외부 데이터 접근 없이 완전히 자체 계산으로 동작합니다.
이 지표는 투자 판단을 돕기 위한 분석용 도구이며, 직접적인 매수·매도 신호로 사용해서는 안 됩니다.
모든 트레이딩은 사용자의 독립적인 판단과 책임 하에 이루어져야 합니다.

Amazing Oscillator (AO) [Algoalpha]Description:
Introducing the Amazing Oscillator indicator by Algoalpha, a versatile tool designed to help traders identify potential trend shifts and market turning points. This indicator combines the power of the Awesome Oscillator (AO) and the Relative Strength Index (RSI) to create a new indicator that provides valuable insights into market momentum and potential trade opportunities.
Key Features:
Customizable Parameters: The indicator allows you to customize the period of the RSI calculations to fine-tune the indicator's responsiveness.
Visual Clarity: The indicator uses user-defined colors to visually represent upward and downward movements. You can select your preferred colors for both bullish and bearish signals, making it easy to spot potential trade setups.
AO and RSI Integration: The script combines the AO and RSI indicators to provide a comprehensive view of market conditions. The RSI is applied to the AO, which results in a standardized as well as a less noisy version of the Awesome Oscillator. This makes the indicator capable of pointing out overbought or oversold conditions as well as giving fewer false signals
Signal Plots: The indicator plots key levels on the chart, including the RSI threshold(Shifted down by 50) at 30 and -30. These levels are often used by traders to identify potential trend reversal points.
Signal Alerts: For added convenience, the indicator includes "x" markers to signal potential buy (green "x") and sell (red "x") opportunities based on RSI crossovers with the -30 and 30 levels. These alerts can help traders quickly identify potential entry and exit points.

Fibonacci Oscillator (Expo)█ Overview
The Fibonacci Oscillator is a multi-faceted oscillator designed to provide traders with a comprehensive understanding of market trends and retracement points. Built on the Fibonacci ratios, it combines the functionalities of popular oscillators like RSI and MACD with unique insights into the market structure. This oscillator not only helps identify trend direction but also pinpoints overbought and oversold levels, making it an essential tool for various trading strategies.
█ How to Use
Identify Trends
Use the oscillator to identify the direction of the market trend.
Identify Retracements
Use the oscillator to identify the retracements.
█ Settings
Fibonacci Settings
These settings let you customize the Fibonacci level to focus on, thereby allowing you to tailor the oscillator according to your trading preferences.
Oscillator Settings
You can also choose between different oscillator types (RSI, MACD, Histogram) and adjust their respective settings like lengths, signals, and colors.
-----------------
Disclaimer
The information contained in my Scripts/Indicators/Ideas/Algos/Systems does not constitute financial advice or a solicitation to buy or sell any securities of any type. I will not accept liability for any loss or damage, including without limitation any loss of profit, which may arise directly or indirectly from the use of or reliance on such information.
All investments involve risk, and the past performance of a security, industry, sector, market, financial product, trading strategy, backtest, or individual's trading does not guarantee future results or returns. Investors are fully responsible for any investment decisions they make. Such decisions should be based solely on an evaluation of their financial circumstances, investment objectives, risk tolerance, and liquidity needs.
My Scripts/Indicators/Ideas/Algos/Systems are only for educational purposes!

Market Health OscillatorDesigned to provide traders with a comprehensive view of the overall health of a market. By combining the rate of change of key indicators, the MHO offers insight into potential shifts in market sentiment.
Components:
Price Rate of Change: The MHO considers the rate of change of the price of an asset over a specified period. This element reflects the momentum of the asset's price movement, aiding in the assessment of potential trend shifts.
Volume Rate of Change: Tracking the rate of change of trading volume provides insights into market participation and interest. Changes in volume can signify shifts in market sentiment and potential trend reversals.
Volatility Rate of Change: The rate of change of volatility, often measured using the Average True Range (ATR), helps gauge the level of uncertainty in the market. An increase in volatility can indicate heightened market activity and potential reversals.
Advance-Decline Line: The MHO takes into account the Advance-Decline Line, which compares the number of advancing stocks to declining stocks. This component offers insights into market breadth and the underlying strength of the current trend.
Calculation and Interpretation:
The MHO aggregates the rate of change of these components and combines them to provide a single oscillator reading. This reading is then normalized to a range between -1 and 1. Positive values suggest bullish market health, while negative values indicate bearish conditions. The oscillator's extremes, coupled with divergence patterns, can signal potential market turning points.
Application:
Identify potential trend reversals or corrections by watching for extreme MHO readings.
Assess the overall health of a market by observing the general direction and amplitude of the oscillator.
Look for divergences between price and the MHO for insights into potential shifts in market sentiment.
This was inspired to offer a holistic perspective on market dynamics. By encompassing price, volume, volatility, and breadth factors, the MHO assists in a comprehensive assessment of market health.
VIX OscillatorThis is my VIX Oscillator indicator.
About it:
This indicator takes the Z-Score of the VIX and of the current ticker you are on and presents them in the format of an oscillator.
Key parts of the indicator:
A diagram of the key elements of the indicator are displayed above.
Purple Line: Represents the Z-Score of the current Ticker.
Blue Line: Represents the Z-Score of the VIX
Green fill line: Represents bullish divergence
Red fill line: Represents bearish divergence
How to use it:
Characteristics for long entries:
- Look for recent bullish divergence (green fill line)
- Look for the ticker line (purple line) to be holding above 0 (neutrality)
- look for a bullish cross (purple line (ticker) crossing over blue line (VIX))
Characteristics for short entries:
- Look for recent Bearish divergence
- Look for the VIX line (blue line) to be holding above 0 and the Ticker
- Look for the ticker line to be holding below 0
- Look for a bearish cross (blue crossing above purple)
Some principles:
The bands represent oversold, overbought and neutral.
0 is absolute neutrality. No bias here.
Anything towards + 2.5 is considered normal, moving towards overbought (2.5 or higher).
Anything towards -2.5 is considered normal, moving towards oversold (-2.5 or lower).
+2.5 or higher is overbought.
-2.5 or lower is oversold.
As always, I have prepared a quick tutorial video for your reference of this indicator:
Please let me know your questions, comments or suggestions about this indicator below.
Thank you for checking it out!

Polynomial-Regression-Fitted Oscillator [Loxx]Polynomial-Regression-Fitted Oscillator is an oscillator that is calculated using Polynomial Regression Analysis. This is an extremely accurate and processor intensive oscillator.
What is Polynomial Regression?
In statistics, polynomial regression is a form of regression analysis in which the relationship between the independent variable x and the dependent variable y is modeled as an nth degree polynomial in x. Polynomial regression fits a nonlinear relationship between the value of x and the corresponding conditional mean of y, denoted E(y |x). Although polynomial regression fits a nonlinear model to the data, as a statistical estimation problem it is linear, in the sense that the regression function E(y | x) is linear in the unknown parameters that are estimated from the data. For this reason, polynomial regression is considered to be a special case of multiple linear regression .
Things to know
You can select from 33 source types
The source is smoothed before being injected into the Polynomial fitting algorithm, there are 35+ moving averages to choose from for smoothing
This indicator is very processor heavy. so it will take some time load on the chart. Ideally the period input should allow for values from 1 to 200 or more, but due to processing restraints on Trading View, the max value is 80.
Included
Alerts
Signals
Bar coloring
Other indicators in this series using Polynomial Regression Analysis.
Poly Cycle
PA-Adaptive Polynomial Regression Fitted Moving Average
