Hyperfork Matrix🔱 Hyperfork Matrix 🔱 A manual Andrews Pitchfork tool with action/reaction propagation lines and lattice matrix functionality. This indicator extends Dr. Alan Andrews' and Patrick Mikula's median line methodology by automating the projection of reaction and action lines at equidistant intervals, creating a time-price grid that highlights where pivot levels intersect the matrix.
Three pitchfork variants are supported: Original, Schiff, and Modified Schiff. Each variant adjusts the anchor point position to accommodate different trend angles.
═══════════════════════════════════════════════════════════════
█ THE METHOD
Andrews Pitchfork
Dr. Alan Andrews developed the pitchfork as a trend channel tool. The core principle: price tends to return to the median line roughly 80% of the time. When it fails to reach the median, a reversal may be developing.
A pitchfork requires three pivot points:
• Point A — The anchor (starting pivot)
• Point B — First swing in the opposite direction
• Point C — Second swing, same direction as A
The median line runs from Point A through the midpoint of B-C. Parallel lines through B and C form the channel boundaries.
Action/Reaction Principle
Based on Newton's third law ("action and reaction are equal and opposite"), this principle suggests that price movements elicit proportional reactions in the future. By projecting lines at equal intervals along the pitchfork's slope, we anticipate where these reactions may occur.
Lattice Matrix
The lattice squares pivot price levels to the matrix structure. A horizontal from your selected pivot intersects the pitchfork and propagation lines, with verticals drawn at each intersection. These verticals mark time points where price-time geometry converges—potential areas to watch for trend changes.
═══════════════════════════════════════════════════════════════
█ HOW THE INDICATOR WORKS
This section explains the calculation flow from your inputs to the final drawing.
Step 1 — Pivot Selection
You click on the chart to select three timestamps. The indicator retrieves the high or low price at each timestamp based on your starting pivot type selection:
• Starting with "Low" creates a Low-High-Low pattern
• Starting with "High" creates a High-Low-High pattern
Step 2 — Anchor Calculation
The anchor position depends on your pitchfork variant:
• Original — Anchor stays at Point A
• Schiff — Anchor shifts 50% toward B in price (Y-axis only)
• Modified Schiff — Anchor shifts 50% toward B in both time and price
Step 3 — Median Line
A line is drawn from the anchor through the midpoint of the B-C segment. This median line defines the channel's slope and center.
Step 4 — Parallel Tines
Parallel lines are drawn through Points B and C, maintaining the median line's slope. These form the upper and lower channel boundaries.
Step 5 — Extra Parallels
If configured, additional parallel lines are drawn at equal spacing beyond B and C. The spacing equals the distance from the median to each tine.
Step 6 — Handle Length
The "handle" is the segment from the anchor to the B-C midpoint. This length becomes the unit of measurement for propagation.
Step 7 — Propagation Points
Points are placed along the median line at handle-length intervals:
• Forward points extend into the future
• Backward points extend into the past
Step 8 — Reaction Lines
Through each propagation point, a line is drawn parallel to B-C (the transversal slope). These reaction lines mark time-price zones based on the original swing rhythm, where trend changes may occur.
Step 9 — Action Lines
Through each propagation point, a line is drawn parallel to A-B (the initial move slope). These action lines project the original momentum into future price zones.
Step 10 — Lattice Grid
If enabled, a horizontal line is drawn at the price level of your selected pivot. Vertical lines are then drawn at every intersection between this horizontal and the selected line type (pitchfork, reaction, or action lines).
Step 11 — Alert Monitoring
On each bar, the indicator checks if the price has crossed any of the drawn lines. Crossings trigger alerts based on your configuration.
═══════════════════════════════════════════════════════════════
█ PITCHFORK VARIANTS
Original (Andrews)
The classic pitchfork. The anchor remains at Point A. Best suited for strong trending markets where price respects steep channels.
Schiff
Named after Jerome Schiff, a student of Andrews. The anchor shifts halfway toward Point B in price only—same time position as A, but price is the midpoint of A and B.
This produces a less steep channel, better suited for:
• Shallow trends
• Corrective phases
• Markets where the original pitchfork angle is too aggressive
Modified Schiff
The anchor shifts halfway toward Point B in both time and price—positioned at the midpoint of the A-B segment.
This creates an even gentler slope than the standard Schiff variant. Use when:
• Trends are weak or ranging
• Price doesn't respect steeper channel angles
• You need a middle ground between Original and Schiff
═══════════════════════════════════════════════════════════════
█ ACTION & REACTION LINES
Reaction Lines
These run parallel to the B-C segment (the "transversal"). They represent the market's response rhythm—the swing from B to C sets a pattern that may repeat at predictable intervals.
Action Lines
These run parallel to the A-B segment (the initial impulse). They project the original momentum forward, suggesting where similar price movements may begin or end.
Forward vs Backward
• Forward Lines — Project into the future beyond the B-C midpoint
• Backward Lines — Project into the past before Point A
Most analysis focuses on forward lines, but backward lines can reveal historical confluence with past pivots.
Propagation Spacing
Lines are spaced at equal intervals defined by the handle length (anchor to B-C midpoint). This creates a rhythmic structure where each segment equals the original pitchfork's core measurement.
Action Lines
Reaction Lines
Extra Parallels with/ both Action & Reactions Line extended within the grid
═══════════════════════════════════════════════════════════════
█ LATTICE MATRIX
The lattice creates a grid overlay within the pitchfork structure.
Horizontal Line
A horizontal line is drawn at the price level of your selected pivot (A, B, or C). This squares the pivot's price level to find where it aligns with the matrix structure. These confluences may represent higher-probability reaction points in time.
Vertical Lines
Vertical lines are drawn at every point where the horizontal intersects your selected line source. These verticals mark time points—potential areas to watch for trend changes.
• Pitchfork & Parallels — Intersections with median and all parallel tines
• Action Lines — Intersections with action transversals
• Reaction Lines — Intersections with reaction transversals
• Action & Reaction — Both types combined
Envelope Clamping
Lattice lines are automatically clamped to stay within the pitchfork's channel envelope (bounded by the outermost parallels). This keeps the grid visually clean and focused on relevant areas.
═══════════════════════════════════════════════════════════════
█ ALERTS
The indicator monitors price crossings and triggers alerts when the price moves through any drawn line type.
Available Alert Types
• Pitchfork Lines — Crossing the median or any parallel
• Action Lines — Crossing any action transversal (when action lines are drawn)
• Reaction Lines — Crossing any reaction transversal (when reaction lines are drawn)
• Lattice Horizontal — Crossing the horizontal price level (when lattice is enabled)
• Any Line Crossing — Combined alert for all of the above
Setting Up Alerts
1. Right-click on the indicator or use the alert menu
2. Select "Create Alert."
3. Choose the desired condition from the dropdown
4. Configure notification preferences (pop-up, email, webhook, etc.)
Alert Timing
Alerts trigger once per bar close when a crossing is detected between the previous and current bar's close prices.
═══════════════════════════════════════════════════════════════
█ HOW TO USE
Basic Setup
1. Add the indicator to your chart
2. When prompted, click on three pivot points in sequence: A, B, C
3. Choose starting pivot type: Auto (detects pattern), Low (LHL), or High (HLH)
4. The pitchfork draws automatically
Adjusting the Pitchfork
• Change the variant (Original/Schiff/Modified Schiff) if the angle doesn't suit your trend
• Add extra parallel levels to see where price might react beyond the main channel
• Disable or Adjust price range min/max to hide parallels outside your focus area
Adding Propagation Lines
• Adjust forward offset to add/remove lines beyond auto-extend (0 = to current bar)
• Choose which line types to display: Reaction Only, Action Only, or Both
• Customize colors to distinguish line types visually
Using the Lattice
• Enable "Draw Lattice" in the Lattice settings group
• Select which pivot's price level to use for the horizontal
• Choose the intersection source that matches your analysis style
• Look for time zones where verticals cluster—these may be significant dates
Log Scale Charts
If your chart uses logarithmic scale, enable "Logarithmic Scale" in Pitchfork Settings. This ensures all calculations transform correctly for log price axes.
═══════════════════════════════════════════════════════════════
█ SETTINGS REFERENCE
1. Pivot Points
• Starting Pivot Type — Auto (detect pattern), Low (force LHL), or High (force HLH)
• Pivot A/B/C Time — Timestamps for your three pivots (click to select)
• Show Pivot Labels — Display A, B, C labels at pivot locations
• Pivot Colors — Customize high/low label colors
• Label Size — Tiny, Small, Normal, or Large
2. Pitchfork Settings
• Logarithmic Scale — Enable for log charts
• Pitchfork Type — Original, Schiff, or Modified Schiff
• Extra Parallel Levels — Additional parallels beyond B and C
• Line styling (color, width, style)
• Extend Direction — Right only or Both directions
• Enable Price Range Filter — Toggle filtering of extra parallels
• Price Range Min/Max — Hide extra parallels outside this range
3. Action / Reaction Lines
• Draw Type — None, Reaction Only, Action Only, or Both
• Forward Lines Offset — Adjust from auto-extend (0 = to current bar, positive adds more)
• Backward Lines Count — Number of lines projected before Point A
• Separate styling for reaction and action lines
4. Lattice
• Draw Lattice — Master toggle
• Select Pivot for Horizontal — A, B, or C price level
• Intersection Source — Which lines to use for vertical placement
• Lattice styling
═══════════════════════════════════════════════════════════════
█ LIMITATIONS
• Maximum 500 lines — TradingView limits line objects; complex setups with many parallels and propagation lines may approach this limit
• Manual pivot selection — Pivots must be selected manually via timestamp inputs; no auto-detection
• Log scale requires toggle — You must enable "Logarithmic Scale" manually if your chart uses log axes
• Minor visual drift — Action/Reaction lines may shift slightly when toggling between odd and even extra parallel counts (cosmetic only)
• Backward lines visibility — When adding backward propagation lines, you may need to scroll the chart left for them to render
═══════════════════════════════════════════════════════════════
█ FURTHER READING
For deeper study of pitchfork analysis and action/reaction methodology:
• Patrick Mikula's "The Best Trendline Methods of Alan Andrews and Five New Trendline Techniques"
No affiliation implied. Referenced for educational context only.
═══════════════════════════════════════════════════════════════
█ RELATED
For a video walkthrough of the Super Pitchfork methodology that inspired this indicator:
How to Build a Super Pitchfork with Reaction & Trigger Lines
This tutorial covers manual pitchfork construction, reaction line projection, and timing techniques.
Поиск скриптов по запросу "pivot"

Liquidity & inducementsHi all!
This indicator will show liquidity and inducements.
I will continue to try to add different types of liquidity and inducements, at this moment it contains 6 kinds of liquidity/inducement, they are:
• Grabs
• Big grabs
• Sweeps
• Turtle soups
• Equal highs/lows (liquidity and inducement)
• BSL & SSL
And 1 type of inducement:
• Retracement
This description will contain indicator examples of each individual liquidity and inducement. They will all be with the default settings.
Settings
First you will find settings for the market structure (BOS/CHoCH/CHoCH+). Select left and right pivot lengths and if the pivots should have a label or not.
This is the base foundation of this indicator and is possible with my library 'PriceAction' ().
You will see solid lines for break of structures (BOS), change of characters (CHoCH) and change of character plus (CHoCH+).
The pivots found will be the core of this indicator and will show you when the closing price breaks it. When that happens a break of structure (BOS) or a change of character (CHoCH or CHoCH+) will be created. The latest 5 pivots found within the current trend will be kept to take action on.
A break of structure is removed if an earlier pivot within the same trend is broken and the pivot's high price for a bullish trend or low price for a bearish trend is more extreme than the BOS pivot's price.
You are able to show the pivots that are used. "HH" (higher high), "HL" (higher low), "LH" (lower high), "LL" (lower low) and "H"/"L" (for pivots (high/low) when the trend has changed) are the labels used.
In the next section ('Liquidity ($$$)') you can select which types of liquidity you want to see. Note that 'Equal highs/lows' can also show inducement (more on that later).
In the section afterwards ('Inducement (IDM)') you can select if you want retracement inducements to be visible or not. More information on what they are later on.
The section for each individual liquidity and/or inducement can first contain a line named 'Pivot', where you can set the pivot lengths (first left, then right). Then you can set the 'Lookback', which means that the 'Lookback' number of past pivots is to take action on. After that you set the 'Timeframe' for the pivots used. That means that all available liquidity/inducements will be from your desired timeframe. Lastly you set the color of the liquidity/inducement (either a single color or bullish followed by bearish colors).
Lastly in the settings you can select the font sizes for the market structure and liquidity/inducements and what style liquidity/inducements lines will have. The sizes defaults to 7 and has a dotted line look.
Grabs
Liquidity grabs and liquidity sweeps are very similar. It all depends on if the current bar closed above/below the liquidity pivot and on if its a continuation or reversal. In a liquidity grab the bar that's above or below the liquidity pivot was not closed above or below it. Like this:
Or
The visual feedback will be a dotted line between the liquidity pivot and liquidity grab bar and a linefill between the high of the liquidity grab bar and the liquidity pivot.
Indicator example:
Big grabs
This is another 'grabs' option. You can show an additional grab if you want to. I suggest having this grab from a higher timeframe or with larger pivot lengths than the other grab.
The default is with the chart timeframe and 10/10 as pivot lengths.
Indicator example:
Sweeps
A liquidity sweep is like a liquidity grab but with the difference that price closes above/below and has a continuation instead of a reversal. If the liquidity pivot was at the same bar as a BOS/CHoCH/CHoCH+ it will not be a liquidity grab but a structural break instead.
They can look like this:
Indicator example;
Turtle soups
If only one candle is beyond the pivot it could be a liquidity grab. It's a grab if price didn't close beyond the liquidity pivot, if so it's invaliditet. Turtle soups are basically false breakouts that takes liquidity (is a false breakout from a pivot with the lengths and timeframe from the settings).
The turtle soup can have a confirmation in the terms of a change of character (CHoCH). You can enable this in the settings section for 'Turtle soups' through the 'Confirmation' checkbox (enabled by default). The turtle soup strategy usually comes with some sort of confirmation, in this case a CHoCH, but it can also be a market structure shift (MSS) or a change in state of delivery (CISD).
The addition of turtle soups is possible through my script 'Turtle soup' ().
The drawing will be a dotted line between the liquidity pivot and the last bar of the false breakout and a box from the start of the false breakout to the end of it.
Indicator example:
Equal highs/lows
Equal highs/lows will always show liquidity, but might also show inducement. Inducement will be shown on equal lows if the trend is bullish and on equal highs if it's bearish, like this:
Or
Equal highs can only be created if the second pivot is lower than the first one. Equal lows can only be created if the second pivot is higher than the first one. If that is not the case it could be a liquidity grab.
When equal highs or equal lows are find that produces inducement (equal lows in a bullish trend and equal highs in a bearish trend), the indicator will first display inducement and will show liquidity once traders are induced to enter the security. Stop loss placement, for liquidity, is 0.1 * the average true range (ATR, of length 14). They will look like this:
Only inducement:
Inducement and liquidity:
Indicator example:
Equal highs/lows inducements can not be triggered after a BOS/CHoCH/CHoCH+. They are cleared upon a structural break.
BSL & SSL
Buyside liquidity (BSL) and sellside liquidity (SSL) will be shown. A pivot that's been mitigated (touched by price) can never be BSL or SSL. The BSL/SSL available will be dynamic while price moves (work in Replay and lower timeframes that moves fast) and pick the latest pivot/s (with left and right lengths from the 'Market structure' section). You can define how many BSL/SSL you want to see with a default value of 1, meaning only 1 BSL and 1 SSL can be shown. If there is no unmitigated high (BSL) or low (SSL), no BSL/SSL will be available to show. If there are BSL/SSL available they're very useful to use as targets for entering a trade.
The will look like this when available;
And without BSL available:
Or
And without SSL available:
Note that the examples without BSL/SSL available could have liquidity available from previous price legs.
This can be an example of a BSL/SSL sequence:
First both buyside and sellside liquidity is available:
Then a new low appears and new sellside liquidity is available:
Then buyside liquidity is mitigated, so only sellside liquidity is available:
A new high pivot appears and buyside liquidity is available again:
Lastly a bearish CHoCH happens and sellside liquidity is mitigated, only buyside liquidity is available:
Retracement
The first retracement after a BOS/CHoCH/CHoCH+ is considered an inducement with the mission to get traders into a trade prematurely to get stopped out. This level is shown and look like this:
Or
A retracement inducement is removed when a new BOS/CHoCH/CHoCH+ appears and it's not triggered.
---------------------------
As of now there aren't any alerts available. You cannot use the Pine Screener from Tradingview either to see new liquidity/inducement events. I have this planned for future updates though.
I hope that this long description makes sense, let me know otherwise! Also let me know if you experience any bugs or have a feature request or just want to share good settings to use.
Best of trading luck!

AutoPivot Levels with Alerts [ChartWhizzperer] – Dynamic EditionAuto-Pivot Levels 4 methods with alerts – Dynamic Edition
Now with
- Live Mode
- 4 Pivot Methods
- 7 Session Types (5m, 15m, 30m, Hourly, Daily, Weekly, Monthly)
- PineConnector-Ready Alerts!
Free, Open Source, Pine Script v6-compliant.
NEW: Live Mode (Ultra-Dynamic, Repainting) – Switchable in UI!
Instantly switch between Classic (session-based, repaint-free) and Live (rolling window, real-time, repainting) using the simple checkbox in the settings!
Live Mode recalculates all pivots on every tick/bar, using the current high/low/close for the chosen session (5m, 15m, 30m, hourly, daily, weekly, monthly).
Perfect for:
- Scalping and high-frequency trading
- Real-time bot/automation setups (PineConnector-ready)
- Fast-moving or breakout markets
Classic Mode: For traditional, stable levels based on confirmed session data – ideal for backtesting and trading history.
Four Calculation Methods (Choose What Fits YOU)
1. Classic
Standard pivot calculation.
Based on previous session’s High, Low, Close.
Simple, proven, and suitable for any asset.
2. Fibonacci
Projects levels using Fibonacci ratios of the prior session’s range.
Great for traders who want to align pivots with fib retracements and extensions.
3. Camarilla
Uses unique multipliers for support/resistance, focusing on mean reversion and volatility.
Popular among futures and forex day traders.
4. Woodie
Puts extra weight on previous Close for more responsive pivots.
Often used in trending or choppy conditions.
Switch methods anytime in the UI – the script recalculates instantly and keeps your chart clean!
Level-Specific Alerts – PineConnector Ready!
Dedicated alert for EVERY level and direction (Up/Down):
Pivot (P), R1, R2, R3, S1, S2, S3
No configuration hassle:
All alerts are pre-defined in the TradingView Alert Panel and work across all session types (5m → monthly).
Machine-readable message format:
PIVOT=R1 DIR=UP SYMBOL={{ticker}} PRICE={{close}}
Direct plug-and-play with PineConnector, webhooks, Discord, Telegram, bots, and other automation tools.
Never miss a breakout, reversal, or key support/resistance touch!
Powerful Customization & Performance
- Session selection: 5m, 15m, 30m, Hourly, Daily, Weekly, Monthly (choose what suits your trading style).
- Show/hide any level (Pivot, R1–R3, S1–S3) for minimal chart clutter.
- Color selection for each level to match your theme or highlight key pivots.
- Auto-cleanup: Old lines and labels are cleared on every recalculation or session change for maximum performance and visual clarity.
- Zero runtime errors: Strict Pine Script v6 practices for stability.
How To Use – Quick Start
1) Add the indicator to your TradingView chart.
2) Pick your calculation method (Classic, Fibonacci, Camarilla, Woodie).
3) Set session type (5m, 15m, 30m, Hourly, Daily, Weekly, Monthly).
4) Switch between Classic and Live Mode with a single click in settings.
5) Customize your levels (on/off, colors).
6) Open the Alert Panel, select any pre-configured alert (e.g. "R2 Cross Down"), and go live!
7) Connect with PineConnector or any webhook system instantly using the pre-formatted alert messages.
Who Is It For?
- Active scalpers & bot traders: Live Mode + PineConnector-ready alerts = instant, automated reactions.
- Swing and position traders: Use Classic Mode for stable, repaint-free levels.
- Strategy developers: Seamless integration into automated and manual trading workflows.
License & Community
Open Source, Non-Commercial:
Free for personal & educational use under CC BY-NC-SA 4.0.
Feedback, bug reports & ideas:
Drop a comment, or contact me for feature requests.
Trade smart. Trade dynamic. Unlock the true power of pivots – with ChartWhizzperer!

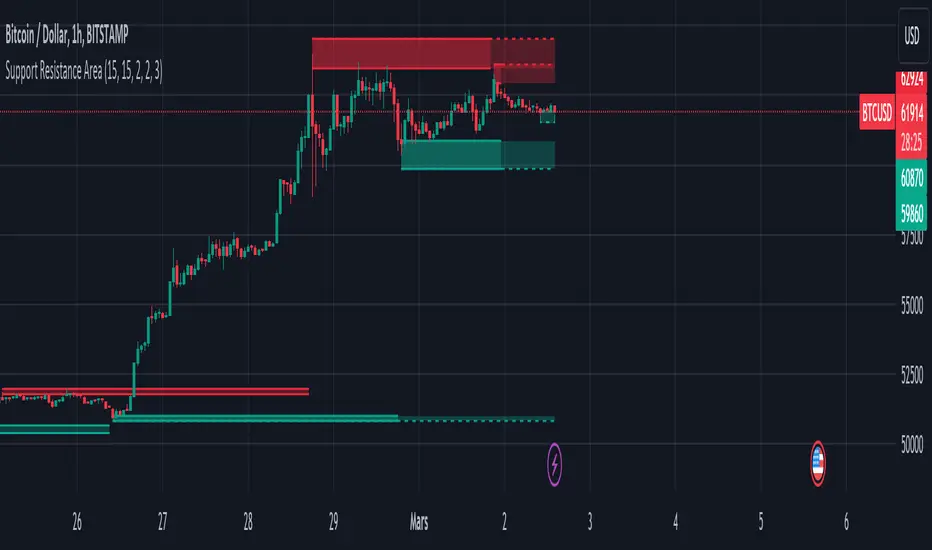
Support and Resistance ZoneSupport and Resistance Zone Indicator :
Introduction :
The purpose of this indicator is to identify the chart symbol's main supports and resistances. It displays these key zones, which are very important psychological points for traders. Since support and resistance are not very precise levels, the indicator displays them as zones.
Pivots :
Pivots are a key concept in identifying support and resistance. The indicator uses two types of pivot:
Pivot high : This is a high point that has not been reached by a user-defined number of candles on either the left and right of this candle. The " left pivot leg " is the number of candles before this pivot point that have not reached the realized high, and the " right pivot leg " is the number of candles after this pivot point that have not reached this high. If these two conditions are met, the pivot point is considered a turning point, and resistance is probably the cause.
Pivot low : This is a low point that has not been reached by a user-defined number of candles on either the left or right. The " left pivot leg " is the number of candles before this pivot point that have not reached the candle low, and the " right pivot leg " is the number of candles after this pivot point that have not reached this low. If these two conditions are met, the pivot point is considered a turning point, and support is probably the cause.
Support/Resistance area :
If a pivot point has been identified, the indicator considers it a resistance if it's a pivot high, or a support if it's a pivot low. To define the support or resistance zone, we'll use the ATR (Average True Range), an indicator that measures asset volatility. We'll take the ATR of the candle for which the pivot was spotted, and use it as the width of the support or resistance zone. Thus the upper line of support/resistance is at pivot+atr/2 and the lower line is at pivot-atr/2 . The greater the volatility, the larger the zone.
New Support/Resistance :
If a new pivot has been identified, but the level of this pivot lies between the lower line and the upper line of the previous support or resistance, the indicator considers this to be the same support or resistance as before. In this case, no new support or resistance is created. The pivot must be outside the area of the previous support or resistance to be validated.
Anticipated Support/Resistance :
This indicator also allows early detection of support or resistance. To do this, the value of the right pivot legs will be shortened in order to find these areas more quickly. The support or resistance will then be considered anticipated and may disappear at any time if the high/low is reached. On the other hand, if the high/low is not reached, and a number of candles equal to the " Right Pivot Legs" parameter has elapsed since the detection of this anticipated support/resistance, it will be considered validated and will integrate the other supports/resistances of the chart.
Extended supports/resistances :
For a more optimal view, the indicator allows the user to choose the number of last support or resistance levels to be extended to the last candle. This must be specified in the indicator parameters.
Parameters :
Pivot Legs : Determine the left and right legs of the pivot i.e the number of candle before and after the pivot that doesn’t reach pivot point. The pivot is validated only if this two conditions are verified.
Extend Last Supports : Number of supports to extend to the last bar
Extend Last Resistances : Number of resistances to extend to the last bar
Show Support/Resistance Anticipated : If yes, will find anticipated support and resistance
Right Pivot Legs for Anticipation : Determine the right legs of pivots to find faster a support or a resistance.
Conclusion :
This indicator plot support and resistance zones based on pivot. The width of support and resistance zones are calculated with ATR. Possibility to find anticipated support and resistance in order to have more timeliness informations.
Enjoy the indicator and don’t forget to take the trade ;)
fontilabLibrary "fontilab"
Provides function's indicators for pivot - trend - resistance.
pivots(src, lenght, isHigh) Detecting pivot points (and returning price + bar index.
Parameters:
src : The chart we analyse.
lenght : Used for the calcul.
isHigh : lookging for high if true, low otherwise.
Returns: The bar index and the price of the pivot.
calcDevThreshold(tresholdMultiplier, closePrice) Calculate deviation threshold for identifying major swings.
Parameters:
tresholdMultiplier : Usefull to equilibrate the calculate.
closePrice : Close price of the chart wanted.
Returns: The deviation threshold.
calcDev(basePrice, price) Custom function for calculating price deviation for validating large moves.
Parameters:
basePrice : The reference price.
price : The price tested.
Returns: The deviation.
pivotFoundWithLines(dev, isHigh, index, price, dev_threshold, isHighLast, pLast, iLast, lineLast) Detecting pivots that meet our deviation criteria.
Parameters:
dev : The deviation wanted.
isHigh : The type of pivot tested (high or low).
index : The Index of the pivot tested.
price : The chart price wanted.
dev_threshold : The deviation treshold.
isHighLast : The type of last pivot.
pLast : The pivot price last.
iLast : Index of the last pivot.
lineLast : The lst line.
Returns: The Line and bool is pivot High.
getDeviationPivots(thresholdMultiplier, depth, lineLast, isHighLast, iLast, pLast, deleteLines, closePrice, highPrice, lowPrice) Get pivot that meet our deviation criteria.
Parameters:
thresholdMultiplier : The treshold multiplier.
depth : The depth to calculate pivot.
lineLast : The last line.
isHighLast : The type of last pivot
iLast : Index of the last pivot.
pLast : The pivot price last.
deleteLines : If the line are draw or not.
closePrice : The chart close price.
highPrice : The chart high price.
lowPrice : The chart low price.
Returns: All pivot the informations.
getElIntArrayFromEnd() Get the last element of an int array.
getElFloatArrayFromEnd() Get the last element of an float array.
getElBoolArrayFromEnd() Get the last element of a bool array.
isTrendContinuation(isTrendUp, arrayBounds, lastPrice, precision) Check if last price is between bounds array.
Parameters:
isTrendUp : Is actual trend up.
arrayBounds : The trend array.
lastPrice : The pivot Price that just be found.
precision : The percent we add to actual bounds to validate a move.
Returns: na if price is between bounds, true if continuation, false if not.
getTrendPivots(trendBarIndexes, trendPrices, trendPricesIsHigh, interBarIndexes, interPrices, interPricesIsHigh, isTrendHesitate, isTrendUp, trendPrecision, pLast, iLast, isHighLast) Function to update array and trend related to pivot trend interpretation.
Parameters:
trendBarIndexes : The array trend bar index.
trendPrices : The array trend price.
trendPricesIsHigh : The array trend is high.
interBarIndexes : The array inter bar index.
interPrices : The array inter price.
interPricesIsHigh : The array inter ishigh.
isTrendHesitate : The actual status of is trend hesitate.
isTrendUp : The actual status of is trend up.
trendPrecision : The var precision to add in "iscontinuation" function.
pLast : The last pivot price.
iLast : The last pivot bar index.
isHighLast : The last pivot "isHigh".
Returns: trend & inter arrays, is trend hesitate, is trend up.
drawBoundLines(startIndex, startPrice, endIndex, endPrice, breakingPivotIndex, breakingPivotPrice, isTrendUp) Draw bounds and breaking line of the trend.
Parameters:
startIndex : Index of the first bound line.
startPrice : Price of first bound line.
endIndex : Index of second bound line.
endPrice : price of second bound line.
breakingPivotIndex : The breaking line index.
breakingPivotPrice : The breaking line price.
isTrendUp : The actual status of the trend.
Returns: The lines bounds and breaking line.

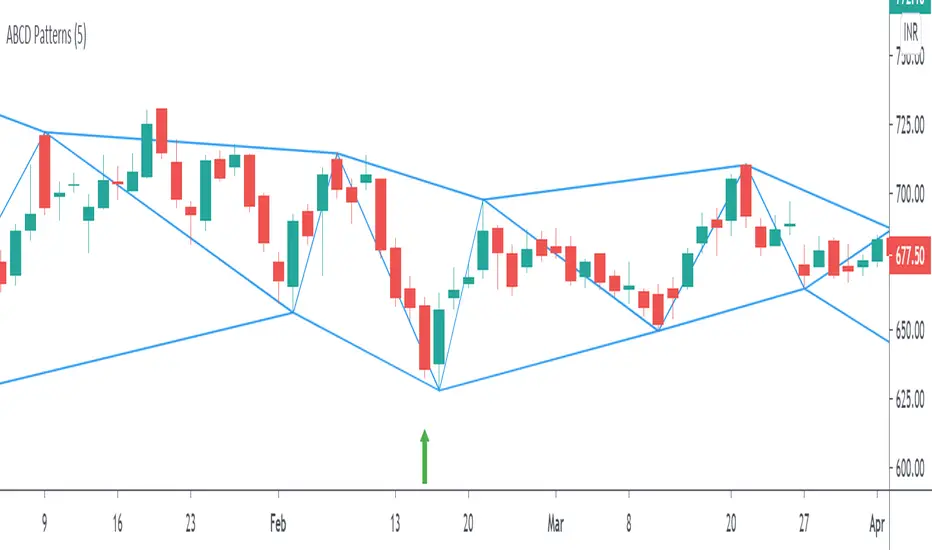
ABCD Harmonic PatternsShows Bullish and Bearish AB=CD Harmonic Patterns with Pivot High, Pivot Low and Pivot Line
Range Breakout [sgbpulse]Range Breakout
1. Overview
The "Range Breakout " indicator is a powerful tool designed to identify and visually display price ranges on your chart using pivot points. It dynamically draws two distinct boxes – an External Range and an Internal Range – helping traders pinpoint potential support and resistance zones. Beyond its visual representation, the indicator offers a comprehensive set of 12 unique breakout alerts, providing real-time notifications for significant price movements outside these defined ranges. Additionally, it integrates RSI and MFI metrics for momentum confirmation.
2. How It Works
The indicator operates by identifying pivot points based on user-defined "left" and "right" bar lengths. A high pivot is a bar with a specified number of lower highs both to its left and right, and similarly for a low pivot.
External Range: Calculated using longer pivot lengths (default: 15 bars left, 6 bars right). This range represents broader, more significant price consolidation areas.
Internal Range: Calculated using shorter pivot lengths (default: 4 bars left, 3 bars right). This range captures tighter, more immediate price consolidations within the broader trend.
The External Range will always be greater than or equal to the Internal Range, as it's based on a wider historical context. Both ranges are displayed as transparent boxes on your chart, dynamically adjusting as new pivots are formed.
3. Key Features and Settings
Customizable Pivot Lengths:
External Range (Left/Right Bars): Adjust sensitivity for identifying the broader price range. Longer lengths lead to more stable, but less frequent, range updates.
Internal Range (Left/Right Bars): Adjust sensitivity for the tighter, more immediate price range.
Tool Tips: Minimum 6 bars for the External Range, and minimum 2 bars for the Internal Range.
Customizable Range Colors: Easily change the background colors of the External and Internal Range boxes to match your chart's aesthetic.
Dynamic Range Display: The indicator automatically updates the range boxes as new pivot highs and lows are formed, always presenting the most current valid ranges.
RSI / MFI Settings:
Timeframe Source: Select the timeframe for RSI and MFI calculation.
- Chart: Calculation based on the current chart timeframe.
- Daily: Always calculated based on the daily ("D") timeframe, even if the chart is on a lower timeframe.
RSI Length: Period length for RSI calculation (default: 14).
RSI Overbought Level: Overbought level for RSI (default: 70.0).
RSI Oversold Level: Oversold level for RSI (default: 30.0).
MFI Length: Period length for MFI calculation (default: 14).
MFI Overbought Level: Overbought level for MFI (default: 80.0).
MFI Oversold Level: Oversold level for MFI (default: 20.0).
4. Synergy of Ranges & Breakout Strength
The interaction between the External and Internal Ranges provides deep insights into price movement and breakout strength:
Immediate Direction: The movement of the Internal Range (up or down) indicates the short-term directional bias within the broader framework of the External Range.
Strength Confirmation: A breakout of the External Range, followed by a breakout of the Internal Range, confirms the strength of the move and increases confidence in the breakout.
Strong Momentum ("Leaving" Ranges Behind): When price breaks out with exceptionally strong momentum, it continues to move aggressively and does not immediately form new pivots. In such situations, the existing ranges (External and Internal) remain in place while the candles "leave them behind." A "Full Candle" breakout, where the entire candle moves past both ranges, indicates a particularly powerful and decisive move.
Momentum (RSI / MFI) as Confirmation:
- RSI (Relative Strength Index): Measures the speed and change of price movements. Extreme values (above 70 or below 30) indicate overbought/oversold conditions respectively, confirming strong momentum in a breakout.
- MFI (Money Flow Index): Similar to RSI but incorporates volume. Extreme values (above 80 or below 20) indicate strong money flow in/out, reinforcing breakout confirmation.
- Importance of Confirmation: If a breakout occurs but momentum indicators do not confirm it (for example, an upside breakout while RSI is declining), this could signal weakness in the move and the risk of a false breakout (Fakeout).
5. Visuals
The indicator provides clear visual representations on the chart:
Range Boxes:
Two dynamic boxes are drawn on the chart: one for the External Range and one for the Internal Range.
These boxes update continuously, displaying the current range boundaries based on the latest pivots. They provide an immediate visual indication of support and resistance levels.
RSI/MFI Status Labels:
Small text labels appear to the right of the current bar, vertically centered.
They display the status of RSI and MFI: RSI OB (Overbought), RSI OS (Oversold), MFI OB, MFI OS, along with the exact value.
Important: The labels remain on the chart as long as the condition holds (indicator is above/below the level), unlike alerts which mark a singular crossover event.
Plotting of Key Values:
The indicator plots six invisible series on the chart, primarily to allow the user to view the exact numerical values of:
- The upper and lower bounds of the External Range (External High, External Low).
- The upper and lower bounds of the Internal Range (Internal High, Internal Low).
- The calculated RSI and MFI values (RSI, MFI).
These values are accessible for viewing through TradingView's Data Window and also via the Status Line when hovering over the relevant candle. This enables more precise quantitative analysis of range levels and momentum.
6. Comprehensive Breakout Alerts
The "Range Breakout " indicator provides 12 distinct alert conditions for breakouts, allowing you to select the required level of confirmation for each alert. All alerts are triggered only upon a fully confirmed bar close (barstate.isconfirmed) to minimize false signals and ensure reliability.
All breakout alerts are configured to detect a Crossover/Crossunder of the levels, meaning a specific event where the price moves from one side of the range to the other.
External Range Breakout UP
- Close: Price closes above the External Range.
- Real Body: The entire "real body" of the candle (min of open/close prices) closes above the External Range.
- Full Candle: The entire candle (the lowest point of the candle) closes above the External Range.
External Range Breakout DOWN
- Close: Price closes below the External Range.
- Real Body: The entire "real body" of the candle (max of open/close prices) closes below the External Range.
- Full Candle: The entire candle (the highest point of the candle) closes below the External Range.
Internal Range Breakout UP
- Close: Price closes above the Internal Range.
- Real Body: The "real body" of the candle closes above the Internal Range.
- Full Candle: The entire candle closes above the Internal Range.
Internal Range Breakout DOWN
- Close: Price closes below the Internal Range.
- Real Body: The "real body" of the candle closes below the Internal Range.
- Full Candle: The entire candle closes below the Internal Range.
7. Ideal Use Cases
This indicator is ideal for traders who:
Want to clearly identify and monitor price consolidation zones.
Seek confirmation for breakout strategies across various timeframes.
Require reliable and automated alerts for potential entry or exit points based on range expansion.
8. Complementary Indicator
For even more comprehensive market analysis, we highly recommend using this indicator in conjunction with Market Structure Support & Resistance External/Internal & BoS .
This powerful complementary indicator automatically and accurately identifies significant support and resistance levels by locating high and low pivot points, as well as key Pre-Market High/Low levels. Its strength lies in its dynamic adaptability to any timeframe and asset, providing precise and relevant real-time levels while maintaining a clean chart. It also identifies Break of Structure (BoS) to signal potential trend changes or continuations.
Using both indicators together provides a robust framework for identifying defined ranges and potential trend shifts, enabling more informed trading decisions.
View Market Structure Support & Resistance External/Internal & BoS Indicator
9. Important Note: Trading Risk
This indicator is intended for educational and informational purposes only and does not constitute investment advice or a recommendation for trading in any form whatsoever.
Trading in financial markets involves significant risk of capital loss. It is important to remember that past performance is not indicative of future results. All trading decisions are your sole responsibility. Never trade with money you cannot afford to lose.

GOLDEN Trading System by @thejamiulThe Golden Trading System is a powerful trading indicator designed to help traders easily identify market conditions and potential breakout opportunities.
Source of this indicator :
This indicator is built on TradingView original pivot indicator but focuses exclusively on Camarilla pivots, utilising H3-H4 and L3-L4 as breakout zones.
Timeframe Selection:
Before start using it we should choose Pivot Resolution time-frame accordingly.
If you use 5min candle - use D
If you use 15min candle - use W
If you use 1H candle - use M
If you use 1D candle - use 12M
How It Works:
Sideways Market: If the price remains inside the H3-H4 as Green Band and L3-L4 as Red band, the market is considered range-bound.
Trending Market: If the price moves outside Green Band, it indicates a potential up-trend formation. If the price moves outside Red Band, it indicates a potential down-trend formation.
Additional Features:
Displays Daily, Weekly, Monthly, and Yearly Highs and Lows to help traders identify key support and resistance levels also helps spot potential trend reversal points based on historical price action. Suitable for both intraday and swing trading strategies.
This indicator is a trend-following and breakout confirmation tool, making it ideal for traders looking to improve their decision-making with clear, objective levels.
🔹 Note: This script is intended for educational purposes only and should not be considered financial advice. Always conduct your own research before making trading decisions.

Tomorrow Floor Pivots with CPR By Nifty ZThe colors for resistance and support levels have been updated to gradient reds and greens for clearer distinction.
The CPR band uses light blue and purple to stand out more effectively.
Here's a detailed explanation of the user inputs and the typical use of **Floor Pivots for Tomorrow’s Market Range** in a trading context, focusing on support, resistance, and breakout scenarios:
The script allows traders to customize key parameters for their analysis:
1. Pivot Timeframe:
- Users can select different timeframes for calculating floor pivots, such as 1 hour, 4 hours, daily, weekly, monthly, etc.
- This is crucial because the timeframe selection influences the granularity of the support and resistance levels for the next trading day.
- For instance, selecting a **Daily** timeframe will calculate floor pivots for the next trading day, while selecting **Weekly** will give levels for the upcoming week.
2. Show Floor Pivots:
- Users can toggle the visibility of the calculated **Floor Pivots**, which include resistance levels (R1, R2, R3, R4) and support levels (S1, S2, S3, S4).
3. Show CPR (Central Pivot Range):
- CPR (Central Pivot Range) is a key area where the price tends to consolidate.
- The script allows users to enable or disable the visibility of CPR, which consists of the BC (Bottom Central Pivot) and TC (Top Central Pivot).
4. Show Labels:
- Users can choose whether or not to display labels indicating the **Pivot**, **Support**, and Resistance levels on the chart. This can be helpful for visual analysis when day trading.
Understanding Floor Pivots
The Floor Pivots (Pivot, Resistance, and Support levels) for tomorrow's market range are calculated based on today’s high, low, and close. These levels help traders anticipate how the market may behave in the upcoming session.
1. Pivot:
- The Pivot Point is a central level, calculated as the average of the high, low, and close. It’s considered a reference point that determines the market’s overall bias.
- If the price is trading **above the pivot**, it generally suggests a **bullish** sentiment for the day.
- If the price is trading **below the pivot**, it suggests a **bearish** sentiment.
2. Resistance Levels (R1, R2, R3, R4):
- R1 is often the first area where price may stall in an uptrend. It represents the first major resistance level.
- **R2**, **R3**, and **R4** mark additional levels of resistance, progressively further away from the current price. These are used to project potential upward targets.
- These resistance levels are areas where the price might encounter selling pressure, especially during day trading.
3. **Support Levels (S1, S2, S3, S4):**
- Similarly, **S1** is the first area where the price might find support in a downtrend.
- **S2**, **S3**, and **S4** provide deeper support levels where the price may bounce from.
- These support zones are used by day traders to anticipate where the price might reverse upward.
### **Role of Resistance and Support in Day Trading**
- **Resistance Levels (R1, R2, R3, R4)** indicate potential areas where price could **stall** during an uptrend. These levels are useful for **short-term traders** looking to set exit points or identify reversal zones.
- **Support Levels (S1, S2, S3, S4)** highlight areas where the price could **find support** and potentially **bounce** higher. These levels are particularly helpful for identifying buy zones in a downtrend.
- If a price **breaks out** above the resistance levels or **breaks down** below the support levels, it often signals a strong trend continuation.
### **Understanding the Central Pivot Range (CPR)**
The **CPR** is formed by two key levels:
- **BC (Bottom Central Pivot):** The midpoint of the day’s high and low.
- **TC (Top Central Pivot):** The difference between the pivot and BC.
The CPR acts as a region of **consolidation** or **indecision** where the market is likely to stay within a narrow range. The width of the CPR gives traders a sense of volatility:
- A **narrow CPR** often signals that a **breakout** is imminent.
- A **wider CPR** suggests that the market could remain range-bound.
### **Market Sentiment Based on Floor Pivots**
The relationship between **today’s** and **tomorrow’s pivots** is crucial in determining the market sentiment for the next day.
1. **Bullish Case (Higher Highs):**
- If **tomorrow's pivot** is higher than **today's pivot**, it indicates a **bullish sentiment**. This suggests that the market is likely to trend upward in the next session.
- In a **bullish overlapping pivot range**, if **Day 1 (today)** is higher than **Day 2 (tomorrow)**, traders expect continued upward momentum.
2. **Bearish Case (Lower Lows):**
- Conversely, if **tomorrow's pivot** is lower than **today's pivot**, it suggests a **bearish sentiment** and that the market could trend downward in the next session.
- In a **bearish overlapping pivot range**, if **Day 1 (today)** is lower than **Day 2 (tomorrow)**, traders expect continued downward pressure.
### **Breakout Scenarios**
A breakout occurs when the price **violates either the support or resistance levels** significantly, indicating that the price is moving in the direction of the breakout.
1. **Bullish Breakout:**
- If the price consistently stays **above the CPR** and **resistance levels (R1, R2)**, it indicates a strong **bullish breakout**.
- This is especially true when the **CPR is narrow** for both days, signaling a buildup in price action and a potential breakout to the upside.
2. **Bearish Breakout:**
- If the price breaks **below the CPR** and **support levels (S1, S2)**, it indicates a **bearish breakout**.
- A narrow CPR on **both days** suggests that a breakout to the downside could be imminent.
3. **Neutral or Ranging Days:**
- Sometimes, the CPR stays **unchanged** for 4-5 days, indicating a period of **consolidation** where the price is moving within a tight range. This often leads to a significant breakout once the consolidation ends.
Strategic Application of Floor Pivots for Tomorrow
Traders use floor pivots to plan their next-day trades by:
- **Aligning with Market Sentiment:** Based on whether tomorrow’s pivot is higher or lower than today’s, traders can align their trades in the direction of the market’s overall bias.
- **Identifying Entry and Exit Points:** Resistance and support levels provide well-defined areas to enter or exit trades, making pivots essential for day trading strategies.
- **Anticipating Breakouts:** Monitoring the width of the CPR and the relation between pivots helps traders anticipate potential breakouts, allowing them to react quickly to sudden price movements.
By effectively using these pivots and understanding their significance, traders can improve their decision-making for short-term trades in the stock or futures markets.
Quasimodo (QML) Pattern [Kodexius]Quasimodo (QML) Pattern is a market structure indicator that automatically detects Bullish and Bearish Quasimodo formations using confirmed swing pivots, then visualizes the full structure directly on the chart. The script focuses on the classic liquidity-grab narrative of the QML: a sweep beyond a prior swing (the Head) followed by a decisive market structure break (MSB), leaving behind a clearly defined reaction zone between the Left Shoulder and the Head.
Detection is built on pivot highs and lows, so patterns are evaluated only after swing points are validated. Once a valid 4 pivot sequence is identified, the indicator draws the pattern legs, highlights the internal triangle area to emphasize the grab, marks the MSB leg, and projects a QML zone that can be used as a potential area of interest for retests.
This tool is designed for traders who work with structure, liquidity concepts, and reversal/continuation triggers, and who want a clean, repeatable QML visualization without manually marking swings.
🔹 Features
🔸 Confirmed Pivot Based Structure Mapping
The script uses classic built-in pivot logic to detect swing highs and swing lows.
🔸 Automatic Bullish and Bearish QML Detection
The indicator evaluates the most recent 4 pivots and checks for a valid alternating sequence (High-Low-High-Low or Low-High-Low-High). When the sequence matches QML requirements, the script classifies the setup as bullish or bearish:
Bullish logic (structure reversal up):
- Left Shoulder is a pivot Low
- Head is a lower Low than the Left Shoulder (liquidity sweep)
- MSB pivot exceeds the Reaction pivot
Bearish logic (structure reversal down):
- Left Shoulder is a pivot High
- Head is a higher High than the Left Shoulder (liquidity sweep)
- MSB pivot breaks below the Reaction pivot
🔸 Full Pattern Visualization (Legs + Highlighted Core)
When a pattern triggers, the script draws:
Three main legs: Left Shoulder to Reaction, Reaction to Head, Head to MSB
A shaded triangular highlight over the internal structure to make the liquidity-grab shape easy to spot at a glance
🔸 QML Zone Projection
A QML Zone box is drawn using the price range defined between the Left Shoulder and the Head, then extended to the right to remain visible as price develops. This zone is intended to act as a practical reference area for potential retests and reaction planning after MSB confirmation.
🔸 MSB Emphasis
A dotted MSB line is drawn between the Reaction point and the MSB point to visually emphasize the confirmation leg that completes the pattern logic.
🔸 Clean Point Tagging and Directional Labeling
Key points are labeled directly on the chart:
- “LS” at the Left Shoulder
- “Head” at the sweep pivot
- “MSB” at the break pivot
A directional label (“Bullish QML” or “Bearish QML”) is also printed to quickly identify the detected bias.
🔸 Configurable Visual Style
All main visual components are user configurable:
- Bullish and bearish colors
- Line width
- Label size
🔸 Efficient Update Logic
Pattern checks are only performed when a new pivot is confirmed, avoiding unnecessary repeated calculations on every bar. The most recent pattern’s projected elements (zone and label positioning) are updated as new bars print to keep the latest setup readable.
🔹 Calculations
This section summarizes the core logic used for detection and plotting.
1. Pivot Detection (Swing Highs and Lows)
The script relies on confirmed pivots using the user inputs:
Left Bars: how many bars must exist to the left of the pivot
Right Bars: how many bars must exist to the right to confirm it
float ph = ta.pivothigh(leftLen, rightLen)
float pl = ta.pivotlow(leftLen, rightLen)
When a pivot is confirmed, its true bar index is the pivot bar, not the current bar, so the script stores:
bar_index
2. Pivot Storage and History Window
Each pivot is stored as a structured object containing:
- price
- index
- isHigh (true for pivot high, false for pivot low)
A rolling history is maintained (up to 50 pivots) to keep processing stable and memory usage controlled.
3. Sequence Validation (Alternation Check)
The pattern evaluation always uses the latest 4 pivots:
p0: Left Shoulder candidate
p1: Reaction candidate
p2: Head candidate
p3: MSB candidate
Before checking bullish/bearish rules, the script enforces alternating pivot types:
bool correctSequence =
(p0.isHigh != p1.isHigh) and
(p1.isHigh != p2.isHigh) and
(p2.isHigh != p3.isHigh)
This prevents invalid structures like consecutive highs or consecutive lows from being interpreted as QML.
4. Bullish QML Conditions
A bullish QML is evaluated when the Left Shoulder is a Low:
Head must be lower than Left Shoulder (sweep)
MSB must be higher than Reaction (break)
if not p0.isHigh
if p2.price < p0.price and p3.price > p1.price
// Bullish QML confirmed
Interpretation:
p2 < p0 represents the liquidity grab below the prior swing low
p3 > p1 represents the market structure break above the reaction high
5. Bearish QML Conditions
A bearish QML is evaluated when the Left Shoulder is a High:
Head must be higher than Left Shoulder (sweep)
MSB must be lower than Reaction (break)
if p0.isHigh
if p2.price > p0.price and p3.price < p1.price
// Bearish QML confirmed
Interpretation:
p2 > p0 represents the liquidity grab above the prior swing high
p3 < p1 represents the market structure break below the reaction low
6. Drawing Logic (Structure, Highlight, Zone, Labels)
When confirmed, the script draws:
Three connecting legs (LS to Reaction, Reaction to Head, Head to MSB)
A shaded triangle using a transparent “ghost” line to enable filling
A dotted MSB emphasis line between Reaction and MSB
A QML Zone box spanning the LS to Head price range and projecting to the right
Point labels: LS, Head, MSB
A direction label: “Bullish QML” or “Bearish QML”
7. Latest Pattern Extension
To keep the newest setup readable, the script updates the most recently detected pattern by extending its projected elements as new bars print:
QML zone right edge is pushed forward
The main label x position is pushed forward
This keeps the last identified QML zone visible as price evolves, without having to redraw historical patterns on every bar.

Multi-Timeframe SFP + SMTImportant: Please Read First
This indicator is not a "one size fits all" solution. It is a professional and complex tool that requires you to learn how to use it, in addition to backtesting different settings to discover what works best for your specific trading style and the assets you trade. The default settings provided are my personal preferences for trading higher-timeframe setups, but you are encouraged to experiment and find your own optimal configuration.
Please note that while this initial version is solid, it may still contain small errors or bugs. I will be actively working on improving the indicator over time. Also, be aware that the script is not written for maximum efficiency and may be resource-intensive, but this should not pose a problem for most users.
The source code for this indicator is open. If you truly want to understand precisely how all the logic works, you can copy and paste the code into an AI assistant like Gemini or ChatGPT and ask it to explain any part of the script to you.
Author's Preferred Settings (Guideline)
As a starting point, here are the settings I personally use for my trading:
SFP Timeframe: 4-Hour (Strength: 5-5)
Max Lookback: 35 Bars
Raid Expiration: 1 Bar
SFP Lines Limit: 1
SMT Timeframe 1: 30-Minute (Strength: 2-2) with 3-Minute LTF Detection.
SMT Timeframe 2: 15-Minute (Strength: 3-3) with 3-Minute LTF Detection.
SMT Timeframe 3: 1-Hour (Strength: 1-1) with 3-Minute LTF Detection.
SMT Timeframe 4: 15-Minute (Strength: 1-1) with 3-Minute LTF Detection.
Multi-Timeframe SMT: An Overview
This indicator is a powerful tool designed to identify high-probability trading setups by combining two key institutional concepts: Swing Failure Patterns (SFP) on a higher timeframe and Smart Money Technique (SMT) divergences on a lower timeframe. A key feature is the ability to configure and run up to four independent SMT analyses simultaneously, allowing you to monitor for divergences across multiple timeframes (e.g., 15m, 1H, 4H) from a single indicator.
Its primary purpose is to generate automated signals through TradingView's alert system. By setting up alerts, the script runs server-side, monitoring the market for you. When a setup presents itself, it will send a push notification to your device, allowing you to personally evaluate the trade without being tied to your screen.
The Strategy: HTF Liquidity Sweeps into LTF SMT
The core strategy is built on a classic institutional trading model:
Wait for a liquidity sweep on a significant high timeframe (e.g., 4-hour, Daily).
Once liquidity is taken, look for a confirmation of a shift in market structure on a lower timeframe.
This indicator uses an SMT divergence as that confirmation signal, indicating that smart money may be stepping in to reverse the price.
How It Works: The Two-Step Process
The indicator's logic follows a precise two-step process to generate a signal:
Step 1: The Swing Failure Pattern (SFP)
First, the indicator identifies a high-timeframe liquidity sweep. This is configured in the "Swing Failure Pattern (SFP) Timeframe" settings.
It looks for a candle that wicks above a previous high (or below a previous low) but then closes back within the range of that pivot. This action is known as a "raid" or a "swing failure," suggesting the move failed to find genuine momentum.
Step 2: The SMT Divergence
The moment a valid SFP is confirmed, the indicator's multiple SMT engines activate.
Each engine begins monitoring the specific SMT timeframe you have configured (e.g., "SMT Timeframe 1," "SMT Timeframe 2," etc.) for a Smart Money Technique (SMT) divergence.
An SMT divergence occurs when two closely correlated assets fail to move in sync. For example, after a raid on a high, Asset A makes a new high, but Asset B fails to do so. This disagreement suggests weakness and a potential reversal.
When the script finds this divergence, it plots the SMT line and triggers an alert.
The Power of Alerts
The true strength of this indicator lies in its alert capabilities. You can create alerts for both unconfirmed and confirmed SMTs.
Enable Alerts LTF Detection: These alerts trigger when an unconfirmed, potential SMT is spotted on the lower "LTF Detection" timeframe. While not yet confirmed, these early alerts can notify you of a potential move before it fully happens, allowing you to be ahead of the curve and find the best possible trade entries.
Enable Alerts Confirmed SMT: These alerts trigger only when a permanent, confirmed SMT line is plotted on your chosen SMT timeframe. These signals are more reliable but occur later than the early detection alerts.
Key Concepts Explained
What is Pivot Strength?
Pivot Strength determines how significant a high or low needs to be to qualify as a valid structural point. A setting of 5-5, for example, means that for a candle's high to be considered a valid pivot high, its high must be higher than the highs of the 5 candles to its left and the 5 candles to its right.
Higher Strength (e.g., 5-5, 8-8): Creates fewer, but more significant, pivots. This is ideal for identifying major structural highs and lows on higher timeframes.
Lower Strength (e.g., 2-2, 3-3): Creates more pivots, making it suitable for identifying the smaller shifts in momentum on lower timeframes.
Raid Expiration & Validity
An SFP signal is not valid forever. The "Raid Expiration" setting determines how many SFP timeframe bars can pass after a raid before that signal is considered "stale" and can no longer be used to validate an SMT. This ensures your SMT divergences are always in response to recent liquidity sweeps.
Why You Must Be on the Right Chart Timeframe to See SMT Lines
Pine Script™ has a fundamental rule: an indicator running on a chart can only "see" the bars of that chart's timeframe or higher.
When the SMT logic is set to the 15-minute timeframe, it calculates its pivots based on 15-minute data. To accurately plot lines connecting these pivots, you must be on a 15-minute chart or lower (e.g., 5-minute, 1-minute).
If you are on a higher timeframe chart, like the 1-hour, the 15-minute bars do not exist on that chart, so the indicator has no bars to draw the lines on.
This is precisely why the alert system is so powerful. You can set your alert to run on the 15-minute timeframe, and TradingView's servers will monitor that timeframe for you, sending a notification regardless of what chart you are currently viewing.

TrendzonesHi all!
This indicator plots trendlines. These lines are not plotted as traditional lines, but are instead zones. This is useful if you think that trend lines are more of an area of importance than a line.
It does so by finding pivots and connecting two of them if they have not been broken (more about that later) in-between the pivots.
These trend zones can be used as support/resistance that the price can react to.
• The first trendline is drawn between the high/low of the first and second pivot.
• The second trendline's first point is at the open/close of the pivot (either the first pivot or the second one) that has the smallest difference between the high/low and the nearest open/close. The same difference (between the high/low and the open/close) is then subtracted from the other pivot's high/low. This creates a point at the other pivot bar. A trendline is then drawn between the points.
This creates two trendlines and a zone between the two trendlines. This zone is the one kept and is shown by the script.
You can define the pivot lengths used to find trend zones (defaults to 3/3). You can also define the number of pivots to look back for, to find trend zones and the number of active zones, both of these defaults to 3. You can also choose to let the script create new zones based on time ("Oldest") or the zone that is furthest away in price, this defaults to be based on time but it can be useful for letting the script remove the one which is furthest away in price. Another useful setting is the one called "Cross source". This defines the price that has to cross the trend zone to make it invalid (broken). This defaults to "Close", i.e. the bar has to close on the "wrong side" of the trend zone.
The current zones are shown with an extension to the right, but you can also choose to keep the previous lines (without extension). Please note that kept zones are only the ones that are broken, not the replaced ones. I.e. the zones that are kept are the ones that are crossed by the user defined "cross source" (defaults to the closing/current price of the bar).
Hope this makes sense, let me know if you have any questions.
Best of trading luck!

ZigZag Smart Trend [TradingFinder] Major & Minor Structured Wave🔵 Introduction
🟣 Zigzag
Zigzag is a lagging indicator; this indicator identifies points on a price chart that have more significant changes than its previous wave and then by connecting these lines to each other, it assists traders in trend detection.
This indicator reduces random price fluctuations and attempts to make the primary price trend clearer.
🟣 Pivot
Pivots are points where the price chart changes direction. Pivots, also called reversal points, form when supply and demand forces dominate one another.
Different types of technical analysis pivots can be introduced into two categories, minor pivots, and major pivots, each of which has a specific meaning in analysis.
Major Pivot : These pivots actually indicate major changes in the direction of the chart and occur at the end of trends. Analysts seeking to reach the primary analysis focus more on major pivot points. In fact, most technical analysis tools are examined and determined based on major pivots.
Minor Pivot : This type of pivot focuses more on small and subsidiary points and directions. Therefore, it occurs at the end of corrections. Analysts focusing on minor pivots represent small trends, and it should be noted that minor pivots are not suitable for use in primary technical tools.
How to identify minor and major pivots :
Minor pivots are pivots formed between two major pivots and fail to break the opposite major pivot.
Major pivots are pivots that have either successfully broken the opposite pivot or have moved more than the previous pivot of the same type.
🔵 How to use
Based on identifying pivots and drawing zigzag lines, you can have various uses for this indicator.
Identifying support and resistance levels :
Identifying Elliott Waves :
Identifying classic patterns :
Identifying pivots with higher validity :
Identifying internal and external breakouts :
Identifying trends and range areas :
Identifying pivot types along with major and minor recognition :
MHH : Major Higher High
MLH : Major Lower High
MLL : Major Lower Low
MHL : Major Higher Low
mHH : Minor Higher High
mLH : Minor Lower High
mLL : Minor Lower Low
mHL : Minor Higher Low
🔵 Settings
Pivot Period Zigzag Line : Using this input, you can determine the pivot period for identifying zigzag swings.
Show Zigzag Line : To show or not to show the zigzag line.
Zigzag Line Color : Change the color of the zigzag line.
Zigzag Line Style : Change the Style of the zigzag line.
Zigzag Line Width : Change the Width of the zigzag line.
Show Label : To show or not to show Pivot Type.
Color Label : Change the color of the Pivot Type Label.

The Strat [LuxAlgo]The Strat indicator is a full toolkit regarding most of the concepts within "The Strat" methodology with features such as candle numbering, pivot machine gun (PMG) highlighting, custom combo highlighting, and various statistics included.
Alerts are also included for the detection of specific candle numbers, custom combos, and PMGs.
🔶 SETTINGS
Show Numbers on Chart: Shows candle numbering on the chart.
Style Candles: Style candles based on the detected number. Only effective on non-line charts and if the script is brought to the front.
🔹 Custom Combo Search
Combo: User defined combo to be searched by the script. Combos can be composed of any series of numbers including (1, 2, -2, 3), e.g : 2-21. No spaces or other characters should be used.
🔹 Pivot Machine Gun
Show Labels: Highlight detected PMGs with a label.
Min Sequence Length: Minimum sequence length of consecutive higher lows/lower highs required to detect a PMG.
Min Breaks: Minimum amount of broken previous highs/lows required to detect a PMG.
Show Levels: Show levels of the broken highs/lows.
🔹 Pivot Combos
Pivot Lookback: Lookback period used for detecting pivot points.
Right Bars Scan: Number of bars scanned to the right side of a detected pivot.
Left Bars Scan: Number of bars scanned to the left side of a detected pivot.
🔹 Dashboard
Show Dashboard: Displays statistics dashboard on chart.
Numbers Counter: Displays the numbers counter section on the dashboard.
Pivot Combos: Displays pivots combo section on the dashboard.
%: Display the percentage of detected pivot combos on the dashboard instead of absolute numbers.
Pivot Combos Rows: Number of rows displayed by the "Pivots Combo" dashboard section.
Show MTF: Showa MTF candle numbering on the dashboard.
Location: Location of the dashboard on the chart.
Size: Size of the displayed dashboard.
🔶 USAGE
This script allows users with an understanding of The Strat to quickly highlight elements such as candle numbers, pivot machine guns, and custom combos. The usage for these concepts is given in the sub-sections below.
🔹 Candle Numbers
The Strat assigns a number to individual candles, this number is determined by the current candle position relative to the precedent candle, these include:
Number 1 - Inside bar, occurs when the previous candle range engulfs the current one.
Number 2 Up - Upside Directional Bar, occurs when the current price high breaks the previous high while the current low is lower than the previous high.
Number 2 Down - Downside Directional Bar, occurs when the current price low breaks the previous low while the current high is higher than the previous low.
Number 3 - Outside bar, occurs when the current candle range engulfs the previous one.
The script can highlight the number of a candle by using labels but can also style candles by depending on the candle number. Inside bars (1) only have their candle wick highlighted, directional bars (2) (-2) only have their candle body highlighted. Outside bars have their candle range highlighted.
Note that downside directional bars are highlighted with the number -2.
Users can see the total amount of times a specific candle number is detected on the historical data on the dashboard available within the settings, as well as the number of times a candle number is detected relative to the total amount of detected candle numbers expressed as a percentage.
It is also possible to see the current candle numbers returned by multiple timeframes on the dashboard.
🔹 Searching For Custom Combos
Combos are made of a sequence of two or more candle numbers. These combos can highlight multiple reversals/continuation scenarios. Various common combos are documented by The Strat community.
This script allows users to search for custom combos by entering them on the Combo user setting field.
When a user combo is found, it is highlighted on the chart as a box highlighting the combo range.
🔹 Pivot Combos
It can be of interest to a user to display the combo associated with a pivot high/low. This script will highlight the location of pivot points on the chart and display its associated combo by default. These are based on the Pivot Combo lookback and not displayed in real-time.
Users can see on the dashboard the combos associated with a pivot high/low, these are ranked by frequency.
🔹 Pivot Machine Gun (PMG)
Pivot Machine Guns (PMG)s describe the scenario where a single price variation breaks the value of multiple past successive higher lows/lower highs. This can highlight a self-exciting behavior, where even more past successive higher lows/lower highs get broken.
Users can select the minimum sequence length of successive higher lows/lower highs required for a PMG to be detected, as well the amount of these successive higher lows/lower highs that must be broken.

The Butterfly [theUltimator5]This is a technical analysis tool designed to automatically detect and visualize Butterfly harmonic patterns based on recent market pivot structures. This indicator uses a unique plotting and detection algorithm to find and display valid Butterfly patterns on the chart.
The indicator works in real-time and historically by identifying major swing highs and lows (pivots) based on a user-defined ZigZag length. It then evaluates whether the most recent price structure conforms to the ideal proportions of a bullish or bearish Butterfly pattern. If the ratios between price legs XA, AB, BC, and projected CD meet defined tolerances, the pattern is plotted on the chart along with a projected D point for potential reversal.
Key Features:
Automatic Pivot Detection: The script analyzes recent price action to construct a ZigZag pattern, identifying swing points as potential X, A, B, and C coordinates.
Butterfly Pattern Validation: The pattern is validated against traditional Fibonacci ratios:
--AB should be approximately 78.6% of XA.
--BC must lie between 38.2% and 88.6% of AB.
--CD is projected as a multiple of BC, with user control over the ratio (e.g., 1.618–2.24).
Bullish and Bearish Recognition: The pattern logic detects both bullish and bearish Butterflies, automatically adjusting plotting direction and color themes.
Custom Ratio Tolerance: Users can define how strictly the AB/XA and BC/AB legs must adhere to ideal ratios, using a percentage-based tolerance slider.
Fallback Detection Logic: If a new pattern is not identified in recent bars, the script performs a backward search on the last four pivots to find the most recent valid pattern.
Force Mode: A toggle allows users to force the drawing of a Butterfly pattern on the most recent pivot structure, regardless of whether the ideal Fibonacci rules are satisfied.
Dynamic Visualization:
--Clear labeling of X, A, B, C, and D points.
--Colored connecting lines and filled triangles to visualize structure.
--Optional table displaying key Fibonacci ratios and how close each leg is to ideal values.
Inputs:
Length: Controls the sensitivity of the ZigZag pivots. Smaller values result in more frequent pivots.
Tolerance (%): Adjustable threshold for acceptable deviation in AB/XA and BC/AB ratios.
CD Length Multiplier: Projects point D by multiplying the BC leg using a value between 1.618 and 2.24.
Force New Pattern: Overrides validation checks to display a Butterfly structure on recent pivots regardless of ratio accuracy.
Show Table: Enables a table showing calculated ratios and deviations from the ideal.

StatPivot- Dynamic Range Analyzer - indicator [PresentTrading]Hello everyone! In the following few open scripts, I would like to share various statistical tools that benefit trading. For this time, it is a powerful indicator called StatPivot- Dynamic Range Analyzer that brings a whole new dimension to your technical analysis toolkit.
This tool goes beyond traditional pivot point analysis by providing comprehensive statistical insights about price movements, helping you identify high-probability trading opportunities based on historical data patterns rather than subjective interpretations. Whether you're a day trader, swing trader, or position trader, StatPivot's real-time percentile rankings give you a statistical edge in understanding exactly where current price action stands within historical contexts.
Welcome to share your opinions! Looking forward to sharing the next tool soon!
█ Introduction and How it is Different
StatPivot is an advanced technical analysis tool that revolutionizes retracement analysis. Unlike traditional pivot indicators that only show static support/resistance levels, StatPivot delivers dynamic statistical insights based on historical pivot patterns.
Its key innovation is real-time percentile calculation - while conventional tools require new pivot formations before updating (often too late for trading decisions), StatPivot continuously analyzes where current price stands within historical retracement distributions.
Furthermore, StatPivot provides comprehensive statistical metrics including mean, median, standard deviation, and percentile distributions of price movements, giving traders a probabilistic edge by revealing which price levels represent statistically significant zones for potential reversals or continuations. By transforming raw price data into statistical insights, StatPivot helps traders move beyond subjective price analysis to evidence-based decision making.
█ Strategy, How it Works: Detailed Explanation
🔶 Pivot Point Detection and Analysis
The core of StatPivot's functionality begins with identifying significant pivot points in the price structure. Using the parameters left and right, the indicator locates pivot highs and lows by examining a specified number of bars to the left and right of each potential pivot point:
Copyp_low = ta.pivotlow(low, left, right)
p_high = ta.pivothigh(high, left, right)
For a point to qualify as a pivot low, it must have left higher lows to its left and right higher lows to its right. Similarly, a pivot high must have left lower highs to its left and right lower highs to its right. This approach ensures that only significant turning points are recognized.
🔶 Percentage Change Calculation
Once pivot points are identified, StatPivot calculates the percentage changes between consecutive pivot points:
For drops (when a pivot low is lower than the previous pivot low):
CopydropPercent = (previous_pivot_low - current_pivot_low) / previous_pivot_low * 100
For rises (when a pivot high is higher than the previous pivot high):
CopyrisePercent = (current_pivot_high - previous_pivot_high) / previous_pivot_high * 100
These calculations quantify the magnitude of each market swing, allowing for statistical analysis of historical price movements.
🔶 Statistical Distribution Analysis
StatPivot computes comprehensive statistics on the historical distribution of drops and rises:
Average (Mean): The arithmetic mean of all recorded percentage changes
CopyavgDrop = array.avg(dropValues)
Median: The middle value when all percentage changes are arranged in order
CopymedianDrop = array.median(dropValues)
Standard Deviation: Measures the dispersion of percentage changes from the average
CopystdDevDrop = array.stdev(dropValues)
Percentiles (25th, 75th): Values below which 25% and 75% of observations fall
Copyq1 = array.get(sorted, math.floor(cnt * 0.25))
q3 = array.get(sorted, math.floor(cnt * 0.75))
VaR95: The maximum expected percentage drop with 95% confidence
Copyvar95D = array.get(sortedD, math.floor(nD * 0.95))
Coefficient of Variation (CV): Measures relative variability
CopycvD = stdDevDrop / avgDrop
These statistics provide a comprehensive view of market behavior, enabling traders to understand the typical ranges and extreme moves.
🔶 Real-time Percentile Ranking
StatPivot's most innovative feature is its real-time percentile calculation. For each current price, it calculates:
The percentage drop from the latest pivot high:
CopycurrentDropPct = (latestPivotHigh - close) / latestPivotHigh * 100
The percentage rise from the latest pivot low:
CopycurrentRisePct = (close - latestPivotLow) / latestPivotLow * 100
The percentile ranks of these values within the historical distribution:
CopyrealtimeDropRank = (count of historical drops <= currentDropPct) / total drops * 100
This calculation reveals exactly where the current price movement stands in relation to all historical movements, providing crucial context for decision-making.
🔶 Cluster Analysis
To identify the most common retracement zones, StatPivot performs a cluster analysis by dividing the range of historical drops into five equal intervals:
CopyrangeSize = maxVal - minVal
For each interval boundary:
Copyboundaries = minVal + rangeSize * i / 5
By counting the number of observations in each interval, the indicator identifies the most frequently occurring retracement zones, which often serve as significant support or resistance areas.
🔶 Expected Price Targets
Using the statistical data, StatPivot calculates expected price targets:
CopytargetBuyPrice = close * (1 - avgDrop / 100)
targetSellPrice = close * (1 + avgRise / 100)
These targets represent statistically probable price levels for potential entries and exits based on the average historical behavior of the market.
█ Trade Direction
StatPivot functions as an analytical tool rather than a direct trading signal generator, providing statistical insights that can be applied to various trading strategies. However, the data it generates can be interpreted for different trade directions:
For Long Trades:
Entry considerations: Look for price drops that reach the 70-80th percentile range in the historical distribution, suggesting a statistically significant retracement
Target setting: Use the Expected Sell price or consider the average rise percentage as a reasonable target
Risk management: Set stop losses below recent pivot lows or at a distance related to the statistical volatility (standard deviation)
For Short Trades:
Entry considerations: Look for price rises that reach the 70-80th percentile range, indicating an unusual extension
Target setting: Use the Expected Buy price or average drop percentage as a target
Risk management: Set stop losses above recent pivot highs or based on statistical measures of volatility
For Range Trading:
Use the most common drop and rise clusters to identify probable reversal zones
Trade bounces between these statistically significant levels
For Trend Following:
Confirm trend strength by analyzing consecutive higher pivot lows (uptrend) or lower pivot highs (downtrend)
Use lower percentile retracements (20-30th percentile) as entry opportunities in established trends
█ Usage
StatPivot offers multiple ways to integrate its statistical insights into your trading workflow:
Statistical Table Analysis: Review the comprehensive statistics displayed in the data table to understand the market's behavior. Pay particular attention to:
Average drop and rise percentages to set reasonable expectations
Standard deviation to gauge volatility
VaR95 for risk assessment
Real-time Percentile Monitoring: Watch the real-time percentile display to see where the current price movement stands within the historical distribution. This can help identify:
Extreme movements (90th+ percentile) that might indicate reversal opportunities
Typical retracements (40-60th percentile) that might continue further
Shallow pullbacks (10-30th percentile) that might represent continuation opportunities in trends
Support and Resistance Identification: Utilize the plotted pivot points as key support and resistance levels, especially when they align with statistically significant percentile ranges.
Target Price Setting: Use the expected buy and sell prices calculated from historical averages as initial targets for your trades.
Risk Management: Apply the statistical measurements like standard deviation and VaR95 to set appropriate stop loss levels that account for the market's historical volatility.
Pattern Recognition: Over time, learn to recognize when certain percentile levels consistently lead to reversals or continuations in your specific market, and develop personalized strategies based on these observations.
█ Default Settings
The default settings of StatPivot have been carefully calibrated to provide reliable statistical analysis across a variety of markets and timeframes, but understanding their effects allows for optimal customization:
Left Bars (30) and Right Bars (30): These parameters determine how pivot points are identified. With both set to 30 by default:
A pivot low must be the lowest point among 30 bars to its left and 30 bars to its right
A pivot high must be the highest point among 30 bars to its left and 30 bars to its right
Effect on performance: Larger values create fewer but more significant pivot points, reducing noise but potentially missing important market structures. Smaller values generate more pivot points, capturing more nuanced movements but potentially including noise.
Table Position (Top Right): Determines where the statistical data table appears on the chart.
Effect on performance: No impact on analytical performance, purely a visual preference.
Show Distribution Histogram (False): Controls whether the distribution histogram of drop percentages is displayed.
Effect on performance: Enabling this provides visual insight into the distribution of retracements but can clutter the chart.
Show Real-time Percentile (True): Toggles the display of real-time percentile rankings.
Effect on performance: A critical setting that enables the dynamic analysis of current price movements. Disabling this removes one of the key advantages of the indicator.
Real-time Percentile Display Mode (Label): Chooses between label display or indicator line for percentile rankings.
Effect on performance: Labels provide precise information at the current price point, while indicator lines show the evolution of percentile rankings over time.
Advanced Considerations for Settings Optimization:
Timeframe Adjustment: Higher timeframes generally benefit from larger Left/Right values to identify truly significant pivots, while lower timeframes may require smaller values to capture shorter-term swings.
Volatility-Based Tuning: In highly volatile markets, consider increasing the Left/Right values to filter out noise. In less volatile conditions, lower values can help identify more potential entry and exit points.
Market-Specific Optimization: Different markets (forex, stocks, commodities) display different retracement patterns. Monitor the statistics table to see if your market typically shows larger or smaller retracements than the current settings are optimized for.
Trading Style Alignment: Adjust the settings to match your trading timeframe. Day traders might prefer settings that identify shorter-term pivots (smaller Left/Right values), while swing traders benefit from more significant pivots (larger Left/Right values).
By understanding how these settings affect the analysis and customizing them to your specific market and trading style, you can maximize the effectiveness of StatPivot as a powerful statistical tool for identifying high-probability trading opportunities.

Liquidity Grab Zones | Flux Charts💎 GENERAL OVERVIEW
Introducing our new Liquidity Grab Zones Indicator! This indicator finds liquidity grabs in the current ticker and renders buyside & sellside liquidity grab zones. The retests and breakout of the zones are labeled, and you can set up alerts to get notified. For more information, please check the "HOW DOES IT WORK" section.
Features of the new Liquidity Grab Zones Indicator :
Renders Buyside & Sellside Liquidity Grab Zones
Retests & Breaks
Inverse Zones After Broken Feature
Alerts For All Features
Customizable Algorithm
Customizable Styles
🚩UNIQUENESS
Liquidity grabs can be useful when determining candles that have executed a lot of market orders, so you can plann your trades accordingly. This indicator lets you customize the pivot length and the wick-body ratio for liquidity grabs, provide retest & breakout labels, with customized styling and alerts.
📌 HOW DOES IT WORK ?
Liquidity grabs occur when one of the latest pivots has a false breakout. Then, if the wick to body ratio of the bar is higher than 0.5 (can be changed from the settings) a zone is plotted.
These zones usually indicate areas of high market interest where price action may reverse or accelerate. Identifying these zones can provide traders with critical levels for entering or exiting trades. A breakout of these zones generally mean strong movements are inbound, while failing breakouts make these zones act like support / resistance zones.
The indicator also reverses the type of the zone after an invalidation (can be turned off from the settings). This feature helps traders identify potential reversals more accurately.
The zone width is set to the area from the wick to the body of the candlestick, which can be seen here :
⚙️SETTINGS
1. General Configuration
Pivot Length -> This setting determines the range of the pivots. This means a candle has to have the highest / lowest wick of the previous X bars and the next X bars to become a high / low pivot.
Wick-Body Ratio -> After a pivot has a false breakout, the wick-body ratio of the latest candle is tested. The resulting ratio must be higher than this setting for it to be considered as a liquidity grab.
Zone Invalidation -> Select between Wick & Close price for Liquidity Grab Zone Invalidation.
Use these customizable settings to fine-tune the indicator according to your trading strategy and preferences.

Liquidity Grabs | Flux Charts💎 GENERAL OVERVIEW
Introducing our new Liquidity Grabs indicator! This indicator can renders bubbles with different sizes at candles that have liquidity grabs, which happen when a liquidity areas (buyside / sellside liquidity) is swept. These candles often fill a lot of market orders that were sitting on the liquidity zone. You can check "How Does It Work" section for more information.
Features of the new Liquidity Grabs Indicator :
Renders Liquidity Grabs
Customizable Algorithm
Customizable Styles
Alerts
🚩UNIQUENESS
Liquidity grabs can be useful when determining candles that have executed a lot of market orders, and planning your trades accordingly. This indicator renders liquidity grabs in an unique bubble style, the size of the bubble is calculated by the size of the wick that caused the liquidity grab. The indicator also lets you customize the pivot length and the wick-body ratio for liquidity grabs.
📌 HOW DOES IT WORK ?
Liquidity grabs occur when one of the latest pivots has a false breakout. Then, if the wick to body ratio of the bar is higher than 0.5 (can be changed from the settings) a bubble is plotted. Using the wick length as a metric to measure liquidity is good because long wicks can translate to a large amount of buyers / sellers entering the market.
The bubble size is determined by the wick to body ratio of the candle.
⚙️SETTINGS
1. General Configuration
Pivot Length -> This setting determines the range of the pivots. This means a candle has to have the highest / lowest wick of the previous X bars and the next X bars to become a high / low pivot.
Wick-Body Ratio -> After a pivot has a false breakout, the wick-body ratio of the latest candle is tested. The resulting ratio must be higher than this setting for it to be considered as a liquidity grab.
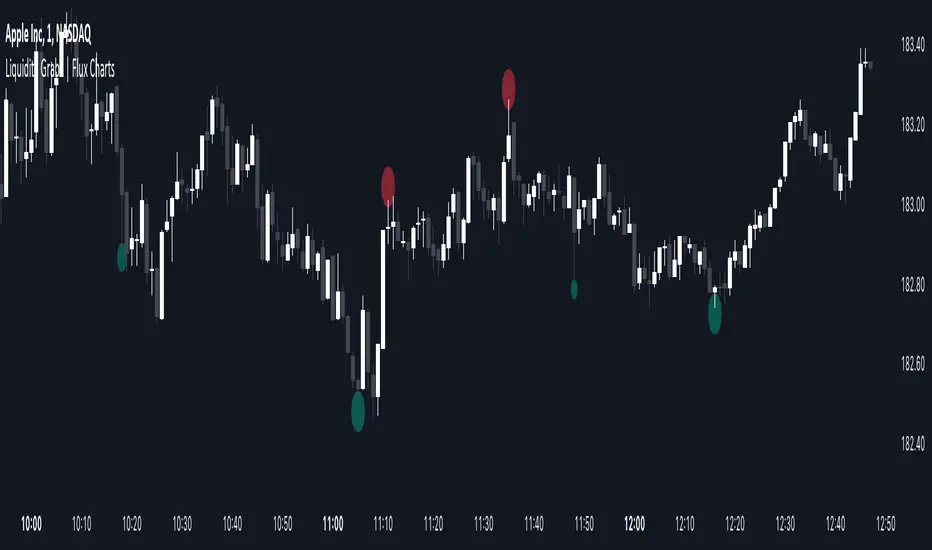
Resistance/Support Indicator - FontiramisuIndicator showing resistances and support, based on pivots location
When a new pivot location is near from a resistance/support the latter gains weight.
You can modify multiple parameters :
Nb Max res/sup : Define the number max res/sup to keep in our res/sup history array. The greater it is the older bar index will be taken.
Nb show res/sup : Define the number of res/sup to be drawn.
Min weight shown : Define min res/sup weight to be shown. Weight is used to measure strengh of res/sup.
% range stack : Define price percentage change required to stack a pivot into an existing res/sup. Default is 0.015 = 1.5%.
Pivots are calculated with deviation parameter to validate with more precision.
Fontilab Library is used to code this indicator.

Auto Pivots with S/R LevelsPlots out the pivot point with corresponding Support / Resistance levels.
It will automatically determine the time frame to calculate pivots based on the current view resolution.
Monthly resolution will pull a yearly pivot
Weekly resolution will pull a monthly pivot
Daily view will pull a weekly pivot
Intraday view will pull a daily pivot.
You have the choice of using Standard pivots or Fibonacci pivots
You can choose to only display the most recent pivot or all pivots
You can chose to extend the most recent pivot across the whole chart as a price line
TODO:
- Add in the ability to choose how far back historically to display pivots
- Add in calculations for smaller resolutions to calculate off lower time frames. EX: minute resolution should pull hour time frame to calculate pivots.
SuperTrend - With Exits & Trade ZonesSuperTrend - With Exits & Trade Zones
Overview
An advanced trend-following indicator that combines pivot points with the SuperTrend methodology to create a complete trading system with entry signals, exit signals, and visual trade zones. This indicator adapts to market structure rather than just price action, providing more reliable trend identification.
What Makes This Unique
Unlike standard SuperTrend indicators that use moving averages, this version:
Uses actual pivot points to calculate a dynamic center line
Provides multiple entry mode options for different trading styles
Shows clear exit signals (both trailing stop and take profit)
Color-codes the entire chart into trade zones (Long, Short, No Trade)
Eliminates guesswork about when to enter, exit, and stay out
Features
📊 Core Indicator Components
Pivot Point Detection: Identifies local highs and lows in price structure
Dynamic Center Line: Weighted calculation using detected pivot points
ATR-Based Bands: Volatility-adjusted upper and lower bands
Trailing Stop Line: Adaptive stop-loss that follows the trend
🎯 Entry Signals
Four entry modes to match your trading style:
Immediate Mode ⚡
Signals right when the trailing stop breaks
Fastest entries for aggressive traders
Best for strong trending markets
Aggressive Mode 🔥 (Recommended)
Signals when price closes beyond break candle OR opens beyond it
Balanced speed and confirmation
Good for most market conditions
Balanced Mode ⚖️
Requires entire candle to close beyond break level
Moderate confirmation
Reduces false breakouts
Conservative Mode 🛡️
Waits for candle to open AND stay completely beyond break level
Highest confirmation, slowest entries
Best for choppy markets
🚪 Exit Signals
Three exit strategies:
Trailing Stop
Exits when price crosses back through the trailing stop line
Lets profits run in trending markets
Protects gains when trend weakens
Take Profit %
Exits at predetermined profit target
Locks in gains at specific percentage
Good for range-bound markets
Both
Uses whichever exit comes first
Combines profit protection with trend following
Recommended for most traders
🎨 Visual Trade Zones
Color-coded backgrounds eliminate confusion:
🟢 Light Green: Active LONG position
🔴 Light Red: Active SHORT position
⚫ Gray: NO TRADE ZONE (between exit and next signal)
📍 Additional Visual Elements
Diamond markers: Show when trailing stop is first broken
BUY/SELL labels: Clear entry signals in green/red
EXIT markers: Gray X for stop loss, Orange X (TP) for take profit
Pivot points: Optional display of detected highs/lows (H/L markers)
Support/Resistance: Optional circles at pivot levels
Settings & Parameters
Basic Settings
Pivot Point Period (default: 2)
Controls sensitivity of pivot detection
Lower = more pivots detected (more responsive)
Higher = fewer pivots (more stable)
ATR Factor (default: 3)
Distance multiplier for trailing stop bands
Lower = tighter stops (more signals, earlier exits)
Higher = wider stops (fewer signals, longer trades)
ATR Period (default: 10)
Lookback period for volatility calculation
Affects how quickly bands adapt to volatility changes
Entry Configuration
Entry Mode: Select from Immediate/Aggressive/Balanced/Conservative
Determines how quickly the indicator generates signals after a trend break
Exit Configuration
Exit Method: Choose Trailing Stop, Take Profit %, or Both
Take Profit % (default: 2%)
Set your profit target as percentage of entry price
Adjust based on volatility and timeframe
Display Options
Show Buy/Sell Labels: Toggle entry signal labels
Show Exit Signals: Toggle exit markers
Show Break Candles: Toggle diamond markers on trend breaks
Show Pivot Points: Display H/L markers at pivot points
Show PP Center Line: Display the dynamic center line
Show Support/Resistance: Display circles at S/R levels
How to Use
For Swing Traders
Set Entry Mode to "Balanced" or "Conservative"
Use "Both" exit method with 3-5% take profit
Enable all visual elements for complete market picture
Trade only in direction of colored zones
For Day Traders
Set Entry Mode to "Aggressive" or "Immediate"
Use "Trailing Stop" exit method to catch intraday trends
Lower ATR Factor to 2-2.5 for tighter stops
Watch for quick signals in the first 2 hours of trading
For Position Traders
Use higher timeframes (Daily/Weekly)
Set Entry Mode to "Conservative"
Increase Take Profit % to 5-10%
Use larger ATR Factor (4-5) for wider stops
General Trading Rules
✅ DO: Enter on BUY/SELL signals (green/red backgrounds)
✅ DO: Exit on EXIT/TP markers
❌ DON'T: Enter during gray NO TRADE ZONE
❌ DON'T: Counter-trend trade against the colored zone
Alerts
Set up the following alerts for automated trading notifications:
Buy Signal: Triggers when long entry conditions are met
Sell Signal: Triggers when short entry conditions are met
Exit Long: Triggers when long position should be closed
Exit Short: Triggers when short position should be closed
Trailing Stop Broken: Triggers on initial trend change
Best Practices
Timeframe Selection
1-5 min: Scalping (use Immediate/Aggressive mode)
15-60 min: Day trading (use Aggressive/Balanced mode)
4H-Daily: Swing trading (use Balanced/Conservative mode)
Weekly: Position trading (use Conservative mode)
Risk Management
Always use the EXIT signals - don't hold through gray zones
Position size based on distance to trailing stop
Never risk more than 1-2% per trade
Consider wider stops on higher timeframes
Market Conditions
Trending markets: Use Aggressive mode, Trailing Stop exits
Ranging markets: Use Conservative mode, Take Profit exits
High volatility: Increase ATR Factor, use Both exits
Low volatility: Decrease ATR Factor for tighter stops
Technical Details
Calculation Method
Detect pivot highs and lows using specified period
Calculate weighted center line: (previous_center × 2 + new_pivot) / 3
Calculate bands: Upper = Center - (ATR Factor × ATR), Lower = Center + (ATR Factor × ATR)
Determine trend based on price position relative to bands
Trail stop line follows the active trend direction
Signal Logic
Entry signals generated based on selected confirmation mode
Position tracking maintains state from entry to exit
Exit signals calculated from both trailing stop and take profit levels
Trade zones update in real-time based on position state
Limitations & Considerations
Works best in trending markets; may generate false signals in tight ranges
Not a holy grail - should be used with proper risk management
Past performance does not guarantee future results
Recommended to backtest on your specific instrument and timeframe
Consider combining with volume analysis or other indicators for confirmation
Version History
v1.0: Initial release with entry signals and confirmation modes
v1.1: Added exit signals (trailing stop and take profit)
v1.2: Added color-coded trade zones (Long/Short/No Trade)
Credits
Original Pivot Point SuperTrend concept by LonesomeTheBlue
Modified with exit signals and trade zone visualization
License
Mozilla Public License 2.0
Example Setups
Conservative Swing Trading
Pivot Point Period: 2
ATR Factor: 3
ATR Period: 10
Entry Mode: Conservative
Exit Method: Both
Take Profit %: 4%
Aggressive Day Trading
Pivot Point Period: 2
ATR Factor: 2.5
ATR Period: 10
Entry Mode: Aggressive
Exit Method: Trailing Stop
Position Trading
Pivot Point Period: 3
ATR Factor: 4
ATR Period: 14
Entry Mode: Balanced
Exit Method: Both
Take Profit %: 8%
Disclaimer: This indicator is for educational purposes only. Trading involves substantial risk. Always do your own research and never trade with money you cannot afford to lose.

Liquidity Sweep Reentry ToolkitHere’s a clear breakdown of what your Liquidity Sweep Reentry Toolkit script does, and how you can use it on your charts:
🔎 Script Breakdown
1. Visual Controls (Inputs)
• : Master toggle to turn all visuals on/off.
• : Show labels when a liquidity sweep + ChoCh condition occurs.
• : Plot green/red triangles for bullish/bearish reentry signals.
• : Prevent multiple signals within the same swing.
• : Show HH/HL/LL/LH market structure letters.
• : Slider to adjust how dim the background of HH/HL/LL/LH labels appear.
2. Core Conditions
• Defines simple bullish () and bearish () candles.
• is a placeholder for your Change of Character logic.
3. Sweep Detection
• : Detects when price makes a new high compared to the last 5 bars.
• : Detects when price makes a new low compared to the last 5 bars.
4. Restriction Flags
• Tracks whether a sweep signal has already triggered in the current swing.
• Resets when sweeps end, so new signals can appear.
5. Composite Triggers
• : Fires when bullish candle + buy-side sweep + ChoCh condition align.
• : Fires when bearish candle + sell-side sweep + ChoCh condition align.
6. Visual Labels
• Gold labels mark “BS Sweep + ChoCh” or “SS Sweep + ChoCh” events.
• Green triangle below bar = bullish reentry.
• Red triangle above bar = bearish reentry.
• Blue HH/HL/LL/LH labels narrate market structure pivots, with adjustable transparency.
7. Alerts
• Alerts can be set for bullish or bearish sweep reentry triggers, so you get notified when conditions align.
📘 How to Use It
1. Apply to Chart
Add the script to your TradingView chart (works best on intraday timeframes like 5‑minute).
2. Configure Visuals
• Use the Visual Controls panel to toggle features on/off.
• Adjust the Label Transparency slider to dim or brighten the HH/HL/LL/LH labels.
3. Interpret Signals
• Gold labels show when a sweep + ChoCh condition occurs.
• Triangles mark potential reentry points (green = bullish, red = bearish).
• HH/HL/LL/LH labels narrate market structure shifts for clarity.
4. Set Alerts
• Use the built‑in alert conditions to get notified when bullish or bearish sweep reentry triggers fire.
👉 In short: this toolkit helps you spot liquidity sweeps, confirm with ChoCh, and visualize reentry signals, while also narrating market structure pivots. It’s modular, so you can toggle features depending on how much visual clutter you want.
🛠 Workflow Example
1. Setup
• Apply the script to your chart (e.g., 5‑minute S&P futures).
• In the indicator settings, decide which visuals you want:
• Turn on Sweep + ChoCh labels if you want to see gold tags narrating liquidity events.
• Keep Entry triangles on to highlight actionable reentry points.
• Adjust the Label Transparency slider so HH/HL/LL/LH structure labels are dim enough not to clutter.
2. Watch for Sweeps
• As price pushes above recent highs → a Buy‑side Sweep is detected.
• As price dips below recent lows → a Sell‑side Sweep is detected.
• If ChoCh logic is true at the same time, you’ll see a gold label (“BS Sweep + ChoCh” or “SS Sweep + ChoCh”).
3. Confirm Reentry
• If conditions align (bullish candle + buy‑side sweep + ChoCh), you’ll see a green triangle below the bar.
• If bearish candle + sell‑side sweep + ChoCh, you’ll see a red triangle above the bar.
• These triangles are your potential reentry triggers.
4. Narrate Market Structure
• HH/HL/LL/LH labels appear at pivots, giving you a running commentary of structure shifts.
• Example: HH → HL → HH shows bullish continuation; LH → LL → LH shows bearish pressure.
• Use the transparency slider to keep these labels subtle but visible.
5. Alerts
• Set alerts for “Bullish Sweep Reentry” or “Bearish Sweep Reentry” so you don’t miss signals even if you’re away from the screen.
📘 How to Use in Practice
• Intraday trading: On a 5‑minute chart, use the toolkit to spot liquidity grabs and confirm reentry points.
• Narration: The HH/HL/LL/LH labels help you keep track of structure without manually marking pivots.
• Decision making: Gold labels + triangles = potential trade setups. Structure labels = context for trend bias.
• Customization: Dim labels when you want a cleaner chart, brighten them when you’re focused on structure.
👉 In short: this script gives you a modular toolkit — sweeps, ChoCh confirmation, reentry signals, and structure narration — all adjustable so you can tailor the visuals to your workflow.
📈 Bullish Scenario Walkthrough
1. Market Context
• You’re watching the 5‑minute chart.
• Price has been consolidating near recent highs, building liquidity above.
2. Liquidity Sweep
• Price spikes above the prior swing high → the script detects a buy‑side sweep.
• A gold label appears: “BS Sweep + ChoCh” (if your ChoCh condition is true).
3. Change of Character (ChoCh)
• The candle closes bullish ().
• Your ChoCh condition confirms a structural shift.
• Together, sweep + ChoCh = potential reentry setup.
4. Reentry Trigger
• The script plots a green triangle below the bar.
• This marks a bullish sweep reentry signal: price grabbed liquidity and is now showing strength.
5. Market Structure Narration
• At the same time, the HH/HL labels update:
• The sweep bar prints a new HH.
• The next pivot low prints an HL.
• This narrates bullish continuation: HH → HL → HH.
6. Trade Decision
• You can use the green triangle as your entry cue.
• The HH/HL narration gives you confidence that structure supports the trade.
• Alerts can be set so you don’t miss the trigger.
7. Risk Management
• Stop placement: below the HL pivot or sweep low.
• Target: next liquidity pool above, or measured move.
🧭 How to Use This in Practice
• Gold label = liquidity event + ChoCh confirmation.
• Green triangle = actionable bullish reentry trigger.
• HH/HL narration = context for trend bias and trade management.
• Transparency slider = keep structure labels subtle so the chart stays clean.
📉 Bearish Scenario Walkthrough
1. Market Context
• You’re watching the 5‑minute chart.
• Price has been consolidating near recent lows, building liquidity underneath.
2. Liquidity Sweep
• Price spikes below the prior swing low → the script detects a sell‑side sweep.
• A gold label appears: “SS Sweep + ChoCh” (if your ChoCh condition is true).
3. Change of Character (ChoCh)
• The candle closes bearish ().
• Your ChoCh condition confirms a structural shift.
• Together, sweep + ChoCh = potential bearish reentry setup.
4. Reentry Trigger
• The script plots a red triangle above the bar.
• This marks a bearish sweep reentry signal: price grabbed liquidity below and is now showing weakness.
5. Market Structure Narration
• At the same time, the LH/LL labels update:
• The sweep bar prints a new LL.
• The next pivot high prints a LH.
• This narrates bearish continuation: LH → LL → LH.
6. Trade Decision
• You can use the red triangle as your entry cue.
• The LH/LL narration gives you confidence that structure supports the short.
• Alerts can be set so you don’t miss the trigger.
7. Risk Management
• Stop placement: above the LH pivot or sweep high.
• Target: next liquidity pool below, or measured move.
🧭 How to Use This in Practice
• Gold label = liquidity event + ChoCh confirmation.
• Red triangle = actionable bearish reentry trigger.
• LH/LL narration = context for trend bias and trade management.
• Transparency slider = keep structure labels subtle so the chart stays clean.

Chart Patterns [ActiveQuants]The Chart Patterns indicator is a comprehensive tool designed to automatically identify a variety of common chart patterns directly on your price chart. By detecting sequences of pivot highs and lows , this indicator helps traders spot potential trend continuations , reversals , and key market structures such as Double Tops and Double Bottoms . Enhance your technical analysis by quickly recognizing these formations as they emerge.
How It Works
The indicator operates in a two-stage process:
Pivot Point Detection: It first identifies significant swing highs and swing lows (pivot points) based on a user-defined Period . These pivots form the fundamental building blocks for pattern recognition.
Pattern Recognition: Using the sequence of these detected pivot points, the script then applies logical rules to identify the following patterns:
Lower Low (LL)
Lower Low & Lower High (LL & LH)
Higher High (HH)
Higher High & Higher Low (HH & HL)
Double Tops
Double Bottoms
Patterns are drawn on the chart with connecting lines and labeled for easy identification. Double Tops and Double Bottoms also feature a status system: " Active " while forming, " Confirmed " upon neckline breakout, or " Invalid " if specific conditions negate the pattern before confirmation.
█ KEY FEATURES
Comprehensive Pattern Detection: Identifies six distinct types of chart patterns, offering insights into both trend continuation and potential reversals.
Pivot-Based Analysis: Uses a robust method of identifying pivot highs and lows as the foundation for pattern formation.
Pattern Status for Double Tops/Bottoms:
- Active: A Double Top or Double Bottom pattern has formed its two peaks/troughs and the intervening neckline point, but the price has not yet broken beyond the neckline. The pattern is developing .
- Confirmed: The price has decisively closed beyond the neckline (below for Double Top, above for Double Bottom), signaling a potential entry or validation of the pattern.
- Invalid: An " Active " Double Top or Double Bottom pattern can be invalidated if, before a neckline breakout occurs, a new pivot point forms that negates the pattern’s structural integrity. For example, if a new pivot low forms above or at the neckline of an Active Double Top, the pattern is considered invalid because the market failed to break down and instead showed relative strength.
Customizable Visuals: Allows users to define colors for bullish and bearish patterns, line widths, and the visibility of pivot points.
Selective Pattern Display: Users can choose to display all patterns or filter by status (Active, Confirmed, Invalid) for Double Tops/Bottoms. Individual pattern types can also be toggled on or off.
Historical Analysis Control: The Show Last History (Bars) input allows users to specify how far back the indicator should plot patterns, optimizing performance and chart readability.
Clear Labeling: Patterns are clearly labeled on the chart, with Double Tops/Bottoms also showing " Top 1 ," " Top 2 ," or " Bottom 1 ," " Bottom 2 " labels.
█ PATTERNS DETECTED
Lower Low (LL): Indicates a potential bearish continuation or the start of a downtrend. Forms when price makes a lower low during an uptrend.
Lower Low & Lower High (LL & LH): A stronger confirmation of a bearish trend, where the market forms a lower low followed by a lower high .
Higher High (HH): Signals a potential bullish continuation or the start of an uptrend. Forms when price makes a higher high during a downtrend.
Higher High & Higher Low (HH & HL): A stronger confirmation of a bullish trend, where the market forms a higher high followed by a higher low .
Double Top: A bearish reversal pattern characterized by two distinct peaks at roughly the same price level, separated by a trough (neckline). Confirmation occurs when price breaks below the neckline.
Double Bottom: A bullish reversal pattern featuring two distinct troughs at roughly the same price level, separated by a peak (neckline). Confirmation occurs when price breaks above the neckline.
█ EXAMPLE: DOUBLE TOP INVALIDATION
Understanding how a Double Top or Double Bottom can be invalidated is crucial. Here's an example for a Double Top:
Formation: The indicator identifies two peaks (Top 1, Top 2) at a similar price level, with a corrective trough (Neckline Pivot P5) in between. The pattern is labeled " Double Top " and is in an " Active " state. ( Imagine points P4 and P6 are the two tops, and P5 is the low point of the neckline between them ).
Pre-Breakout Condition: The price action continues, but before it breaks decisively below the P5 neckline level, a new significant swing low (a new pivot low) forms.
Invalidation Check: The indicator checks the price level of this new pivot low. If this new pivot low occurs at a price equal to or higher than the P5 neckline level, the " Active " Double Top pattern is re-labeled as " Invalid Double Top ". ( See image below for a visual representation of this scenario )
In this example, the Double Top formed with Top 1 (P4) and Top 2 (P6). The neckline is at P5. Before price broke below P5, a new pivot low formed at the red circle. Since this new pivot low is above the P5 neckline, the Double Top is marked " Invalid ".
The logic is that the market failed to break the neckline support and instead established a higher low (or a low at the support level), suggesting that the immediate bearish pressure has waned, thus invalidating the bearish reversal implication of the Double Top before it could confirm. A similar logic applies to Double Bottoms (a new pivot high forming below or at the neckline before an upside breakout).
█ USER INPUTS
Visibility and Common Styling
- Show Last History (Bars):
Specifies the number of recent bars the indicator will analyze and plot patterns on.
Default: 3000 bars. Min: 10.
- Patterns:
Filters which patterns are displayed based on their status.
Options: All, Active, Confirmed, Invalid.
Default: All.
- Pattern Line Width:
Sets the thickness of the lines used to draw the patterns.
Default: 1. Min: 1, Max: 10.
- Bearish Color:
Color for bearish patterns (LL, LL & LH, Double Tops).
Default: Red.
- Bullish Color:
Color for bullish patterns (HH, HH & HL, Double Bottoms).
Default: Green.
Pivot Points
- Period:
The lookback period on either side of a bar to qualify it as a pivot high or low. Higher values detect more significant pivots.
Default: 10 bars. Min: 2.
- Show Pivot Highs:
Toggles the visibility of detected pivot high markers.
Default: Enabled.
- Show Pivot Lows:
Toggles the visibility of detected pivot low markers.
Default: Enabled.
- Pivot Highs Color:
Color for the pivot high markers.
Default: #ff5252 (Reddish).
- Pivot Lows Color:
Color for the pivot low markers.
Default: #089981 (Greenish).
Patterns (Toggles)
- Lower Low:
Enable/disable detection and display of Lower Low patterns.
Default: Enabled.
- Lower Low & Lower High:
Enable/disable detection and display of Lower Low & Lower High patterns.
Default: Enabled.
- Higher High:
Enable/disable detection and display of Higher High patterns.
Default: Enabled.
- Higher High & Higher Low:
Enable/disable detection and display of Higher High & Higher Low patterns.
Default: Enabled.
- Double Tops:
Enable/disable detection and display of Double Top patterns.
Default: Enabled.
- Double Bottoms:
Enable/disable detection and display of Double Bottom patterns.
Default: Enabled.
█ CONCLUSION
The Chart Patterns indicator is a versatile and powerful assistant for traders who utilize classical chart pattern analysis. By automating the detection of key formations and providing clear visual cues along with status updates for patterns like Double Tops and Bottoms, it allows traders to focus on strategy development and execution. With its customizable settings, it can be adapted to various instruments and timeframes, making it a valuable addition to any technical trader's toolkit.
█ IMPORTANT NOTES
⚠ Pivot Period Sensitivity: The Period setting for pivot detection is crucial. A shorter period will identify more frequent, smaller swings, while a longer period will focus on more significant turning points. Adjust this setting based on the asset's volatility, the timeframe you are trading and your trading style.
⚠ Confirmation is Key: While the indicator identifies patterns, always wait for pattern confirmation (e.g., neckline breaks for Double Tops/Bottoms) and consider other factors like volume and market context before making trading decisions.
⚠ Confirmed Bars for Detection: Patterns are identified based on confirmed pivot points, which means a pivot is recognized period bars after it has formed. Status updates for Double Tops/Bottoms (Active, Confirmed, Invalid) also occur on confirmed bars. This approach enhances reliability and reduces the likelihood of repainting based on intra-bar price fluctuations.
⚠ Not a Standalone System: Chart patterns provide valuable insights, but they should be used in conjunction with other technical analysis tools (e.g., trendlines, moving averages, oscillators) and a sound risk management plan.
⚠ Lagging Nature: By their very definition, chart patterns are lagging indicators as they require a sequence of price action and several pivot points to complete their formation.
█ RISK DISCLAIMER
Trading involves a substantial risk of loss and is not suitable for every investor. The information provided by the Chart Patterns indicator is for educational and informational purposes only. It should not be considered as financial advice or a recommendation to buy or sell any security. Chart patterns indicate potential price movements but do not guarantee future results. Always perform your own due diligence and consult with a qualified financial advisor before making any investment decisions. Past performance is not indicative of future results.
📈 Happy trading! 🚀
