Apex Edge – Super RSIThe Apex Edge – Super RSI is not your average RSI. This is an institutional-grade signal engine designed for serious traders who want confluence, control, and confidence — all wrapped into one visual powerhouse.
━━━━━━━━━━━━━━━━━━━━
KEY FEATURES
━━━━━━━━━━━━━━━━━━━━
✔ **RSI + Divergence Engine**
• Classic & Hidden Divergences (auto-detected)
• Labelled with shapes:
▲ Green Triangle – Buy Signal (strength-based size)
▼ Red Triangle – Sell Signal
◆ Green Diamond – Classic Bullish Divergence
◆ Red Diamond – Classic Bearish Divergence
● Green Circle – Hidden Bullish Divergence
● Red Circle – Hidden Bearish Divergence
Note - Users can edit symbol colours in settings for better clarity
✔ **Trap Detection System**
• Detects low-move, high-signal clusters (liquidity traps)
• Automatically suppresses signals for X bars after detection
• Trap zones shown with shaded background (optional)
✔ **Signal Scoring Logic**
• Each signal is scored 1–6 based on:
• RSI Threshold Break
• RSI Slope
• Divergence Detected
• Trap Avoidance
• Multi-Timeframe Confluence (optional)
• The plotted shape size reflects the strength of the entry signal
✔ **Multi-Timeframe Confluence (MTF)**
• Optional filter that uses HTF and VHTF RSI alignment
• Prevents countertrend signals
• MTF Bias shown on HUD panel
✔ **Always-On HUD Panel**
• Displays:
• Signal Type
• Signal Score
• Divergence Type
• RSI (LTF & HTF)
• Trap & Cooldown Status
• MTF Bias
• Volatility %
✔ **Alert Ready**
• Buy/Sell alerts
• Trap Detected alert
• Divergence alert with dynamic message
• Perfect for webhook integrations
━━━━━━━━━━━━━━━━━━━━
📘 HOW TO TRADE IT
━━━━━━━━━━━━━━━━━━━━
✅ **Buy Setup**
• Green triangle (▲) appears **below bar**
• RSI is oversold and rising
• HTF RSI agrees (optional)
• Signal score is 3+ for best confidence
• Avoid signals during cooldown zone
✅ **Sell Setup**
• Red triangle (▼) appears **above bar**
• RSI is overbought and falling
• HTF RSI agrees (optional)
• Signal score is 3+ for best confidence
✅ **Divergences**
• Use diamonds/circles to identify momentum shifts
• Strongest when aligned with score 4–6
❗**Trap Zones**
• When background is shaded, wait for cooldown
• Signals during traps are suppressed for safety
━━━━━━━━━━━━━━━━━━━━
📊 BEST USED WITH
━━━━━━━━━━━━━━━━━━━━
🔹 Apex Edge – Session Sweep Pro (to visualize liquidity levels)
🔹 Volume Profile or OBV (volume-based confirmation)
🔹 EMA Ribbon (for trend alignment)
🔹 Fair Value Gap indicator (smart money models)
━━━━━━━━━━━━━━━━━━━━
🧠 PRO TIPS
━━━━━━━━━━━━━━━━━━━━
• Use the HUD for decision confidence — if everything aligns, you’ve got an Apex-grade setup.
• Wait for candle close to confirm divergence-based entries.
• Score 5–6 = sniper entries. Score 1–2 = warning shots.
This indicator can be used alongside Apex Edge Session Sweep Pro for better visual clarity.
━━━━━━━━━━━━━━━━━━━━
© Apex Edge | All rights reserved.
3 days ago
Release Notes
Update - Added a toggle to show/hide HUD when using on smaller mobile devices so as not to clutter the screen.
Поиск скриптов по запросу "pro"

TTM Squeeze Momentum MTF [Cometreon]TTM Squeeze Momentum MTF combines the core logic of both the Squeeze Momentum by LazyBear and the TTM Squeeze by John Carter into a single, unified indicator. It offers a complete system to analyze the phase, direction, and strength of market movements.
Unlike the original versions, this indicator allows you to choose how to calculate the trend, select from 15 different types of moving averages, customize every parameter, and adapt the visual style to your trading preferences.
If you are looking for a powerful, flexible and highly configurable tool, this is the perfect choice for you.
🔷 New Features and Improvements
🟩 Unified System: Trend Detection + Visual Style
You can decide which logic to use for the trend via the "Show TTM Squeeze Trend" input:
✅ Enabled → Trend calculated using TTM Squeeze
❌ Disabled → Trend based on Squeeze Momentum
You can also customize the visual style of the indicator:
✅ Enable "Show Histogram" for a visual mode using Histogram, Area, or Column
❌ Disable it to display the classic LazyBear-style line
Everything updates automatically and dynamically based on your selection.
🟩 Full Customization
Every base parameter of the original indicator is now fully configurable: lengths, sources, moving average types, and more.
You can finally adapt the squeeze logic to your strategy — not the other way around.
🟩 Multi-MA Engine
Choose from 15 different Moving Averages for each part of the calculation:
SMA (Simple Moving Average)
EMA (Exponential Moving Average)
WMA (Weighted Moving Average)
RMA (Smoothed Moving Average)
HMA (Hull Moving Average)
JMA (Jurik Moving Average)
DEMA (Double Exponential Moving Average)
TEMA (Triple Exponential Moving Average)
LSMA (Least Squares Moving Average)
VWMA (Volume-Weighted Moving Average)
SMMA (Smoothed Moving Average)
KAMA (Kaufman’s Adaptive Moving Average)
ALMA (Arnaud Legoux Moving Average)
FRAMA (Fractal Adaptive Moving Average)
VIDYA (Variable Index Dynamic Average)
🟩 Dynamic Signal Line
Apply a moving average to the momentum for real-time cross signals, with full control over its length and type.
🟩 Multi-Timeframe & Multi-Ticker Support
You're no longer limited to the chart's current timeframe or ticker. Apply the squeeze to any symbol or timeframe without repainting.
🔷 Technical Details and Customizable Inputs
This indicator offers a fully modular structure with configurable parameters for every component:
1️⃣ Squeeze Momentum Settings – Choose the source, length, and type of moving average used to calculate the base momentum.
2️⃣ Trend Mode Selector – Toggle "Show TTM Squeeze Trend" to select the trend logic displayed on the chart:
✅ Enabled – Shows the trend based on TTM Squeeze (Bollinger Bands inside/outside Keltner Channel)
❌ Disabled – Displays the trend based on Squeeze Momentum logic
🔁 The moving average type for the Keltner Channel is handled automatically, so you don't need to select it manually, even if the custom input is disabled.
3️⃣ Signal Line – Toggle the Signal Line on the Squeeze Momentum. Select its length and MA type to generate visual cross signals.
4️⃣ Bollinger Bands – Configure the length, multiplier, source, and MA type used in the bands.
5️⃣ Keltner Channel – Adjust the length, multiplier, source, and MA type. You can also enable or disable the True Range option.
6️⃣ Advanced MA Parameters – Customize the parameters for advanced MAs (JMA, ALMA, FRAMA, VIDYA), including Phase, Power, Offset, Sigma, and Shift values.
7️⃣ Ticker & Input Source – Select the ticker and manage inputs for alternative chart types like Renko, Kagi, Line Break, and Point & Figure.
8️⃣ Style Settings – Choose how the squeeze is displayed:
Enable "Show Histogram" for Histogram, Area, or Column style
Disable it to show the classic LazyBear-style line
Use Reverse Color to invert line colors
Toggle Show Label to highlight Signal Line cross signals
Customize trend colors to suit your preferences
9️⃣ Multi-Timeframe Options - Timeframe – Use the squeeze on higher timeframes for stronger confirmation
🔟 Wait for Timeframe Closes -
✅ Enabled – Prevents multiple signals within the same candle
❌ Disabled – Displays the indicator smoothly without delay
🔧 Default Settings Reference
To replicate the default settings of the original indicators as they appear when first applied to the chart, use the following configurations:
🟩 TTM Squeeze (John Carter Style)
Squeeze
Length: 20
MA Type: SMA
Show TTM Squeeze Trend: Enabled
Bollinger Bands
Length: 20
Multiplier: 2.0
MA Type: SMA
Keltner Channel
Length: 20
Multiplier: 1.0
Use True Range: ON
MA Type: EMA
Style
Show Histogram: Enabled
Reverse Color: Enabled
🟩 Squeeze Momentum (LazyBear Style)
Squeeze
Length: 10
MA Type: SMA
Show TTM Squeeze Trend: Disabled
Bollinger Bands
Length: 20
Multiplier: 1.5
MA Type: SMA
Keltner Channel
Length: 10
Multiplier: 1.5
Use True Range: ON
MA Type: SMA
Style
Show Histogram: Disabled
Reverse Color: Disabled
⚠️ These values are intended as a starting point. The Cometreon indicator lets you fully customize every input to fit your trading style.
🔷 How to Use Squeeze Momentum Pro
🔍 Identifying Trends
Squeeze Momentum Pro supports two different methods for identifying the trend visually, each based on a distinct logic:
Squeeze Momentum Trend (LazyBear-style):
Displays 3 states based on the position of the Bollinger Bands relative to the Keltner Channel:
🔵 Blue = No Squeeze (BB outside KC and KC outside BB)
⚪️ White = Squeeze Active (BB fully inside KC)
⚫️ Gray = Neutral state (none of the above)
TTM Squeeze Trend (John Carter-style):
Calculates the difference in width between the Bollinger Bands and the Keltner Channel:
🟩 Green = BB width is greater than KC → potential expansion phase
🟥 Red = BB are tighter than KC → possible compression or pre-breakout
📈 Interpreting Signals
Depending on the active configuration, the indicator can provide various signals, including:
Trend color → Reflects the current compression/expansion state (based on selected mode)
Momentum value (above or below 0) → May indicate directional pressure
Signal Line cross → Can highlight momentum shifts
Color change in the momentum → May suggest a potential trend reversal
🛠 Integration with Other Tools
Squeeze Momentum Pro works well alongside other indicators to strengthen market context:
✅ Volume Profile / OBV – Helps confirm accumulation or distribution during squeezes
✅ RSI – Useful to detect divergence between momentum and price
✅ Moving Averages – Ideal for defining primary trend direction and filtering signals
☄️ If you find this indicator useful, leave a Boost to support its development!
Every piece of feedback helps improve the tool and deliver an even better trading experience.
🔥 Share your ideas or feature requests in the comments!

BIN Based Support and Resistance [SS]This indicator presents a version of an alternative way to determine support and resistance, using a method called "Bins".
Bins provide for a flexible and interesting way to determine support and resistance levels.
First off, let's discuss BINS:
Bins are ranges or containers into which your data points can be sorted. For example, if you're grouping ages, you might have bins like 0–18, 19–35, 36–50, and 51+. Any data point within these intervals gets placed in the corresponding bin.
Binning simplifies complex data sets by grouping values into categories. This is useful for such things as
Visualizing data in histograms or bar charts.
Reducing noise and highlighting trends.
This indicator groups the price action into 10 separate bins. It determines the Support / Resistance level by averaging the values in the Bins to find an iteration of the "central tendency" or average reoccurring value.
Pros and Cons
Since this is a different approach to support and resistance, I think its important to highlight some of the pros and advantages, but also be open about the cons.
First off the PROS
Bin Based Support and Resistance Levels dynamically adjust to ranges as opposed to hard / fast peaks and valleys. This makes them better at analyzing price action vs simply drawing lines at random peaks and valleys.
Because Bins are analyzing ALL PA within a period's max and min range, Bin Support and Resistance can actually be used similar to Volume profile, where you are able to identify a pseudo-POC, or areas where price tends to consolidate. Take a look at this example on SPY:
You can see these 2 SR lines are close together. This represents that this general price range is an area where price likes to accumulate/consolidate. You can see the SPY ended up coming back to this range and consolidating there for a bit.
This is a strength of using a BIN based approach to calculating support and resistance, because as indicated before, it looks at price action vs peaks and valleys.
As a tip, these areas are areas you want to wait for a break in one direction or the other.
The indicator provides for backtest results of the support and resistance lines, to see how many times certain areas acted as resistance or support. Because this is analyzing and distributing PA evenly throughout the period's max and min, the indicator can tell you which areas tend to have higher rejection zones and which have higher support zones.
Now the CONS
Because bin based SR take an average approach, the SR lines can sometimes be slightly broken before the ticker finds rejection:
To combat this, make sure there is confirmed support. How the indicator actually backtests these lines is by waiting to see if the ticker has 3 consecutive closes above the support line or below the resistance line. So these are things to be mindful of.
It doesn't consider pivots. Most support and resistance indicators either identify max and min peaks and valleys or use pivot points. Pivot points are a great way to identify peaks and valleys and thus by extension support and resistance. However, this is also somewhat of a strength, as using BINS forces the indicator to consider ALL price action and not just the extremes (highs and lows).
Can be slightly skewed in highly volatile environments. Any time there is a massive drop or rally, it can skew the indicator to give extreme ranges to both ends. For example, the Tariff news collapse on ES1!:
Owning to limitations in lookback length, sometimes the min and max range can be exceeded and other traditional areas of support / resistance is where a ticker will find support.
Using the indicator
Here are some basic use/functionalities of the indicator:
Selecting display of backtest results: You can select to have the backtest results shown in a table:
Or directly on the lines:
Inversely, you can toggle them off completely:
You can modify the lookback length. The suggested lookback length is between 250 to 500 candles on smaller timeframes. I also suggest 252 on daily timeframes (which represents 1 trading year).
And that's the indicator!
It is very easy to use, so you should pick it up in no time!
Enjoy and as always, 🚀🚀 safe trades! 🚀🚀

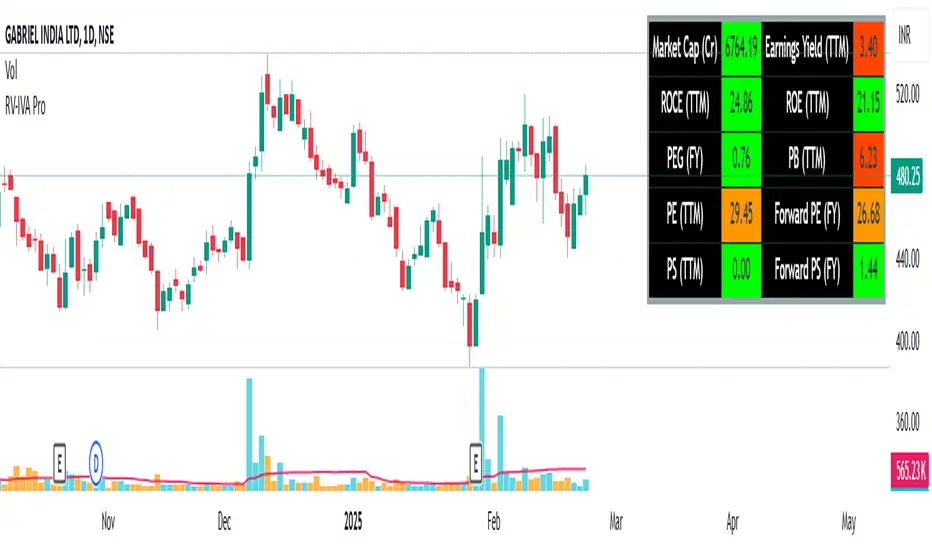
RV- Intrinsic Value AnalyzerWhy These Metrics Matter in IVA Pro (Intrinsic Value Analyzer)?
The IVA Pro consolidates key valuation, profitability, and efficiency metrics into a single, easy-to-read table. These indicators provide a comprehensive view of a company’s financial health, helping traders and investors make informed decisions based on growth potential, profitability, and valuation. The color-coded signals (green for strong, orange for moderate, and red for weak values) simplify fundamental analysis and enable quick comparisons across different stocks.
Key Fundamental Parameters in IVA Pro
Market Capitalization (Market Cap): Measures a company's total market value, helping assess size, stability, and growth potential.
Earnings Yield (TTM): Indicates how much profit a company generates relative to its stock price—useful for comparing against bonds and other assets.
Return on Capital Employed (ROCE): Shows how efficiently a company generates profits using its capital—a key profitability metric.
Return on Equity (ROE): Evaluates how well a company uses shareholder funds to generate earnings.
Price-to-Earnings Ratio (PE): Helps determine whether a stock is overvalued or undervalued based on earnings.
Price-to-Book Ratio (PB): Assesses if a stock is trading above or below its net asset value—useful for asset-heavy industries.
Price-to-Sales Ratio (PS): Helps evaluate revenue potential, particularly for growth-stage companies.
PEG Ratio: Enhances PE ratio by factoring in earnings growth—ideal for identifying undervalued growth stocks.
Forward PE Ratio: Provides a future-looking valuation based on projected earnings.
Forward PS Ratio: Helps evaluate future revenue potential and overall stock valuation.
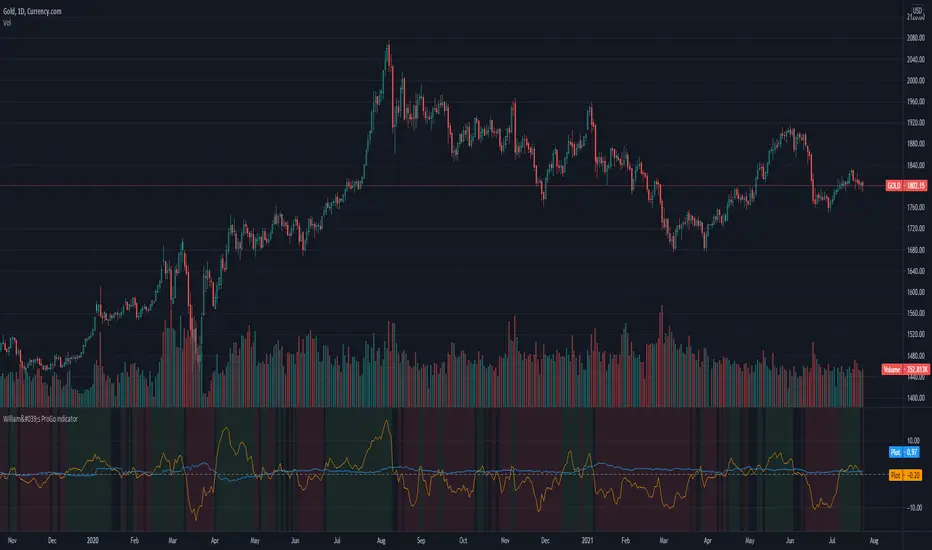
CMT's ProGo indicatorThis is an experiment. I've never traded with it and won't tell you to. The nuances of how effective this is have yet to be seen.
Shoutout to @BillionaireLau, who very recently posted Larry William's original ProGo indicator. I hypothesized that a few minor changes to values and operations would allow for greater utility and responsiveness. I believe this has been achieved. What we're looking at here appears to offer a new means of spotting divergences. Have fun. To quote BillionaireLau regarding the nature of this indicator:
"ProGo, created by Larry William, (earlier than 2002), is a 2 line graph using daily data.
1. Professional Line (color orange) is a professional Accumulation/Distribution line is constructed by using the change from today's open to today's close.
2. The Public Line (color blue) is done by creating a public accumulation/distribution line that shows the change from yesterdays close to today's open.
The graph is an index of the previous close to open +/- values (public) and then taking a 14 day average which is plotted against a 14 day average of the +/- values of the open to close(pro).
Background color:
Green colored area is where "pro" line crossover line, and the "pro" line is also positive."

William's ProGo indicatorProGo, created by Larry William, (earlier than 2002), is a 2 line graph using daily data.
1. Professional Line (color orange) is a professional Accumulation/Distribution line is constructed by using the change from today's open to today's close.
2. The Public Line (color blue) is done by creating a public accumulation/distribution line that shows the change from yesterdays close to today's open.
The graph is an index of the previous close to open +/- values (public) and then taking a 14 day average which is plotted against a 14 day average of the +/- values of the open to close(pro).
Background color:
Green colored area is where "pro" line crossover "amatuers" line, and the "pro" line is also positive.
Created this for literature review.
3x SuperTrend Strategy (Mel0nTek) V1This is a triple SuperTrend based strategy for lower time frame trades such as day trades and scalping. I have not seen many strategies that combine multiple SuperTrends so I thought I would publish this one since I put it together and have been quite happy with the results. I have found through testing that the best results are on currency exchange markets such as Crypto or Forex on 1-15 min time frames.
The core idea was inspired by a youtube video put out by Trade Pro:
"Trade Pro - HIGHEST PROFIT Triple Supertrend Trading Strategy Proven 100 Trade Results"
I went ahead and set the defaults to the ones he uses in his video for anyone who wants to try a configuration similar to his. They work pretty well in general, however the EMA, SuperTrend ATR multipliers, and P/L ratio can be tuned/optimized to fit the timeframe/market desired. The video is quite good but not a required watch as I will explain below.
The 200EMA is used as a medium-term trend direction indicator.
- Price closing consistently above the 200EMA means that only long positions should be entered.
- Price closing consistently below 200EMA means that only short positions should be entered.
The 3 SuperTrend indicators should be used as direction confirmation for entries. Typically, price above SuperTrend indicates bullish movement, while price below SuperTrend indicates Bearish movement. However by itself, it is not a great indication to enter/exit positions in my experience. By combining 3 of them with slightly longer periods and increased ATR multipliers, we can get much stronger confirmation of trend direction/strength.
The way they are used in this strategy is such that:
- We only want to enter a position if at least 2 out of 3 SuperTrends are on our side.
- 3/3 SuperTrends on our side is the best case, since we are taking trades WITH momentum/price strength.
- The second farthest SuperTrend from entry price is used as a Stop Loss
SuperTrend being on our side is not the only requirement for an entry however. The probability of success is increased with SuperTrend, and a longer EMA on our side, but we want to be sure that we aren't getting in too late/after the movement has already happened.
So we use Stoch RSI to pick our entries where price is oversold/overbought and reversing. That means the Stoch RSI is above 80, or below 20, and our indication to enter the trade is when the 2 lines cross/begin reversing direction.
So with trend direction on our side, we can get really good entries at these oversold/overbought extremes, especially as it's reversing (Stoch RSI K and D are crossing). This allows us to use the SuperTrend as a support/stop loss on our entry since price should be above it.
Then we just target 1.5x our max loss so that even if we only win 50% of the time, we still make a profit.
The explicit rules of this strategy are as follows:
=== Rules ===
long only
- price above EMA200
short only
- price below EMA200
Stop Loss = 2nd SuperTrend line above (short) or below(long) entry candle
Profit = 1.5x SL/risk (Profit Ratio x Max Loss)
=== Entry Setup ===
LONG
- Stoch RSI below 20, cross up
- at least 2 SuperTrend lines below close
SHORT
- Stoch RSI above 80, cross down
- at least 2 SuperTrend lines above close
P.S. Special thanks to Trade Pro for producing so many quality videos, putting strategy claims to the test, and providing me with so many good ideas I apply to my own strategies.

Volume Profile Free Ultra SLI (100 Levels Value Area VWAP) - RRBVolume Profile Free Ultra SLI by RagingRocketBull 2019
Version 1.0
This indicator calculates Volume Profile for a given range and shows it as a histogram consisting of 100 horizontal bars.
This is basically the MAX SLI version with +50 more Pinescript v4 line objects added as levels.
It can also show Point of Control (POC), Developing POC, Value Area/VWAP StdDev High/Low as dynamically moving levels.
Free accounts can't access Standard TradingView Volume Profile, hence this indicator.
There are several versions: Free Pro, Free MAX SLI, Free Ultra SLI, Free History. This is the Free Ultra SLI version. The Differences are listed below:
- Free Pro: 25 levels, +Developing POC, Value Area/VWAP High/Low Levels, Above/Below Area Dimming
- Free MAX SLI: 50 levels, 2x SLI modes for Buy/Sell or even higher res 150 levels
- Free Ultra SLI: 100 levels, packed to the limit, 2x SLI modes for Buy/Sell or even higher res 300 levels
- Free History: auto highest/lowest, historic poc/va levels for each session
Features:
- High-Res Volume Profile with up to 100 levels (line implementation)
- 2x SLI modes for even higher res: 300 levels with 3x vertical SLI, 100 buy/sell levels with 2x horiz SLI
- Calculate Volume Profile on full history
- POC, Developing POC Levels
- Buy/Sell/Total volume modes
- Side Cover
- Value Area, VAH/VAL dynamic levels
- VWAP High/Low dynamic levels with Source, Length, StdDev as params
- Show/Hide all levels
- Dim Non Value Area Zones
- Custom Range with Highlighting
- 3 Anchor points for Volume Profile
- Flip Levels Horizontally
- Adjustable width, offset and spacing of levels
- Custom Color for POC/VA/VWAP levels, Transparency for buy/sell levels
WARNING:
- Compilation Time: 1 min 20 sec
Usage:
- specify max_level/min_level/spacing (required)
- select range (start_bar, range length), confirm with range highlighting
- select volume type: Buy/Sell/Total
- select mode Value Area/VWAP to show corresponding levels
- flip/select anchor point to position the buy/sell levels
- use Horiz Buy/Sell SLI mode with 100 or Vertical SLI with 300 levels if needed
- use POC/Developing POC/VA/VWAP High/Low as S/R levels. Usually daily values from 1-3 days back are used as levels for the current day.
SLI:
use SLI modes to extend the functionality of the indicator:
- Horiz Buy/Sell 2x SLI lets you view 100 Buy/Sell Levels at the same time
- Vertical Max_Vol 3x SLI lets you increase the resolution to 300 levels
- you need at least 2 instances of the indicator attached to the same chart for SLI to work
1) Enable Horiz SLI:
- attach 2 indicator instances to the chart
- make sure all instances have the same min_level/max_level/range/spacing settings
- select volume type for each instance: you can have a buy/sell or buy/total or sell/total SLI. Make sure your buy volume instance is the last attached to be displayed on top of sell/total instances without overlapping.
- set buy_sell_sli_mode to true for indicator instances with volume_type = buy/sell, for type total this is optional.
- this basically tells the script to calculate % lengths based on total volume instead of individual buy/sell volumes and use ext offset for sell levels
- Sell Offset is calculated relative to Buy Offset to stack/extend sell after buy. Buy Offset = Zero - Buy Length. Sell Offset = Buy Offset - Sell Length = Zero - Buy Length - Sell Length
- there are no master/slave instances in this mode, all indicators are equal, poc/va levels are not affected and can work independently, i.e. one instance can show va levels, another - vwap.
2) Enable Vertical SLI:
- attach the first instance and evaluate the full range to roughly determine where is the highest max_vol/poc level i.e. 0..20000, poc is in the bottom half (third, middle etc) or
- add more instances and split the full vertical range between them, i.e. set min_level/max_level of each corresponding instance to 0..10000, 10000..20000 etc
- make sure all instances have the same range/spacing settings
- an instance with a subrange containing the poc level of the full range is now your master instance (bottom half). All other instances are slaves, their levels will be calculated based on the max_vol/poc of the master instance instead of local values
- set show_max_vol_sli to true for the master instance. for slave instances this is optional and can be used to check if master/slave max_vol values match and slave can read the master's value. This simply plots the max_vol value
- you can also attach all instances and set show_max_vol_sli to true in all of them - the instance with the largest max_vol should become the master
Auto/Manual Ext Max_Vol Modes:
- for auto vertical max_vol SLI mode set max_vol_sli_src in all slave instances to the max_vol of the master indicator: "VolumeProfileFree_MAX_RRB: Max Volume for Vertical SLI Mode". It can be tricky with 2+ instances
- in case auto SLI mode doesn't work - assign max_vol_sli_ext in all slave instances the max_vol value of the master indicator manually and repeat on each change
- manual override max_vol_sli_ext has higher priority than auto max_vol_sli_src when both values are assigned, when they are 0 and close respectively - SLI is disabled
- master/slave max_vol values must match on each bar at all times to maintain proper level scale, otherwise slave's levels will look larger than they should relative to the master's levels.
- Max_vol (red) is the last param in the long list of indicator outputs
- the only true max_vol/poc in this SLI mode is the master's max_vol/poc. All poc/va levels in slaves will be irrelevant and are disabled automatically. Slaves can only show VWAP levels.
- VA Levels of the master instance in this SLI mode are calculated based on the subrange, not the whole range and may be inaccurate. Cross check with the full range.
WARNING!
- auto mode max_vol_sli_src is experimental and may not work as expected
- you can only assign auto mode max_vol_sli_src = max_vol once due to some bug with unhandled exception/buffer overflow in Tradingview. Seems that you can clear the value only by removing the indicator instance
- sometimes you may see a "study in error state" error when attempting to set it back to close. Remove indicator/Reload chart and start from scratch
- volume profile may not finish to redraw and freeze in an ugly shape after an UI parameter change when max_vol_sli_src is assigned a max_vol value. Assign it to close - VP should redraw properly, but it may not clear the assigned max_vol value
- you can't seem to be able to assign a proper auto max_vol value to the 3rd slave instance
- 2x Vertical SLI works and tested in both auto/manual, 3x SLI - only manual seems to work (you can have a mixed mode: 2nd instance - auto, 3rd - manual)
Notes:
- This code uses Pinescript v3 compatibility framework
- This code is 20x-30x faster (main for cycle is removed) especially on lower tfs with long history - only 4-5 sec load/redraw time vs 30-60 sec of the old Pro versions
- Instead of repeatedly calculating the total sum of volumes for the whole range on each bar, vol sums are now increased on each bar and passed to the next in the range making it a per range vs per bar calculation that reduces time dramatically
- 100 levels consist of 50 main plot levels and 50 line objects used as alternate levels, differences are:
- line objects are always shown on top of other objects, such as plot levels, zero line and side cover, it's not possible to cover/move them below.
- all line objects have variable lengths, use actual x,y coords and don't need side cover, while all plot levels have a fixed length of 100 bars, use offset and require cover.
- all key properties of line objects, such as x,y coords, color can be modified, objects can be moved/deleted, while this is not possible for static plot levels.
- large width values cause line objects to expand only up/down from center while their length remains the same and stays within the level's start/end points similar to an area style.
- large width values make plot levels expand in all directions (both h/v), beyond level start/end points, sometimes overlapping zero line, making them an inaccurate % length representation, as opposed to line objects/plot levels with area style.
- large width values translate into different widths on screen for line objects and plot levels.
- you can't compensate for this unwanted horiz width expansion of plot levels because width uses its own units, that don't translate into bars/pixels.
- line objects are visible only when num_levels > 50, plot levels are used otherwise
- Since line objects are lines, plot levels also use style line because other style implementations will break the symmetry/spacing between levels.
- if you don't see a volume profile check range settings: min_level/max_level and spacing, set spacing to 0 (or adjust accordingly based on the symbol's precision, i.e. 0.00001)
- you can view either of Buy/Sell/Total volumes, but you can't display Buy/Sell levels at the same time using a single instance (this would 2x reduce the number of levels). Use 2 indicator instances in horiz buy/sell sli mode for that.
- Volume Profile/Value Area are calculated for a given range and updated on each bar. Each level has a fixed length. Offsets control visible level parts. Side Cover hides the invisible parts.
- Custom Color for POC/VA/VWAP levels - UI Style color/transparency can only change shape's color and doesn't affect textcolor, hence this additional option
- Custom Width - UI Style supports only width <= 4, hence this additional option
- POC is visible in both modes. In VWAP mode Developing POC becomes VWAP, VA High and Low => VWAP High and Low correspondingly to minimize the number of plot outputs
- You can't change buy/sell level colors from input (only transparency) - this requires 2x plot outputs => 2x reduces the number of levels to fit the max 64 limit. That's why 2 additional plots are used to dim the non Value Area zones
- You can change level transparency of line objects. Due to Pinescript limitations, only discrete values are supported.
- Inverse transp correlation creates the necessary illusion of "covered" line objects, although they are shown on top of the cover all the time
- If custom lines_transp is set the illusion will break because transp range can't be skewed easily (i.e. transp 0..100 is always mapped to 100..0 and can't be mapped to 50..0)
- transparency can applied to lines dynamically but nva top zone can't be completely removed because plot/mixed type of levels are still used when num_levels < 50 and require cover
- transparency can't be applied to plot levels dynamically from script this can be done only once from UI, and you can't change plot color for the past length bars
- All buy/sell volume lengths are calculated as % of a fixed base width = 100 bars (100%). You can't set show_last from input to change it
- Range selection/Anchoring is not accurate on charts with time gaps since you can only anchor from a point in the future and measure distance in time periods, not actual bars, and there's no way of knowing the number of future gaps in advance.
- Adjust Width for Log Scale mode now also works on high precision charts with small prices (i.e. 0.00001)
- in Adjust Width for Log Scale mode Level1 width extremes can be capped using max deviation (when level1 = 0, shift = 0 width becomes infinite)
- There's no such thing as buy/sell volume, there's just volume, but for the purposes of the Volume Profile method, assume: bull candle = buy volume, bear candle = sell volume
P.S. I am your grandfather, Luke! Now, join the Dark Side in your father's steps or be destroyed! Once more the Sith will rule the Galaxy, and we shall have peace...

VDUB_BINARY_PRO_3NEW UPDATED BINARY PRO 3_V2 HERE -
VDUB_BINARY_PRO_3_V1 UPGRADE from binary PRO 1 / testing/ / experimental / Trade the curves / Highs -Lows / Band cross over/ Testing using heikin ashi
//Linear Regression Curve
//Centre band
//CM_Gann Swing HighLow V2/Modified////// MA input NOT WORKING ! - I broke it :s
//Vdub_Tetris_V2/ Modified
*Update Tip /Optional
Set the centre band to '34 to run centre line

Advanced Scalping Navigator free by S B PrasadAdvanced Scalping Navigator Lite • Features
by S B Prasad
Advanced Scalping Navigator Lite is a powerful multi-factor scalping and intraday indicator designed to generate high-probability BUY and SELL signals using trend, momentum, volatility, and smart-money concepts.
This FREE version retains the complete core signal engine while limiting certain premium visual and channel features.
🚀 Core Features (Included in Lite Version)
✅ High-Accuracy BUY & SELL Signals
Signals are generated only when multiple technical and structural conditions align, including:
ATR-based trend direction & strength
EMA trend bias
MACD momentum
RSI confirmation
VWAP institutional bias
Ribbon & Hull MA filters
Higher-timeframe (HTF) trend confirmation
Smart-money liquidity sweep validation
Supply & demand zone filtering
Session-based trading filter
✅ Smart-Money Liquidity Sweeps
Detects equal highs/lows and stop-hunt behavior to identify institutional accumulation or distribution before issuing signals.
✅ Supply & Demand Zones
Automatically plots demand and supply zones using pivot-based market structure to improve trade location quality.
✅ Higher-Timeframe (HTF) Confirmation
Filters trades in the direction of the dominant higher-timeframe trend for better probability alignment.
✅ Session Filter (Market Timing Control)
Limits signals to selected market sessions:
Indian Market
London Session
New York Session
✅ Multi-Factor Confirmation Engine
Combines EMA, MACD, RSI, VWAP, Ribbon, and HMA into a weighted factor score to avoid low-quality trades.
✅ Real-Time Dashboard Panel
On-chart dashboard displaying:
Trend direction
Trend strength
Factor alignment score
HTF bias
Zone context
Signal state
Session status
🔒 Features Limited or Disabled in Lite Version
The following premium visuals and channels are not available in the FREE version:
❌ ATR trendline (dynamic support / resistance)
❌ ATR trendline strength coloring
❌ Full ATR channel (upper / average / lower)
❌ Channel fills & premium visual layers
❌ Pivot ATR trend channel visuals
❌ Enhanced trend-zone background fills
🎯 Best For
Intraday traders
Scalpers
Index & stock traders
Futures and options traders
Traders who prefer clean charts with powerful signals
📣 Join Our Telegram (Updates & PRO Access)
👉 Telegram: t.me
💬 For updates, support & PRO version access, join our Telegram.
⚠️ Disclaimer
This indicator is for educational and informational purposes only.
It does not constitute financial advice.
Trading involves risk. Always use proper risk management.

Donchian Channels (Multi Time Frame) x 3)📊 MTF Donchian Channels Pro — Triple Timeframe Structure
MTF Donchian Channels Pro is a professional-grade multi-timeframe market structure indicator designed to help traders visualize trend, momentum, and execution zones on a single chart.
This tool allows you to plot up to three independent Donchian Channels, each with its own configurable timeframe and lookback length, giving you instant insight into multi-timeframe alignment and breakout conditions.
By stacking higher, medium, and lower timeframe channels, traders can eliminate noise, improve timing, and trade in the direction of dominant market structure.
🔧 Key Features
✅ Up to 3 independent Donchian Channels
✅ Individual timeframe selection for each channel
✅ Adjustable lookback length per channel
✅ Optional show/hide per channel
✅ Midline (basis) for structure reference
✅ Clean visual fills for fast interpretation
✅ Works on all markets and timeframes
🎯 How to Use
This indicator is designed to support multi-timeframe trading systems.
Example configuration:
• Channel 1 → Lower timeframe (Execution)
• Channel 2 → Medium timeframe (Momentum)
• Channel 3 → Higher timeframe (Structure)
Long Bias Example
Price above higher timeframe channel
Pullback into mid timeframe range
Breakout on lower timeframe channel
Short Bias Example
Price below higher timeframe channel
Retrace into structure
Breakdown on execution timeframe
When all channels align, probability increases.
📈 Best Use Cases
✔ Futures Scalping
✔ Options Day Trading
✔ Forex & Crypto
✔ Swing Trading
✔ Prop Firm Evaluations
✔ Trend-Following Systems
⚠️ Risk Disclaimer
This indicator is a market structure visualization tool and does not provide financial advice. Always use proper risk management and confirm with your own strategy.

Adaptive Regime Master: The Dual-Engine FrameworkAdaptive Regime Master: The Dual-Engine Framework
Overview
The Adaptive Regime Master: The Dual-Engine Framework is a sophisticated technical analysis tool designed to solve the "Indicator Paradox"—the reality that trend-following tools fail in sideways markets, and mean-reversion tools fail in strong trends.
Instead of forcing a single mathematical model onto an ever-changing market, this framework utilizes a Master Switch logic. It continuously analyzes market volatility and directional strength to dynamically toggle between two specialized trading engines. By identifying the current "Market Regime," the indicator automatically reconfigures its visual interface and signal logic to match the environment.
The Dual-Engine Architecture
The framework operates on a logic-gate system powered by the Average Directional Index (ADX) :
1. The Momentum Engine (Trendy Regime):
Activation: Triggered when ADX rises above the 25 threshold, signaling a confirmed trend.
Logic: Utilizes a combination of Exponential Moving Averages (EMA) for trend-following and MACD Histogram for momentum confirmation.
Visuals: The chart de-clutters to show only the EMA trend-line and momentum-based signals.
2. The Mean-Reversion Engine (Choppy Regime):
Activation: Triggered when ADX falls below 25, signaling a range-bound or consolidating market.
Logic: Switches to Bollinger Bands and the Relative Strength Index (RSI) to identify overextended price action at the range extremes.
Visuals: The EMA disappears, and the chart displays Bollinger Bands to help users visualize the "value area" and potential reversal zones.
Key Features
Alternating Signal Logic: Built-in state management ensures that signals always alternate (Buy → Sell → Buy). This prevents "signal clustering" and provides a clean, actionable roadmap for the user.
Dynamic ATR-Based Protection: The indicator calculates Stop Loss (SL) and Take Profit (TP) levels using the Average True Range (ATR) . Crucially, the multipliers adjust based on the regime: wider stops for volatile trends and tighter stops for quiet ranges.
Intrabar Execution Guard: To prevent "false exits," the framework includes a calculation safeguard that prevents SL/TP triggers on the same candle as the entry, ensuring the trade has room to breathe.
Real-Time Regime Dashboard: An on-chart table provides an immediate summary of the current ADX value, the active engine mode, and the current position status.
Visual Regime Indicator: Background color changes dynamically—Blue for Trend Mode, Orange for Range Mode.
Comprehensive Alert System: Built-in alerts for Long Entry, Short Entry, TP Hit, and SL Hit events.
How to Use
Identify the Background: A Blue background indicates the Momentum Engine is active; an Orange background indicates the Mean-Reversion Engine is active.
Execution: Follow the BUY and SELL labels. The framework handles the logic of whether it is a "breakout" or a "reversal" based on the active engine.
Risk Management: Once a signal appears, Red (SL) and Lime (TP) crosses will appear on the chart. These are your mathematical boundaries for the trade.
The Exit: The position is considered closed when price hits the SL/TP markers (indicated by orange/yellow crosses) or when an opposing signal is generated.
Monitor the Dashboard: Use the top-right table to track the current regime, ADX value, active mode, and position status in real-time.
Input Parameters
ADX Length: Period for ADX calculation (default: 14)
ADX Smoothing: Smoothing period for ADX (default: 14)
ADX Trend Threshold: Threshold to distinguish trend from range (default: 25)
EMA Length: Period for the Exponential Moving Average (default: 20)
BB Length: Period for Bollinger Bands (default: 20)
BB Multiplier: Standard deviation multiplier for Bollinger Bands (default: 2.0)
RSI Length: Period for RSI calculation (default: 14)
ATR Length: Period for Average True Range (default: 14)
ATR Mult (Trend): ATR multiplier for stop loss in trend mode (default: 1.5)
ATR Mult (Range): ATR multiplier for stop loss in range mode (default: 0.8)
Min SL % (of price): Minimum stop loss as percentage of price (default: 0.5%)
Pros and Cons
Pros:
Versatility: Performs in all market conditions, reducing the need for multiple separate indicators.
Reduced Fakeouts: Filters out "trend signals" during flat markets and "reversal signals" during parabolic moves.
Visual Clarity: Only shows the indicators relevant to the current market state, reducing cognitive load and chart clutter.
Automated Risk-Reward: Automatically plots 1:2 Risk-Reward levels based on current volatility.
Professional-Grade Logic: Implements state management to prevent signal conflicts and ensure clean alternating entries.
Multi-Timeframe Compatibility: Works on any timeframe, though optimized for intraday and swing trading.
Cons:
Lagging Nature: Like all ADX-based systems, there is a slight lag when the market transitions from a range to a trend.
Threshold Sensitivity: The default ADX threshold of 25 may need tuning for extremely low-volatility assets or different timeframes.
Not a "Holy Grail": While it filters many bad trades, sudden fundamental news or black swan events can still bypass technical logic.
Requires Discipline: Users must follow the signals and respect the SL/TP levels for the framework to be effective.
Learning Curve: New users may need time to understand the regime-switching concept and trust the automated logic.
Why Use This Framework?
Most traders lose money because they apply the wrong tool to the wrong market. They use RSI to "sell the top" of a breakout, or use Moving Averages to "buy the dip" in a sideways grind. The Adaptive Regime Master removes the emotional guesswork by mathematically defining the market state and forcing the strategy to adapt.
This is a professional-grade framework for traders who value:
Logic over emotion
Discipline over impulse
Chart cleanliness over indicator overload
Adaptive systems over static strategies
Whether you're a scalper, day trader, or swing trader, this framework provides a systematic approach to reading market conditions and executing high-probability setups with predefined risk management.
Best Practices
Never forget to adjust Stop Loss and Take Profit level related to the interval you (will) use. (Default parameters are optimized for 60m)
Always backtest the indicator on your specific asset and timeframe before live trading
Adjust the ADX threshold based on the volatility characteristics of your market
Use the framework in conjunction with proper position sizing and account risk management
Pay attention to the regime dashboard—avoid forcing trades when the market is transitioning between regimes
Set up alerts for all signal types to avoid missing opportunities
Consider fundamental analysis and news events alongside technical signals
Detailed Disclaimer
FINANCIAL RISK WARNING:
Trading foreign exchange, stocks, indices, cryptocurrencies, and commodities on margin carries a high level of risk and may not be suitable for all investors. The high degree of leverage can work against you as well as for you. Before deciding to invest in any financial instrument, you should carefully consider your investment objectives, level of experience, and risk appetite. The possibility exists that you could sustain a loss of some or all of your initial investment; therefore, you should not invest money that you cannot afford to lose.
NO INVESTMENT ADVICE:
The "Adaptive Regime Master: The Dual-Engine Framework" is an educational tool designed to assist in technical analysis. It does not constitute investment advice, financial advice, trading advice, or a recommendation to buy or sell any security or financial instrument. All content provided by this indicator is for informational and educational purposes only.
PAST PERFORMANCE:
Past performance is not indicative of future results. Hypothetical or simulated performance results have certain limitations. Unlike an actual performance record, simulated results do not represent actual trading and may not be impacted by brokerage and other slippage fees. Simulated trading programs in general are also subject to the fact that they are designed with the benefit of hindsight.
NO GUARANTEE:
No representation is being made that any account will or is likely to achieve profits or losses similar to those shown in any backtests or forward tests. The author and developers of this indicator make no warranties, expressed or implied, regarding the accuracy, completeness, or reliability of the information provided.
USER RESPONSIBILITY:
Users should perform their own due diligence and test the logic on a demo or paper trading account before applying it to live capital. You are solely responsible for your own investment and trading decisions. The author and developers assume no responsibility for any financial losses, damages, or adverse consequences incurred through the use of this tool.
ACCEPTANCE OF TERMS:
Use of this indicator constitutes acceptance of these terms and acknowledgment that you understand the risks involved in trading financial instruments.
REGULATORY NOTICE:
This indicator is not affiliated with, endorsed by, or approved by any financial regulatory authority. Always consult with a licensed financial advisor before making investment decisions.

Reversal Trend by S B PrasadReversal Trend by S B Prasad (Reversal Pro v3.0)
📝 TradingView Publish Description
Reversal Trend by S B Prasad – Reversal Pro v3.0 is a high-precision, non-repainting reversal detection system designed to identify major market turning points in real time.
This indicator combines:
Adaptive ZigZag logic
ATR + Percentage-based volatility filtering
EMA trend structure
Optional early preview signals
to deliver reliable bullish and bearish reversal signals across all markets and timeframes.
🚀 Key Features
✅ 1. Non-Repainting Confirmed Reversals
Confirmed reversal signals are generated only after price has moved beyond a dynamic volatility-adjusted threshold.
Once plotted, these signals never repaint.
🔍 2. Adaptive Volatility Threshold
Reversal detection automatically adjusts to market conditions using:
ATR (Average True Range)
Percentage price movement
Absolute minimum reversal distance
This ensures:
Fewer false signals in choppy markets
Faster detection in trending markets
⚙️ 3. Sensitivity Presets + Custom Mode
Choose from built-in presets:
Very High
High
Medium
Low
Very Low
Or use Custom Mode to fine-tune:
ATR Multiplier
Percentage Reversal
Absolute Reversal
ATR Length
📈 4. EMA Trend Filter
Integrated triple-EMA structure (9 / 14 / 21):
Identifies bullish, bearish, and neutral trend states
Helps align reversals with dominant trend direction
Reduces counter-trend false signals
👀 5. Preview Mode (Early Reversal Detection)
Optional preview signals highlight potential upcoming reversals before full confirmation.
Signal Modes:
Confirmed Only
Confirmed + Preview
Preview Only
⚠️ Preview signals are exploratory and may disappear if price invalidates the reversal.
🧠 6. Smart Signal State Engine
Maintains a clean bullish / bearish reversal state:
Bullish reversal → trend flips upward
Bearish reversal → trend flips downward
Automatically resets when structure is invalidated
🔔 7. Built-in Alerts
Alerts available for:
Bullish Reversal
Bearish Reversal
Any Reversal
EMA Buy Signal
EMA Sell Signal
📌 How to Use
▶️ Trend-Following Strategy
Wait for EMA trend alignment
Enter on a confirmed reversal in trend direction
Use recent swing high/low for stop-loss
Trail profits using higher-low / lower-high structure
🔄 Counter-Trend Reversal Strategy
Use higher sensitivity
Look for strong extended moves
Enter on confirmed reversal
Exit at next EMA cross or opposite reversal
⚙️ Recommended Settings
Style Sensitivity Confirmation Bars
Scalping High 0–1
Intraday Medium 0–2
Swing Low 1–3
📎 Best Markets
Crypto
Forex
Indices
Stocks
Commodities
Works on all timeframes (1m → 1D+).

cephxs + fadi / Previous Time Based Dealing RangesPREVIOUS TIME BASED DEALING RANGES
Visualize previous and current higher timeframe dealing ranges with dual-box OHLC representation, extending reference lines, and HTF candle displays.
Open Source Fork of @fadizeidan 's HTF Candles Indicator
OVERVIEW
This indicator displays time-based dealing ranges from higher timeframes directly on your chart. It shows the complete price action structure of previous (or current/forming) periods using a dual-box system: one box for the full High-Low range and another for the Open-Close body. Reference lines extend from key levels to help identify potential support, resistance, and mean reversion zones.
Perfect for traders who use ICT concepts, market structure analysis, or any methodology that relies on understanding where price has been relative to previous dealing ranges.
KEY FEATURES
Dual-Box Range Visualization: Each range displays two boxes - the full H-L range (outer) and the O-C body (inner) - giving immediate visual context of candle structure
Multiple Timeframes: Support for 90m, 4H, 6H, 1D, 1W, 1M, and 3M ranges
Previous/Current Mode: View completed ranges (Previous) or the forming range (Current) with real-time updates
Auto Mode: Automatically selects the appropriate range based on your chart timeframe
Reference Lines: Extending lines from High, Mid, Low (or Quadrants: H/75/M/25/L) with trade-into detection
HTF Candle Display: Visual HTF candles positioned to the right of price for context
6H Session Support: Session-aware ranges for Asia, London, NY AM, and NY PM with labeled names
Open Line: Vertical line marking the range's opening price/time
Imbalance Detection: Fair Value Gaps and Volume Imbalances highlighted on HTF candles
MODE OPTIONS
Previous/Current: Previous shows the last completed range. Current shows the forming range with dynamic H/L/C updates
Auto/Manual: Auto selects range by chart TF. Manual lets you choose specific ranges
Extend Box (Current): In Current mode, extends the box's right edge as price develops
AUTO MODE TIMEFRAME LOGIC
Auto mode now selects up to 3 ranges automatically based on chart timeframe, providing multi-timeframe context:
Chart ≤ 3m → 90m + 6H + 1D
Chart 4m-14m → 6H + 1D + 1W
Chart 15m-59m → 1D + 1W (+ 1M available)
Chart 1H-3H → 1D + 1W + 1M
Chart 4H-23H → 1W + 1M + 3M
Chart ≥ 1D → 1M + 3M
INPUTS
Mode
Mode: Previous/Current - Choose completed or forming range
Auto/Manual: Auto selects range by chart TF, Manual lets you choose
Extend Box (Current): Extends box right edge with price (Current mode only)
Show Range Boxes: Toggle box visibility (lines remain visible when off)
Filter Lines by Distance: When boxes are hidden, hide reference lines that are too far from current price (Really Close / Balanced / Slightly Far)
Previous Ranges
Range 1: Enable/disable, select timeframe (90m/4H/6H/1D/1W/1M/3M), max display count (1-2)
Range 2: Second range layer for multi-timeframe analysis
Range 3: Third range layer for additional context
Reference Lines
Line Mode: Levels (H/M/L) or Quadrants (H/75/M/25/L)
Line Style: Solid, dashed, or dotted
Line Thickness: 1-4 pixels
Show Labels: Toggle reference line labels
Label Offset: Distance of labels from current price (1-20 bars)
HTF Candle Levels: Show mini H/M/L lines on HTF candles
Open Line: Vertical line at range open with customizable style
Range Boxes & Colors
Per-Range Colors: Customize box and line colors for each timeframe (90m, 4H, 6H, 1D, 1W, 1M, 3M)
HTF Candle Styling
Show HTF Candles: Toggle HTF candle display
Body/Border/Wick Colors: Customize bull and bear candle appearance
Padding/Buffer/Width: Control candle spacing and size
Labels
HTF Label: Show timeframe label above/below candles
Remaining Time: Countdown timer to candle close
Label Position: Top, Bottom, or Both
Label Alignment: Align across timeframes or follow individual candles
Imbalance
Fair Value Gap: Highlight FVGs on HTF candles
Volume Imbalance: Highlight VIs on HTF candles
HOW TO USE
Add the indicator to your chart
Choose Previous or Current mode based on your analysis preference
Use Auto mode for intelligent range selection, or Manual to select specific timeframes
Reference lines extend from range levels - watch for price reactions at H/M/L
In Current mode, observe how the range develops with real-time updates
Use the HTF candles on the right for quick multi-timeframe context
REFERENCE LINE LABELS
Labels follow this format:
Previous mode: pD-H (previous Daily High), pW-M (previous Weekly Mid), p6H-London-L (previous 6H London Low)
Current mode: D-H (Daily High), W-M (Weekly Mid), 6H-Asia-L (6H Asia Low)
6H SESSION NAMES
Asia: 18:00-00:00 ET
London: 00:00-06:00 ET
NYAM: 06:00-12:00 ET
NYPM: 12:00-18:00 ET
RECOMMENDED TIMEFRAMES
Tick/Second charts: 90m ranges
1-5 minute charts: 6H or 1D ranges
15-60 minute charts: 1D or 1W ranges
4H charts: 1W or 1M ranges
Daily charts: 1M or 3M ranges
Or simply use Auto mode to let the indicator choose the optimal range.
TIPS
The Mid (M) level often acts as equilibrium - watch for mean reversion plays
High and Low levels are natural support/resistance zones
In Current mode, watch how price interacts with the forming range boundaries
Combine with your existing analysis for confluence
The Open Line helps identify the "true open" of each range for gap analysis
DISCLAIMER
This indicator is for educational and informational purposes only.
Past performance does not guarantee future results.
Always use proper risk management and never risk more than you can afford to lose.
Trading involves substantial risk of loss and is not suitable for all investors.
CREDITS
Original indicator by @fadizeidan.
Enhanced by cephxs/fstarcapital
CHANGELOG
Pro + v1.1: Reupload + Added 90m ranges for ultra-low timeframe analysis, distance-based line filtering (lines-only mode), third range slot.
Open sourced so users can add more slots.
Enjoy 🤙

Open Interest [OI] & Liquidation Flow█ THE DUAL-ENGINE ARCHITECTURE: A FUSION OF TWO CRITICAL FORCES
The power of this suite comes from its dual-engine design. It isolates and analyzes the two opposing forces that truly drive modern markets: the informed positioning of institutions and the often-misguided sentiment of the retail crowd. A high-probability trade signal is only generated at the precise moment these two forces come into critical conflict.
ENGINE 1: The Open Interest (OI) & Position Flow Engine
This is your lens into the institutional world. Its primary function is to track the flow of money into and out of the market, revealing the true intent of large players.
Live OI Integration: In a groundbreaking feature for TradingView, this engine includes a Smart Symbol Detector that automatically seeks and integrates LIVE Open Interest data for supported markets (CME, Binance, Bybit, etc.). When available, you are seeing a direct feed of net new positions entering the market.
12-Factor Synthetic OI Model: When live OI data is not available, the engine synthesizes a high-fidelity proxy by analyzing 12 distinct factors, including Cumulative Volume Delta (CVD), Absorption, Effort vs. Result, and Institutional Bias.
Curvature Analysis: We don't just look at the flow; we analyze its Velocity and
Acceleration . A sharp acceleration in bullish OI Flow is a powerful sign that institutions are aggressively building long positions.
INTERPRETATION: This engine tells you what the "smart money" is doing. A divergence—where price is falling but OI Flow is rising—is a classic sign that institutions are quietly absorbing retail panic, often preceding a violent reversal upwards.
ENGINE 2: The Liquidation Flow & Crowd Engine
This engine operates on a powerful contrarian philosophy: the market is designed to inflict maximum pain on the largest number of participants. It identifies when the retail "herd" is over-leveraged and positioned for a fall.
Crowd Positioning Model: It analyzes factors like extreme RSI levels, deviation from Fair Value (VWAP), and "chase behavior" (e.g., many consecutive bullish candles) to determine when the retail crowd is dangerously over-exposed.
Risk Analysis: It synthesizes multiple risk factors—crowding, momentum divergence, exhaustion—into a single, easy-to-read Liquidation Risk percentage .
Fear & Greed Skew: It measures the volatility skew in the options market to provide a direct gauge of market-wide fear and greed, adding a final layer of sentimental context.
HOW TO USE IT: This is your liquidation radar. When Liquidation Risk is HIGH and the Crowd is positioned heavily LONG, the market is primed for a long squeeze (a liquidation cascade downwards). Conversely, when the Crowd is heavily SHORT, a short squeeze is highly probable.
█ THE SECRET SAUCE: UNIVERSAL ADAPTABILITY
The genius of this engine lies in its ability to work on any asset, in any timeframe, without manual recalibration. This is achieved through Z-Score Normalization . Every piece of data is converted from a raw value into a statistical score representing its deviation from the "norm." A +2.0 sigma event represents an extreme outlier, whether it's on a 1-minute chart of a crypto asset or a daily chart of a stock. This makes the signals universally comparable and allows the engine to automatically adapt to the unique volatility and character of any market.
█ THE ARSENAL: MASTERING THE VISUALS & ON-CHART TOOLS
Every visual element is a data-rich component designed for rapid, intuitive interpretation.
The Lower Pane Visualizer
This is your primary intelligence dashboard, with four distinct modes to view the underlying market forces:
Classic Flow (Default): A multi-column view perfect for spotting divergences between price and the underlying flow of money and sentiment.
Heatmap Matrix: A color-density grid designed to identify "cluster" events where multiple engines light up simultaneously, signaling institutional consensus.
Oscillator Pro: A zero-centered line visualization for traders who prefer crossover and momentum-style analysis.
Delta Waterfall: A unique cascading visualization that shows the cumulative "weight" of the market, stacking the pressure from each engine to reveal the dominant force.
Main Chart Overlays
BUY/SELL Signals: These are the primary, high-conviction reversal signals. They are not simple crossovers; they are the result of a rigorous confirmation process where institutional OI Flow directly conflicts with a vulnerable retail Liquidation Flow.
Minor Triangles (▲▼): Secondary momentum signals that are excellent for scalping, confirming a trend, or adding to a winning position.
Supply/Demand Zones: When a strong, institutionally-backed signal fires, the script automatically plots a defended zone (Red for Supply, Green for Demand), highlighting future high-probability reversal areas.
Key Levels: Automatically extends lines from significant highs and lows where a major flow reversal occurred, highlighting critical support and resistance.
High Risk Diamonds (💎): A critical risk management tool. These markers appear when conditions are ripe for a liquidation cascade. This is an explicit warning to take profits or stand aside.
The Dashboard (HUD)
Your at-a-glance command center, displaying real-time, mission-critical data:
Z-Scores for OI Flow Velocity & Acceleration: See the raw, normalized momentum of the institutional flow.
Crowd Sentiment Status: Instantly know if the market is dangerously "CROWDED" or balanced.
Liquidation Risk %: A numerical gauge from 0-100% showing the probability of a violent flush.
Live Data Status: Confirms whether the engine is using LIVE OI data or the PRO synthetic model.
Optimizer Readout: When enabled, shows the backtest results of your current settings.
█ THE COMMAND CENTER: MASTERING THE INPUTS
This suite offers deep customization for the professional trader.
Analysis Length: The "memory" of the flow engine. Use shorter lengths (10-14) for scalping and longer lengths (21+) for swing trading.
Signal Sensitivity: A master control to switch between Conservative (fewer, higher-quality signals), Normal (balanced), and Aggressive (more frequent signals for scalping) modes.
Display Toggles: Individually enable or disable any of the core components in the lower pane to create your perfect analytical view.
Overlay Controls: Individually toggle all on-chart visuals and control the maximum number of Zones and Key Levels to maintain a clean workspace.
█ THE OPTIMIZER ENGINE: VALIDATE BEFORE YOU TRADE
Confidence comes from data. The built-in Optimizer Engine is a powerful backtester that runs on your chart's visible data. It allows you to rapidly test different ATR-based Take Profit and Stop Loss parameters, providing key metrics like Win Rate, Profit Factor, and a proprietary Stability Rating ( ROBUST, STABLE, FRAGILE, OVERFIT ) to help you find the most statistically sound settings for your specific asset and timeframe before risking capital.
█ DEVELOPMENT PHILOSOPHY
This indicator was born from a single, guiding principle: to win in modern markets, you must stop listening to the noise of price and start analyzing the signal of flow. Price is where amateurs look; flow is where professionals find their edge. This tool is our attempt to level the playing field, translating the opaque world of derivatives and institutional positioning into a clear, intuitive, and actionable intelligence system.
This tool is for the serious student of the market—the trader who seeks to understand the "why" behind the move, not just the "what."
█ DISCLAIMER AND BEST PRACTICES
THIS IS AN ADVANCED ANALYTICAL TOOL: This indicator provides intelligence, not financial advice. It should be used as a core component of a comprehensive trading strategy that includes your own analysis of market structure and risk management.
RISK MANAGEMENT IS PARAMOUNT: All trading involves substantial risk. Never risk more capital than you are prepared to lose. This indicator does not guarantee profits.
SIGNAL HIERARCHY IS KEY: Treat the main BUY/SELL labels as your primary signals. Use the minor triangles to add to positions or for scalping. Use the High Risk diamonds as a signal to reduce exposure and take profits.
MULTI-TIMEFRAME ANALYSIS: For the highest probability setups, use the indicator on a higher timeframe (e.g., 1H) to establish an institutional bias, then take signals on a lower timeframe (e.g., 5m) that align with that bias.
"The game of speculation is the most uniformly fascinating game in the world. But it is not a game for the stupid, the mentally lazy, the person of inferior emotional balance, or the get-rich-quick adventurer. They will die poor."
— Jesse Livermore
Taking you to school. - Dskyz, Trade with Open Interest. Trade with Liquidity. Trade with Open Interest & Liquidation Flow

polymarket 15 min markerHere is a professional and catchy description you can use when publishing this script on TradingView. It highlights the "pro" features we added (MTF capability, custom fonts, and bug fixes).
Title: Current 15m Open – Pro Anchored Level
Description:
What it does: This indicator is a precision tool for intraday traders. It automatically identifies and draws a horizontal line at the opening price of the current 15-minute candle. This level serves as a key pivot for intraday bias—price above is often bullish, price below is often bearish.
Unlike standard indicators, this script is engineered to be Multi-Timeframe (MTF) stable. This means you can view the 15m Open level while scalping on a 1-minute, 5-minute, or even 1-second chart, and the line will remain locked to the correct price without repainting or jumping.
Key Features:
🎯 Precision Anchor: Uses time-based coordinates to ensure the line starts exactly at the 15m candle open, regardless of your current timeframe.
⚡ Zero-Lag MTF: Instantly updates the moment a new 15-minute session begins.
💎 Luxury Visuals: Features a "Fancy Font" hack that uses special Unicode characters to display the label in a bold, professional serif style (customizable in settings).
📐 Smart Positioning: The label floats clearly on the right side of the chart (margin area), ensuring it never obstructs your view of the candles.
🛠 Stability Fixes: Includes custom logic to prevent the "disappearing line" bug that often occurs when viewing the same timeframe as the indicator source.
Settings:
Theme Color: Customize the line and text color to match your chart theme.
Font Style: Choose between "Luxury" (Serif), "Hacker" (Monospace), or "Modern" (Standard).
Text Offset: Adjust how far to the right the label sits.
How to use:
Add to your chart.
Use it as a bias filter: Look for longs above the blue line and shorts below it.
Perfect for scalpers who need to keep the higher-timeframe context visible at all times.

Reversal Detection v3.2 - FX Optimized | Non-Repainting
Acknowledgment:
Special thanks to TradingView user FakhriSaad for identifying FX compatibility issues that led to the v3.2 optimization.
DESCRIPTION:
Reversal Detection Pro v3.2 - FX Optimized | Non-Repainting
Professional reversal detection indicator with 100% non-repainting signals and ATR-based adaptive sensitivity for all instruments and timeframes.
Key Features:
Non-repainting reversal signals with visual labels
ATR-adaptive sensitivity (0.8x to 3.5x multiplier)
FX-optimized thresholds (0.02%-0.08%) for currency pairs
Triple EMA trend confirmation (9/14/21 periods)
Supply/Demand zone visualization
5 sensitivity presets: Very High to Very Low
Comprehensive alert system
Works on forex, futures, stocks, crypto
What's New in v3.2:
Reduced percentage thresholds by ~40% for FX pairs
Changed default absolute reversal from 1.0 to 0.0001 for forex compatibility
Optimized for 2-10 pip reversals on EUR/USD, GBP/USD, USD/JPY
Maintained excellent performance on futures (MNQ, ES, NQ) and other instruments
Universal Compatibility:
Automatically adapts to any instrument's volatility using ATR normalization. Works on 1-minute scalping through daily swing trading timeframes.
HOW TO USE
Quick Start Guide:
Add to Chart - Apply indicator to any instrument/timeframe
Choose Sensitivity - Select preset based on your trading style
Set Signal Mode - Use "Confirmed Only" for non-repainting signals
Enable Alerts - Set up notifications for reversal signals
Customize Display - Adjust labels, zones, and info table to preference
Sensitivity Selection by Timeframe:
Forex Pairs (EUR/USD, GBP/USD, USD/JPY, etc.):
1-2 minute: Very High or High (2-5 pip reversals)
5-15 minute: Medium (5-10 pip reversals)
30-60 minute: Low (10-20 pip reversals)
4H-Daily: Very Low (20+ pip reversals)
Futures Contracts (MNQ, ES, NQ, etc.):
1-5 minute: High or Medium
15-30 minute: Medium
1-4 hour: Low
Daily: Very Low
Stocks & Crypto:
Start with Medium sensitivity
Adjust based on volatility and signal frequency
Higher volatility = Lower sensitivity recommended
Understanding the Signals:
Reversal Labels:
Green "REVERSAL" = Bullish reversal at potential support
Red "REVERSAL" = Bearish reversal at potential resistance
Price shown on label = Exact reversal pivot price
Horizontal line extends from signal for quick reference
Supply/Demand Zones (Optional):
Green box = DEMAND zone (formed at pivot lows)
Red box = SUPPLY zone (formed at pivot highs)
Thin horizontal rectangles mark key price levels
Zones extend forward showing potential future support/resistance
Info Table (Top Right):
Current settings display
Real-time ATR value
Calculated reversal threshold
Current trend status (Bullish/Bearish/Neutral)
Preview Mode (Optional):
Transparent labels show forming reversals in real-time
Preview signals may disappear if reversal doesn't confirm
Educational tool for understanding signal development
Not recommended for actual trading decisions
Key Settings Explained:
SIGNAL CONTROLS:
Signal Mode:
"Confirmed Only" = No repainting (recommended for trading)
"Confirmed + Preview" = Shows both types (educational)
"Preview Only" = Real-time signals only (study mode)
Extra Confirmation Bars: Add 0-5 bar delay for conservative signals
MAIN CONTROLS:
Sensitivity Preset: Choose from 5 presets or Custom
Very High: Maximum signals, 2-3 pip moves (FX scalping)
High: Frequent signals, 3-5 pip moves
Medium: Balanced, 5-10 pip moves (recommended default)
Low: Quality signals, 10-20 pip moves
Very Low: Major reversals only, 20+ pip moves
ADVANCED SETTINGS (Custom Mode Only):
Calculation Method:
"average" = Smoother detection (recommended)
"high_low" = More responsive to wicks
Percentage Reversal: Minimum % price move (0.02-0.08% for FX)
Absolute Reversal: Safety floor (0.0001 for FX, 1.0 for futures)
ATR Multiplier: Primary control (lower = more sensitive)
ATR Length: Lookback period (14 bars standard)
ZONES:
Supply/Demand Display: Pivot, Arrow, or None
Show Supply/Demand Zones: Enable rectangular price zones
Number of Zones: Display 0-20 recent zones
Zone Box Extension: Forward projection length (20-50 bars)
Zone Thickness: Visual thickness (0.01% recommended)
LABELS:
Stop Line Extension: Length of horizontal price lines (5-10 bars)
Maximum Lines: How many lines to keep on chart (10 default)
Label Size: Small, Normal, or Large text
INFO TABLE:
Show Info Table: Toggle settings display on/off
Table Position: 6 screen position options
Table Size: Adjust text size for readability
Trading Strategy Examples:
Scalping Strategy (1-5 min charts):
Set sensitivity to High or Very High
Wait for reversal signal
Enter on signal bar close
Place stop loss 2-3 pips beyond reversal price
Take profit at 5-10 pip targets or next reversal signal
Trend Trading (15-60 min charts):
Set sensitivity to Medium
Check Info Table for trend direction
Only take reversal signals aligned with trend
Enter when REVERSAL matches trend (Bullish trend + Green signal)
Use supply/demand zones for profit targets
Swing Trading (4H-Daily charts):
Set sensitivity to Low or Very Low
Enable supply/demand zones
Wait for reversal at zone boundaries
Combine with higher timeframe trend analysis
Use zones as multiple take-profit levels
Confirmation Tool:
Use with your existing strategy
Set to Confirmed Only mode
Take your setup signals only when reversal confirms
Use reversal price as stop loss reference
Alert Configuration:
Available Alert Types:
REVERSAL Bullish - Green reversal signal
REVERSAL Bearish - Red reversal signal
Any REVERSAL - Either direction
EMA Buy Signal - Trend turns bullish
EMA Sell Signal - Trend turns bearish
Trend Changed to BULLISH - Confirmed trend change
Trend Changed to BEARISH - Confirmed trend change
STRONG Bullish Signal - Reversal + trend aligned
STRONG Bearish Signal - Reversal + trend aligned
Setting Up Alerts:
Right-click chart → Add Alert
Select "Reversal Pro v3.2" as Condition
Choose desired alert type
Set "Once Per Bar Close" for non-repainting
Configure notification method (popup, email, webhook)
Best Practices:
✓ Start with Medium sensitivity and adjust based on results
✓ Use Confirmed Only mode for actual trading
✓ Combine reversal signals with trend direction for higher probability
✓ Set alerts for "Once Per Bar Close" to avoid repainting
✓ Practice on demo account before live trading
✓ Use supply/demand zones for confluence
✓ Adjust sensitivity based on market volatility conditions
✓ Lower sensitivity during high-impact news events
✗ Don't trade every signal - be selective
✗ Don't ignore trend context (check Info Table)
✗ Don't use Preview signals for live trading
✗ Don't overtrade - quality over quantity
✗ Don't risk more than 1-2% per trade
✗ Don't ignore proper risk management
✗ Don't trade during major news releases without experience
Troubleshooting:
No Signals Appearing:
Check Absolute Reversal setting (should be 0.0001 for FX pairs)
Try increasing sensitivity (Very High or High)
Verify instrument has sufficient price movement
Check that Signal Mode isn't set to "Preview Only"
Too Many Signals:
Lower sensitivity (try Low or Very Low)
Increase Extra Confirmation Bars
Switch to higher timeframe
Increase ATR Multiplier in Custom mode
Zones Not Showing:
Enable "Show Supply/Demand Zones" checkbox
Increase "Number of Zones" setting
Adjust "Zone Thickness" to 0.01 for better visibility
Labels/Lines Moving on Chart Pan:
This is normal TradingView behavior with bar_index positioning
Zoom/scroll adjustments may shift visual elements slightly
Signals themselves remain accurate at confirmed bar
Performance Notes:
Indicator recalculates on every bar close
Historical signals do not repaint or recalculate
Preview mode updates in real-time (educational only)
Info Table updates each bar with current settings
Maximum 50 boxes, 200 lines, 100 labels per chart
Minimal CPU usage - efficient for real-time monitoring
Educational Concepts:
This indicator teaches:
Support/Resistance: Price levels where reversals occur
Supply/Demand: Zones where institutions may be active
Trend Analysis: Using multiple EMAs for direction
Volatility Adaptation: How ATR normalizes across instruments
Risk Management: Using reversal prices for stop placement
Signal Confirmation: Difference between preview and confirmed signals
VERSION HISTORY
v3.2 (January 2026):
FX-optimized percentage thresholds (0.02%-0.08%)
Changed default absolute reversal to 0.0001 for forex
Enhanced compatibility with low-volatility currency pairs
Thanks to FakhriSaad for identifying FX compatibility issues
v3.1 (January 2025):
Universal optimization for all instruments and timeframes
ATR-based adaptive sensitivity as primary mechanism
Fixed percentage thresholds as safety floor
Enhanced scalping through swing trading capability
Educational Tool:
Designed to help traders learn reversal patterns, support/resistance concepts, and price action structure. Demonstrates algorithmic detection of market pivots.
Disclaimer: This indicator is for educational purposes only. It does not provide investment advice. All trading involves risk. Past performance does not guarantee future results. Use proper risk management and never invest more than you can afford to lose.
Support: For questions, feedback, or feature requests, please comment below or message @NPR21 on TradingView.

The Automatic Channel Revolution [8 Levels + Slicing]Stop wasting time manually drawing lines and start trading.
I present to the community Fimathe Master Pro, a unique tool designed to completely automate the Fimathe technique, eliminating subjectivity and human error when drawing channels.
Many traders miss entry timing while adjusting rectangles or manually calculating the 50% (slicing) levels. This script solves that instantly, creating a visual structure that is clean, professional, and objective for Day Trading (Indices, Forex, and Crypto).
🚀 WHAT MAKES THIS SCRIPT UNIQUE?
Unlike other indicators that simply plot support and resistance lines, Fimathe Master Pro creates a Dynamic Block Structure:
Automatic Reference Channel: You define the time range (e.g., first 30 min or 1h), and the script automatically detects the High and Low, locking in the Reference Channel and Neutral Zone.
8-Level Expansion System (New): The indicator automatically projects 4 Levels Up and 4 Levels Down. You will never run out of targets during strong trend days again.
Visual Slicing (50%): The script automatically draws discrete dotted lines in the middle of each channel, allowing for precise "slicing" operations (sub-channel trading) without cluttering the chart.
Clean & Transparent Visuals: Developed with an intelligent transparency layer (92%), ensuring you can see the candles perfectly while identifying Buy and Sell zones.
⚙️ HOW TO CONFIGURE:
Session: Default is set to 0900-0930 (First 30 min). If you trade the Classic Fimathe (1 hour), simply change it in the settings to 0900-1000.
Slicing: Can be toggled on or off with a single click.
Colors: Fully customizable to fit your template (Dark or Light mode).
🎯 WHO IS THIS INDICATOR FOR?
Ideal for Price Action traders and students of the Fimathe technique who want to professionalize their screen and gain agility in decision-making.
If this script helped your market reading, please leave a BOOST (Like) and comment your suggestions below!

ICT Flow Matrix [Ultimate]📊 Overview
ICT Flow Matrix is a comprehensive, all-in-one Smart Money Concepts (SMC) indicator built for traders who follow ICT (Inner Circle Trader) methodology. This indicator consolidates over 15 institutional trading concepts into a single, highly customizable tool—eliminating chart clutter from multiple indicators while providing deep market structure analysis.
Whether you're identifying liquidity pools, tracking order flow, or timing entries during ICT Macro windows, this indicator delivers institutional-grade analysis directly on your chart.
Pro Tip: use with ICT Market Regime Detector for clear language reads on everything.
⚡ Key Features
🎯 Price Delivery Arrays (PDAs)
Fair Value Gaps (FVG) — Automatic detection with customizable mitigation tracking (Wick Touch, 50% CE, Full Close)
Inverse FVGs (iFVG) — Identifies when FVGs fail and flip, creating new tradeable zones
Order Blocks (OB) — Last opposing candle before impulsive moves with adjustable impulse strength
Breaker Blocks (BB) — Automatically generated when Order Blocks fail
Rejection Blocks (RB) — Strong wick rejections indicating institutional defense
Volume Imbalances (VIMB) — Gaps between candle bodies showing aggressive institutional activity
📐 Market Structure & Liquidity
Market Structure Shifts (MSS) — Real-time detection of bullish/bearish structure breaks
Equal Highs/Lows (EQH/EQL) — Liquidity pools where stop losses accumulate
Buy-Side/Sell-Side Liquidity (BSL/SSL) — Swing point liquidity levels with sweep detection
Premium/Discount Zones — Visual shading showing institutional buying/selling areas
OTE Zone (61.8%-79%) — Optimal Trade Entry zone for high-probability entries
⏰ Time-Based Analysis
ICT Macro Times — All nine 30-minute algorithmic windows (02:45, 03:45, 04:45, 09:45, 10:45, 13:45, 14:45, 15:15, 15:45 NY Time)
Killzone Sessions — Asia, London, NY AM, NY PM with customizable times
Session Opens — Weekly, Monthly, Daily opening prices
Previous Period H/L — PDH/PDL, PWH/PWL, PMH/PML levels
📏 Dealing Ranges
Multi-Timeframe Ranges — 21-Day, 3-Day, Daily dealing ranges
Session Ranges — Asia, London, NY dealing ranges with equilibrium
Fibonacci Structure — 0%, 50% (EQ), 100% levels with P/D shading
🕯️ HTF Orderflow
Higher Timeframe Candles — Display up to 6 HTF candles with auto-timeframe selection
Candle Timer — Countdown to next HTF candle close
O/H/L Reference Lines — Current HTF open, high, low levels extended on chart
🎨 Visual Customization
5 Theme Presets — Dark Pro, Light Clean, Neon, Classic, Custom
Full Color Control — Customize every element individually
Zone Styles — Filled or Border Only options
Mitigation Effects — Visual fade when zones are mitigated
📋 Smart Dashboard
Real-Time Status — Structure bias, zone position, active session, OTE status
Confluence Score — Algorithmic scoring when multiple concepts align
Zone Counters — Active FVG, OB, BB, RB, VIMB, liquidity levels
3 Display Modes — Minimal, Compact, Detailed
🔔 Comprehensive Alert System
40+ Alert Conditions including:
FVG/OB/BB/RB/VIMB formation
Liquidity sweeps (EQH, EQL, BSL, SSL)
Market Structure Shifts
OTE zone entry
Macro time windows
Session opens
High confluence zones
Combo alerts (Macro + Confluence)
📖 How To Use
For Swing/Position Traders:
Enable HTF Orderflow to identify dominant trend direction
Use Dealing Ranges (3D, 21D) to find premium/discount zones
Look for OB/FVG confluence in discount (longs) or premium (shorts)
Confirm with MSS for trend alignment
For Day/Intraday Traders:
Mark the Asian Range during pre-market
Wait for London or NY AM Killzone
Enter during ICT Macro windows when price reaches FVG/OB in OTE zone
Target opposite liquidity (BSL for longs, SSL for shorts)
Confluence Trading:
Dashboard shows real-time confluence score
Score ≥ 3 indicates multiple ICT concepts aligned
Higher scores = higher probability setups
⚙️ Recommended Settings
Trading Style FVG Max OB Max History Bars HTF Candles
Scalping 3-5 2-3 100-200 3-4 Day Trading 5-8 3-5 200-400 4-5
Swing Trading 8-12 5-8 400-800 5-6
🎯 Best Practices
✅ Do:
Use HTF bias before taking LTF entries
Wait for Macro time windows for highest probability
Combine MSS + FVG/OB + OTE for A+ setups
Let mitigated zones fade (use Mitigation Fade setting)
❌ Avoid:
Trading against HTF structure
Entries outside Killzones (lower probability)
Ignoring liquidity targets
Over-cluttering chart (disable unused features)
📝 Version History
v6.0 (Current)
Complete rewrite in PineScript v6
Added ICT Macro Times with bracket/background styles
Enhanced confluence detection algorithm
Improved HTF candle rendering with multiple styles
Added Inverse FVG detection
Session-based Dealing Ranges
Performance optimizations
40+ alert conditions
⚠️ Disclaimer
This indicator is a technical analysis tool designed to visualize ICT/SMC concepts. It does not provide financial advice or guarantee profitable trades. Past performance is not indicative of future results. Always use proper risk management and trade responsibly.
💬 Support & Feedback
If you find this indicator valuable, please leave a comment or boost! Your feedback helps improve future updates.
Questions? Drop a comment below—I actively respond to all questions about the indicator's features and usage.

Liquidations (TV Source / Manual / Proxy) Cruz Pro Stack + Liquidations (TV Source / Manual / Proxy) is a high-confluence crypto trading indicator built to merge reversal detection, volatility timing, structure confirmation, and liquidation pressure into one clean decision engine.
This script combines five pro-grade components:
1) RSI Divergence (Regular + Hidden)
Detects early momentum shifts at tops and bottoms to anticipate reversals before price fully reacts.
2) BBWP (Bollinger Band Width Percentile)
Identifies volatility compression and expansion cycles to time breakout conditions and avoid low-quality chop.
3) Market Structure (BOS / CHOCH proxy)
Confirms trend continuation or change-of-character using swing breaks for more reliable directional bias.
4) Liquidations Layer (3 Modes)
Adds liquidation-driven context for where price is likely to squeeze or flush next:
TV Source: Use TradingView’s built-in Liquidations plot when available.
Manual Totals: Paste 12h/24h/48h long/short totals for higher-level regime bias.
Proxy (Volume Shock): A fallback approximation for spot charts using volume + candle direction.
The script automatically converts your chart timeframe into rolling 12/24/48-hour windows, then computes a weighted liquidation bias and a spike detector to flag potential exhaustion moves.
5) Confluence Score + Signals
A simple scoring engine highlights high-probability setups when multiple factors align.
Signals are printed only when divergence + structure + volatility context agree with liquidation pressure.
How to use
Best on BTC/ETH perps across 15m–4H.
For maximum accuracy:
Add TradingView’s Liquidations indicator (if your exchange/symbol supports it).
Set Liquidations Mode = TV Source.
Select the Liquidations plot as the source.
If that plot can’t be selected, switch to Proxy or Manual Totals.
What this indicator is designed to improve
Earlier reversal recognition
Cleaner breakout timing
Structure-confirmed entries
Better risk management around liquidation-driven moves
Fewer low-quality trades during dead volatility

White Crow**White Crow — cluster reversal signals + market structure**
> Indicator that helps you read market structure (pivots, trend, last extremes) and spot potential reversals through CCI/RSI signal clusters. This is *not* a standalone trading system and does not guarantee any result — it is a tool for filtering and confirming your own market ideas.
---
## 1. Concept
White Crow combines three core blocks:
1. **Pivots & market structure**
Automatically detects **local tops/bottoms** and derives a *Bullish / Bearish / Sideways* bias from them.
In the top-right corner you see a compact panel with current trend and **Last Bottom / Last Top** prices.
2. **Momentum & overbought/oversold zones**
Inside, the indicator uses:
* **CCI** with fixed levels `+100 / -100`;
* an optional **RSI filter** with overbought/oversold levels (`80 / 20`).
These generate basic *Buy / Close* signals.
3. **Cluster signals Buy X / CloseV**
The script tracks **clusters of signals inside a 4-bar window** and highlights rarer, “amplified” events:
* **Buy X** — cluster buy signal (multiple buy conditions in a row);
* **CloseV** — cluster signal for exit/reversal.
**Buy X and CloseV are the strongest and most reliable signals in this indicator** because they are based on repeated conditions rather than a single bar. They work **best on higher timeframes (1H–4H)**, where they reflect meaningful shifts in order flow instead of noise.
> ⚠️ Important: Buy X and CloseV are *only signals*. They must be used as **one of several confirmation factors** for your own view of market structure (support/resistance, trend, price action, volume, etc.), not as standalone reasons to enter or exit trades.
---
## 2. How it works
### 2.1. Pivots and trend detection
* The indicator builds a **zigzag-like structure**:
after a local high, once price retraces down by a given percentage (`pivotSigma`), a **Top** is marked;
after a local low, once price retraces up by the same percentage, a **Bottom** is marked.
* Using the sequence of recent tops and bottoms, the script determines the trend:
* *Bullish* — the last low is higher than the previous one (HL);
* *Bearish* — the last high is lower than the previous one (LH);
* otherwise — *Sideways*.
* The info table shows:
* **Market Trend** — Bullish / Bearish / Sideways;
* **Last Bottom / Last Top** with adaptive decimal precision (works for crypto, FX, stocks, etc.).
### 2.2. Base Buy / Close signals
* **Long condition (Buy):**
* `CCI < -100` (oversold),
* if RSI filter is enabled — `RSI < 20`.
* **Short/Exit condition (Close):**
* `CCI > +100` (overbought),
* if RSI filter is enabled — `RSI > 80`.
These conditions generate the regular **Buy** and **Close** labels on the chart.
### 2.3. Clusters: Buy X and CloseV
To reduce noise, the indicator evaluates not only the current bar, but also the **last 4 bars**:
* `buy_count` — how many times the long condition was true within the last 4 bars;
* `sell_count` — how many times the short condition was true within the last 4 bars.
Then:
* **Buy X** appears when:
* `buy_count ≥ 2` (conditions for Buy were met on at least 2 of the last 4 bars),
* the time filter between two Buy X signals is satisfied (`Min Bars Between Signals`).
* **CloseV** appears when:
* `sell_count ≥ 2`,
* the required number of bars has passed since the previous CloseV.
> ✅ This is why **Buy X / CloseV are stronger and more trustworthy than single Buy/Close signals**, especially on **1H–4H** timeframes: the market confirms the same overbought/oversold condition several times in a row.
### 2.4. Order Blocks
* When `Show Order Blocks` is enabled, the indicator highlights **impulsive candles** whose body exceeds a threshold based on ATR.
* Colored rectangles mark **potential order blocks** (areas where strong buying or selling previously occurred).
## 3. Inputs and customization
Inputs are grouped in TradingView-friendly categories.
### 3.1. Pivot Settings
* `Show Pivots` — enable/disable **Top / Bottom** markers.
* `Sigma (% retracement)` — pivot sensitivity (minimum retracement in % required to confirm a pivot).
* Colors for Top/Bottom — for visual tuning.
**Tip:**
On H1–H4 you can keep near-default values.
On lower timeframes, reduce `Sigma` if you want more detailed local structure.
### 3.2. CCI / RSI Settings
* `CCI Period` — CCI length (short by default for faster reaction).
* `Enable RSI Filter` / `RSI Period` — toggle and length for RSI filter.
* RSI levels are fixed at **20 / 80** to mark strong oversold/overbought zones.
**Usage:**
* For more conservative entries — keep the RSI filter enabled.
* For more frequent signals (e.g. scalping) — you can disable the RSI filter.
### 3.3. Order Blocks
* `Show Order Blocks` — display order block zones.
* `Block Threshold (ATR multiplier)` — how large a candle must be (vs ATR) to be considered significant.
### 3.4. Signals & Filters
* `Show Buy / Show Buy X / Show Close / Show CloseV` — choose which labels you want to see.
* `Enable Time Filter` — enable minimum spacing between amplified signals.
* `Min Bars Between Signals` — how many bars must pass between two Buy X or two CloseV signals.
**Tip:**
If you see too many amplified signals, increase `Min Bars Between Signals`.
If you want more activity, decrease it.
### 3.5. Alerts
* `Buy Alerts / Buy X Alerts / Close Alerts / CloseV Alerts` — choose which signal types should trigger alerts.
* `One Alert Per Bar` — when enabled, alerts are triggered only once per bar (recommended for H1–H4).
Alerts are generated via `alert()`, with messages that include signal type, ticker, timeframe and current price.
---
## 4. How to trade with White Crow
### 4.1. Recommended timeframes
* 📌 **Main focus: 1H–4H.**
On these timeframes:
* pivots and trend are more stable;
* CCI/RSI reflect meaningful swings;
* **Buy X / CloseV clusters** filter out a lot of intrabar noise.
You can still experiment on M1–M15, but expect more signals and more sensitivity to noise.
### 4.2. Reading the signals step by step
1. **Start with context**
* Look at **Market Trend / Last Bottom / Last Top** in the info panel.
* See where price is relative to these points: near resistance, near support, inside a range, etc.
2. **Identify zones of interest**
* Use pivots and order blocks as potential support/resistance areas.
* Wait for price to approach these zones.
3. **Watch the signals**
* **Buy** — early sign of local oversold conditions.
* **Buy X** — amplified cluster signal; more weight than a single Buy.
* **Close** — early warning of potential exhaustion in the current move.
* **CloseV** — amplified cluster exit/reversal signal.
4. **Practical approach**
* In a *Bullish* trend:
* focus on **Buy / Buy X** near bottoms and demand blocks;
* use **Close / CloseV** for partial profit-taking or tightening stops.
* In a *Bearish* trend:
* focus on **Close / CloseV** near tops and supply blocks;
* use **Buy / Buy X** mainly for countertrend scalps with strict risk control.
---
## 5. Important notes and disclaimer
1. **Buy X / CloseV are stronger — but not “magic” signals.**
They are statistically more meaningful than single Buy/Close signals because:
* they require multiple confirmations within a cluster;
* they are time-filtered.
However, **false signals are still possible**, especially in news spikes and low-liquidity conditions.
2. **Best performance on higher timeframes (1H–4H).**
Here, Buy X and CloseV usually reflect genuine shifts in supply/demand rather than micro noise.
3. **This is a confirmation tool, not a complete system.**
Pro Trading White Crow:
* does not manage risk;
* does not define position size or stop-loss;
* does not replace your own analysis.
Always use its signals as **one of several confluence factors** together with structure, trend, price action, volume, and your trading plan.
4. **Educational purpose only.**
This script and description are for educational and analytical purposes only.
They **do not constitute investment advice or a guarantee of profit**.
You are fully responsible for all trading decisions and risk management.
---
---
## White Crow — кластерные сигналы разворота + структура рынка
> Индикатор помогает читать рыночную структуру (пивоты, тренд, последние экстремумы) и находить потенциальные развороты через кластеры сигналов CCI/RSI. Это *не* готовая торговая система и *не* гарантия результата — а инструмент для фильтрации и подтверждения ваших собственных идей по рынку.
---
## 1. Концепция
White Crow объединяет три ключевых блока:
1. **Пивоты и структура рынка**
Автоматически находит **локальные вершины и впадины** и на их основе формирует трендовое смещение: *Bullish / Bearish / Sideways*.
В правом верхнем углу — компактная панель с текущим трендом и ценами **Last Bottom / Last Top**.
2. **Моментум и зоны перегрева**
Внутри используются:
* **CCI** с фиксированными уровнями `+100 / -100`;
* опциональный **фильтр RSI** с уровнями перепроданности/перекупленности (`20 / 80`).
По ним строятся базовые сигналы *Buy / Close*.
3. **Кластерные сигналы Buy X / CloseV**
Скрипт отслеживает **кластеры сигналов внутри окна в 4 бара** и выделяет более редкие, «усиленные» события:
* **Buy X** — кластерный сигнал покупки (несколько buy-условий подряд);
* **CloseV** — кластерный сигнал выхода/разворота.
Именно **Buy X и CloseV являются наиболее сильными и достоверными сигналами индикатора**, так как возникают при повторяющемся выполнении условий, а не на одном баре. Лучше всего они работают **на старших таймфреймах (1–4 часа)**, где отражают реальное смещение баланса спроса/предложения, а не рыночный шум.
> ⚠️ Важно: Buy X и CloseV — *это всего лишь сигналы*. Они должны использоваться **как один из факторов подтверждения** вашего видения структуры рынка (уровни, тренд, price action, объём и т.д.), а не как единственная причина для входа или выхода.
---
## 2. Как это работает
### 2.1. Пивоты и определение тренда
* Индикатор строит **структуру в стиле зигзага**:
после локального максимума, когда цена откатывает вниз на заданный процент (`pivotSigma`), отмечается **Top**;
после локального минимума, когда цена откатывает вверх на тот же процент, отмечается **Bottom**.
* По последовательности последних вершин и впадин определяется тренд:
* *Bullish* — последний минимум выше предыдущего (HL);
* *Bearish* — последний максимум ниже предыдущего (LH);
* иначе — *Sideways*.
* В информационной таблице отображаются:
* **Market Trend** — Bullish / Bearish / Sideways;
* **Last Bottom / Last Top** с адаптивным количеством знаков (подходит под крипту, форекс, акции и т.д.).
### 2.2. Базовые сигналы Buy / Close
* **Условие для Buy (лонг):**
* `CCI < -100` (зона перепроданности),
* при включённом фильтре — `RSI < 20`.
* **Условие для Close (шорт/выход):**
* `CCI > +100` (зона перекупленности),
* при включённом фильтре — `RSI > 80`.
По этим условиям индикатор рисует обычные метки **Buy** и **Close**.
### 2.3. Кластеры: Buy X и CloseV
Чтобы отсеять лишний шум, индикатор оценивает не только текущий бар, но и **4 последних бара**:
* `buy_count` — сколько раз условие на покупку выполнялось за последние 4 бара;
* `sell_count` — сколько раз условие на продажу/выход выполнялось за последние 4 бара.
Далее:
* **Buy X** появляется, когда:
* `buy_count ≥ 2` (минимум на 2 из 4 баров были условия для покупки),
* соблюдён фильтр по времени между усиленными сигналами (`Min Bars Between Signals`).
* **CloseV** появляется, когда:
* `sell_count ≥ 2`,
* прошло достаточно баров с момента предыдущего CloseV.
> ✅ Поэтому **Buy X и CloseV заметно сильнее и надёжнее одиночных Buy/Close**, особенно на **таймфреймах 1–4 часа**: рынок несколько раз подряд подтверждает один и тот же перегрев/разрядку момента.
### 2.4. Order Blocks
* При включённом `Show Order Blocks` индикатор выделяет **импульсные свечи**, чьё тело больше заданного множителя ATR.
* По таким свечам строятся цветные прямоугольники — **потенциальные блоки ордеров** (области поддержек/сопротивлений, где ранее проходил крупный объём).
---
## 3. Настройки и кастомизация
Настройки сгруппированы в привычные разделы TradingView.
### 3.1. Pivot Settings
* `Show Pivots` — включить/выключить метки **Top / Bottom**.
* `Sigma (% retracement)` — чувствительность к пивотам (минимальная глубина отката в процентах).
* Цвета Top/Bottom — визуальная настройка.
**Совет:**
На H1–H4 можно оставить значения близкие к стандартным.
На младших ТФ уменьшайте `Sigma`, если нужна более детальная структура.
### 3.2. CCI / RSI Settings
* `CCI Period` — период CCI (по умолчанию короткий, для более быстрой реакции).
* `Enable RSI Filter` / `RSI Period` — включение и длина RSI-фильтра.
* Уровни RSI фиксированы: **20 / 80**, выделяя сильную перепроданность/перекупленность.
**Использование:**
* Для более консервативной торговли — держите фильтр RSI включённым.
* Для более частых сигналов (скальпинг и т.п.) — можно фильтр отключить.
### 3.3. Order Blocks
* `Show Order Blocks` — отображение блоков ордеров.
* `Block Threshold (ATR multiplier)` — насколько большой должна быть свеча относительно ATR, чтобы считаться значимой.
### 3.4. Signals & Filters
* `Show Buy / Show Buy X / Show Close / Show CloseV` — выбор типов отображаемых меток.
* `Enable Time Filter` — включение минимального интервала между усиленными сигналами.
* `Min Bars Between Signals` — сколько баров должно пройти между двумя Buy X или двумя CloseV.
**Совет:**
Если усиленных сигналов слишком много — увеличьте `Min Bars Between Signals`.
Если хотите больше активности — уменьшите это значение.
### 3.5. Alerts
* `Buy Alerts / Buy X Alerts / Close Alerts / CloseV Alerts` — выбор типов сигналов для алертов.
* `One Alert Per Bar` — при включении алерты отправляются один раз на бар (рекомендуется для H1–H4).
Алерты формируются через `alert()` с сообщением, включающим тип сигнала, тикер, таймфрейм и текущую цену.
---
## 4. Как использовать White Crow в торговле
### 4.1. Рекомендуемые таймфреймы
* 📌 **Основной фокус: 1–4 часа.**
На этих ТФ:
* структура по пивотам и тренд более стабильны;
* CCI/RSI отражают существенные ценовые колебания;
* кластеры **Buy X / CloseV** лучше отсеивают шум.
На M1–M15 индикатор тоже можно применять, но нужно быть готовым к большему количеству сигналов и чувствительности к микродвижениям.
### 4.2. Пошаговое чтение сигналов
1. **Начните с контекста**
* Посмотрите на **Market Trend / Last Bottom / Last Top** в панели.
* Определите, где находитесь относительно этих уровней: у сопротивления, у поддержки, внутри диапазона и т.п.
2. **Найдите зоны интереса**
* Используйте пивоты и order blocks как потенциальные области спроса/предложения.
* Ждите подхода цены к этим зонам.
3. **Отслеживайте сигналы**
* **Buy** — ранний признак локальной перепроданности.
* **Buy X** — усиленный кластерный сигнал, более значимый, чем одиночный Buy.
* **Close** — ранний сигнал возможного ослабления текущего движения.
* **CloseV** — усиленный кластерный сигнал выхода/разворота.
4. **Практическое применение**
* В *бычьем* тренде:
* фокус на **Buy / Buy X** возле впадин и зон спроса;
* **Close / CloseV** использовать для частичной фиксации и подтягивания стопа.
* В *медвежьем* тренде:
* фокус на **Close / CloseV** возле вершин и зон предложения;
* **Buy / Buy X** — для аккуратных контртрендовых входов с жестким риском.
---
## 5. Важные замечания и дисклеймер
1. **Buy X / CloseV сильнее, но не «волшебные» сигналы.**
Они статистически более значимы, чем одиночные Buy/Close, потому что:
* требуют нескольких подтверждений в кластере;
* фильтруются по времени.
Однако **ложные срабатывания всё равно возможны**, особенно на новостях и в условиях низкой ликвидности.
2. **Оптимальная область применения — старшие ТФ (1–4 часа).**
Здесь Buy X и CloseV обычно отражают реальное изменение баланса спроса/предложения, а не шум.
3. **Это инструмент подтверждения, а не полноценная система.**
Pro Trading White Crow:
* не управляет рисками;
* не считает размер позиции и уровень стоп-лосса;
* не заменяет ваше собственное видение рынка.
Всегда используйте его сигналы **как один из факторов согласованности** вместе со структурой, трендом, price action, объёмом и персональным торговым планом.
4. **Образовательный характер.**
Скрипт и описание предназначены для обучения и анализа графиков.
Они **не являются инвестиционной рекомендацией и не гарантируют прибыль**.
Вы самостоятельно принимаете все торговые решения и несёте полную ответственность за риск.
---

Stochastic Hash Strat [Hash Capital Research]# Stochastic Hash Strategy by Hash Capital Research
## 🎯 What Is This Strategy?
The **Stochastic Slow Strategy** is a momentum-based trading system that identifies oversold and overbought market conditions to capture mean-reversion opportunities. Think of it as a "buy low, sell high" approach with smart mathematical filters that remove emotion from your trading decisions.
Unlike fast-moving indicators that generate excessive noise, this strategy uses **smoothed stochastic oscillators** to identify only the highest-probability setups when momentum truly shifts.
---
## 💡 Why This Strategy Works
Most traders fail because they:
- **Chase prices** after big moves (buying high, selling low)
- **Overtrade** in choppy, directionless markets
- **Exit too early** or hold losses too long
This strategy solves all three problems:
1. **Entry Discipline**: Only trades when the stochastic oscillator crosses in extreme zones (oversold for longs, overbought for shorts)
2. **Cooldown Filter**: Prevents revenge trading by forcing a waiting period after each trade
3. **Fixed Risk/Reward**: Pre-defined stop-loss and take-profit levels ensure consistent risk management
**The Math Behind It**: The stochastic oscillator measures where the current price sits relative to its recent high-low range. When it's below 25, the market is oversold (time to buy). When above 70, it's overbought (time to sell). The crossover with its moving average confirms momentum is shifting.
---
## 📊 Best Markets & Timeframes
### ⭐ OPTIMAL PERFORMANCE:
**Crude Oil (WTI) - 12H Timeframe**
- **Why it works**: Oil markets have predictable volatility patterns and respect technical levels
**AAVE/USD - 4H to 12H Timeframe**
- **Why it works**: DeFi tokens exhibit strong momentum cycles with clear extremes
### ✅ Also Works Well On:
- **BTC/USD** (12H, Daily) - Lower frequency but high win rate
- **ETH/USD** (8H, 12H) - Balanced volatility and liquidity
- **Gold (XAU/USD)** (Daily) - Classic mean-reversion asset
- **EUR/USD** (4H, 8H) - Lower volatility, requires patience
### ❌ Avoid Using On:
- Timeframes below 4H (too much noise)
- Low-liquidity altcoins (wide spreads kill performance)
- Strongly trending markets without pullbacks (Bitcoin in 2021)
- News-driven instruments during major events
---
## 🎛️ Understanding The Settings
### Core Stochastic Parameters
**Stochastic Length (Default: 16)**
- Controls the lookback period for price comparison
- Lower = faster reactions, more signals (10-14 for volatile markets)
- Higher = smoother signals, fewer trades (16-21 for stable markets)
- **Pro tip**: Use 10 for crypto 4H, 16 for commodities 12H
**Overbought Level (Default: 70)**
- Threshold for short entries
- Lower values (65-70) = more trades, earlier entries
- Higher values (75-80) = fewer but higher-conviction trades
- **Sweet spot**: 70 works for most assets
**Oversold Level (Default: 25)**
- Threshold for long entries
- Higher values (25-30) = more trades, earlier entries
- Lower values (15-20) = fewer but stronger bounce setups
- **Sweet spot**: 20-25 depending on market conditions
**Smooth K & Smooth D (Default: 7 & 3)**
- Additional smoothing to filter out whipsaws
- K=7 makes the indicator slower and more reliable
- D=3 is the signal line that confirms the trend
- **Don't change these unless you know what you're doing**
---
### Risk Management
**Stop Loss % (Default: 2.2%)**
- Automatically exits losing trades
- Should be 1.5x to 2x your average market volatility
- Too tight = death by a thousand cuts
- Too wide = uncontrolled losses
- **Calibration**: Check ATR indicator and set SL slightly above it
**Take Profit % (Default: 7%)**
- Automatically exits winning trades
- Should be 2.5x to 3x your stop loss (reward-to-risk ratio)
- This default gives 7% / 2.2% = 3.18:1 R:R
- **The golden rule**: Never have R:R below 2:1
---
### Trade Filters
**Bar Cooldown Filter (Default: ON, 3 bars)**
- **What it does**: Forces you to wait X bars after closing a trade before entering a new one
- **Why it matters**: Prevents emotional revenge trading and overtrading in choppy markets
- **Settings guide**:
- 3 bars = Standard (good for most cases)
- 5-7 bars = Conservative (oil, slow-moving assets)
- 1-2 bars = Aggressive (only for experienced traders)
**Exit on Opposite Extreme (Default: ON)**
- Closes your long when stochastic hits overbought (and vice versa)
- Acts as an early profit-taking mechanism
- **Leave this ON** unless you're testing other exit strategies
**Divergence Filter (Default: OFF)**
- Looks for price/momentum divergences for additional confirmation
- **When to enable**: Trending markets where you want fewer but higher-quality trades
- **Keep OFF for**: Mean-reverting markets (oil, forex, most of the time)
---
## 🚀 Quick Start Guide
### Step 1: Set Up in TradingView
1. Open TradingView and navigate to your chart
2. Click "Pine Editor" at the bottom
3. Copy and paste the strategy code
4. Click "Add to Chart"
5. The strategy will appear in a separate pane below your price chart
### Step 2: Choose Your Market
**If you're trading Crude Oil:**
- Timeframe: 12H
- Keep all default settings
- Watch for signals during London/NY overlap (8am-11am EST)
**If you're trading AAVE or crypto:**
- Timeframe: 4H or 12H
- Consider these adjustments:
- Stochastic Length: 10-14 (faster)
- Oversold: 20 (more aggressive)
- Take Profit: 8-10% (higher targets)
### Step 3: Wait for Your First Signal
**LONG Entry** (Green circle appears):
- Stochastic crosses up below oversold level (25)
- Price likely near recent lows
- System places limit order at take profit and stop loss
**SHORT Entry** (Red circle appears):
- Stochastic crosses down above overbought level (70)
- Price likely near recent highs
- System places limit order at take profit and stop loss
**EXIT** (Orange circle):
- Position closes either at stop, target, or opposite extreme
- Cooldown period begins
### Step 4: Let It Run
The biggest mistake? **Interfering with the system.**
- Don't close trades early because you're scared
- Don't skip signals because you "have a feeling"
- Don't increase position size after a big win
- Don't revenge trade after a loss
**Follow the system or don't use it at all.**
---
### Important Risks:
1. **Drawdown Pain**: You WILL experience losing streaks of 5-7 trades. This is mathematically normal.
2. **Whipsaw Markets**: Choppy, range-bound conditions can trigger multiple small losses.
3. **Gap Risk**: Overnight gaps can cause your actual fill to be worse than the stop loss.
4. **Slippage**: Real execution prices differ from backtested prices (factor in 0.1-0.2% slippage).
---
## 🔧 Optimization Guide
### When to Adjust Settings:
**Market Volatility Increased?**
- Widen stop loss by 0.5-1%
- Increase take profit proportionally
- Consider increasing cooldown to 5-7 bars
**Getting Too Few Signals?**
- Decrease stochastic length to 10-12
- Increase oversold to 30, decrease overbought to 65
- Reduce cooldown to 2 bars
**Getting Too Many Losses?**
- Increase stochastic length to 18-21 (slower, smoother)
- Enable divergence filter
- Increase cooldown to 5+ bars
- Verify you're on the right timeframe
### A/B Testing Method:
1. **Run default settings for 50 trades** on your chosen market
2. Document: Win rate, profit factor, max drawdown, emotional tolerance
3. **Change ONE variable** (e.g., oversold from 25 to 20)
4. Run another 50 trades
5. Compare results
6. Keep the better version
**Never change multiple settings at once** or you won't know what worked.
---
## 📚 Educational Resources
### Key Concepts to Learn:
**Stochastic Oscillator**
- Developed by George Lane in the 1950s
- Measures momentum by comparing closing price to price range
- Formula: %K = (Close - Low) / (High - Low) × 100
- Similar to RSI but more sensitive to price movements
**Mean Reversion vs. Trend Following**
- This is a **mean reversion** strategy (price returns to average)
- Works best in ranging markets with defined support/resistance
- Fails in strong trending markets (2017 Bitcoin, 2020 Tech stocks)
- Complement with trend filters for better results
**Risk:Reward Ratio**
- The cornerstone of profitable trading
- Winning 40% of trades with 3:1 R:R = profitable
- Winning 60% of trades with 1:1 R:R = breakeven (after fees)
- **This strategy aims for 45% win rate with 2.5-3:1 R:R**
### Recommended Reading:
- *"Trading Systems and Methods"* by Perry Kaufman (Chapter on Oscillators)
- *"Mean Reversion Trading Systems"* by Howard Bandy
- *"The New Trading for a Living"* by Dr. Alexander Elder
---
## 🛠️ Troubleshooting
### "I'm not seeing any signals!"
**Check:**
- Is your timeframe 4H or higher?
- Is the stochastic actually reaching extreme levels (check if your asset is stuck in middle range)?
- Is cooldown still active from a previous trade?
- Are you on a low-liquidity pair?
**Solution**: Switch to a more volatile asset or lower the overbought/oversold thresholds.
---
### "The strategy keeps losing money!"
**Check:**
- What's your win rate? (Below 35% is concerning)
- What's your profit factor? (Below 0.8 means serious issues)
- Are you trading during major news events?
- Is the market in a strong trend?
**Solution**:
1. Verify you're using recommended markets/timeframes
2. Increase cooldown period to avoid choppy markets
3. Reduce position size to 5% while you diagnose
4. Consider switching to daily timeframe for less noise
---
### "My stop losses keep getting hit!"
**Check:**
- Is your stop loss tighter than the average ATR?
- Are you trading during high-volatility sessions?
- Is slippage eating into your buffer?
**Solution**:
1. Calculate the 14-period ATR
2. Set stop loss to 1.5x the ATR value
3. Avoid trading right after market open or major news
4. Factor in 0.2% slippage for crypto, 0.1% for oil
---
## 💪 Pro Tips from the Trenches
### Psychological Discipline
**The Three Deadly Sins:**
1. **Skipping signals** - "This one doesn't feel right"
2. **Early exits** - "I'll just take profit here to be safe"
3. **Revenge trading** - "I need to make back that loss NOW"
**The Solution:** Treat your strategy like a business system. Would McDonald's skip making fries because the cashier "doesn't feel like it today"? No. Systems work because of consistency.
---
### Position Management
**Scaling In/Out** (Advanced)
- Enter 50% position at signal
- Add 50% if stochastic reaches 10 (oversold) or 90 (overbought)
- Exit 50% at 1.5x take profit, let the rest run
**This is NOT for beginners.** Master the basic system first.
---
### Market Awareness
**Oil Traders:**
- OPEC meetings = volatility spikes (avoid or widen stops)
- US inventory reports (Wed 10:30am EST) = avoid trading 2 hours before/after
- Summer driving season = different patterns than winter
**Crypto Traders:**
- Monday-Tuesday = typically lower volatility (fewer signals)
- Thursday-Sunday = higher volatility (more signals)
- Avoid trading during exchange maintenance windows
---
## ⚖️ Legal Disclaimer
This trading strategy is provided for **educational purposes only**.
- Past performance does not guarantee future results
- Trading involves substantial risk of loss
- Only trade with capital you can afford to lose
- No one associated with this strategy is a licensed financial advisor
- You are solely responsible for your trading decisions
**By using this strategy, you acknowledge that you understand and accept these risks.**
---
## 🙏 Acknowledgments
Strategy development inspired by:
- George Lane's original Stochastic Oscillator work
- Modern quantitative trading research
- Community feedback from hundreds of backtests
Built with ❤️ for retail traders who want systematic, disciplined approaches to the markets.
---
**Good luck, stay disciplined, and trade the system, not your emotions.**

Market Electromagnetic Field [The_lurker]Market Electromagnetic Field
An innovative analytical indicator that presents a completely new model for understanding market dynamics, inspired by the laws of electromagnetic physics — but it's not a rhetorical metaphor, rather a complete mathematical system.
Unlike traditional indicators that focus on price or momentum, this indicator portrays the market as a closed physical system, where:
⚡ Candles = Electric charges (positive at bullish close, negative at bearish)
⚡ Buyers and Sellers = Two opposing poles where pressure accumulates
⚡ Market tension = Voltage difference between the poles
⚡ Price breakout = Electrical discharge after sufficient energy accumulation
█ Core Concept
Markets don't move randomly, but follow a clear physical cycle:
Accumulation → Tension → Discharge → Stabilization → New Accumulation
When charges accumulate (through strong candles with high volume) and exceed a certain "electrical capacitance" threshold, the indicator issues a "⚡ DISCHARGE IMMINENT" alert — meaning a price explosion is imminent, giving the trader an opportunity to enter before the move begins.
█ Competitive Advantage
- Predictive forecasting (not confirmatory after the event)
- Smart multi-layer filtering reduces false signals
- Animated 3D visual representation makes reading price conditions instant and intuitive — without need for number analysis
█ Theoretical Physical Foundation
The indicator doesn't use physical terms for decoration, but applies mathematical laws with precise market adjustments:
⚡ Coulomb's Law
Physics: F = k × (q₁ × q₂) / r²
Market: Field Intensity = 4 × norm_positive × norm_negative
Peaks at equilibrium (0.5 × 0.5 × 4 = 1.0), and decreases at dominance — because conflict increases at parity.
⚡ Ohm's Law
Physics: V = I × R
Market: Voltage = norm_positive − norm_negative
Measures balance of power:
- +1 = Absolute buying dominance
- −1 = Absolute selling dominance
- 0 = Balance
⚡ Capacitance
Physics: C = Q / V
Market: Capacitance = |Voltage| × Field Intensity
Represents stored energy ready for discharge — increases with bias combined with high interaction.
⚡ Electrical Discharge
Physics: Occurs when exceeding insulation threshold
Market: Discharge Probability = min(Capacitance / Discharge Threshold, 1.0)
When ≥ 0.9: "⚡ DISCHARGE IMMINENT"
📌 Key Note:
Maximum capacitance doesn't occur at absolute dominance (where field intensity = 0), nor at perfect balance (where voltage = 0), but at moderate bias (±30–50%) with high interaction (field intensity > 25%) — i.e., in moments of "pressure before breakout".
█ Detailed Calculation Mechanism
⚡ Phase 1: Candle Polarity
polarity = (close − open) / (high − low)
- +1.0: Complete bullish candle (Bullish Marubozu)
- −1.0: Complete bearish candle (Bearish Marubozu)
- 0.0: Doji (no decision)
- Intermediate values: Represent the ratio of candle body to its range — reducing the effect of long-shadow candles
⚡ Phase 2: Volume Weight
vol_weight = volume / SMA(volume, lookback)
A candle with 150% of average volume = 1.5x stronger charge
⚡ Phase 3: Adaptive Factor
adaptive_factor = ATR(lookback) / SMA(ATR, lookback × 2)
- In volatile markets: Increases sensitivity
- In quiet markets: Reduces noise
- Always recommended to keep it enabled
⚡ Phase 4–6: Charge Accumulation and Normalization
Charges are summed over lookback candles, then ratios are normalized:
norm_positive = positive_charge / total_charge
norm_negative = negative_charge / total_charge
So that: norm_positive + norm_negative = 1 — for easier comparison
⚡ Phase 7: Field Calculations
voltage = norm_positive − norm_negative
field_intensity = 4 × norm_positive × norm_negative × field_sensitivity
capacitance = |voltage| × field_intensity
discharge_prob = min(capacitance / discharge_threshold, 1.0)
█ Settings
⚡ Electromagnetic Model
Lookback Period
- Default: 20
- Range: 5–100
- Recommendations:
- Scalping: 10–15
- Day Trading: 20
- Swing: 30–50
- Investing: 50–100
Discharge Threshold
- Default: 0.7
- Range: 0.3–0.95
- Recommendations:
- Speed + Noise: 0.5–0.6
- Balance: 0.7
- High Accuracy: 0.8–0.95
Field Sensitivity
- Default: 1.0
- Range: 0.5–2.0
- Recommendations:
- Amplify Conflict: 1.2–1.5
- Natural: 1.0
- Calm: 0.5–0.8
Adaptive Mode
- Default: Enabled
- Always keep it enabled
🔬 Dynamic Filters
All enabled filters must pass for discharge signal to appear.
Volume Filter
- Condition: volume > SMA(volume) × vol_multiplier
- Function: Excludes "weak" candles not supported by volume
- Recommendation: Enabled (especially for stocks and forex)
Volatility Filter
- Condition: STDEV > SMA(STDEV) × 0.5
- Function: Ignores sideways stagnation periods
- Recommendation: Always enabled
Trend Filter
- Condition: Voltage alignment with fast/slow EMA
- Function: Reduces counter-trend signals
- Recommendation: Enabled for swing/investing only
Volume Threshold
- Default: 1.2
- Recommendations:
- 1.0–1.2: High sensitivity
- 1.5–2.0: Exclusive to high volume
🎨 Visual Settings
Settings improve visual reading experience — don't affect calculations.
Scale Factor
- Default: 600
- Higher = Larger scene (200–1200)
Horizontal Shift
- Default: 180
- Horizontal shift to the left — to focus on last candle
Pole Size
- Default: 60
- Base sphere size (30–120)
Field Lines
- Default: 8
- Number of field lines (4–16) — 8 is ideal balance
Colors
- Green/Red/Blue/Orange
- Fully customizable
█ Visual Representation: A Visual Language for Diagnosing Price Conditions
✨ Design Philosophy
The representation isn't "decoration", but a complete cognitive model — each element carries information, and element interaction tells a complete story.
The brain perceives changes in size, color, and movement 60,000 times faster than reading numbers — so you can "sense" the change before your eye finishes scanning.
═════════════════════════════════════════════════════════════
🟢 Positive Pole (Green Sphere — Left)
═════════════════════════════════════════════════════════════
What does it represent?
Active buying pressure accumulation — not just an uptrend, but real demand force supported by volume and volatility.
● Dynamic Size
Size = pole_size × (0.7 + norm_positive × 0.6)
- 70% of base size = No significant charge
- 130% of base size = Complete dominance
- The larger the sphere: Greater buyer dominance, higher probability of bullish continuation
Size Interpretation:
- Large sphere (>55%): Strong buying pressure — Buyers dominate
- Medium sphere (45–55%): Relative balance with buying bias
- Small sphere (<45%): Weak buying pressure — Sellers dominate
● Lighting and Transparency
- 20% transparency (when Bias = +1): Pole currently active — Bullish direction
- 50% transparency (when Bias ≠ +1): Pole inactive — Not the prevailing direction
Lighting = Current activity, while Size = Historical accumulation
● Pulsing Inner Glow
A smaller sphere pulses automatically when Bias = +1:
inner_pulse = 0.4 + 0.1 × sin(anim_time × 3)
Symbolizes continuity of buy order flow — not static dominance.
● Orbital Rings
Two rings rotating at different speeds and directions:
- Inner: 1.3× sphere size — Direct influence range
- Outer: 1.6× sphere size — Extended influence range
Represent "influence zone" of buyers:
- Continuous rotation = Stability and momentum
- Slowdown = Momentum exhaustion
● Percentage
Displayed below sphere: norm_positive × 100
- >55% = Clear dominance
- 45–55% = Balance
- <45% = Weakness
═════════════════════════════════════════════════════════════
🔴 Negative Pole (Red Sphere — Right)
═════════════════════════════════════════════════════════════
What does it represent?
Active selling pressure accumulation — whether cumulative selling (smart distribution) or panic selling (position liquidation).
● Visual Dynamics
Same size, lighting, and inner glow mechanism — but in red.
Key Difference:
- Rotation is reversed (counter-clockwise)
- Visually distinguishes "buy flow" from "sell flow"
- Allows reading direction at a glance — even for colorblind users
📌 Pole Reading Summary:
🟢 Large + Bright green sphere = Active buying force
🔴 Large + Bright red sphere = Active selling force
🟢🔴 Both large but dim = Energy accumulation (before discharge)
⚪ Both small = Stagnation / Low liquidity
═════════════════════════════════════════════════════════════
🔵 Field Lines (Curved Blue Lines)
═════════════════════════════════════════════════════════════
What do they represent?
Energy flow paths between poles — the arena where price battle is fought.
● Number of Lines
4–16 lines (Default: 8)
More lines: Greater sense of "interaction density"
● Arc Height
arc_h = (i − half_lines) × 15 × field_intensity × 2
- High field intensity = Highly elevated lines (like waves)
- Low intensity = Nearly straight lines
● Oscillating Transparency
transp = 30 + phase × 40
where phase = sin(anim_time × 2 + i × 0.5) × 0.5 + 0.5
Creates illusion of "flowing current" — not static lines
● Asymmetric Curvature
- Upper lines curve upward
- Lower lines curve downward
- Adds 3D depth and shows "pressure" direction
⚡ Pro Tip:
When you see lines suddenly "contract" (straighten), while both spheres are large — this is an early indicator of impending discharge, because the interaction is losing its flexibility.
═════════════════════════════════════════════════════════════
⚪ Moving Particles
═════════════════════════════════════════════════════════════
What do they represent?
Real liquidity flow in the market — who's driving price right now.
● Number and Movement
- 6 particles covering most field lines
- Move sinusoidally along the arc:
t = (sin(phase_val) + 1) / 2
- High speed = High trading activity
- Clustering at a pole = That side's control
● Color Gradient
From green (at positive pole) to red (at negative)
Shows "energy transformation":
- Green particle = Pure buying energy
- Orange particle = Conflict zone
- Red particle = Pure selling energy
📌 How to Read Them?
- Moving left to right (🟢 → 🔴): Buy flow → Bullish push
- Moving right to left (🔴 → 🟢): Sell flow → Bearish push
- Clustered in middle: Balanced conflict — Wait for breakout
═════════════════════════════════════════════════════════════
🟠 Discharge Zone (Orange Glow — Center)
═════════════════════════════════════════════════════════════
What does it represent?
Point of stored energy accumulation not yet discharged — heart of the early warning system.
● Glow Stages
Initial Warning (discharge_prob > 0.3):
- Dim orange circle (70% transparency)
- Meaning: Watch, don't enter yet
High Tension (discharge_prob ≥ 0.7):
- Stronger glow + "⚠️ HIGH TENSION" text
- Meaning: Prepare — Set pending orders
Imminent Discharge (discharge_prob ≥ 0.9):
- Bright glow + "⚡ DISCHARGE IMMINENT" text
- Meaning: Enter with direction (after candle confirmation)
● Layered Glow Effect (Glow Layering)
3 concentric circles with increasing transparency:
- Inner: 20%
- Middle: 35%
- Outer: 50%
Result: Realistic aura resembling actual electrical discharge.
📌 Why in the Center?
Because discharge always starts from the relative balance zone — where opposing pressures meet.
═════════════════════════════════════════════════════════════
📊 Voltage Meter (Bottom of Scene)
═════════════════════════════════════════════════════════════
What does it represent?
Simplified numeric indicator of voltage difference — for those who prefer numerical reading.
● Components
- Gray bar: Full range (−100% to +100%)
- Green fill: Positive voltage (extends right)
- Red fill: Negative voltage (extends left)
- Lightning symbol (⚡): Above center — reminder it's an "electrical gauge"
- Text value: Like "+23.4%" — in direction color
● Voltage Reading Interpretation
+50% to +100%:
Overwhelming buying dominance — Beware of saturation, may precede correction
+20% to +50%:
Strong buying dominance — Suitable for buying with trend
+5% to +20%:
Slight bullish bias — Wait for additional confirmation
−5% to +5%:
Balance/Neutral — Avoid entry or wait for breakout
−5% to −20%:
Slight bearish bias — Wait for confirmation
−20% to −50%:
Strong selling dominance — Suitable for selling with trend
−50% to −100%:
Overwhelming selling dominance — Beware of saturation, may precede bounce
═════════════════════════════════════════════════════════════
📈 Field Strength Indicator (Top of Scene)
═════════════════════════════════════════════════════════════
What it displays: "Field: XX.X%"
Meaning: Strength of conflict between buyers and sellers.
● Reading Interpretation
0–5%:
- Appearance: Nearly straight lines, transparent
- Meaning: Complete control by one side
- Strategy: Trend Following
5–15%:
- Appearance: Slight curvature
- Meaning: Clear direction with light resistance
- Strategy: Enter with trend
15–25%:
- Appearance: Medium curvature, clear lines
- Meaning: Balanced conflict
- Strategy: Range trading or waiting
25–35%:
- Appearance: High curvature, clear density
- Meaning: Strong conflict, high uncertainty
- Strategy: Volatility trading or prepare for discharge
35%+:
- Appearance: Very high lines, strong glow
- Meaning: Peak tension
- Strategy: Best discharge opportunities
📌 Golden Relationship:
Highest discharge probability when:
Field Strength (25–35%) + Voltage (±30–50%) + High Volume
← This is the "red zone" to monitor carefully.
█ Comprehensive Visual Reading
To read market condition at a glance, follow this sequence:
Step 1: Which sphere is larger?
- 🟢 Green larger ← Dominant buying pressure
- 🔴 Red larger ← Dominant selling pressure
- Equal ← Balance/Conflict
Step 2: Which sphere is bright?
- 🟢 Green bright ← Current bullish direction
- 🔴 Red bright ← Current bearish direction
- Both dim ← Neutral/No clear direction
Step 3: Is there orange glow?
- None ← Discharge probability <30%
- 🟠 Dim glow ← Discharge probability 30–70%
- 🟠 Strong glow with text ← Discharge probability >70%
Step 4: What's the voltage meter reading?
- Strong positive ← Confirms buying dominance
- Strong negative ← Confirms selling dominance
- Near zero ← No clear direction
█ Practical Visual Reading Examples
Example 1: Ideal Buy Opportunity ⚡🟢
- Green sphere: Large and bright with inner pulse
- Red sphere: Small and dim
- Orange glow: Strong with "DISCHARGE IMMINENT" text
- Voltage meter: +45%
- Field strength: 28%
Interpretation: Strong accumulated buying pressure, bullish explosion imminent
Example 2: Ideal Sell Opportunity ⚡🔴
- Green sphere: Small and dim
- Red sphere: Large and bright with inner pulse
- Orange glow: Strong with "DISCHARGE IMMINENT" text
- Voltage meter: −52%
- Field strength: 31%
Interpretation: Strong accumulated selling pressure, bearish explosion imminent
Example 3: Balance/Wait ⚖️
- Both spheres: Approximately equal in size
- Lighting: Both dim
- Orange glow: Strong
- Voltage meter: +3%
- Field strength: 24%
Interpretation: Strong conflict without clear winner, wait for breakout
Example 4: Clear Uptrend (No Discharge) 📈
- Green sphere: Large and bright
- Red sphere: Very small and dim
- Orange glow: None
- Voltage meter: +68%
- Field strength: 8%
Interpretation: Clear buying control, limited conflict, suitable for following bullish trend
Example 5: Potential Buying Saturation ⚠️
- Green sphere: Very large and bright
- Red sphere: Very small
- Orange glow: Dim
- Voltage meter: +88%
- Field strength: 4%
Interpretation: Absolute buying dominance, may precede bearish correction
█ Trading Signals
⚡ DISCHARGE IMMINENT
Appearance Conditions:
- discharge_prob ≥ 0.9
- All enabled filters passed
- Confirmed (after candle close)
Interpretation:
- Very large energy accumulation
- Pressure reached critical level
- Price explosion expected within 1–3 candles
How to Trade:
1. Determine voltage direction:
• Positive = Expect rise
• Negative = Expect fall
2. Wait for confirmation candle:
• For rise: Bullish candle closing above its open
• For fall: Bearish candle closing below its open
3. Entry: With next candle's open
4. Stop Loss: Behind last local low/high
5. Target: Risk/Reward ratio of at least 1:2
✅ Pro Tips:
- Best results when combined with support/resistance levels
- Avoid entry if voltage is near zero (±5%)
- Increase position size when field strength > 30%
⚠️ HIGH TENSION
Appearance Conditions:
- 0.7 ≤ discharge_prob < 0.9
Interpretation:
- Market in energy accumulation state
- Likely strong move soon, but not immediate
- Accumulation may continue or discharge may occur
How to Benefit:
- Prepare: Set pending orders at potential breakouts
- Monitor: Watch following candles for momentum candle
- Select: Don't enter every signal — choose those aligned with overall trend
█ Trading Strategies
📈 Strategy 1: Discharge Trading (Basic)
Principle: Enter at "DISCHARGE IMMINENT" in voltage direction
Steps:
1. Wait for "⚡ DISCHARGE IMMINENT"
2. Check voltage direction (+/−)
3. Wait for confirmation candle in voltage direction
4. Enter with next candle's open
5. Stop loss behind last low/high
6. Target: 1:2 or 1:3 ratio
Very high success rate when following confirmation conditions.
📈 Strategy 2: Dominance Following
Principle: Trade with dominant pole (largest and brightest sphere)
Steps:
1. Identify dominant pole (largest and brightest)
2. Trade in its direction
3. Beware when sizes converge (conflict)
Suitable for higher timeframes (H1+).
📈 Strategy 3: Reversal Hunting
Principle: Counter-trend entry under certain conditions
Conditions:
- High field strength (>30%)
- Extreme voltage (>±40%)
- Divergence with price (e.g., new price high with declining voltage)
⚠️ High risk — Use small position size.
📈 Strategy 4: Integration with Technical Analysis
Strong Confirmation Examples:
- Resistance breakout + Bullish discharge = Excellent buy signal
- Support break + Bearish discharge = Excellent sell signal
- Head & Shoulders pattern + Increasing negative voltage = Pattern confirmation
- RSI divergence + High field strength = Potential reversal
█ Ready Alerts
Bullish Discharge
- Condition: discharge_prob ≥ 0.9 + Positive voltage + All filters
- Message: "⚡ Bullish discharge"
- Use: High probability buy opportunity
Bearish Discharge
- Condition: discharge_prob ≥ 0.9 + Negative voltage + All filters
- Message: "⚡ Bearish discharge"
- Use: High probability sell opportunity
✅ Tip: Use these alerts with "Once Per Bar" setting to avoid repetition.
█ Data Window Outputs
Bias
- Values: −1 / 0 / +1
- Interpretation: −1 = Bearish, 0 = Neutral, +1 = Bullish
- Use: For integration in automated strategies
Discharge %
- Range: 0–100%
- Interpretation: Discharge probability
- Use: Monitor tension progression (e.g., from 40% to 85% in 5 candles)
Field Strength
- Range: 0–100%
- Interpretation: Conflict intensity
- Use: Identify "opportunity window" (25–35% ideal for discharge)
Voltage
- Range: −100% to +100%
- Interpretation: Balance of power
- Use: Monitor extremes (potential buying/selling saturation)
█ Optimal Settings by Trading Style
Scalping
- Timeframe: 1M–5M
- Lookback: 10–15
- Threshold: 0.5–0.6
- Sensitivity: 1.2–1.5
- Filters: Volume + Volatility
Day Trading
- Timeframe: 15M–1H
- Lookback: 20
- Threshold: 0.7
- Sensitivity: 1.0
- Filters: Volume + Volatility
Swing Trading
- Timeframe: 4H–D1
- Lookback: 30–50
- Threshold: 0.8
- Sensitivity: 0.8
- Filters: Volatility + Trend
Position Trading
- Timeframe: D1–W1
- Lookback: 50–100
- Threshold: 0.85–0.95
- Sensitivity: 0.5–0.8
- Filters: All filters
█ Tips for Optimal Use
1. Start with Default Settings
Try it first as is, then adjust to your style.
2. Watch for Element Alignment
Best signals when:
- Clear voltage (>│20%│)
- Moderate–high field strength (15–35%)
- High discharge probability (>70%)
3. Use Multiple Timeframes
- Higher timeframe: Determine overall trend
- Lower timeframe: Time entry
- Ensure signal alignment between frames
4. Integrate with Other Tools
- Support/Resistance levels
- Trend lines
- Candle patterns
- Volume indicators
5. Respect Risk Management
- Don't risk more than 1–2% of account
- Always use stop loss
- Don't enter every signal — choose the best
█ Important Warnings
⚠️ Not for Standalone Use
The indicator is an analytical support tool — don't use it isolated from technical or fundamental analysis.
⚠️ Doesn't Predict the Future
Calculations are based on historical data — Results are not guaranteed.
⚠️ Markets Differ
You may need to adjust settings for each market:
- Forex: Focus on Volume Filter
- Stocks: Add Trend Filter
- Crypto: Lower Threshold slightly (more volatile)
⚠️ News and Events
The indicator doesn't account for sudden news — Avoid trading before/during major news.
█ Unique Features
✅ First Application of Electromagnetism to Markets
Innovative mathematical model — Not just an ordinary indicator
✅ Predictive Detection of Price Explosions
Alerts before the move happens — Not after
✅ Multi-Layer Filtering
4 smart filters reduce false signals to minimum
✅ Smart Volatility Adaptation
Automatically adjusts sensitivity based on market conditions
✅ Animated 3D Visual Representation
Makes reading instant — Even for beginners
✅ High Flexibility
Works on all assets: Stocks, Forex, Crypto, Commodities
✅ Built-in Ready Alerts
No complex setup needed — Ready for immediate use
█ Conclusion: When Art Meets Science
Market Electromagnetic Field is not just an indicator — but a new analytical philosophy.
It's the bridge between:
- Physics precision in describing dynamic systems
- Market intelligence in generating trading opportunities
- Visual psychology in facilitating instant reading
The result: A tool that isn't read — but watched, felt, and sensed.
When you see the green sphere expanding, the glow intensifying, and particles rushing rightward — you're not seeing numbers, you're seeing market energy breathing.
⚠️ Disclaimer:
This indicator is for educational and analytical purposes only. It does not constitute financial, investment, or trading advice. Use it in conjunction with your own strategy and risk management. Neither TradingView nor the developer is liable for any financial decisions or losses.
المجال الكهرومغناطيسي للسوق - Market Electromagnetic Field
مؤشر تحليلي مبتكر يقدّم نموذجًا جديدًا كليًّا لفهم ديناميكيات السوق، مستوحى من قوانين الفيزياء الكهرومغناطيسية — لكنه ليس استعارة بلاغية، بل نظام رياضي متكامل.
على عكس المؤشرات التقليدية التي تُركّز على السعر أو الزخم، يُصوّر هذا المؤشر السوق كـنظام فيزيائي مغلق، حيث:
⚡ الشموع = شحنات كهربائية (موجبة عند الإغلاق الصاعد، سالبة عند الهابط)
⚡ المشتريون والبائعون = قطبان متعاكسان يتراكم فيهما الضغط
⚡ التوتر السوقي = فرق جهد بين القطبين
⚡ الاختراق السعري = تفريغ كهربائي بعد تراكم طاقة كافية
█ الفكرة الجوهرية
الأسواق لا تتحرك عشوائيًّا، بل تخضع لدورة فيزيائية واضحة:
تراكم → توتر → تفريغ → استقرار → تراكم جديد
عندما تتراكم الشحنات (من خلال شموع قوية بحجم مرتفع) وتتجاوز "السعة الكهربائية" عتبة معيّنة، يُصدر المؤشر تنبيه "⚡ DISCHARGE IMMINENT" — أي أن انفجارًا سعريًّا وشيكًا، مما يمنح المتداول فرصة الدخول قبل بدء الحركة.
█ الميزة التنافسية
- تنبؤ استباقي (ليس تأكيديًّا بعد الحدث)
- فلترة ذكية متعددة الطبقات تقلل الإشارات الكاذبة
- تمثيل بصري ثلاثي الأبعاد متحرك يجعل قراءة الحالة السعرية فورية وبديهية — دون حاجة لتحليل أرقام
█ الأساس النظري الفيزيائي
المؤشر لا يستخدم مصطلحات فيزيائية للزينة، بل يُطبّق القوانين الرياضية مع تعديلات سوقيّة دقيقة:
⚡ قانون كولوم (Coulomb's Law)
الفيزياء: F = k × (q₁ × q₂) / r²
السوق: شدة الحقل = 4 × norm_positive × norm_negative
تصل لذروتها عند التوازن (0.5 × 0.5 × 4 = 1.0)، وتنخفض عند الهيمنة — لأن الصراع يزداد عند التكافؤ.
⚡ قانون أوم (Ohm's Law)
الفيزياء: V = I × R
السوق: الجهد = norm_positive − norm_negative
يقيس ميزان القوى:
- +1 = هيمنة شرائية مطلقة
- −1 = هيمنة بيعية مطلقة
- 0 = توازن
⚡ السعة الكهربائية (Capacitance)
الفيزياء: C = Q / V
السوق: السعة = |الجهد| × شدة الحقل
تمثّل الطاقة المخزّنة القابلة للتفريغ — تزداد عند وجود تحيّز مع تفاعل عالي.
⚡ التفريغ الكهربائي (Discharge)
الفيزياء: يحدث عند تجاوز عتبة العزل
السوق: احتمال التفريغ = min(السعة / عتبة التفريغ, 1.0)
عندما ≥ 0.9: "⚡ DISCHARGE IMMINENT"
📌 ملاحظة جوهرية:
أقصى سعة لا تحدث عند الهيمنة المطلقة (حيث شدة الحقل = 0)، ولا عند التوازن التام (حيث الجهد = 0)، بل عند انحياز متوسط (±30–50%) مع تفاعل عالي (شدة حقل > 25%) — أي في لحظات "الضغط قبل الاختراق".
█ آلية الحساب التفصيلية
⚡ المرحلة 1: قطبية الشمعة
polarity = (close − open) / (high − low)
- +1.0: شمعة صاعدة كاملة (ماروبوزو صاعد)
- −1.0: شمعة هابطة كاملة (ماروبوزو هابط)
- 0.0: دوجي (لا قرار)
- القيم الوسيطة: تمثّل نسبة جسم الشمعة إلى مداها — مما يقلّل تأثير الشموع ذات الظلال الطويلة
⚡ المرحلة 2: وزن الحجم
vol_weight = volume / SMA(volume, lookback)
شمعة بحجم 150% من المتوسط = شحنة أقوى بـ 1.5 مرة
⚡ المرحلة 3: معامل التكيف (Adaptive Factor)
adaptive_factor = ATR(lookback) / SMA(ATR, lookback × 2)
- في الأسواق المتقلبة: يزيد الحساسية
- في الأسواق الهادئة: يقلل الضوضاء
- يوصى دائمًا بتركه مفعّلًا
⚡ المرحلة 4–6: تراكم وتوحيد الشحنات
تُجمّع الشحنات على lookback شمعة، ثم تُوحّد النسب:
norm_positive = positive_charge / total_charge
norm_negative = negative_charge / total_charge
بحيث: norm_positive + norm_negative = 1 — لتسهيل المقارنة
⚡ المرحلة 7: حسابات الحقل
voltage = norm_positive − norm_negative
field_intensity = 4 × norm_positive × norm_negative × field_sensitivity
capacitance = |voltage| × field_intensity
discharge_prob = min(capacitance / discharge_threshold, 1.0)
█ الإعدادات
⚡ Electromagnetic Model
Lookback Period
- الافتراضي: 20
- النطاق: 5–100
- التوصيات:
- المضاربة: 10–15
- اليومي: 20
- السوينغ: 30–50
- الاستثمار: 50–100
Discharge Threshold
- الافتراضي: 0.7
- النطاق: 0.3–0.95
- التوصيات:
- سرعة + ضوضاء: 0.5–0.6
- توازن: 0.7
- دقة عالية: 0.8–0.95
Field Sensitivity
- الافتراضي: 1.0
- النطاق: 0.5–2.0
- التوصيات:
- تضخيم الصراع: 1.2–1.5
- طبيعي: 1.0
- تهدئة: 0.5–0.8
Adaptive Mode
- الافتراضي: مفعّل
- أبقِه دائمًا مفعّلًا
🔬 Dynamic Filters
يجب اجتياز جميع الفلاتر المفعّلة لظهور إشارة التفريغ.
Volume Filter
- الشرط: volume > SMA(volume) × vol_multiplier
- الوظيفة: يستبعد الشموع "الضعيفة" غير المدعومة بحجم
- التوصية: مفعّل (خاصة للأسهم والعملات)
Volatility Filter
- الشرط: STDEV > SMA(STDEV) × 0.5
- الوظيفة: يتجاهل فترات الركود الجانبي
- التوصية: مفعّل دائمًا
Trend Filter
- الشرط: توافق الجهد مع EMA سريع/بطيء
- الوظيفة: يقلل الإشارات المعاكسة للاتجاه العام
- التوصية: مفعّل للسوينغ/الاستثمار فقط
Volume Threshold
- الافتراضي: 1.2
- التوصيات:
- 1.0–1.2: حساسية عالية
- 1.5–2.0: حصرية للحجم العالي
🎨 Visual Settings
الإعدادات تُحسّن تجربة القراءة البصرية — لا تؤثر على الحسابات.
Scale Factor
- الافتراضي: 600
- كلما زاد: المشهد أكبر (200–1200)
Horizontal Shift
- الافتراضي: 180
- إزاحة أفقيّة لليسار — ليركّز على آخر شمعة
Pole Size
- الافتراضي: 60
- حجم الكرات الأساسية (30–120)
Field Lines
- الافتراضي: 8
- عدد خطوط الحقل (4–16) — 8 توازن مثالي
الألوان
- أخضر/أحمر/أزرق/برتقالي
- قابلة للتخصيص بالكامل
█ التمثيل البصري: لغة بصرية لتشخيص الحالة السعرية
✨ الفلسفة التصميمية
التمثيل ليس "زينة"، بل نموذج معرفي متكامل — كل عنصر يحمل معلومة، وتفاعل العناصر يروي قصة كاملة.
العقل يدرك التغيير في الحجم، اللون، والحركة أسرع بـ 60,000 مرة من قراءة الأرقام — لذا يمكنك "الإحساس" بالتغير قبل أن تُنهي العين المسح.
═════════════════════════════════════════════════════════════
🟢 القطب الموجب (الكرة الخضراء — يسار)
═════════════════════════════════════════════════════════════
ماذا يمثّل؟
تراكم ضغط الشراء النشط — ليس مجرد اتجاه صاعد، بل قوة طلب حقيقية مدعومة بحجم وتقلّب.
● الحجم المتغير
حجم = pole_size × (0.7 + norm_positive × 0.6)
- 70% من الحجم الأساسي = لا شحنة تُذكر
- 130% من الحجم الأساسي = هيمنة تامة
- كلما كبرت الكرة: زاد تفوّق المشترين، وارتفع احتمال الاستمرار الصعودي
تفسير الحجم:
- كرة كبيرة (>55%): ضغط شراء قوي — المشترون يسيطرون
- كرة متوسطة (45–55%): توازن نسبي مع ميل للشراء
- كرة صغيرة (<45%): ضعف ضغط الشراء — البائعون يسيطرون
● الإضاءة والشفافية
- شفافية 20% (عند Bias = +1): القطب نشط حالياً — الاتجاه صعودي
- شفافية 50% (عند Bias ≠ +1): القطب غير نشط — ليس الاتجاه السائد
الإضاءة = النشاط الحالي، بينما الحجم = التراكم التاريخي
● التوهج الداخلي النابض
كرة أصغر تنبض تلقائيًّا عند Bias = +1:
inner_pulse = 0.4 + 0.1 × sin(anim_time × 3)
يرمز إلى استمرارية تدفق أوامر الشراء — وليس هيمنة جامدة.
● الحلقات المدارية
حلقتان تدوران بسرعات واتجاهات مختلفة:
- الداخلية: 1.3× حجم الكرة — نطاق التأثير المباشر
- الخارجية: 1.6× حجم الكرة — نطاق التأثير الممتد
تمثّل "نطاق تأثير" المشترين:
- الدوران المستمر = استقرار وزخم
- التباطؤ = نفاد الزخم
● النسبة المئوية
تظهر تحت الكرة: norm_positive × 100
- >55% = هيمنة واضحة
- 45–55% = توازن
- <45% = ضعف
═════════════════════════════════════════════════════════════
🔴 القطب السالب (الكرة الحمراء — يمين)
═════════════════════════════════════════════════════════════
ماذا يمثّل؟
تراكم ضغط البيع النشط — سواء كان بيعًا تراكميًّا (التوزيع الذكي) أو بيعًا هستيريًّا (تصفية مراكز).
● الديناميكيات البصرية
نفس آلية الحجم والإضاءة والتوهج الداخلي — لكن باللون الأحمر.
الفرق الجوهري:
- الدوران معكوس (عكس اتجاه عقارب الساعة)
- يُميّز بصريًّا بين "تدفق الشراء" و"تدفق البيع"
- يسمح بقراءة الاتجاه بنظرة واحدة — حتى للمصابين بعَمَى الألوان
📌 ملخص قراءة القطبين:
🟢 كرة خضراء كبيرة + مضيئة = قوة شرائية نشطة
🔴 كرة حمراء كبيرة + مضيئة = قوة بيعية نشطة
🟢🔴 كرتان كبيرتان لكن خافتتان = تراكم طاقة (قبل التفريغ)
⚪ كرتان صغيرتان = ركود / سيولة منخفضة
═════════════════════════════════════════════════════════════
🔵 خطوط الحقل (الخطوط الزرقاء المنحنية)
═════════════════════════════════════════════════════════════
ماذا تمثّل؟
مسارات تدفق الطاقة بين القطبين — أي الساحة التي تُدار فيها المعركة السعرية.
● عدد الخطوط
4–16 خط (الافتراضي: 8)
كلما زاد العدد: زاد إحساس "كثافة التفاعل"
● ارتفاع القوس
arc_h = (i − half_lines) × 15 × field_intensity × 2
- شدة حقل عالية = خطوط شديدة الارتفاع (مثل موجة)
- شدة منخفضة = خطوط شبه مستقيمة
● الشفافية المتذبذبة
transp = 30 + phase × 40
حيث phase = sin(anim_time × 2 + i × 0.5) × 0.5 + 0.5
تخلق وهم "تيّار متدفّق" — وليس خطوطًا ثابتة
● الانحناء غير المتناظر
- الخطوط العلوية تنحني لأعلى
- الخطوط السفلية تنحني لأسفل
- يُضفي عمقًا ثلاثي الأبعاد ويُظهر اتجاه "الضغط"
⚡ تلميح احترافي:
عندما ترى الخطوط "تتقلّص" فجأة (تستقيم)، بينما الكرتان كبيرتان — فهذا مؤشر مبكر على قرب التفريغ، لأن التفاعل بدأ يفقد مرونته.
═════════════════════════════════════════════════════════════
⚪ الجزيئات المتحركة
═════════════════════════════════════════════════════════════
ماذا تمثّل؟
تدفق السيولة الحقيقية في السوق — أي من يدفع السعر الآن.
● العدد والحركة
- 6 جزيئات تغطي معظم خطوط الحقل
- تتحرك جيبيًّا على طول القوس:
t = (sin(phase_val) + 1) / 2
- سرعة عالية = نشاط تداول عالي
- تجمّع عند قطب = سيطرة هذا الطرف
● تدرج اللون
من أخضر (عند القطب الموجب) إلى أحمر (عند السالب)
يُظهر "تحوّل الطاقة":
- جزيء أخضر = طاقة شرائية نقية
- جزيء برتقالي = منطقة صراع
- جزيء أحمر = طاقة بيعية نقية
📌 كيف تقرأها؟
- تحركت من اليسار لليمين (🟢 → 🔴): تدفق شرائي → دفع صعودي
- تحركت من اليمين لليسار (🔴 → 🟢): تدفق بيعي → دفع هبوطي
- تجمّعت في المنتصف: صراع متكافئ — انتظر اختراقًا
═════════════════════════════════════════════════════════════
🟠 منطقة التفريغ (التوهج البرتقالي — المركز)
═════════════════════════════════════════════════════════════
ماذا تمثّل؟
نقطة تراكم الطاقة المخزّنة التي لم تُفرّغ بعد — قلب نظام الإنذار المبكر.
● مراحل التوهج
إنذار أولي (discharge_prob > 0.3):
- دائرة برتقالية خافتة (شفافية 70%)
- المعنى: راقب، لا تدخل بعد
توتر عالي (discharge_prob ≥ 0.7):
- توهج أقوى + نص "⚠️ HIGH TENSION"
- المعنى: استعد — ضع أوامر معلقة
تفريغ وشيك (discharge_prob ≥ 0.9):
- توهج ساطع + نص "⚡ DISCHARGE IMMINENT"
- المعنى: ادخل مع الاتجاه (بعد تأكيد شمعة)
● تأثير التوهج الطبقي (Glow Layering)
3 دوائر متحدة المركز بشفافية متزايدة:
- داخلي: 20%
- وسط: 35%
- خارجي: 50%
النتيجة: هالة (Aura) واقعية تشبه التفريغ الكهربائي الحقيقي.
📌 لماذا في المركز؟
لأن التفريغ يبدأ دائمًا من منطقة التوازن النسبي — حيث يلتقي الضغطان المتعاكسان.
═════════════════════════════════════════════════════════════
📊 مقياس الجهد (أسفل المشهد)
═════════════════════════════════════════════════════════════
ماذا يمثّل؟
مؤشر رقمي مبسّط لفرق الجهد — لمن يفضّل القراءة العددية.
● المكونات
- الشريط الرمادي: النطاق الكامل (−100% إلى +100%)
- التعبئة الخضراء: جهد موجب (تمتد لليمين)
- التعبئة الحمراء: جهد سالب (تمتد لليسار)
- رمز البرق (⚡): فوق المركز — تذكير بأنه "مقياس كهربائي"
- القيمة النصية: مثل "+23.4%" — بلون الاتجاه
● تفسير قراءات الجهد
+50% إلى +100%:
هيمنة شرائية ساحقة — احذر التشبع، قد يسبق تصحيح
+20% إلى +50%:
هيمنة شرائية قوية — مناسب للشراء مع الاتجاه
+5% إلى +20%:
ميل صعودي خفيف — انتظر تأكيدًا إضافيًّا
−5% إلى +5%:
توازن/حياد — تجنّب الدخول أو انتظر اختراقًا
−5% إلى −20%:
ميل هبوطي خفيف — انتظر تأكيدًا
−20% إلى −50%:
هيمنة بيعية قوية — مناسب للبيع مع الاتجاه
−50% إلى −100%:
هيمنة بيعية ساحقة — احذر التشبع، قد يسبق ارتداد
═════════════════════════════════════════════════════════════
📈 مؤشر شدة الحقل (أعلى المشهد)
═════════════════════════════════════════════════════════════
ما يعرضه: "Field: XX.X%"
الدلالة: قوة الصراع بين المشترين والبائعين.
● تفسير القراءات
0–5%:
- المظهر: خطوط مستقيمة تقريبًا، شفافة
- المعنى: سيطرة تامة لأحد الطرفين
- الاستراتيجية: تتبع الترند (Trend Following)
5–15%:
- المظهر: انحناء خفيف
- المعنى: اتجاه واضح مع مقاومة خفيفة
- الاستراتيجية: الدخول مع الاتجاه
15–25%:
- المظهر: انحناء متوسط، خطوط واضحة
- المعنى: صراع متوازن
- الاستراتيجية: تداول النطاق أو الانتظار
25–35%:
- المظهر: انحناء عالي، كثافة واضحة
- المعنى: صراع قوي، عدم يقين عالي
- الاستراتيجية: تداول التقلّب أو الاستعداد للتفريغ
35%+:
- المظهر: خطوط عالية جدًّا، توهج قوي
- المعنى: ذروة التوتر
- الاستراتيجية: أفضل فرص التفريغ
📌 العلاقة الذهبية:
أعلى احتمال تفريغ عندما:
شدة الحقل (25–35%) + جهد (±30–50%) + حجم مرتفع
← هذه هي "المنطقة الحمراء" التي يجب مراقبتها بدقة.
█ قراءة التمثيل البصري الشاملة
لقراءة حالة السوق بنظرة واحدة، اتبع هذا التسلسل:
الخطوة 1: أي كرة أكبر؟
- 🟢 الخضراء أكبر ← ضغط شراء مهيمن
- 🔴 الحمراء أكبر ← ضغط بيع مهيمن
- متساويتان ← توازن/صراع
الخطوة 2: أي كرة مضيئة؟
- 🟢 الخضراء مضيئة ← اتجاه صعودي حالي
- 🔴 الحمراء مضيئة ← اتجاه هبوطي حالي
- كلاهما خافت ← حياد/لا اتجاه واضح
الخطوة 3: هل يوجد توهج برتقالي؟
- لا يوجد ← احتمال تفريغ <30%
- 🟠 توهج خافت ← احتمال تفريغ 30–70%
- 🟠 توهج قوي مع نص ← احتمال تفريغ >70%
الخطوة 4: ما قراءة مقياس الجهد؟
- موجب قوي ← تأكيد الهيمنة الشرائية
- سالب قوي ← تأكيد الهيمنة البيعية
- قريب من الصفر ← لا اتجاه واضح
█ أمثلة عملية للقراءة البصرية
المثال 1: فرصة شراء مثالية ⚡🟢
- الكرة الخضراء: كبيرة ومضيئة مع نبض داخلي
- الكرة الحمراء: صغيرة وخافتة
- التوهج البرتقالي: قوي مع نص "DISCHARGE IMMINENT"
- مقياس الجهد: +45%
- شدة الحقل: 28%
التفسير: ضغط شراء قوي متراكم، انفجار صعودي وشيك
المثال 2: فرصة بيع مثالية ⚡🔴
- الكرة الخضراء: صغيرة وخافتة
- الكرة الحمراء: كبيرة ومضيئة مع نبض داخلي
- التوهج البرتقالي: قوي مع نص "DISCHARGE IMMINENT"
- مقياس الجهد: −52%
- شدة الحقل: 31%
التفسير: ضغط بيع قوي متراكم، انفجار هبوطي وشيك
المثال 3: توازن/انتظار ⚖️
- الكرتان: متساويتان تقريباً في الحجم
- الإضاءة: كلاهما خافت
- التوهج البرتقالي: قوي
- مقياس الجهد: +3%
- شدة الحقل: 24%
التفسير: صراع قوي بدون فائز واضح، انتظر اختراقًا
المثال 4: اتجاه صعودي واضح (لا تفريغ) 📈
- الكرة الخضراء: كبيرة ومضيئة
- الكرة الحمراء: صغيرة جداً وخافتة
- التوهج البرتقالي: لا يوجد
- مقياس الجهد: +68%
- شدة الحقل: 8%
التفسير: سيطرة شرائية واضحة، صراع محدود، مناسب لتتبع الترند الصعودي
المثال 5: تشبع شرائي محتمل ⚠️
- الكرة الخضراء: كبيرة جداً ومضيئة
- الكرة الحمراء: صغيرة جداً
- التوهج البرتقالي: خافت
- مقياس الجهد: +88%
- شدة الحقل: 4%
التفسير: هيمنة شرائية مطلقة، قد يسبق تصحيحاً هبوطياً
█ إشارات التداول
⚡ DISCHARGE IMMINENT (التفريغ الوشيك)
شروط الظهور:
- discharge_prob ≥ 0.9
- اجتياز جميع الفلاتر المفعّلة
- Confirmed (بعد إغلاق الشمعة)
التفسير:
- تراكم طاقة كبير جدًّا
- الضغط وصل لمستوى حرج
- انفجار سعري متوقع خلال 1–3 شموع
كيفية التداول:
1. حدد اتجاه الجهد:
• موجب = توقع صعود
• سالب = توقع هبوط
2. انتظر شمعة تأكيدية:
• للصعود: شمعة صاعدة تغلق فوق افتتاحها
• للهبوط: شمعة هابطة تغلق تحت افتتاحها
3. الدخول: مع افتتاح الشمعة التالية
4. وقف الخسارة: وراء آخر قاع/قمة محلية
5. الهدف: نسبة مخاطرة/عائد 1:2 على الأقل
✅ نصائح احترافية:
- أفضل النتائج عند دمجها مع مستويات الدعم/المقاومة
- تجنّب الدخول إذا كان الجهد قريبًا من الصفر (±5%)
- زِد حجم المركز عند شدة حقل > 30%
⚠️ HIGH TENSION (التوتر العالي)
شروط الظهور:
- 0.7 ≤ discharge_prob < 0.9
التفسير:
- السوق في حالة تراكم طاقة
- احتمال حركة قوية قريبة، لكن ليست فورية
- قد يستمر التراكم أو يحدث تفريغ
كيفية الاستفادة:
- الاستعداد: حضّر أوامر معلقة عند الاختراقات المحتملة
- المراقبة: راقب الشموع التالية بحثًا عن شمعة دافعة
- الانتقاء: لا تدخل كل إشارة — اختر تلك التي تتوافق مع الاتجاه العام
█ استراتيجيات التداول
📈 استراتيجية 1: تداول التفريغ (الأساسية)
المبدأ: الدخول عند "DISCHARGE IMMINENT" في اتجاه الجهد
الخطوات:
1. انتظر ظهور "⚡ DISCHARGE IMMINENT"
2. تحقق من اتجاه الجهد (+/−)
3. انتظر شمعة تأكيدية في اتجاه الجهد
4. ادخل مع افتتاح الشمعة التالية
5. وقف الخسارة وراء آخر قاع/قمة
6. الهدف: نسبة 1:2 أو 1:3
نسبة نجاح عالية جدًّا عند الالتزام بشروط التأكيد.
📈 استراتيجية 2: تتبع الهيمنة
المبدأ: التداول مع القطب المهيمن (الكرة الأكبر والأكثر إضاءة)
الخطوات:
1. حدد القطب المهيمن (الأكبر حجماً والأكثر إضاءة)
2. تداول في اتجاهه
3. احذر عند تقارب الأحجام (صراع)
مناسبة للإطارات الزمنية الأعلى (H1+).
📈 استراتيجية 3: صيد الانعكاس
المبدأ: الدخول عكس الاتجاه عند ظروف معينة
الشروط:
- شدة حقل عالية (>30%)
- جهد متطرف (>±40%)
- تباعد مع السعر (مثل: قمة سعرية جديدة مع تراجع الجهد)
⚠️ عالية المخاطرة — استخدم حجم مركز صغير.
📈 استراتيجية 4: الدمج مع التحليل الفني
أمثلة تأكيد قوي:
- اختراق مقاومة + تفريغ صعودي = إشارة شراء ممتازة
- كسر دعم + تفريغ هبوطي = إشارة بيع ممتازة
- نموذج Head & Shoulders + جهد سالب متزايد = تأكيد النموذج
- تباعد RSI + شدة حقل عالية = انعكاس محتمل
█ التنبيهات الجاهزة
Bullish Discharge
- الشرط: discharge_prob ≥ 0.9 + جهد موجب + جميع الفلاتر
- الرسالة: "⚡ Bullish discharge"
- الاستخدام: فرصة شراء عالية الاحتمالية
Bearish Discharge
- الشرط: discharge_prob ≥ 0.9 + جهد سالب + جميع الفلاتر
- الرسالة: "⚡ Bearish discharge"
- الاستخدام: فرصة بيع عالية الاحتمالية
✅ نصيحة: استخدم هذه التنبيهات مع إعداد "Once Per Bar" لتجنب التكرار.
█ المخرجات في نافذة البيانات
Bias
- القيم: −1 / 0 / +1
- التفسير: −1 = هبوطي، 0 = حياد، +1 = صعودي
- الاستخدام: لدمجها في استراتيجيات آلية
Discharge %
- النطاق: 0–100%
- التفسير: احتمال التفريغ
- الاستخدام: مراقبة تدرّج التوتر (مثال: من 40% إلى 85% في 5 شموع)
Field Strength
- النطاق: 0–100%
- التفسير: شدة الصراع
- الاستخدام: تحديد "نافذة الفرص" (25–35% مثالية للتفريغ)
Voltage
- النطاق: −100% إلى +100%
- التفسير: ميزان القوى
- الاستخدام: مراقبة التطرف (تشبع شرائي/بيعي محتمل)
█ الإعدادات المثلى حسب أسلوب التداول
المضاربة (Scalping)
- الإطار: 1M–5M
- Lookback: 10–15
- Threshold: 0.5–0.6
- Sensitivity: 1.2–1.5
- الفلاتر: Volume + Volatility
التداول اليومي (Day Trading)
- الإطار: 15M–1H
- Lookback: 20
- Threshold: 0.7
- Sensitivity: 1.0
- الفلاتر: Volume + Volatility
السوينغ (Swing Trading)
- الإطار: 4H–D1
- Lookback: 30–50
- Threshold: 0.8
- Sensitivity: 0.8
- الفلاتر: Volatility + Trend
الاستثمار (Position Trading)
- الإطار: D1–W1
- Lookback: 50–100
- Threshold: 0.85–0.95
- Sensitivity: 0.5–0.8
- الفلاتر: جميع الفلاتر
█ نصائح للاستخدام الأمثل
1. ابدأ بالإعدادات الافتراضية
جرّبه أولًا كما هو، ثم عدّل حسب أسلوبك.
2. راقب التوافق بين العناصر
أفضل الإشارات عندما:
- الجهد واضح (>│20%│)
- شدة الحقل معتدلة–عالية (15–35%)
- احتمال التفريغ مرتفع (>70%)
3. استخدم أطر زمنية متعددة
- الإطار الأعلى: تحديد الاتجاه العام
- الإطار الأدنى: توقيت الدخول
- تأكد من توافق الإشارات بين الأطر
4. دمج مع أدوات أخرى
- مستويات الدعم/المقاومة
- خطوط الاتجاه
- أنماط الشموع
- مؤشرات الحجم
5. احترم إدارة المخاطرة
- لا تخاطر بأكثر من 1–2% من الحساب
- استخدم دائمًا وقف الخسارة
- لا تدخل كل الإشارات — اختر الأفضل
█ تحذيرات مهمة
⚠️ ليس للاستخدام المنفرد
المؤشر أداة تحليل مساعِدة — لا تستخدمه بمعزل عن التحليل الفني أو الأساسي.
⚠️ لا يتنبأ بالمستقبل
الحسابات مبنية على البيانات التاريخية — النتائج ليست مضمونة.
⚠️ الأسواق تختلف
قد تحتاج لضبط الإعدادات لكل سوق:
- العملات: تركّز على Volume Filter
- الأسهم: أضف Trend Filter
- الكريبتو: خفّض Threshold قليلًا (أكثر تقلّبًا)
⚠️ الأخبار والأحداث
المؤشر لا يأخذ في الاعتبار الأخبار المفاجئة — تجنّب التداول قبل/أثناء الأخبار الرئيسية.
█ الميزات الفريدة
✅ أول تطبيق للكهرومغناطيسية على الأسواق
نموذج رياضي مبتكر — ليس مجرد مؤشر عادي
✅ كشف استباقي للانفجارات السعرية
يُنبّه قبل حدوث الحركة — وليس بعدها
✅ تصفية متعددة الطبقات
4 فلاتر ذكية تقلل الإشارات الكاذبة إلى الحد الأدنى
✅ تكيف ذكي مع التقلب
يضبط حساسيته تلقائيًّا حسب ظروف السوق
✅ تمثيل بصري ثلاثي الأبعاد متحرك
يجعل القراءة فورية — حتى للمبتدئين
✅ مرونة عالية
يعمل على جميع الأصول: أسهم، عملات، كريبتو، سلع
✅ تنبيهات مدمجة جاهزة
لا حاجة لإعدادات معقدة — جاهز للاستخدام الفوري
█ خاتمة: عندما يلتقي الفن بالعلم
Market Electromagnetic Field ليس مجرد مؤشر — بل فلسفة تحليلية جديدة.
هو الجسر بين:
- دقة الفيزياء في وصف الأنظمة الديناميكية
- ذكاء السوق في توليد فرص التداول
- علم النفس البصري في تسهيل القراءة الفورية
النتيجة: أداة لا تُقرأ — بل تُشاهد، تُشعر، وتُستشعر.
عندما ترى الكرة الخضراء تتوسع، والتوهج يصفرّ، والجزيئات تندفع لليمين — فأنت لا ترى أرقامًا، بل ترى طاقة السوق تتنفّس.
⚠️ إخلاء مسؤولية:
هذا المؤشر لأغراض تعليمية وتحليلية فقط. لا يُمثل نصيحة مالية أو استثمارية أو تداولية. استخدمه بالتزامن مع استراتيجيتك الخاصة وإدارة المخاطر. لا يتحمل TradingView ولا المطور مسؤولية أي قرارات مالية أو خسائر.
