Gann Octave Pro - Angles & Time Cycles 🎯 Gann Octave Pro - Angles & Time Cycles
## Complete Gann Trading System - Price, Angles & Time in One Indicator
A professional-grade Gann analysis tool combining **Octave Price Levels**, **Gann Angles (1x1, 2x1, 1x2)**, and **Advanced Time Cycle Projections**. Perfect for traders seeking precision market timing through geometric confluence.
---
## 🌟 Key Features
### 📐 Octave Price Levels
- **5 Key Levels**: 0%, 25%, 50%, 75%, 100%
- **Color-Coded**: Green (support) → Blue (50% pivot) → Red (resistance) → Black (boundaries)
- **Dynamic Updates**: Auto-adjusts to swing structure
- **Trading Edge**: 50% level is the most powerful reversal zone
### 📏 Gann Angles
- **1x1 Angle** (Black) - Natural 45° trend line
- **2x1 Angle** (Red) - Steep acceleration zone
- **1x2 Angle** (Red) - Gradual support/resistance
- **Customizable Extension**: Fixed bars or % of swing length
### ⏰ Advanced Time Cycles
**Three Calculation Methods:**
1. **Angle-Level Confluence** ⭐ (Recommended)
- Calculates intersections of Gann angles with octave levels
- Most sophisticated timing system
- Based on price-time geometry
2. **Swing Duration** - Uses actual swing bar length
3. **Harmonic (Swing/8)** - Classic Gann harmonic division
**Cycle Visualization:**
- **Full Cycles** (Purple, solid) - Major turning points, labeled "◆ FC1 (176 bars) "
- **Sub-Cycles** (Blue, dotted) - Minor pivots, labeled "S1 "
- **Mid-Cycles** (Orange, dashed) - Half-cycle inflection points
- **Past Display**: Shows 4 complete past cycles for validation
- **Future Projection**: Projects 8 future cycles for anticipation
---
## 🎯 How to Use
### Quick Start
1. Apply to chart (works all timeframes/instruments)
2. Select period: Default 44 bars (adjust based on timeframe)
3. Choose cycle method: "Angle-Level Confluence" for best results
4. Observe past cycles to validate timing accuracy
### Trading Strategies
**Triple Confluence Setup** (Highest Probability)
- Price at octave level (especially 50%)
- Price touches Gann angle (1x1 most reliable)
- Time cycle arrives (full cycle preferred)
- **Entry**: On confluence | **Stop**: Below/above octave level | **Target**: Next level
**Cycle Anticipation**
- Enter 1-2 bars before cycle line if price at octave level
- Exit at next cycle or target octave level
- **Edge**: Anticipate cycles instead of reacting
**Angle Breakout + Cycle**
- Price breaks 1x1 angle + next cycle within 20 bars
- Hold through cycle, exit at 2x1 angle or next major level
---
## ⚙️ Customization
### Period Selection (88-Based)
11 harmonic options: 3, 6, 11, 22, **44**, 88, 176, 352, 704, 1408, 2816 bars
- **Intraday** (15m-1h): Period 3-4
- **Swing Trading** (4h-Daily): Period 4-5
- **Position Trading** (Daily-Weekly): Period 5-6
### Visual Controls
- **Colors**: Independent for all elements
- **Line Widths**: Separate controls (1-5) for levels, angles, cycles
- **Label Size**: Tiny/Small/Normal/Large (unified)
- **Label Position**: Top/Middle/Bottom
- **Show/Hide**: Toggle any component
### Alerts
- 50% octave level breakouts
- Customizable messages
---
## 💡 Pro Tips
1. **Validate First**: Observe 2-3 past cycles before trading
2. **Adjust to Volatility**: High volatility = lower period (22-44), Low = higher (88-176)
3. **Multiple Timeframes**: Apply on different timeframes for confirmation
4. **Respect 50% Level**: Most powerful reversal zone in Gann theory
5. **Focus on Full Cycles**: Highest probability setups (◆ FC markers)
6. **Combine with Price Action**: Indicator shows WHERE/WHEN, price action shows HOW
---
## 🚀 What Makes It Unique
✅ **Intelligent Confluence Cycles** - Unique angle-level intersection calculation
✅ **Historical Validation** - See past cycles to trust future projections
✅ **Professional Design** - Color-coded hierarchy, clean labels, no clutter
✅ **Complete Automation** - Everything updates in real-time
✅ **Three-Dimensional Analysis** - Price + Angles + Time = complete picture
---
## 📊 Best Markets
- Stock indices (S&P 500, NASDAQ, Dow)
- Forex majors (EUR/USD, GBP/USD, USD/JPY)
- Commodities (Gold, Silver, Oil)
- Crypto (BTC, ETH)
- Liquid stocks
✅ Complete Gann system (price + angles + time)
✅ 3 time cycle methods
✅ Auto swing detection
✅ 4 past + 8 future cycle projections
✅ Professional visualization
✅ Extensive customization
✅ Real-time alerts
✅ Works all markets/timeframes
---
## ⚠️ Disclaimer
This indicator is for educational purposes and applies W.D. Gann methodology principles. Not financial advice. Always use proper risk management, position sizing, and stop losses. Practice on paper before live trading. Past performance doesn't guarantee future results.
---
**The market moves in patterns of price and time. This indicator helps you see them.**
Trade with geometry. Trade with time. Trade with confidence.
Поиск скриптов по запросу "pro"

Vertical Timelines Pro |MC|Vertical Timelines Pro |MC|
Credits go to lucemanb for the great work 👍
This indicator has been further developed and enhanced with additional features.
Vertical Timelines Pro is a customizable time-based indicator designed to mark important intraday timestamps directly on the chart. It helps traders visualize recurring market moments such as True Day Open, session opens, macro events, or personal timing models with precise vertical reference lines.
The indicator allows you to define multiple custom times, each with its own color and on/off toggle. All timestamps are calculated using a selectable timezone, ensuring consistent and accurate alignment across different markets and chart settings.
Optional labels can be displayed at each timeline to clearly identify the corresponding time. To keep the chart clean and readable, the number of visible labels can be limited retroactively. Due to Pine Script limitations, this setting only affects labels—plotted lines are not impacted.
💎 Key Features 💎
Multiple configurable intraday time markers
Timezone-aware calculations
Individual color and visibility control per line
Optional time labels with customizable size and colors
Historical label limiting to reduce chart clutter
Lightweight and suitable for all intraday timeframes
This indicator is ideal for traders who rely on time-based market behavior, session structure, or repeatable intraday cycles.
Happy Trading!

Ultimate Institutional Order Flow Pro [Pointalgo]Ultimate Institutional Order Flow (UIOF Pro)
Ultimate Institutional Order Flow (UIOF Pro) is a multi-component market analysis indicator designed to study order flow behavior, liquidity interaction, volatility structure, and session-based participation.
It integrates several commonly used market structure and order-flow concepts into a single visual framework.
This script focuses on context and alignment, not on isolated signals.
Core Objective
The indicator aims to identify areas where price, volume, liquidity, and structure appear aligned in the same direction.
It does this by combining:
VWAP behavior
Volume participation
Cumulative delta analysis
Liquidity pool interaction
Order blocks and fair value gaps
Market structure shifts
Session and higher-timeframe confirmation
VWAP & Volatility Framework
Calculates VWAP using session, weekly, or monthly anchors.
Optional VWAP standard-deviation bands visualize price dispersion.
VWAP slope and price position are used to classify directional bias.
VWAP is treated as a dynamic equilibrium reference rather than a signal.
Cumulative Volume Delta (CVD)
Estimates buy and sell pressure based on intrabar price movement.
Tracks cumulative delta and a smoothed delta average.
Uses delta change normalization to highlight abnormal activity.
Detects potential delta divergences when price and participation differ.
CVD is used to assess whether participation supports or contradicts price movement.
Liquidity Zones & Sweeps
Identifies recent swing highs and lows as potential liquidity pools.
Tracks buy-side and sell-side liquidity areas.
Flags conditions where price sweeps liquidity beyond recent extremes.
Liquidity interaction is treated as context, not prediction.
Order Blocks
1. Detects potential bullish and bearish order blocks using:
Candle structure
Volatility thresholds
Volume confirmation
2.Highlights areas where strong participation followed opposing price movement.
Order blocks are visual reference zones and do not imply guaranteed reactions.
Fair Value Gaps (FVG)
Identifies imbalance zones where price moves without overlapping structure.
Filters gaps using ATR-based size conditions.
Visual shading is used to highlight imbalance areas.
These zones may represent inefficient price movement requiring further interaction.
Volume Profile & Point of Control (POC)
Builds a simplified volume profile over a configurable lookback window.
Determines the price level with the highest traded volume (POC).
POC is used as a reference for acceptance or rejection behavior.
Market Structure
Evaluates recent highs and lows to identify structure breaks.
Classifies directional structure as bullish, bearish, or neutral.
Structure is used as a directional filter rather than a trigger.
Multi-Timeframe Confirmation
Optional higher-timeframe confirmation aligns lower-timeframe behavior with broader context.
Prevents analysis from relying on isolated timeframe conditions.
Session Filtering
1. Allows analysis to be limited to specific trading sessions.
2. Helps reduce signals during low-participation periods.
3. Session logic affects signal eligibility, not calculations.
Signal Logic
Signals are generated only when multiple independent conditions align, including:
Liquidity interaction
Order block presence
VWAP bias
Delta confirmation
Structure alignment
Volume participation
Optional higher-timeframe confirmation
Active trading session
Strong continuation conditions are also highlighted when price, volume, and participation remain aligned.
Signals represent confluence states, not trade instructions.
Dashboard Summary
A real-time dashboard summarizes:
VWAP bias and slope
CVD strength and direction
Delta behavior
Market structure state
Higher-timeframe context
Volume conditions
Liquidity pool counts
Session activity
This provides a high-level snapshot of market conditions without manual calculation.
Alerts are available for:
Institutional alignment conditions
Strong continuation pressure
Liquidity sweeps
Delta divergences
Alerts are informational and reflect internal indicator states only.
Usage Notes
Designed for analytical interpretation and market study.
Best used alongside price action and risk management methods.
Performance depends on instrument liquidity and volume quality.
All visual elements can be individually enabled or disabled.
Disclaimer
This script is provided for educational and analytical purposes only.
It does not provide financial, investment, or trading advice.
All outputs should be independently verified before making trading decisions.

Liquidity Levels Pro Tool - thewallranka
Liquidity Levels Pro Tool is a market-structure and liquidity-mapping indicator designed to help discretionary futures and index traders identify statistically relevant price levels where reactions, continuations, or liquidity sweeps are more likely to occur.
This script is a decision-support tool, not a signal generator. It does not issue buy/sell alerts or predict future price movement. Instead, it organizes and scores liquidity information so traders can make their own contextual decisions.
What this indicator does
The script continuously detects and maintains liquidity zones derived from price pivots, then evaluates those zones using multiple structural and contextual factors:
Repeated price interaction (touches)
Freshness (time since last interaction)
Confluence with key reference levels
Reaction behavior after contact
Session relevance (RTH vs overnight)
Market regime (trend vs mean reversion)
Time-of-day effects (open, midday, power hour)
Only the most relevant zones—based on a dynamic scoring system—are displayed to reduce chart clutter and focus attention on levels that have historically mattered.
Core components
1. Liquidity Zones
Zones are built from pivot highs and lows and expanded into areas using a configurable tick-based padding. Nearby zones are merged to avoid redundancy.
Each zone is continuously evaluated and assigned a score (0–100) reflecting its relative importance.
2. Zone Scoring (No Lookahead)
Zone scores are based on:
Number of confirmed interactions
Recency of the last touch
Confluence with prior day/week levels, VWAP, and Opening Range
Reaction quality after touches (speed and follow-through)
Session alignment (zones that “work” in the current session are favored)
Penalties after liquidity sweeps
Zones are not forward-looking and do not rely on future data.
3. Context Engine
The script classifies the current environment using VWAP slope and distance:
Trend (up or down)
Mean reversion
Mixed/transition
Time-of-day context (Open, Midday, Power Hour) is also tracked internally and influences zone scoring.
This context is displayed in the HUD to support situational awareness, not automated decisions.
4. Liquidity Sweeps
Optional sweep detection highlights situations where price trades beyond a zone and closes back inside, indicating potential stop runs or failed breakouts.
Sweeps are rate-limited and applied conservatively to avoid visual noise.
5. Trade Planning Levels (Optional)
When enabled, the script highlights the nearest high-quality liquidity level above and below price based on score thresholds.
These are intended as reference targets, not trade entries or exits.
HUD (Heads-Up Display)
The on-chart HUD summarizes:
Key reference levels (prior day/week, Opening Range)
Nearest strong liquidity above/below price
Market regime and time-of-day context
Distance to levels (ticks or points)
The HUD is fully optional, positionable, and includes resizable modes (Small / Medium / Large) to fit different chart layouts.
How to use this tool
This indicator is best used as part of a discretionary trading process, for example:
Identifying areas where price is more likely to react or pause
Framing trades around higher-quality structure instead of arbitrary levels
Filtering setups based on session and regime context
Managing expectations near known liquidity rather than chasing price
It is intentionally designed not to provide trade signals.
Limitations and important notes
This script does not predict outcomes or guarantee reactions
High-scoring zones can still fail
Liquidity behavior is context-dependent and probabilistic
No performance claims or backtested results are provided
The indicator should not be used in isolation
Past behavior does not imply future results.
Chart and usage notes
The script is intended for standard time-based charts
Recommended for liquid futures and index products
Use a clean chart for clarity when publishing or sharing
No external indicators are required
Final note
Liquidity Levels Pro (Tool) — v6 is designed to organize complex market structure into a clear, readable framework, allowing traders to focus on execution and risk management rather than raw level detection.
This script reflects an analytical approach to intraday liquidity and structure, not an automated trading system.

Trinity Bollinger Bands Pro with BreakoutsTrinity Bollinger Bands Pro Indicator
The **Trinity Bollinger Bands Pro + Triple Bands & Expansion** is a highly customized, advanced volatility and breakout indicator built on the classic Bollinger Bands framework. It expands the standard single-pair bands into **three independent deviation levels** (typically 1σ, 2σ, and 3σ) around a user-selectable moving average basis (default EMA 20). This creates clear "zones" of volatility, with dynamic trend-based coloring, layered fills, fixed-style labels, and a statistical volatility expansion detector shown as a directional background highlight in a separate pane. The result is a visually intuitive tool that helps traders identify consolidation, building momentum, confirmed trends, and rare explosive moves with high-probability filtering.
### Why It's Good and Different from Standard Indicators
This indicator stands out by addressing common limitations of traditional Bollinger Bands and multi-deviation scripts:
- **Layered statistical significance**: Unlike single (2σ) or basic double-band setups, it provides three distinct levels—early momentum (1σ), standard confirmation (2σ), and extreme/rare breakouts (3σ)—making it easier to stage trades progressively rather than relying on one ambiguous cross.
- **Trend-aware visuals**: Bands, basis, and fills change color based on price position relative to a separate trend MA, giving immediate bullish/bearish bias without needing additional indicators.
- **Clean, fixed labels**: Tiny, arrow-pointing labels ("1/2/3 SD Above/Below", "BB Basis") with consistent colors (purple upper, blue lower, yellow basis) provide instant identification
- **Statistical expansion detection**: Uses percentile ranking of band width "bell curve" concept" to identify abnormally high volatility, triggering directional background highlights (green bullish, red bearish) earlier than raw width spikes.
- **Reduced noise and fakeouts**: Tiered breakouts + expansion filter focus alerts on high-probability moves, unlike most BB scripts that flood signals on every touch.
Compared to popular public scripts (e.g., standard Bollinger Bands, Triple BB variants, or separate BBW Percentile tools), this combines everything into one cohesive indicator with superior visual clarity and statistical rigor.
### Key Features
- **Triple customizable bands**: Enable/disable and adjust multipliers for 1σ (early), 2σ (confirmed), 3σ (extreme) deviations.
- **Trend-based dynamic coloring**: Separate editable colors for each band set (bullish/bearish).
- **Layered zone fills**: Colored between bands with transparency, reflecting current trend.
- **Fixed tiny labels**: All left-pointing arrows with purple (upper), blue (lower), yellow (basis) backgrounds for quick reference.
- **Statistical expansion overlay**: with directional background (green/red) during extreme volatility expansions (earlier trigger using 2σ width).
- **Tiered alerts**: Early (Band 1), Confirmed (Band 2), Extreme (Band 3), High-Probability (Extreme + expansion), and general expansion alerts.
- **Fully configurable basis**: Length, type (SMA/EMA/WMA/RMA), and thin fixed lines for minimal clutter.
### How Traders Can Use It
- **Spot squeezes and breakouts**: Watch for tight bands (low width) → expansion background → price closing outside Band 1 (early entry), Band 2 (add/confirm), Band 3 (strong trend conviction).
- **Filter fakeouts**: Only act on crosses accompanied by expansion background color matching trend direction—dramatically reduces whipsaws.
- **Trend riding**: Price "walking" colored bands (e.g., hugging upper purple-label bands in green background = strong bullish momentum).
- **Scalping/intraday**: On lower timeframes (e.g., 10min), use early Band 1 signals with expansion for quick moves.
- **Swing/position trading**: Wait for Band 3 extreme breakout + colored background for higher-probability, larger moves.
- **Risk management**: Place stops near basis or inner band; trail using outer bands during expansions.
Overall, this indicator excels at turning volatility into actionable, staged signals with visual simplicity—ideal for traders seeking an edge in identifying real explosive trends over noise. It's particularly powerful on volatile stocks like AMD/INTC or indices during news/events.

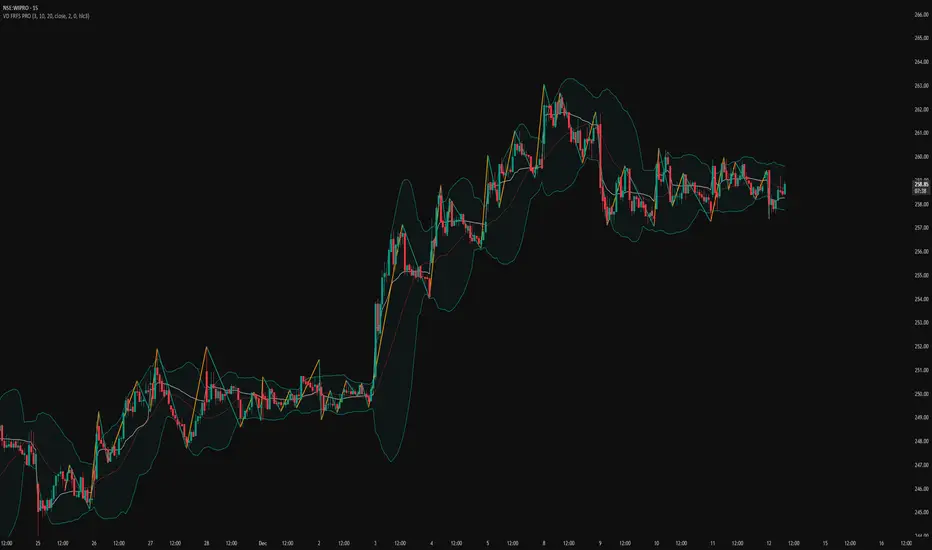
VD FRFS PRO
VD FRFS PRO
This trader centric, multi-functional indicator built on **Pine Script™ v6** that seamlessly integrates four of the most critical price and volatility tools into a single overlay. Designed for day traders, swing traders, and institutional analysts, this tool provides a comprehensive view of volatility, trend, volume-based pricing, and structure, all without chart clutter.
Overview & Concept
The VD FRFS PRO is engineered for efficiency and clarity. Instead of layering four separate indicators, which can lead to performance issues and confusion, this script combines the calculations into one, allowing traders to execute complex technical analysis rapidly.
It serves as a powerful foundation for strategies that require:
1. Volatility Assessment (Bollinger Bands)
2. Volume-Weighted Fair Value (VWAP)
3. Price Structure & Swings (Zig Zag)
4. Dynamic Trend Filtering (Configurable SMA)
Customization & Settings
All inputs are logically grouped for ease of use in the indicator's settings menu.
Bollinger Bands
BB Length: Period for the Basis SMA and StdDev calculation (default: 20).
BB Source: Price series for the calculation (default: `close`).
BB StdDev Multiplier: Multiplier for the Standard Deviation (default: 2.0).
BB Offset: Shifts the bands horizontally (default: 0).
VWAP Settings
VWAP Source: Price series for the VWAP calculation (default: `hlc3`).
Zig Zag Settings
Zig Zag High/Low Length: Lookback period for determining swing points (default: 3).
SMA Settings
SMA Period: Lookback period for the configurable SMA (default: 20).
Show SMA: Checkbox to toggle the visibility of this SMA (default: `true`).
Disclaimer
Feel free to reach out for suggestions and modification requests.
UT Bot Pro Max (Maks Edition)Script v2.0
UT Bot Pro Max is an advanced, high-precision evolution of the well-known UT Bot indicator.
This version is fully rebuilt into a complete decision-making system that evaluates trend structure, volatility conditions, momentum signals, and entry quality.
It is designed for traders who want clear, structured signals supported by objective filters and transparent reasoning.
1. Core Engine: ATR-Based Trailing Logic
At the heart of the system is an ATR dynamic trailing stop.
It is responsible for:
detecting trend reversals
identifying breakout conditions
switching between long and short bias
determining signal strength
Unlike simple ATR lines, this engine adapts to momentum expansion and contraction, forming the backbone for every signal.
2. Three-Tier Signal Structure
Each signal is classified into one of three levels based on the number of confirmations:
Strong Signals
ATR breakout
trend filter (price relative to EMA200)
RSI filter (oversold/overbought context)
This is the highest-quality confirmation and is suitable for full-size entries.
Medium Signals
ATR breakout
trend filter
(no RSI filter)
This represents a valid trend continuation but with slightly reduced confirmation.
Weak Signals
ATR breakout only
(no trend filter, no RSI filter)
This is an early-stage impulse which can evolve into a stronger move.
The multi-level classification allows the trader to size positions rationally and avoid over-committing during uncertain market conditions.
3. Move-Since-Entry Tracking
When a new long or short position is detected, the indicator records the entry price and automatically tracks the percentage movement from that point.
This offers:
real-time monitoring of open trade performance
objective context for managing exits
clear visualization of progress since entry
4. Smart State-Change Alerts
Instead of simple “BUY” or “SELL” messages, the script sends highly structured alerts whenever the internal state changes.
Each alert includes:
the symbol and timeframe
signal direction and strength
recommended position size based on signal tier
ATR values
RSI value and its state
trend context (bullish, bearish, neutral)
distance from ATR trailing stop
movement since entry
previous state reference (optional)
This makes it ideal for automated systems, algorithmic routing, or Telegram-based signal delivery.
5. Professional On-Chart Status Table
The indicator displays a refined information panel containing:
current signal state (Strong / Medium / Weak / Hold)
ATR signal direction
trend filter result
RSI value and condition
distance to trailing stop (percentage)
current position (long / short / flat)
entry recommendation based on signal strength
ATR value and additional context in expanded mode
There is also a compact mode optimized specifically for mobile trading.
6. Optional Heikin Ashi Mode
The indicator can operate using Heikin Ashi close values for traders who prefer smooth, noise-reduced visualizations.
The internal logic is recalculated automatically.
7. Trend-Colored Candles
An optional feature allows candle coloring based on price position relative to the ATR stop line, highlighting bullish and bearish phases directly on the chart.
What This Indicator Provides
Accurate, context-aware entry signals
Scalable position sizing through multi-tier structure
Objective trend confirmation
Breakout detection with volatility adaptation
Continuous tracking of open position performance
Detailed real-time explanations through alerts
A complete visual dashboard consolidating all key metrics
UT Bot Pro Max (Maks Edition) is built as a practical tool for daily trading.
It is suitable for scalping, day trading, swing trading, automated alerts, and mobile workflows.

Trinity CCI Pro PlusWhat It Is
Trinity CCI Pro Plus is an innovative overlay indicator that reimagines the classic Commodity Channel Index (CCI) by plotting its levels directly on the price chart. No more separate oscillator panel—instead, you get dynamic price-based bands and lines for instant momentum insights.
What You See on the Chart
Orange line: The CCI zero line (20-period SMA of typical price, hlc3)—acts as the baseline.
Aqua line: Dynamic upper band at CCI = +100 (overbought threshold).
Purple line: Dynamic lower band at CCI = -100 (oversold threshold).
Optional thick purple line: The extra SMA of CCI (14-period smooth) scaled back to price—serves as a signal line for crossovers.
Optional outer zones: ±200 bands (aqua/purple extensions) for extreme momentum levels, often added as dotted or filled areas to spot blow-off tops/bottoms.
Key Differences from Regular CCI
Standard CCI lives in a lower pane with fixed horizontal lines at +100, 0, and -100, forcing you to split your focus. This version overlays everything on price: the bands curve with market volatility, the zero line becomes a moving average, and the extra SMA/signal line integrates seamlessly for price-action trading. Plus, it naturally supports outer ±200 zones without extra coding, making extremes visually pop.
How Traders Use It
Momentum breakouts: Buy when price closes above the +100 aqua band (or +200 for aggressive entries); sell below -100 purple (or -200).
Mean reversion: Fade touches on the bands—take profits if price rejects the +100/-100 levels, or watch for exhaustion at ±200.
Trend bias: Price above orange zero = bullish filter; below = bearish. Use the extra SMA for confirmation (e.g., price crossing above it signals upside).
Crossover signals: Price vs. the thick purple SMA line—bullish above, bearish below—pairs perfectly with band breaks.
Range trading: Treat ±100 bands as dynamic support/resistance; outer ±200 zones highlight potential breakout setups.
This setup shines in trending markets (e.g., stocks or forex on 1H/daily charts), turning CCI into a one-glance channel system. Start with the defaults, add the ±200 and extra SMA via simple code tweaks, and backtest for your style—it's versatile and reduces screen clutter dramatically.
More Info
The 20 period MA is the original and still the most common setting for CCI, and it is exactly what the creator of the CCI, Donald Lambert, published it in 1980 with these exact parameters:
Length: 20 periods
Constant: 0.015 (to make CCI fall between +100 and –100 about 70–80 % of the time)
Typical Price: hlc3 (or sometimes (high + low + close)/3)
Deviation measure: Mean Deviation (not standard deviation)
So the “Trinity CCI Pro Plus” you are using is 100 % faithful to Lambert’s original design when the length is set to 20.

Viprasol Elite Flow Pro - Premium Order Flow & Trend System═══════════════════════════════════════════════════════════════
🔥 VIPRASOL ELITE FLOW PRO
Professional Order Flow & Trend Detection System
═══════════════════════════════════════════════════════════════
📊 WHAT IS THIS INDICATOR?
Viprasol Elite Flow Pro is a comprehensive trading system that combines institutional order flow analysis with adaptive trend detection. Unlike basic indicators, this tool identifies high-probability setups by analyzing where smart money is likely positioning, while filtering signals through multiple confirmation layers.
This indicator is designed for traders who want to:
✓ Identify premium (supply) and discount (demand) zones automatically
✓ Detect trend direction with adaptive cloud technology
✓ Spot high-volume rejection points before major moves
✓ Filter low-quality signals with intelligent confirmation logic
✓ Track market strength in real-time via elite dashboard
═══════════════════════════════════════════════════════════════
🎯 CORE FEATURES
═══════════════════════════════════════════════════════════════
1️⃣ ELITE TREND ENGINE
• Adaptive Moving Average system (Fast/Adaptive/Smooth modes)
• Dynamic trend cloud that expands/contracts with volatility
• Real-time trend state tracking (Bullish/Bearish/Ranging)
• Trend strength meter (0-10 scale)
• ATR-based volatility adjustments
2️⃣ ORDER FLOW DETECTION
• Automatic Premium Zone (Supply) identification
• Automatic Discount Zone (Demand) identification
• Smart zone extension - zones remain valid until broken
• Zone rejection detection with price action confirmation
• Customizable zone strength (5-30 bars lookback)
3️⃣ VOLUME INTELLIGENCE
• Volume spike detection (configurable threshold)
• Climax bar identification (exhaustion signals)
• Volume filter for signal validation
• Institutional activity detection
4️⃣ SMART SIGNAL SYSTEM
• 3 Signal Modes: Aggressive, Balanced, Conservative
• Multi-layer confirmation logic
• Automatic profit targets (2:1 risk-reward)
• Stop loss suggestions based on ATR
• Prevents overtrading with bars-since-signal filter
5️⃣ ELITE DASHBOARD (HUD)
• Real-time trend direction and strength
• Volume status monitoring
• Active zones counter
• Market volatility gauge
• Current signal status
• 4 positioning options, compact mode available
6️⃣ PREMIUM STYLING
• 4 Professional color themes (Cyber/Gold/Ocean/Fire)
• Adjustable transparency and label sizes
• Clean, institutional-grade visuals
• Optimized for all chart types
═══════════════════════════════════════════════════════════════
📖 HOW TO USE THIS INDICATOR
═══════════════════════════════════════════════════════════════
STEP 1: TREND IDENTIFICATION
→ Green Cloud = Bullish trend - look for LONG opportunities
→ Red Cloud = Bearish trend - look for SHORT opportunities
→ Purple Cloud = Ranging - wait for breakout or fade extremes
STEP 2: ZONE ANALYSIS
→ PREMIUM (Red) zones = Potential resistance/supply areas
→ DISCOUNT (Green) zones = Potential support/demand areas
→ Price rejecting from zones = high-probability setups
STEP 3: SIGNAL CONFIRMATION
→ Wait for "LONG" or "SHORT" labels to appear
→ Check dashboard for trend strength (Moderate/Strong preferred)
→ Confirm volume status is "HIGH" or "CLIMAX"
→ Entry: Enter when label appears
→ Stop Loss: Use dotted line (1 ATR away)
→ Take Profit: Use dashed line (2 ATR away)
STEP 4: RISK MANAGEMENT
→ Never risk more than 1-2% per trade
→ Use the provided stop loss levels
→ Trail stops as price moves in your favor
→ Avoid trading during low volatility periods
═══════════════════════════════════════════════════════════════
⚙️ RECOMMENDED SETTINGS
═══════════════════════════════════════════════════════════════
FOR SCALPING (1M - 5M):
- Trend Type: Fast
- Sensitivity: 15
- Signal Mode: Aggressive
- Zone Strength: 8
FOR DAY TRADING (15M - 1H):
- Trend Type: Adaptive
- Sensitivity: 21 (default)
- Signal Mode: Balanced
- Zone Strength: 12 (default)
FOR SWING TRADING (4H - Daily):
- Trend Type: Smooth
- Sensitivity: 34
- Signal Mode: Conservative
- Zone Strength: 20
BEST MARKETS:
✓ Crypto (BTC, ETH, major altcoins)
✓ Forex (Major pairs: EUR/USD, GBP/USD)
✓ Indices (S&P 500, NASDAQ, DAX)
✓ High-liquidity stocks
═══════════════════════════════════════════════════════════════
🎓 UNDERSTANDING THE METHODOLOGY
═══════════════════════════════════════════════════════════════
This indicator is built on three core concepts:
1. ORDER FLOW THEORY
Markets move between premium (expensive) and discount (cheap) zones. Smart money accumulates in discount zones and distributes in premium zones. This indicator identifies these zones automatically.
2. ADAPTIVE TREND FOLLOWING
Unlike fixed-period moving averages, the Elite Trend Engine adjusts to current market volatility, providing more accurate trend signals in both trending and ranging conditions.
3. CONFLUENCE-BASED ENTRIES
Signals only trigger when multiple conditions align:
- Price in correct zone (premium for shorts, discount for longs)
- Trend confirmation (cloud color matches direction)
- Volume validation (spike or climax present)
- Price action strength (strong rejection candles)
This multi-layer approach dramatically reduces false signals.
═══════════════════════════════════════════════════════════════
🔔 ALERT SETUP
═══════════════════════════════════════════════════════════════
This indicator includes 5 alert types:
1. Long Signal → Triggers when buy conditions met
2. Short Signal → Triggers when sell conditions met
3. Volume Climax → Warns of pot

Dynamic Fair-Value Ribbon Pro @darshakssc1. What This Indicator Is (In Simple Terms)
The Dynamic Fair-Value Ribbon Pro is a visual tool that helps you see how price behaves around a statistically derived “fair-value zone”:
A colored ribbon/cloud marks a central “fair” area.
Areas above the ribbon are labeled as “Unfair High Zone”.
Areas below the ribbon are labeled as “Unfair Low Zone”.
A small state panel tells you where price currently sits relative to this ribbon.
All calculations are based only on historical price, volume, and volatility.
It does not predict future price, does not give buy/sell signals, and is not financial advice.
2. Adding the Indicator
Open a chart on TradingView.
Click on Indicators .
Search for “Dynamic Fair-Value Ribbon Pro” .
Click to add it to your chart.
You will see:
A cloud/ribbon around price.
Colored bars when price is outside the ribbon.
A panel in the top right describing the current state.
3. Core Concept: Fair vs Unfair Zones (Analytical Only)
The indicator tries to answer a descriptive question:
“Where is price trading relative to a historically derived central area?”
It does this by:
Calculating a central value (“fair mid”).
Building a band around that mid.
Coloring the chart depending on whether price is inside or outside that band.
It is not claiming that:
Price “must” return to the band.
Price is “overvalued” or “undervalued”.
Any state is good or bad.
It is simply a visual classification tool .
4. Engine Modes — How the Ribbon Is Calculated
Under “Fair-Value Engine” you can choose:
4.1 Mode 1: Range
Looks back over a chosen number of bars (default: 100).
Finds the highest high and lowest low in that window.
Defines a central “slice” of that range as the fair-value ribbon :
Range Mode: Lower Percent → bottom boundary of the slice (e.g., 30%).
Range Mode: Upper Percent → top boundary of the slice (e.g., 70%).
Effect:
The ribbon represents a middle portion of the historical range .
Above the ribbon = “Unfair High Zone” (analytical label only).
Below the ribbon = “Unfair Low Zone”.
This is purely statistical — it does not mean price is wrong or will revert.
4.2 Mode 2: VWAP + Stdev
In this mode, the central value is based on VWAP :
VWAP (Volume-Weighted Average Price) is used as the midline.
A standard deviation envelope is built around VWAP:
VWAP Mode: Stdev Multiplier controls how wide that envelope is.
Effect:
The ribbon shows where price is trading relative to a volume-weighted average .
Again, areas above and below are just described as “unfair” zones in a visual, analytical sense , not a predictive one.
5. ATR Adaptive Width — Making the Ribbon React to Volatility
Under “ATR Adaptive Width” :
Use ATR Adaptive Width:
On: the band width scales with volatility.
Off: band width stays fixed based on Range or VWAP settings.
ATR Length: how many bars to use for ATR.
Reference ATR (% of price): a reference level for normal volatility.
Min Width Scale / Max Width Scale: clamps the scaling so that the band doesn’t get too narrow or too wide.
What this does (analytically):
When volatility (ATR) is higher than the reference, the band can become wider .
When volatility is lower , the band can become narrower .
This is a mathematical rescaling only and does not imply any optimal levels or performance.
6. Visual Elements — What You See on the Chart
6.1 Fair-Value Ribbon (Cloud)
The cloud between Fair Ribbon Low and Fair Ribbon High is the fair zone .
Color can be changed via “Fair Ribbon Color” .
6.2 Midline
If “Show Center Line” is enabled:
A line runs through the middle of the ribbon.
In Range mode, this is the average of the upper and lower band.
In VWAP mode, it’s essentially the VWAP-based mid.
This line is for visual reference only and makes no claims about support, resistance, or reversion.
6.3 Bar Colors
Unfair High Zone: bars are colored with Unfair High Bar Color.
Unfair Low Zone: bars are colored with Unfair Low Bar Color.
Inside the ribbon:
If “Fade Bars Inside Fair Zone” is ON, bars may be more faded/neutral.
These colors are simply classification highlights ; they do not tell you what to do.
6.4 State Panel (Top Right)
If “Show State Panel” is enabled, you’ll see a small box that displays:
Current engine:
Range or VWAP+Stdev.
Current price state:
Inside Ribbon (Fair Zone)
Above Ribbon (Unfair High Zone)
Below Ribbon (Unfair Low Zone)
This is a quick summary of where price sits relative to the computed ribbon.
7. Typical Ways to Use It (Informational Only)
The indicator can help you visually:
See when price is spending time inside a historically defined central zone.
Notice when price is frequently trading outside that zone.
Compare different timeframes (e.g., 5m vs 1h vs 4h) to see how the fair zone shifts.
Experiment with:
Range length (shorter vs longer lookback).
VWAP vs Range mode.
ATR adaptation on/off.
Important:
Any interpretation of these visuals is entirely up to the user.
The script does not tell you to buy, sell, hold, or do anything specific.
8. Limitations and Important Notes
All calculations use past data only (price, volume, volatility).
The ribbon does not guarantee:
that price will revert,
that zones will hold,
or that any outcome will occur.
There are no built-in signals such as “long/short” or automatic entries/exits.
The script is best used as a supporting, visual layer alongside other tools or methods you choose.
9. Disclaimer
This indicator is:
Strictly informational and educational.
Not a trading system or strategy.
Not financial advice or a recommendation.
Not guaranteed to be accurate, complete, or suitable for any specific purpose.
Users should always perform their own research and due diligence.
Past behavior of any visual pattern or zone does not guarantee future behavior.

HTF Candles Pro by MurshidFx# HTF Candles Pro by MurshidFx
## Professional Trading Indicator for Multi-Timeframe Market Structure Analysis
**HTF Candles Pro** is an advanced, open-source trading indicator that synthesizes Higher Timeframe (HTF) candle visualization with CISD (Change in State of Delivery) detection, providing comprehensive market structure analysis across multiple timeframes. Designed for traders at all experience levels—from scalpers to swing traders—this tool enables precise alignment of trades with higher timeframe momentum while identifying critical market structure transitions.
---
## Core Functionality
This indicator integrates three essential analytical frameworks:
- **HTF Candle Visualization** – Inspired by the innovative work of Fadi x MMT's MTF Candles indicator
- **CISD Detection System** – Algorithmic identification of significant market structure reversals
- **Intelligent Session Level Management** – Automated consolidation of overlapping session markers for enhanced chart clarity
The result is a sophisticated yet streamlined analytical tool that delivers actionable market insights with minimal visual complexity.
---
## Feature Set
### Higher Timeframe Candle Analysis
Monitor higher timeframe price action seamlessly without chart switching. The indicator employs automatic HTF selection based on current timeframe, with manual override capability.
**Components:**
- **Primary HTF Display**: Automatically positioned adjacent to current price action
- **Secondary HTF Display**: Optional dual-timeframe analysis capability
- **Adaptive Time Labeling**: Context-aware formatting (intraday times, day names, week numbers)
- **Real-Time Countdown**: Optional timer displaying remaining time until HTF candle close
- **Customizable Color Schemes**: Full color customization for bullish and bearish candles
### CISD Detection (Change in State of Delivery)
The CISD system identifies critical inflection points where market structure undergoes directional change, signaling potential trend reversals or continuations.
**Mechanism:**
- **Market Structure Monitoring**: Continuous tracking of swing highs and lows
- **Liquidity Sweep Detection**: Identification of stop-hunt patterns preceding reversals
- **Reversal Confirmation**: Validation-based CISD level plotting upon structure break confirmation
- **Clear Visual Signals**: Bullish CISD (blue) and bearish CISD (red) demarcation
- **Optimized Display**: Default 5-bar line length (adjustable) minimizes chart clutter
**Technical Definition:**
CISD occurs when price breaches structure in one direction—typically sweeping liquidity and triggering stops—then reverses to break structure in the opposite direction, indicating a fundamental shift in market delivery bias.
### Intelligent Session Level Management
Eliminates visual clutter caused by overlapping session opens at identical price levels through automated consolidation.
**Functionality:**
- **Automatic Consolidation**: Merges multiple concurrent session opens into single reference lines
- **Combined Labeling**: Creates unified labels (e.g., "Week-Day Open," "4H-Day-Week Open")
- **Enhanced Clarity**: Maintains professional chart aesthetics while preserving all relevant information
**Supported Session Intervals:**
- 30-Minute Opens
- 4-Hour Opens
- Daily Opens
- Weekly Opens
- Monthly Opens
### Advanced Market Structure Tools
**Liquidity Sweep Identification:**
Highlights price wicks extending beyond previous HTF extremes that close within range—characteristic liquidity grab patterns.
**HTF Midpoint Reference:**
Displays the 50% retracement level of the most recent completed HTF candle, serving as a key reference for entries and profit targets.
**HTF Opening Price:**
Tracks current HTF candle open price, frequently functioning as dynamic support or resistance.
**Interval Demarcation:**
Visual separators defining HTF period boundaries for enhanced temporal clarity.
### Information Dashboard
Compact, customizable dashboard displaying:
- Current symbol and active timeframe
- HTF candle countdown timer
- Active trading session (Asia/London/New York)
- Current date and time
Flexible positioning: configurable for any chart corner.
---
## Default Configuration
Optimized settings for immediate professional-grade chart presentation:
- **Secondary HTF**: Disabled (enable for multi-timeframe comparative analysis)
- **CISD Bullish Color**: Blue (#0080ff) – optimal visibility with reduced eye strain
- **CISD Line Width**: 1 pixel – subtle yet discernible
- **CISD Line Length**: 5 bars – balanced visibility without excessive clutter
- **Session Opens**: Smart consolidation enabled – eliminates overlapping labels
---
## Application Strategies
### Trend Following
1. Monitor CISD confirmations aligned with HTF trend direction
2. Utilize HTF candle color for directional bias confirmation
3. Execute entries on pullbacks to HTF midpoint or open price levels
### Reversal Trading
1. Identify counter-trend CISD formations
2. Await HTF candle close confirming new directional bias
3. Use session opens as secondary confirmation levels
### Scalping
1. Trade exclusively in HTF candle direction
2. Employ lower timeframe CISD signals for precise entry timing
3. Target HTF midpoint or subsequent session open levels
### Structure-Based Trading
1. Mark liquidity sweep levels as potential reversal zones
2. Monitor CISD formations at key session opens
3. Confirm trend changes via HTF candle closes
---
## Customization Parameters
Comprehensive customization options:
- **Color Schemes**: Independent control of bull/bear candles, borders, CISD signals, session levels
- **Dimensional Settings**: Candle width, line thickness, label sizing
- **Display Quantities**: HTF candle count (1-10 range)
- **Positioning**: Candle offset, dashboard placement, label positioning
- **Line Styles**: Solid, dashed, or dotted rendering
- **Timeframe Selection**: Manual secondary HTF specification
---
## Attribution
**HTF Candle Visualization:**
The HTF candle rendering methodology draws inspiration from Fadi x MMT's "MTF Candles" indicator. Their elegant implementation of multi-timeframe candle visualization provided valuable reference for this development. Recognition and appreciation to their contribution to the TradingView community.
**CISD Detection:**
Proprietary CISD detection algorithm engineered to identify market structure transitions with high signal clarity and reduced false positive rate.
**Session Level Consolidation:**
Custom-developed intelligent grouping system addressing the common challenge of overlapping session labels at coincident price levels.
---
## Open Source License
This indicator is released as open source for the TradingView community. Permitted uses include:
- Implementation in live trading
- Educational study for Pine Script learning
- Personal modification and customization
- Distribution among trading communities
Community contributions, improvements, and derivative works are welcomed and encouraged.
---
## Implementation Guide
1. **Installation**: Click "Add to Chart"
2. **Configuration Access**: Open indicator settings panel
3. **Initial Use**: Default settings provide optimal starting configuration
4. **Optional Features**: Enable secondary HTF for multi-timeframe analysis
5. **Theme Integration**: Adjust color schemes to match chart aesthetics
---
## Best Practices
**Timeframe Optimization:**
- 1-5 minute charts: Optimal with 15m or 1H HTF
- 15-30 minute charts: Effective with 4H HTF
- 1-4 hour charts: Suitable for Daily HTF
- Daily charts: Best utilized with Weekly/Monthly HTF
**CISD Trading Guidelines:**
- Require CISD confirmation before position entry
- Prioritize CISD signals at significant levels (session opens, HTF midpoints)
- Confirm CISD direction aligns with HTF candle bias
- Apply contextual filtering—not all CISD signals warrant trades
**Session Open Strategy:**
- Weekly opens typically provide robust support/resistance
- Daily opens offer reliable intraday reference points
- 4-Hour opens effective for short-term scalping
- Consolidated labels (e.g., "Week-Day Open") indicate confluence zones with elevated significance
---
## Technical Specifications
**Performance Optimization:**
- Intelligent object management prevents TradingView rendering limits
- Efficient array processing for session consolidation
- Proper memory management through systematic object deletion
- Consistent performance across all timeframe ranges
**Compatibility:**
- Universal timeframe support
- Optimized for all market types (forex, stocks, crypto, futures)
- Minimal computational overhead
---
## Support & Development
**Feedback Channels:**
- Comment section for user feedback and suggestions
- Bug reports and feature requests welcomed
- Community-driven enhancement consideration
**Documentation:**
- Well-commented source code for learning purposes
- Clear section organization for easy navigation
- Comprehensive type definitions for structural clarity
- Educational value for market structure concept understanding
---
## Version Information
**Version:** 1.0 (Initial Release)
**License:** Open Source
**Category:** Multi-Timeframe Analysis | Market Structure
**Compatibility:** All Timeframes
**Language:** Pine Script v5
---
**For optimal results:**
- Provide feedback through comments
- Share with trading communities
- Submit enhancement suggestions
- Report technical issues for resolution
**Professional Support:**
Available through comment section for technical inquiries, implementation questions, and feature requests.
---
*Developed for the TradingView trading community | Professional-grade market structure analysis | Open source contribution*

ZFX Prime Trend Matrix PRO – Zumiko FX📌 ZFX Prime Trend Matrix PRO – Zumiko FX
ZFX Prime Trend Matrix PRO is a multi-timeframe trend dashboard designed by Zumiko FX to give traders an instant, complete market overview.
It analyzes six key timeframes simultaneously and displays trend direction, band positioning, momentum, volatility and alignment — all in one clean, horizontal table.
This matrix is made to simplify decision-making and help traders instantly identify when multiple timeframes agree on a market direction.
🔹 What the Matrix Shows
The dashboard updates in real time and displays:
1. Trend Direction
UP / DOWN / Neutral for each timeframe (M1, M5, M15, H1, H4, D1).
2. Bands Position (Prime Bands)
Shows whether price is:
Above Fast Band
Below Fast Band
Above Slow Band
Below Slow Band
Inside range
Perfect for spotting breakouts and trend continuation zones.
3. RSI (Momentum Strength)
Color-coded RSI readings help detect overbought/oversold and neutral momentum.
4. Stochastic (Timing Tool)
Reads market timing with Stoch K/D movements.
Highlights when a trend aligns with momentum.
5. ATR Bias
Instant view of volatility pressure:
LONG
SHORT
Neutral
Great for filtering entries.
6. HTF Alignment
Shows whether each timeframe is aligned with the next higher timeframe.
A powerful trend continuation filter used by advanced traders.
7. Trading Signal Zone
Final synthesised signal:
BUY ZONE → Strong bullish alignment
SELL ZONE → Strong bearish alignment
NO TRADE → Conditions not optimal
This allows traders to quickly identify “green light” moments across the trend structure.
🔹 Why This Matrix Is Powerful
✔ Shows 6 timeframes at once
✔ Helps confirm entries from other indicators
✔ Reveals hidden contradictions in trend
✔ Perfect for scalpers and day traders who need fast confirmation
✔ Works with any strategy as a high-level filter
✔ Clean, minimalistic, professional UI
🔹 Who Is It For?
Scalpers
Day traders
Swing traders
Traders using trend-following strategies
Traders who want a clean, high-level overview
🔹 About Zumiko FX
Developed by Zumiko FX, known for precision-based systems and advanced multi-timeframe tools for serious traders.

Flux AI PullBack System (Hybrid Pro)Flux AI PullBack System (Hybrid Pro)
//Session-Aware | Adaptive Confluence | Grace Confirm Logic//
Overview:
The Flux AI PullBack System (Hybrid Pro v5) is an adaptive, session-aware pullback indicator designed to identify high-probability continuation setups within trending markets. It automatically adjusts between “Classic” and “Enhanced” logic modes based on volatility, volume, and ATR slope, allowing it to perform seamlessly across different market sessions (Asian, London, and New York).
Core Features:
Hybrid Auto Mode — Dynamically switches between Classic (fast-moving) and Enhanced (strict) modes.
Session-Aware Context — Optimized for intraday trading in ES, NQ, and SPY.
Grace Confirmation Logic — Validates pullbacks with a follow-through condition to reduce noise.
Adaptive EMA Zone (38/62) — Highlights pullback areas with dynamic aqua fill and transparency linked to trend strength.
Noise Suppression Filter — Prevents false pullbacks during EMA crossovers or unstable transitions.
Weighted Confluence Model — Combines trend, ATR, volume, and swing structure for confirmation strength.
Pine v6 Compliant Alerts — Constant-string safe, ready for webhooks and automation.
Visual Elements:
Aqua EMA Zone: Displays the “breathing” pullback band (tightens during volatility spikes).
PB↑ / PB↓ Markers: Confirmed pullbacks with subtle transparency and fixed label size.
Bar Highlights: Yellow for pullbacks; ice-blue for confirmed continuation.
Use Cases
Perfect for:
Intraday trend traders
0DTE SPX / ES scalpers
Futures traders (NQ, MNQ, MES)
Algorithmic strategy builders using webhooks
Recommended Timeframes:
1–15 minute charts (scalping / intraday)
Higher timeframes for swing confirmations.
Attribution:
This open-source script was inspired by Chris Moody’s “CM Slingshot System” and JustUncleL’s Pullback Tools, but it was built from scratch using AI-assisted code refinement (ChatGPT).
All logic and enhancements are original, not derived from proprietary software.
License: MIT (Open Source)
© 2025 Ken Anderson — You may modify, use, or redistribute with credit.
Keywords:
Pullback, Reversal, AI Trading, EMA Zone, Session Aware, Futures Trading, SPX, ES, NQ, ATR Filter, Volume Confirmation, Flux System, Pine Script v6, Non-Repainting, Adaptive Trading Indicator.

MACD AI Flux Pro Dashboard V. 2Acknowledgment
This indicator is built upon the MACD-V (Volatility-Normalized MACD) methodology originally created by Alex Spiroglou, CMT, whose research (2015–2022) introduced the principle of normalizing MACD momentum by volatility (MACD/ATR). Full acknowledgment and credit are hereby given to Mr. Spiroglou as the original author of the MACD-V concept and framework.
Indicator Overview — MACD-V Flux Pro Dashboard V.2
The MACD-V Flux Pro Dashboard advances Spiroglou’s volatility-normalized foundation into a comprehensive multi-system architecture that unifies momentum, trend, volatility, and compression analytics in one visual framework. It is engineered for precision decision-making in both intraday and swing-trading environments.
Key Dashboard Features:
Dynamic Probability Engine: Calculates real-time long and short probabilities by weighting momentum, slope, compression, and volume pressure components into a composite score.
Multi-Timeframe Confirmation (HTF Tiles): Displays live directional agreement across fast, mid, and slow timeframes for confidence filtering and signal validation.
Regime Detection System: Automatically classifies the market as Trend Up, Trend Down, Compression, or Transition, applying background color cues for instant context.
Risk and News Filters: Integrates ATR-based risk gating and customizable “mute windows” to block trade signals during high-volatility or scheduled news events.
VWAP and Adaptive Bands: Plots VWAP with configurable ATR or standard-deviation bands to highlight over-extension and pullback zones.
Trend-Day and Opening-Range Logic: Monitors RTH (Regular Trading Hours) price behavior to identify potential trend-day conditions.
Smart Entry Arrows: Generates visual long/short signals only when multiple subsystems confirm direction, slope strength, and proximity to VWAP within defined thresholds.
On-Chart Dashboard Panel: Presents live metrics including probability bias, regime state, ATR level, risk status, and news filters with adaptive color-coding and optional emoji cues for intuitive interpretation.
Chart Display Summary:
All elements are presented directly on the main chart, combining price structure, VWAP bands, EMAs, and regime background shading with the real-time dashboard panel. The design eliminates the need for a secondary pane, offering a consolidated and context-rich view of market dynamics

TradeVision Pro - Multi-Factor Analysis System═══════════════════════════════════════════════════════════════════
TRADEVISION PRO - MULTI-FACTOR ANALYSIS SYSTEM
Created by Zakaria Safri
═══════════════════════════════════════════════════════════════════
A comprehensive technical analysis tool combining multiple factors for
signal generation, trend analysis, and dynamic risk management visualization.
Designed for educational purposes to study multi-factor convergence trading
strategies across all markets and timeframes.
⚠️ IMPORTANT DISCLAIMER:
This indicator is provided for EDUCATIONAL and INFORMATIONAL purposes only.
It does NOT constitute financial advice, investment advice, or trading advice.
Past performance does not guarantee future results. Trading involves
substantial risk of loss. Always do your own research and consult a
financial advisor before making trading decisions.
🎯 KEY FEATURES
═══════════════════════════════════════════════════════════════════
✅ MULTI-FACTOR SIGNAL GENERATION
• Price Volume Trend (PVT) analysis
• Rate of Change (ROC) momentum confirmation
• Volume-Weighted Moving Average (VWMA) trend filter
• Simple Moving Average (SMA) price smoothing
• Signals only when all factors align
✅ DYNAMIC RISK VISUALIZATION (Educational Only)
• ATR-based stop loss calculation
• Risk-reward based take profit levels (1-5 targets)
• Visual lines and labels showing entry, SL, and TPs
• Automatically adapts to market volatility
• ⚠️ VISUAL REFERENCE ONLY - Does not execute trades
✅ SUPPORT & RESISTANCE DETECTION
• Automatic pivot-based level identification
• Red dashed lines for resistance zones
• Green dashed lines for support areas
• Helps identify key price levels
✅ VWMA TREND BANDS
• Volume-weighted moving average with standard deviation
• Color-changing bands (Green = Uptrend, Red = Downtrend)
• Filled band area for easy visualization
• Volume-confirmed trend strength
✅ TREND DETECTION SYSTEM
• Counting-based trend confirmation
• Three states: Up Trend, Down Trend, Ranging
• Requires threshold of consecutive bars
• Independent trend validation
✅ PRICE RANGE VISUALIZATION
• High/Low range lines showing market structure
• Filled area highlighting price volatility
• Helps identify breakout zones
✅ COMPREHENSIVE INFO TABLE
• Real-time trend status
• Last signal type (BUY/SELL)
• Entry price display
• Stop loss level
• All active take profit levels
• Clean, professional layout
✅ OPTIONAL FEATURES
• Bar coloring by trend direction
• Customizable alert notifications
• Toggle visibility for all components
• Fully configurable parameters
📊 HOW IT WORKS
═══════════════════════════════════════════════════════════════════
SIGNAL METHODOLOGY:
BUY SIGNAL generates when ALL conditions are met:
• Smoothed price > Moving Average (upward price trend)
• PVT > PVT Average (volume supporting uptrend)
• ROC > 0 (positive momentum)
• Close > VWMA (above volume-weighted average)
SELL SIGNAL generates when ALL conditions are met:
• Smoothed price < Moving Average (downward price trend)
• PVT < PVT Average (volume supporting downtrend)
• ROC < 0 (negative momentum)
• Close < VWMA (below volume-weighted average)
This multi-factor approach filters out weak signals and waits for
strong convergence before generating alerts.
RISK CALCULATION:
Stop Loss = Entry ± (ATR × SL Multiplier)
• Uses Average True Range for volatility measurement
• Automatically adjusts to market conditions
Take Profit Levels = Entry ± (Risk Distance × TP Multiplier × Level)
• Risk Distance = |Entry - Stop Loss|
• Creates risk-reward based targets
• Example: TP Multiplier 1.0 = 1:1, 2:2, 3:3 risk-reward
⚠️ NOTE: All risk levels are VISUAL REFERENCES for educational study.
They do not execute trades automatically.
⚙️ SETTINGS GUIDE
═══════════════════════════════════════════════════════════════════
SIGNAL SETTINGS:
• Signal Length (14): Main calculation period for averages
• Smooth Length (8): Price data smoothing period
• PVT Length (14): Price Volume Trend calculation period
• ROC Length (9): Rate of Change momentum period
RISK MANAGEMENT (Visual Only):
• ATR Length (14): Volatility measurement lookback
• SL Multiplier (2.2): Stop loss distance (× ATR)
• TP Multiplier (1.0): Risk-reward ratio per TP level
• TP Levels (1-5): Number of take profit targets to display
• Show TP/SL Lines: Toggle visual reference lines
SUPPORT & RESISTANCE:
• Pivot Lookback (10): Sensitivity for S/R detection
• Show SR: Toggle support/resistance lines
VWMA BANDS:
• VWMA Length (20): Volume-weighted average period
• Show Bands: Toggle band visibility
TREND DETECTION:
• Trend Threshold (5): Consecutive bars required for trend
PRICE LINES:
• Period (20): High/low calculation lookback
• Show: Toggle price range visualization
DISPLAY OPTIONS:
• Signals: Show/hide BUY/SELL labels
• Table: Show/hide information panel
• Color Bars: Enable trend-based bar coloring
ALERTS:
• Enable: Activate alert notifications for signals
💡 USAGE INSTRUCTIONS
═══════════════════════════════════════════════════════════════════
RECOMMENDED APPROACH:
• Works on all timeframes (1m to Monthly)
• Suitable for all markets (Stocks, Forex, Crypto, etc.)
• Best used with additional analysis and confirmation
• Always practice proper risk management
ENTRY STRATEGY:
1. Wait for BUY or SELL signal to appear
2. Check trend table for trend confirmation
3. Verify VWMA band color matches signal direction
4. Look for nearby support/resistance confluence
5. Consider entering on next candle open
6. Use visual SL level for risk management
EXIT STRATEGY:
1. Use TP levels as potential exit zones
2. Consider scaling out at multiple TP levels
3. Exit on opposite signal
4. Adjust stops as trade progresses
5. Account for spread and slippage
TREND TRADING:
• "Up Trend" → Focus on BUY signals
• "Down Trend" → Focus on SELL signals
• "Ranging" → Wait for clear trend or use range strategies
🎨 VISUAL ELEMENTS
═══════════════════════════════════════════════════════════════════
• GREEN VWMA BANDS → Bullish trend indication
• RED VWMA BANDS → Bearish trend indication
• ORANGE DASHED LINE → Entry price reference
• RED SOLID LINE → Stop loss level
• GREEN DOTTED LINES → Take profit targets
• RED DASHED LINES → Resistance levels
• GREEN DASHED LINES → Support levels
• GREY FILLED AREA → Price high/low range
• GREEN BUY LABEL → Long signal
• RED SELL LABEL → Short signal
• BLUE INFO TABLE → Current trade details
• GREEN/RED BARS → Trend direction (optional)
⚠️ IMPORTANT NOTES
═══════════════════════════════════════════════════════════════════
RISK WARNING:
• Trading involves substantial risk of loss
• You can lose more than your initial investment
• Past performance does not guarantee future results
• No indicator is 100% accurate
• Always use proper position sizing
• Never risk more than you can afford to lose
EDUCATIONAL PURPOSE:
• This tool is for learning and research
• Not a complete trading system
• Should be combined with other analysis
• Requires interpretation and context
• Test thoroughly before live use
• Consider consulting a financial advisor
TECHNICAL LIMITATIONS:
• Signals lag price action (all indicators lag)
• False signals occur in choppy markets
• Works better in trending conditions
• Support/resistance levels are approximate
• TP/SL levels are suggestions, not guarantees
📚 METHODOLOGY
═══════════════════════════════════════════════════════════════════
This indicator combines established technical analysis concepts:
• Price Volume Trend (PVT): Volume-weighted price momentum
• Rate of Change (ROC): Momentum measurement
• Volume-Weighted Moving Average (VWMA): Trend identification
• Average True Range (ATR): Volatility measurement (J. Welles Wilder)
• Pivot Points: Support/resistance detection
All methods are based on publicly available technical analysis
principles. No proprietary or "secret" algorithms are used.
⚖️ FULL DISCLAIMER
═══════════════════════════════════════════════════════════════════
LIABILITY:
The creator (Zakaria Safri) assumes NO liability for:
• Trading losses or damages of any kind
• Loss of capital or profits
• Incorrect signal interpretation
• Technical issues, bugs, or errors
• Any consequences of using this tool
USER RESPONSIBILITY:
By using this indicator, you acknowledge that:
• You are solely responsible for your trading decisions
• You understand the substantial risks involved
• You will not hold the creator liable for losses
• You will conduct your own research and analysis
• You may consult a licensed financial professional
• You are using this tool entirely at your own risk
AS-IS PROVISION:
This indicator is provided "AS IS" without warranty of any kind,
express or implied, including but not limited to warranties of
merchantability, fitness for a particular purpose, or non-infringement.
The creator is not a registered investment advisor, financial planner,
or broker-dealer. This tool is not approved or endorsed by any
financial authority.
📞 ABOUT THE CREATOR
═══════════════════════════════════════════════════════════════════
Created by: Zakaria Safri
Specialization: Technical analysis indicator development
Focus: Multi-factor analysis, risk visualization, trend detection
This is an educational tool designed to demonstrate technical
analysis concepts and multi-factor signal generation methods.
📋 VERSION INFO
═══════════════════════════════════════════════════════════════════
Version: 1.0
Platform: TradingView Pine Script v5
License: Mozilla Public License 2.0
Creator: Zakaria Safri
Year: 2024
═══════════════════════════════════════════════════════════════════
Study Carefully, Trade Wisely, Manage Risk Properly
TradeVision Pro - Educational Trading Tool
Created by Zakaria Safri
═══════════════════════════════════════════════════════════════════

Smart Structure Pro - Market Structure & Smart Money Concepts═══════════════════════════════════════════════════════════════════════════════
SMART STRUCTURE PRO
═══════════════════════════════════════════════════════════════════════════════
A comprehensive market structure analysis tool that identifies institutional trading
patterns and smart money concepts for improved trade timing and decision-making.
═══════════════════════════════════════════════════════════════════════════════
📊 WHAT IT DOES
═══════════════════════════════════════════════════════════════════════════════
This indicator automatically detects and visualizes key market structure elements:
🔹 BOS (Break of Structure)
- Identifies trend continuation patterns
- Marks when price breaks above previous highs (bullish) or below previous lows (bearish)
- Confirms trend strength and momentum
🔹 CHoCH (Change of Character)
- Detects potential trend reversals
- Alerts when market structure shifts from bullish to bearish or vice versa
- Helps identify early reversal opportunities
🔹 Order Blocks
- Highlights institutional entry zones
- Identifies the last opposite candle before a structure break
- Shows areas where smart money likely entered positions
🔹 Fair Value Gaps (FVG)
- Detects price imbalances and inefficiencies
- Shows areas where price moved rapidly leaving gaps
- Often act as support/resistance when retested
🔹 Liquidity Zones
- Marks swing high and low levels
- Identifies areas where stop losses likely cluster
- Shows potential stop hunt and liquidity grab zones
═══════════════════════════════════════════════════════════════════════════════
🎯 HOW TO USE
═══════════════════════════════════════════════════════════════════════════════
BULLISH SETUP:
1. Wait for Bullish CHoCH (trend reversal signal) or BOS ↑ (continuation)
2. Look for price to pull back into an Order Block or Fair Value Gap
3. Enter long when price bounces from these zones
4. Place stop loss below the Order Block
5. Target the next liquidity zone or resistance level
BEARISH SETUP:
1. Wait for Bearish CHoCH (trend reversal signal) or BOS ↓ (continuation)
2. Look for price to retrace into an Order Block or Fair Value Gap
3. Enter short when price rejects from these zones
4. Place stop loss above the Order Block
5. Target the next liquidity zone or support level
DASHBOARD INTERPRETATION:
• Trend: Current market direction (Bullish/Bearish)
• Volume: Confirmation strength (High volume = stronger signals)
• Signal: Latest structure break detected
• Key High/Low: Critical levels for the current trend
• Position: Price location (Premium = expensive, Discount = cheap)
═══════════════════════════════════════════════════════════════════════════════
⚙️ SETTINGS GUIDE
═══════════════════════════════════════════════════════════════════════════════
STRUCTURE DETECTION:
• Pivot Length (Default: 10)
- Lower values = More signals but potentially weaker
- Higher values = Fewer signals but stronger/more reliable
- Recommended: 8-12 for intraday, 10-15 for higher timeframes
• Structure Line Extension
- Visual preference for how far lines extend
- Does not affect signal detection
SMART MONEY CONCEPTS:
• Order Block Extension: How long OB boxes remain visible
• FVG Extension: How long gap boxes remain visible
• Min FVG Size: Filter out small gaps (0 = show all)
- Set to 10-20% to reduce noise
- Set to 0 to see all gaps
VOLUME FILTER:
• Volume Confirmation (Recommended: ON)
- Filters weak signals without volume support
- Reduces false breakouts
• Volume Multiplier (Default: 1.5)
- Higher = Stricter filtering (fewer but stronger signals)
- Lower = More signals (but may include weak ones)
DISPLAY:
• Dashboard: Toggle information panel
• Trend Background: Subtle color tint showing current trend
• Dashboard Position: Choose corner placement
═══════════════════════════════════════════════════════════════════════════════
🔔 ALERTS
═══════════════════════════════════════════════════════════════════════════════
Available alert conditions:
✓ Bullish BOS - Uptrend continuation confirmed
✓ Bearish BOS - Downtrend continuation confirmed
✓ Bullish CHoCH - Reversal to uptrend detected
✓ Bearish CHoCH - Reversal to downtrend detected
✓ Structure Break - Any significant market structure change
To set up alerts:
1. Click the "⏰" alert icon
2. Select "Smart Structure Pro"
3. Choose your desired condition
4. Configure notification method
5. Click "Create"
═══════════════════════════════════════════════════════════════════════════════
⚠️ IMPORTANT DISCLOSURES
═══════════════════════════════════════════════════════════════════════════════
REPAINTING BEHAVIOR:
• Pivot points WILL repaint until confirmed (this is by design and unavoidable)
• Structure breaks (BOS/CHoCH) use CLOSED candles and do NOT repaint after confirmation
• Order Blocks and FVGs are drawn on confirmed signals and do NOT repaint
• All signals wait for candle close before triggering
BEST PRACTICES:
• Use on higher timeframes (15min+) for more reliable signals
• Combine with other analysis (support/resistance, volume profile, etc.)
• Wait for candle close confirmation before acting on signals
• Use proper risk management - this is not a standalone trading system
• Backtest on your preferred instrument and timeframe
PERFORMANCE:
• Limited to 100 boxes, 100 lines, 100 labels for optimal performance
• Older objects automatically removed as new ones appear
• Works on all markets (Forex, Crypto, Stocks, Indices, Commodities)
═══════════════════════════════════════════════════════════════════════════════
📚 CONCEPTS EXPLAINED
═══════════════════════════════════════════════════════════════════════════════
MARKET STRUCTURE:
Market structure refers to the pattern of price movements creating swing highs
and lows. Understanding structure helps identify trend direction and potential
reversal points.
SMART MONEY CONCEPTS:
These are trading techniques based on tracking institutional order flow and
understanding where large players (banks, funds, institutions) enter and exit
positions.
ORDER BLOCKS:
The last opposing candle before a strong directional move. Institutions often
leave unfilled orders in these zones, which can act as support/resistance when
price returns.
FAIR VALUE GAPS:
Areas where price moved so quickly that it left an imbalance. These gaps often
get "filled" as price returns to find equilibrium, creating trading opportunities.
═══════════════════════════════════════════════════════════════════════════════
🎓 EDUCATIONAL VALUE
═══════════════════════════════════════════════════════════════════════════════
This indicator helps traders:
✓ Understand market structure mechanics
✓ Identify institutional trading patterns
✓ Improve trade timing and entry precision
✓ Recognize trend continuation vs reversal
✓ Learn smart money concepts through visualization
═══════════════════════════════════════════════════════════════════════════════
📋 TECHNICAL DETAILS
═══════════════════════════════════════════════════════════════════════════════
• Version: 1.0.0
• Pine Script Version: 5
• Indicator Type: Overlay
• No Repainting: Structure breaks use confirmed candles
• Performance Optimized: Limited drawing objects
• Works On: All markets and timeframes
• Alerts: Yes, fully customizable
═══════════════════════════════════════════════════════════════════════════════
👤 AUTHOR
═══════════════════════════════════════════════════════════════════════════════
Created by: Zakaria Safri
Original Work: All code and concepts are original implementations
Based On: ICT (Inner Circle Trader) educational concepts
License: © 2024 Zakaria Safri - Personal Use Only
═══════════════════════════════════════════════════════════════════════════════
⚖️ DISCLAIMER
═══════════════════════════════════════════════════════════════════════════════
This indicator is for educational and informational purposes only. It does not
constitute financial advice. Trading involves substantial risk of loss. Past
performance does not guarantee future results. Always conduct your own research
and consult with a licensed financial advisor before making trading decisions.
The author is not responsible for any losses incurred from using this indicator.
═══════════════════════════════════════════════════════════════════════════════
If you find this indicator helpful, please:
👍 Like and favorite
⭐ Leave a review
📢 Share with other traders
💬 Comment with feedback or suggestions
Happy Trading! 📈

TrendShield Pro | DinkanWorldSmart Trailing Trend System Powered by EMA + ATR
TrendShield Pro is a powerful trend detection and trailing stop indicator designed for traders who rely on pure price movement and volatility tracking.
It dynamically adapts to market conditions using a combination of EMA (Exponential Moving Average) and ATR (Average True Range) to identify the active trend and place a visual trailing stop line.
🔍 How It Works
TrendShield Pro combines trend direction and volatility to create a self-adjusting trailing system:
EMA (Exponential Moving Average):
Smooths price fluctuations and identifies the overall market bias.
ATR (Average True Range):
Measures volatility to determine how far the trailing stop should follow the trend.
Dynamic Bands:
Two invisible thresholds are formed — up and down — around the EMA using the ATR and your chosen Factor value.
Trailing Logic:
When the EMA is rising, the Trailing Stop (TUp) locks in higher lows.
When the EMA is falling, the Trailing Stop (TDown) locks in lower highs.
The indicator switches trend automatically based on price crossing these trailing levels.
🧭 Visuals & Features
Green Trailing Line (Demand Trend): Indicates an active bullish trend.
Red Trailing Line (Supply Trend): Indicates an active bearish trend.
Arrow Signals:
🟢 Up Arrow → Bullish Trend Reversal
🔴 Down Arrow → Bearish Trend Reversal
Diamond Markers: Show points where the trailing line shifts, marking dynamic volatility changes.
⚙️ Inputs
Input Description
EMA Period Length of the Exponential Moving Average
ATR Period Period used for Average True Range calculation
Factor Multiplier for ATR-based volatility expansion

ALMASTO – Pro Trend & Momentum (v1.1)ALMASTO — Pro Trend & Momentum Strategy
Description:
This strategy is designed for precision trading in both Forex (FX) and Crypto markets.
It combines multi-timeframe trend confirmation (EMA200), momentum filters (RSI, MACD, ADX), and ATR-based dynamic risk management.
ALMASTO — Pro Trend & Momentum Strategy automatically manages take-profit levels, stop-loss, and breakeven adjustments once TP1 is reached — providing a structured and emotion-free trading approach.
Optimal Use
Works best on lower timeframes (5m–15m) with strong liquidity sessions.
Optimized for pairs like EURUSD, XAUUSD, and BTCUSDT.
Built for trend-following setups and momentum reversals with high volatility confirmation.
Recommended Settings
🔹 Forex – 5m
EMA Fast = 34, EMA Slow = 200, HTF = 1H
RSI (14): Long ≥ 55 / Short ≤ 45
MACD (8 / 21 / 5), ADX Len 10 / Min 27
ATR Len 7, Stop Loss = ATR × 2.1
TP1 = 1.1 RR, TP2 = 2.3 RR
Session = 07:00–11:00 & 12:30–16:00 (Exchange Time)
Risk = 0.8% per trade
🔹 Forex – 15m
EMA Fast = 50, EMA Slow = 200, HTF = 4H
RSI (14): Long ≥ 53 / Short ≤ 47
MACD (12 / 26 / 9), ADX Min 24
ATR Len 10, SL = ATR × 1.9
TP1 = 1.2 RR, TP2 = 2.6 RR
Risk = 1.0% per trade
🔹 Crypto – 5m (BTC/USDT)
EMA Fast = 34, EMA Slow = 200, HTF = 4H
RSI (14): Long ≥ 56 / Short ≤ 44
MACD (8 / 21 / 5), ADX Min 30
ATR Len 7, SL = ATR × 2.2
TP1 = 1.0 RR, TP2 = 2.5 RR
Session = 00:00–06:00 & 12:00–22:00 (UTC)
Risk = 0.5% per trade
Core Features
✅ Auto breakeven after TP1
✅ Dual take-profit system (1:1 & 1:2 RR)
✅ ATR-based stop & trailing logic
✅ Filters for session time, volume, and volatility
✅ Candle-body vs ATR size filter to avoid noise
✅ Optional cooldown between trades
Important Notes
Use bar close confirmation only (barstate.isconfirmed) to avoid repainting on lower timeframes.
Adjust commission (0.01–0.03%) and slippage (1–2 ticks) in Strategy Tester for realistic results.
Avoid low-liquidity hours (after 21:00 UTC for FX / after midnight for crypto).
Backtest using realistic broker data (e.g., BlackBull Markets / Bybit / Binance Futures).
Best results occur during London & New York sessions with moderate volatility.
⚠️ Disclaimer
This script is for educational and research purposes only.
It does not constitute financial advice.
Use proper risk management and test thoroughly before using on live accounts.
Developed by KING FX Labs
Built and optimized by Yousef Almasto — combining advanced price-action logic, multi-timeframe EMA structure, and volatility-adaptive ATR management.
Tested across Forex, Gold, and Crypto markets to ensure consistent performance and minimal drawdown.
📈 “Precision Trading. Zero Emotion. Pure Momentum.”

CandleTrack Pro | Pure Price Action Trend Detection📖 CandleTrack Pro | Pure Price Action Trend Detection
CandleTrack Pro is a clean, non-repainting trend detection tool built purely on price action logic.
It uses a dynamic ATR-based trailing system to detect trend shifts while keeping the chart visually simple.
🧠 How It Works
Tracks volatility using ATR.
Identifies trend shifts when price crosses trailing stops.
Highlights bullish and bearish bars visually for easy reading.
⚙️ Inputs
ATR Sensitivity: Controls how fast the trend adapts.
Use High/Low for Stop: Enables candle wick–based structure tracking.
📊 Ideal For
Traders who want a minimalist price action view with clear trend direction — no clutter, no lagging oscillators.
⚠️ Disclaimer
This script is for educational and technical analysis purposes only.
It is not financial advice. Always confirm setups using your own judgment and risk management.
FVG Scanner ProFVG Scanner Pro — Smart Fair Value Gap Detector (with HTF context & proximity alerts)
What it does
FVG Scanner Pro automatically finds Fair Value Gaps (FVGs) on your current chart and (optionally) on a higher timeframe (HTF), draws them as color-coded zones, and notifies you when price comes close to a gap boundary using an ADR-based proximity trigger and (optional) volume confirmation. It’s designed for ICT-style gap trading, confluence building, and clean visual execution.
How it works:
FVG definition
* Bullish FVG (gap up): low > high (the current candle’s low is above the high 2 bars ago).
* Bearish FVG (gap down): high < low (the current candle’s high is below the low 2 bars ago).
* Gaps smaller than your Min FVG Size (%) are ignored. (Gap size = (top-bottom)/bottom * 100.)
Higher-timeframe logic (auto-selected)
The script auto picks a sensible HTF:
1–5m → 15m, 15m → 1H, 1H → 4H, 4H → 1D, 1D → 1W, 1W → 1M, small 1M → 3M, big ≥3M → 12M.
You can display HTF FVGs and even filter so current-TF FVGs only show when they overlap an HTF gap.
Proximity alerts (ADR-based)
The script computes ADR on the current chart timeframe over a user-set lookback (default 20 bars).
An alert fires when price moves toward the closest actionable boundary and comes within ADR × Multiplier:
Bullish: price moving down, within distance of the bottom of a bullish FVG.
Bearish: price moving up, within distance of the top of a bearish FVG.
Yellow ▲/▼ markers show where a proximity alert triggered.
Volume filter (optional)
Require volume to be greater than SMA(20) × multiplier to accept a newly formed FVG.
Lifecycle
Each gap remains active for Extend FVG Box (Bars) bars.
You can delete the box after fill, or keep filled gaps visible as gray zones, or hide them.
Color legend
Current-TF Bullish: Pink/Magenta box
Current-TF Bearish: Cyan/Turquoise box
HTF Bullish: Gold box
HTF Bearish: Orange box
Filled (if shown): Gray box
Alert markers: Yellow ▲ (bullish), Yellow ▼ (bearish)
Inputs (what to tweak)
Show FVGs: Bullish / Bearish / Both
Max Bars Back to Find FVG: collection window & cleanup guard
Extend FVG Box (Bars): how long a zone stays tradable/active
Min FVG Size (%): ignore micro gaps
Delete Box After Fill & Show Filled FVGs: choose how you want completed gaps handled
Show Alert Markers: show/hide the yellow proximity arrows
Show Higher Timeframe FVG: overlay HTF gaps (auto TF)
HTF Filter: only display current-TF gaps that overlap an HTF gap
ADR Lookback & Proximity Multiplier: tune alert sensitivity to your market & timeframe
Volume Filter & Volume > MA Multiple: require above-average volume for new gaps
Built-in alerts (ready to use)
Create alerts in TradingView (⚠️ “Once per bar” or “Once per bar close”, your choice) and select from:
🟢 Bullish FVG Proximity — price approaching a bullish gap bottom
🔴 Bearish FVG Proximity — price approaching a bearish gap top
✅ New Bullish FVG Formed
⚠️ New Bearish FVG Formed
The alert messages include the symbol and price; proximity markers are also plotted on chart.
Tips & best practices
Use FVGs with market structure (break of structure, swing points), order blocks, or liquidity pools for confluence.
On very low timeframes, raise Min FVG Size and/or lower Max Bars Back to reduce noise and keep things fast.
Extend FVG Box controls how long a zone is considered valid; align it with your holding horizon (scalp vs swing).
Information panel (top-right)
Shows your mode, current HTF, number of gaps in memory, active bull/bear counts, and current-TF ADR.

Katana_Fox RSI Pro - Advanced Momentum Indicator with Clear BUOverview:
Connors RSI Pro is a sophisticated enhancement of the classic Connors RSI indicator, designed for traders who demand professional-grade tools. This premium version combines multiple momentum components with intelligent signaling and beautiful visualization to give you an edge in the markets.
Key Features:
🎯 Clear BUY/SELL Signal System
BUY signals in green when CRSI crosses above oversold level
SELL signals in red when CRSI crosses below overbought level
Clean, professional labels that are easy to read
Customizable overbought/oversold levels (70/30 default)
🎨 Professional Visualization
Modern color scheme that adapts to market conditions
Customizable background fills for better readability
Smooth, easy-to-read line plotting
⚡ Enhanced Calculations
Triple-component momentum analysis (RSI, UpDown RSI, Percent Rank)
EMA smoothing for reduced noise and false signals
Configurable lengths for each component
🔔 Advanced Alert System
4 distinct alert conditions for various market scenarios
Compatible with TradingView's native alert system
Perfect for automated trading strategies
Input Parameters:
RSI Length (3): Period for standard RSI calculation
UpDown Length (2): Period for UpDown RSI component
ROC Length (100): Period for Rate of Change percentile ranking
Signal Alerts: Toggle BUY/SELL signals on/off
Custom Colors: Choose between classic and modern color schemes
Trading Signals:
BUY (Green Label): Bullish signal when CRSI crosses above oversold level
SELL (Red Label): Bearish signal when CRSI crosses below overbought level
Background Colors: Visual zones indicating momentum strength
Ideal For:
Swing traders seeking momentum reversals
Day traders looking for overbought/oversold conditions
Algorithmic traders needing reliable signals
Technical analysts wanting multi-timeframe confirmation
How to Use:
Oversold Bounce: Enter long when CRSI shows BUY signal above 30
Overbought Rejection: Enter short when CRSI shows SELL signal below 70
Trend Confirmation: Use the 50-level crossover for trend direction
Divergence Trading: Look for price/indicator divergences at extremes
Upgrade your trading arsenal with Connors RSI Pro - where professional analytics meet clear trading signals!

ORB + Session VWAP Pro (London & NY) — fixedORB + Session VWAP Pro (London & NY) — Listing copy (EN)
What it is
A clean, non-repainting intraday tool that fuses the classic Opening Range Breakout (ORB) with a session-anchored VWAP filter for London and New York. It highlights only the higher-quality breakouts (above/below session VWAP), adds an optional retest confirmation, and scores each signal with an intuitive Confidence metric (0–100).
Why it works
• ORB provides the day’s first actionable structure (range high/low).
• Session VWAP filters “cheap” breaks and favors flows aligned with session value.
• Optional retest reduces first-tick whipsaws.
• Confidence blends breakout depth (vs ATR), VWAP slope and band distance.
Key visuals
• LDN/NY OR High/Low (line break style) + optional OR boxes.
• Active Session VWAP (resets per signal window; falls back to daily VWAP outside).
• Optional VWAP bands (stdev or %).
• Session shading (London/NY windows).
• Signal markers (LDN BUY/SELL, NY BUY/SELL) fired with cooldown.
Signals
• London Long / Short: Break of LDN OR High/Low ± ATR buffer, aligned with VWAP side.
• NY Long / Short: Same logic during NY window.
• Retest (optional): Requires a tag back to the OR level ± tolerance before confirmation.
• Confidence: 0–100; gate via Min Confidence (default 55).
Inputs that matter
• Open Range Length (min): Default 15.
• London/NY times & timezones.
• ATR buffer & retest tolerance.
• Bands mode: Stdev (with lookback) or % (e.g., 1%).
• Signal cooldown: Avoids clutter on fast moves.
Non-repaint policy
• OR lines build within fixed time windows using the current bar’s timestamp.
• VWAP is cumulative within the session window; no lookahead.
• All ta.crossover/ta.crossunder are precomputed every bar (no conditional execution).
• Signals are based on live bar values, not future bars.
⸻
Quick start (examples)
1) EURUSD, London momentum
• Chart: 5m or 15m.
• OR: 15 min starting 08:00 Europe/London.
• Signals: Use defaults; keep ATR buffer = 0.2 and Retest = ON, Min Confidence ≥ 55.
• Play:
• BUY when price breaks LDN OR High + buffer and stays above VWAP; retest confirms.
• Trail behind VWAP or band #1; partials into band #2.
2) NAS100, New York breakout & run
• Chart: 5m.
• NY window: 09:30 America/New_York, OR = 15 min.
• Retest OFF on high momentum days; Min Confidence ≥ 60.
• Use band mode Stdev, bandLen=50, show ±1/±2.
• Momentum continuation: add on pullbacks that hold above VWAP after the breakout.
3) XAUUSD, London fake & VWAP fade
• Chart: 5m.
• Keep Retest ON; accept only shorts that break OR Low but retest fails back under VWAP.
• Confidence gate ≥ 50 to allow more mean-reversion setups.
⸻
Pro tips
• Adjust ATR buffer to the instrument: FX 0.15–0.25, indices 0.20–0.35, metals 0.20–0.30.
• Retest ON for choppy conditions; OFF for news momentum.
• Use VWAP bands: take partials at ±1; stretch targets at ±2/±3.
• Session timezones are explicit (London/New York). Ensure they match your instrument’s behavior.
• Pair with a higher-TF bias (e.g., 1H/4H trend) for directional filtering.
⸻
Alerts (ready to use)
• ORB+SVWAP — LDN Long, LDN Short, NY Long, NY Short
(Respect your cooldown; alerts fire only after confirmation and confidence gate.)
⸻
Known limits & notes
• Designed for intraday. On 1D+ charts, session windows compress.
• If your broker session differs from London/NY clocks on a holiday, adjust input times.
• Session-anchored VWAP uses the script’s signal window, not exchange sessions, by design.

Liquidity Pro Map [ChartPrime]⯁ OVERVIEW
Liquidity Pro Map is a market-structure tool that simulates liquidity distribution by splitting price history into buy-side and sell-side profiles. Using candle volume and the standard deviation of close, the indicator builds two mirrored volume maps on the right-hand side of the chart. It also extends liquidity levels backwards in time until they are crossed by price, allowing you to see which zones remain untouched and where liquidity is most likely resting. Cumulative skew lines and highlighted POC levels give additional clarity on imbalance between buyers and sellers.
⯁ KEY FEATURES
Dual Liquidity Profiles: The chart is divided into buy-side (green) and sell-side (red) liquidity profiles, letting you instantly compare both sides of order flow.
Level Extension Logic: Each liquidity level is extended back in time until price crosses it. If not crossed, it persists all the way to the indicator’s lookback period, marking zones that remain “untapped.”
Dynamic Binning with Standard Deviation: The indicator distributes candle volumes into bins using close-price deviation, creating a more realistic liquidity map than static price levels.
priceDeviation = ta.stdev(close, 25) * 2
priceReference = close > open ? low - priceDeviation : high + priceDeviation
Cumulative Volume Skew Lines: Polylines on the right-hand side show the aggregated buy and sell volume profiles, making it easy to spot imbalance.
POC Identification: Highest-volume levels on both sides are marked as POC (Point of Control) , providing key zones of interest.
Clear Color Coding: Gradient shading intensifies with volume concentration—dark teal/green for buy zones, dark pink/red for sell zones.
⯁ HOW IT WORKS (UNDER THE HOOD)
Volume Distribution: Each bar’s volume is assigned to a price bin based on its reference price (close ± standard deviation offset).
Buy vs. Sell Splitting: If bins above last close price, volume is allocated to sell-side liquidity; otherwise, it’s allocated to buy-side liquidity.
Level Extension: Boxes marking liquidity bins extend back until crossed by price. If uncrossed, they anchor all the way to the start of the lookback window.
Cumulative Polylines: As bins are stacked, cumulative buy and sell values form skew polylines plotted at the right edge.
POC Levels: The highest-volume bin on each side is highlighted with labels and arrows, marking where the heaviest liquidity is concentrated.
⯁ USAGE
Use buy/sell profiles to see where liquidity is likely resting. Green shelves suggest potential support zones; red shelves suggest resistance or sell liquidity pools.
Watch untouched extended levels —these often become magnets for price as liquidity is swept.
Track POC levels as primary liquidity targets, where reactions or fakeouts are most common.
Compare cumulative skew lines to judge which side dominates in volume. Heavy buy skew may indicate absorption of sell pressure, and vice versa.
Adjust lookback period to switch between intraday liquidity maps and larger swing-based profiles.
Use separator feature to hide bins borders for better visual clarity.
Use as a confluence tool with OBs, support/resistance, and liquidity sweep setups.
⯁ CONCLUSION
Liquidity Pro Map transforms candle volume into a structured simulation of where liquidity may rest across the chart. By dividing buy vs. sell profiles, extending untouched levels, and marking cumulative skew and POC, it equips traders with a clear visual map of potential liquidity pools. This allows for better anticipation of sweeps, reversals, and areas of high market activity.
