EMA bands + leledc + bollinger bands trend following strategy v2The basics:
In its simplest form, this strategy is a positional trend following strategy which enters long when price breaks out above "middle" EMA bands and closes or flips short when price breaks down below "middle" EMA bands. The top and bottom of the middle EMA bands are calculated from the EMA of candle highs and lows, respectively.
The idea is that entering trades on breakouts of the high EMAs and low EMAs rather than the typical EMA based on candle closes gives a bit more confirmation of trend strength and minimizes getting chopped up. To further reduce getting chopped up, the strategy defaults to close on crossing the opposite EMA band (ie. long on break above high EMA middle band and close below low EMA middle band).
This strategy works on all markets on all timeframes, but as a trend following strategy it works best on markets prone to trending such as crypto and tech stocks. On lower timeframes, longer EMAs tend to work best (I've found good results on EMA lengths even has high up to 1000), while 4H charts and above tend to work better with EMA lengths 21 and below.
As an added filter to confirm the trend, a second EMA can be used. Inputting a slower EMA filter can ensure trades are entered in accordance with longer term trends, inputting a faster EMA filter can act as confirmation of breakout strength.
Bar coloring can be enabled to quickly visually identify a trend's direction for confluence with other indicators or strategies.
The goods:
Waiting for the trend to flip before closing a trade (especially when a longer base EMA is used) often leaves money on the table. This script combines a number of ways to identify when a trend is exhausted for backtesting the best early exits.
"Delayed bars inside middle bands" - When a number of candle's in a row open and close between the middle EMA bands, it could be a sign the trend is weak, or that the breakout was not the start of a new trend. Selecting this will close out positions after a number of bars has passed
"Leledc bars" - Originally introduced by glaz, this is a price action indicator that highlights a candle after a number of bars in a row close the same direction and result in greatest high/low over a period. It often triggers when a strong trend has paused before further continuation, or it marks the end of a trend. To mitigate closing on false Leledc signals, this strategy has two options: 1. Introducing requirement for increased volume on the Leledc bars can help filter out Leledc signals that happen mid trend. 2. Closing after a number of Leledc bars appear after position opens. These two options work great in isolation but don't perform well together in my testing.
"Bollinger Bands exhaustion bars" - These bars are highlighted when price closes back inside the Bollinger Bands and RSI is within specified overbought/sold zones. The idea is that a trend is overextended when price trades beyond the Bollinger Bands. When price closes back inside the bands it's likely due for mean reversion back to the base EMA in which this strategy will ideally re-enter a position. Since the added RSI requirements often make this indicator too strict to trigger a large enough sample size to backtest, I've found it best to use "non-standard" settings for both the bands and the RSI as seen in the default settings.
"Buy/Sell zones" - Similar to the idea behind using Bollinger Bands exhaustion bars as a closing signal. Instead of calculating off of standard deviations, the Buy/Sell zones are calculated off multiples of the middle EMA bands. When trading beyond these zones and subsequently failing back inside, price may be due for mean reversion back to the base EMA. No RSI filter is used for Buy/Sell zones.
If any early close conditions are selected, it's often worth enabling trade re-entry on "middle EMA band bounce". Instead of waiting for a candle to close back inside the middle EMA bands, this feature will re-enter position on only a wick back into the middle bands as will sometimes happen when the trend is strong.
Any and all of the early close conditions can be combined. Experimenting with these, I've found can result in less net profit but higher win-rates and sharpe ratios as less time is spent in trades.
The deadly:
The trend is your friend. But wouldn't it be nice to catch the trends early? In ranging markets (or when using slower base EMAs in this strategy), waiting for confirmation of a breakout of the EMA bands at best will cause you to miss half the move, at worst will result in getting consistently chopped up. Enabling "counter-trend" trades on this strategy will allow the strategy to enter positions on the opposite side of the EMA bands on either a Leledc bar or Bollinger Bands exhaustion bar. There is a filter requiring either a high/low (for Leledc) or open (for BB bars) outside the selected inner or outer Buy/Sell zone. There are also a number of different close conditions for the counter-trend trades to experiment with and backtest.
There are two ways I've found best to use counter-trend trades
1. Mean reverting scalp trades when a trend is clearly overextended. Selecting from the first 5 counter-trend closing conditions on the dropdown list will usually close the trades out quickly, with less profit but less risk.
2. Trying to catch trends early. Selecting any of the close conditions below the first 5 can cause the strategy to behave as if it's entering into a new trend (from the wrong side).
This feature can be deadly effective in profiting from every move price makes, or deadly to the strategy's PnL if not set correctly. Since counter-trend trades open opposite the middle bands, a stop-loss is recommended to reduce risk. If stop-losses for counter-trend trades are disabled, the strategy will hold a position open often until liquidation in a trending market if th trade is offsides. Note that using a slower base EMA makes counter-trend stop-losses even more necessary as it can reduce the effectiveness of the Buy/Sell zone filter for opening the trades as price can spend a long time trending outside the zones. If faster EMAs (34 and below) are used with "Inner" Buy/Zone filter selected, the first few closing conditions will often trigger almost immediately closing the trade at a loss.
The niche:
I've added a feature to default into longs or shorts. Enabling these with other features (aside from the basic long/short on EMA middle band breakout) tends to break the strategy one way or another. Enabling default long works to simulate trying to acquire more of the asset rather than the base currency. Enabling default short can have positive results for those high FDV, high inflation coins that go down-only for months at a time. Otherwise, I use default short as a hedge for coins that I hold and stake spot. I gain the utility and APR of staking while reducing the risk of holding the underlying asset by maintaining a net neutral position *most* of the time.
Disclaimer:
This script is intended for experimenting and backtesting different strategies around EMA bands. Use this script for your live trading at your own risk. I am a rookie coder, as such there may be errors in the code that cause the strategy to behave not as intended. As far as I can tell it doesn't repaint, but I cannot guarantee that it does not. That being said if there's any question, improvements, or errors you've found, drop a comment below!
Поиск скриптов по запросу "profit"

TWAP + MA crossover Strategy [Dynamic Signal Lab]Dear TV'ers,
Hereby the strategy script for the TWAP/moving average crossover, with unique taking profit options. moving averages include: EMA , WMA , DEMA , TEMA , VAR, WWMA, ZLEMA , TSF , HULL and TILL.
Use the TWAP as the slow moving average and use another moving average as the faster/more responsive moving average. Finally, you can use a green fill to visualize how much you are in profit from your entry point.
Good strategies always involve gradual taking profit, which is also possible in this script.
You can gradually take profit (and set how much%), using the following criteria:
* minimum consecutive green/red candles
* minimum amount of green/red candles in the last 2-8 candles
* both of the above criteria.
The current default properties should be modified to make this strategy cost-effective, but typically 15minutes and higher timeframes (up to 6hr) seem to work well for larger (top10 cap) crypto projects. Don't use this script for small-caps as it will get you rekt.
Additionally, you'll also be able to continuously take profit, making sure you lock in all those sweet profits. Use this script for backtesting and the indicator compagnon to fire your alerts.

Pinball Trading Strategy This is a early version of the Pinball Trading Strategy turned into a Tradingview strategy for automated backtesting. I have tried to include as many customization options as possible. Currently you can choose two options to define the trend and 5 options to define your entry. The option 'do you want the acc in your stoploss' makes for unexpected behaviour sometimes so it is advised to keep it turned off for now.
Features: Stoploss gets set to BE automatically at 40% profit. Stoploss and TP are calculated automatically from the internal FNT table (2022).
How to use: in order to backtest the original Pinball Strategy use the 1H timeframe, the 4H data gets calculated by multiplying the 1H data.
1. Select atleast one Trend and Entry option from the Inputs tab in the Options Menu.
2. Take a look at the Style tab from the Options Menu to turn plotting of specific MA's and Conditions on or off.
3. The three plots for Entry, Trend and Long conditions plot your selected rules for Entry and Trend and then ultimately the Entering of a position, respectively. So turn these on and select plotting options that give a clear view of how your selected rules behave on price.
4. I have personally found the 5M timeframe to be most profitable when running this strategy so that might be something to check out!

Oversold RSI with Tight Stop-Loss Strategy (by Coinrule)KRAKEN:LINKUSD
This is one of the best strategies that can be used to get familiar with technical indicators and start to include them in your rules on Coinrule .
ENTRY
1. This trading system uses the RSI (Relative Strength Index) to anticipate good points to enter positions. RSI is a technical indicator frequently used in trading. It works by measuring the speed and change of price movements to determine whether a coin is oversold (indicating a good entry point) or overbought (indicating a point of exit/entry for a short position). The RSI oscillates between 0 and 100 and is traditionally considered overbought when over 70 and oversold when below 30.
2. To pick the right moment to buy, the strategy enters a trade when the RSI falls below 30 indicating the coin is oversold and primed for a trend reversal.
EXIT
The strategy then exits the position when the price appreciates 7% from the point of entry. The position also maintains a tight stop-loss and closes the position if the price depreciates 1% from the entry price. The idea behind this is to cut your losing trades fast and let your winners ride.
The best time frame for this strategy based on our back testing data is the daily. Shorter time frames can also work well on certain coins, however in our experience, the daily works best. Feel free to experiment with this script and test it on a variety of your coins! With our back testing data a trading fee of 0.1% is taken into account. The fee is aligned to the base fee applied on Binance, which is the largest cryptocurrency exchange by volume. In the example shown, this strategy made a handsome net profit of 52.6% on Chainlink with 66.67% of trades being profitable.
You can execute this strategy on your favorite exchanges with Coinrule .

Ranged Volume DCA Strategy - R3c0nTraderUpdate: Republishing this as Public Open-Source script.
Credits:
Thank you "EvoCrypto" for granting me permission to use "Ranged Volume" to create this strategy.
Thank you "junyou0424" for granting me permission to use "DCA Bot with SuperTrend Emulator" which I used for adding bot inputs, calculations, and strategy
What does this do?
This script is mainly used for backtesting a Ranged Volume strategy to see how a 3Commas bot would perform.
I created this script out of necessity and I wanted a way to test a 3Commas DCA bot with a strategy based on “Volume.”
I came across "EvoCrypto’s" "Ranged Volume" study and strategy in TradingView and I liked it. I wanted to configure it so it can be used for DCA bot backtesting. I used parts from "junyou0424’s" "DCA Bot with SuperTrend Emulator" to add the following:
1. The Start Time and End Time
2. Price deviation to open safety orders (%)
3. Target Take Profit (%)
4. Trailing deviation
5. Base Order and Safety Order
6. Safety order volume scale
7. Safety order step scale
8. Max safety orders
In addition to the above, I also added chart indicators for "Take Profit" as well as "Safety Order"
Pre-requisites:
You can use this script without a 3Commas account and see how 3Commas DCA Bot and Ranged Volume strategy would perform vs. a non-DCA strategy. However, I highly recommend signing up for their free account and going through their training. This would give you a base understanding on the settings you will see in this strategy and why you will need to know them.
That said these are the pre-requisites I suggest you have:
1. Base Knowledge of 3Commas DCA bots
2. Base knowledge of settings such as “Max safety trades count”, “safety order volume scale” and “safety order step scale”. If these are alien to you, I suggest you read up on these.
3. Knowledge of setting up a Single-pair 3Commas bot for receiving custom TradingView signal.
4. A paper-bot to test your ideas. (Do not use a real money bot until you have tested it sufficiently with a paper-bot. You alone are responsible for your results!)
5. Add the study I created called "R3c0nTrader’s Ranged Volume Study” which adds a separate chart in its own pane showing the volume spikes. It will also generate the “buy” signals for your bot. NOTE: The study also has the same color scheme as this strategy and having the colors in both the strategy and the study will make things easier to see. If you use EvoCrypto’s Ranged Volume Study instead, just keep in mind that the colors won’t match, and you will have to manually match them.
6. Make your buy signals from your strategy are the same as in your study! To do this, use the same “Volume Range Length” you entered in the STRATEGY and enter that value for the “Volume Range Length” in the STUDY. Also ensure you have the same settings for “Heikin Ashi” (On or Off).
Comparisons of Ranged Volume Strategy vs Ranged Volume DCA Strategy
BTCUSD
Beware of Strategies that claim super high profits. This can easily be done by lowering the initial capital to something unrealistic. If I did that with this strategy and set the initial capital $100 and base order size to $100, I get a net profit of 2,864% which is not realistic.
How to Use
1. On the “Inputs” tab:
a. Set your Start and End Time to backtest against.
b. Set your “Volume Range Length” (number of bars to look back)
c. “Heikin Ashi Colors” – Usually I leave this enabled
d. “Show Bar Colors” – Leave enabled
e. “Show Break-Out” – Leave enabled
f. “Show Range” – Leave enabled
g. Set your other inputs which are those settings you would find in your 3Commas bot that you want to test (e.g., Price deviation to open safety orders, Target Take Profit, Base order, Safety order, etc.).
h. Quick Example for BTCUSD on 2hr chart:
i. Price deviation to open safety orders (%) = 6
ii. Target Take Profit (%) = 14
iii. Trailing deviation = 0
iv. Base order = 100
v. Safety order = 200
vi. Safety order volume scale = 2
vii. Safety order step scale = 1.4
viii. Max safety order = 5
2. On the “Properties” tab, set your initial capital, base currency, etc.
a. Initial capital – Default is 10,000 (Please use realistic values here. The amount here should be able to cover ALL your safety orders if they were triggered. Ideally, you should have funds left over and not use all trade capital.)
b. Base currency – Select your currency
c. Order Size - Not used. Use the “Inputs” tab to change your base order size.
d. Leave “Pyramiding” set to 999. This acts as a ceiling to the “Max safety orders” on the “Inputs” tab. It must always be higher than your “Max safety orders.” For example, if you set your “Max safety orders” to “4” and “Pyramiding” to “4” then it effectively means you have “3” “Max safety orders” and not “4” because it is counting each successive entry including the initial order.
e. “Commission” - Optional
f. “Verify price for limit orders” – Leave at zero. This does not change anything that I can tell.
g. Optional - Enter a value for “Commission”
h. Slippage – Optional. Slippage does not occur in backtesting but does occur in real trading but it can be simulated. Example use case for tracking performance of a real money bot: You enter the start date and time of your bot’s trade into this strategy and you notice some values are a little off due to slippage (average price, take profit, safety orders are not lining up) then you would go back here and increase the slippage until those lines up close enough with your actuals.
i. Margin for long positions – I don’t use this honestly.
j. Margin for short positions – I don’t use this honestly.
k. Recalculate “After order is filled” and “On every tick” – I don’t use this honestly.
3. “Style” tab
a. Ranged Volume Bar Coloring - You must disable bar coloring in any studies you added or this may not work properly
i. Color 0 – Default Yellow; appears when a volume breakout occurs
ii. Color 1 – Default Red; appears when a volume breakdown occurs
iii. Color 2 – Light Blue; appears when Close is higher than the Open
iv. Color 3 – Dark Blue; appears when the Close is lower than the Open
b. Take profit – Default Green; take profit line
c. Safety order – Default Light Blue; safety order line
d. No Safety Orders left – Default Red; when a trade runs out of safety orders, the line turns red and there is no safety orders left underneath to catch any further falling price movements.
e. Avg Position Price – Default Orange; your average position price for any given trade.
f. Take Profit Plot Area – Default Green; creates a highlighted area for your take profit
g. SO Plot Area – Default Light Blue; creates a highlighted area for your safety orders
h. Trades on chart – Show or hide your trades on the chart
i. Signal labels – Show or hide the trade signal labels on the chart
j. Quantity – Show or hide the trade quantity on the chart
Explanation of Chart lines and colors on chart

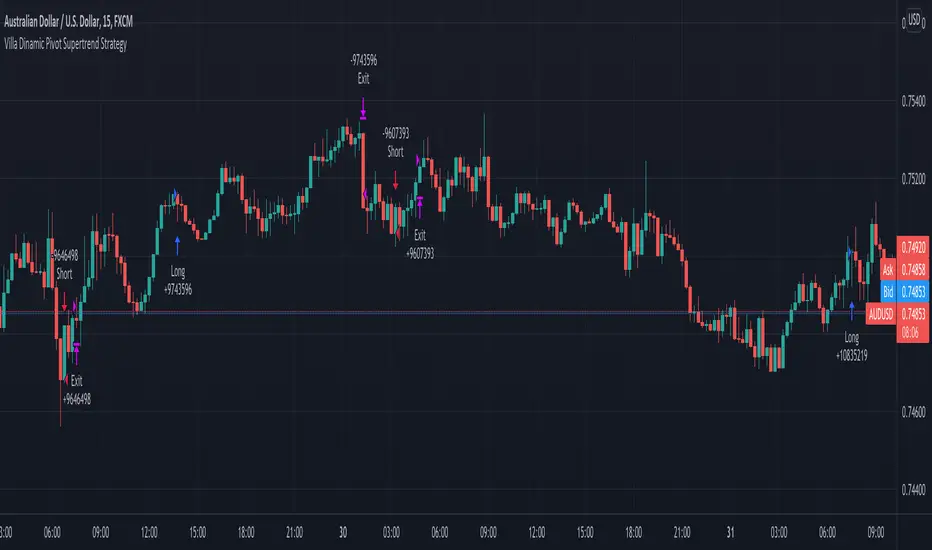
Villa Dinamic Pivot Supertrend StrategyThis strategy works better on AUD/USD in the 15 min timeframe. It uses the Pivot Supertrend to enter trades based on different filters such as:
- Simple EMA filter: that the 3 EMAs should be in order
- DEMA angle: you can choose the DEMA Angle threshold and the look back to check the angle to just trade trades with DEMA at a certain angle
- Simple DEMA filter: just check if close is above or below DEMA
- Take Every Supertrend Signal: this means to take every normal supertrend signal to not just wait for a pivot supertrend signal to enter a trade (specially on long pivot supertrend periods)
- Stop Loss at Supertrend: this means that the stop loss will be at the Normal Supertrend, if false the stop loss will be placed at the ATR level selected.
- 2 Steps Take Profit: this means if you want to close a percentage of position as soon as the normal supertrend crosses the entry price, you can select the % on the "2 Steps TP qty" input
- Stop Loss ATR Multiplier: if Stop Loss at Supertrend is off this will be the stoploss based on the atr
- Take Profit ATR Multiplier: if Stop Loss at Supertrend is off this will be the takeprofit based on the atr (you have to keep in mind that the ratio between this two will make the Risk to reward ratio of the take profit when the Stop Loss at Supertrend)
- Testing: to avoid overfitting, you can select date ranges for backtesting and forwardtesting and select which testing you wanna do
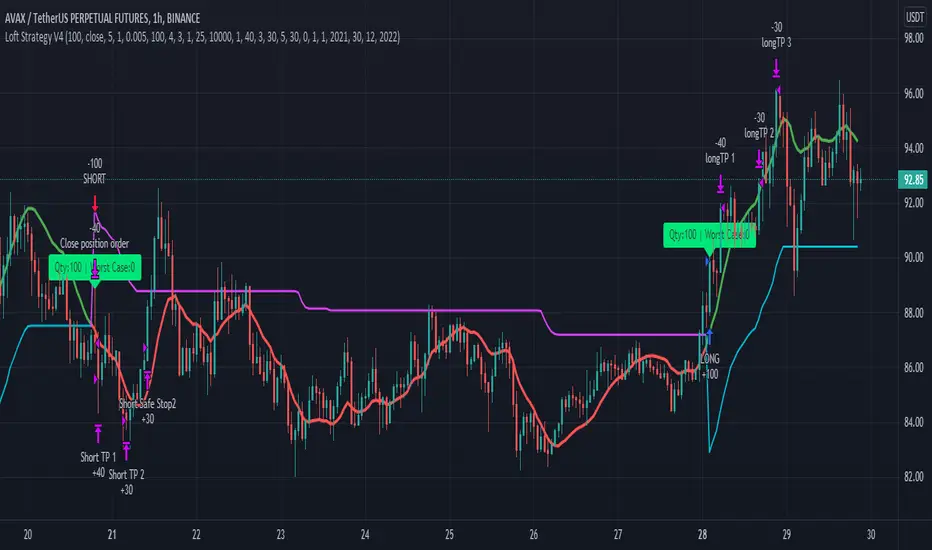
Loft Strategy V4This strategy is an advanced version of the Loft Strategy V1, I shared earlier. (Loft Strategy V1 consists of a kalman filter (by alexgrover ) and a "stop and reverse" line which is following and the kalman filter. If the price goes in the same direction as the position side, the "stop and reverse" line approaches the kalman filter as set on the "Approach Decrease Step" parameter.)
In addition to the previous version, it includes a martingale like deviation and multiple take-profit.
Here it is some parameters definitions of the strategy:
Kalman Filter: The higher this parameter, the faster and more aggressive the filter. Otherwise the filter goes very smoothly
Beginning Approach: First approximation as a percentage of stop-n-reverse line
Final Approach: Minimum approximation of stop-n-reverse line
Approach Decrease Step: If the price moves in the same direction as the strategy, the approach percentage is reduced by this parameter. Otherwise nothing do
Base Order Quantity: Initial capital of position
Max Safe Order Attempt: This parameter determines the maximum number of times the strategy will raise the bet after losing in a row.
Safe Order Deviation: if the last trade is loss, multiply the bet by this parameter (aka. martingale factor)
Profit Deviation: if last trade in loss, multiply the take-profit points
Max Order Quantity: Maximum capital allowed for a position
TP1, TP2, TP3 : Take profit spots in percentage
QT1, QT2, QT3: Amount of take-profit spots
Stop Loss: Maximum stop loss allowed for a trade
Long Entry, Short Entry: Only long side, only short side or both side
Safe Stop After TP2: If the price reaches the TP2 point, move the stop-loss point to the entry price.
Safe Stop After TP1: If the price reaches TP1, move the stop-loss point to the stop-n-reverse line.
Uptrend and Oversold Index Swing Trading System 8H--- Foreword ---
The Overbought and Oversold Index Swing Trading System or short: I11L Hypertrend primarily uses money management Strategies, EMA and SMA and my momentum Ideas for trying to produce satisfactory Alpha over a timespan of multiple years.
--- How does it Work? ---
It uses 20 different EMA's and SMA's to produce a score for each Bar.
It will credit one Point If the EMA is above the SMA.
A high score means that there is a strong Uptrend.
Spotting the strong Uptrend early is important.
The I11L Hypertrend System trys to spot the "UPTREND" by checking for a crossover of the Score(EMA) / Score(SMA).
A low score means that there is a strong Downtrend.
Its quite common to see a reversal to the mean after a Downtrend and spotting the bottom is important.
The System trys to spot the reversal, or "OVERSOLD" state by a crossunder of the Score(EMA) / Score(SMA).
--- What can i customize? ---
-> Trading Mode: You can choose between two different trading modes, Oversold and Overbought(trend) and Random Buys to check if your systems Profitfactor is actually better then market.
-> Work with the total equity: The system uses the initial capital per default for Backtesting purposes but seeing the maximum drawdown in a compounding mode might help!
-> Use a trailing SL: A TSL trys to not lose too much if the trade goes against your TP
-> Lookbackdistance for the Score: A higher Lookbackdistance results in a more lagging indicator. You have to find the balance between the confirmation of the Signal and the frontrunning.
-> Leverage: To see how your strategie and your maximum Drawdown with the total equity mode enabled would have performed.
-> Risk Capital per Trade unleveraged: How much the underlying asset can go against your position before the TSL hits, or the SL if no TSL is set.
-> TPFactor: Your risk/reward Ratio. If you risk 3% and you set the ratio to 1.2, you will have a TP at 3 * 1.2 = 3.6%
-> Select Date: Works best in the 8H Timeframe for CFD's. Good for getting a sense of what overfitting actually means and how easy one can fool themself, find the highest Profitfactor setting in the first Sector (Start - 2012) and then see if the second Sector (2012 - Now) produces Alpha over the Random Buy mode.
--- I have some questions about the System ---
Dear reader, please ask the question in the comment Section and i will do my best to assist you.

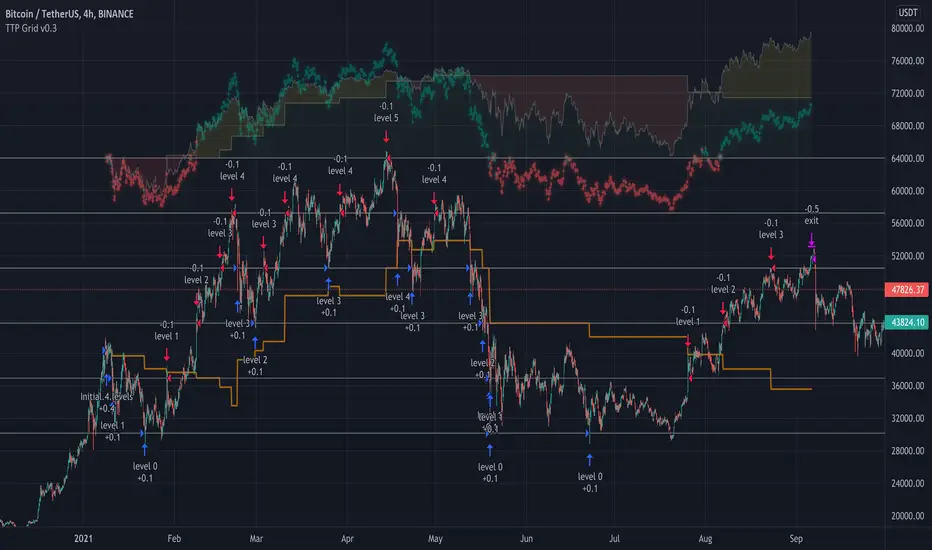
TTP Grid BacktesterThis pine script strategy allows to backtest Grid bots.
This initial version offers the following features:
- Set the top and bottom limits of the grid
- Plots the average position price, realised and unrealised profits
- Set the value to invest
- This script is a strategy so you can check each individual buy/sell, stats and all included with strategies
What does it do:
- Depending where is located the initial close price relative to the grid (above, below, inside) it will buy for as many levels are above the price.
- It will disable a level that recently filled an order (in the way grids bot do)
- When the grid starts it will disable the closest grid level
- It places limit orders in the active levels and many levels can be filled in a single candle
- You can activate recalculate on each order filled, which will allow to fill further needed orders if the price swings up and down crossing multiple times multiple grid levels but I have found that doing this can compromise the accuracy of the price used on those levels (there are minor gaps between the filled price and the original level price)
How to use it:
- When you add this strategy to the chart you will be asked to select the top and bottom limits of the grid
- Notice you can always select the strategy in the chart and drag and drop the limits to adjust the grid
- Once the grid is in place, you can use either lower chart timeframes for higher accuracy of the stats, or higher timeframes if you want to privilege longer periods of testing
How to set the correct "initial capital"
In order to prevent getting wrong stats you need to make sure you are using the correct initial capital. If you put less than what you are actually using your results will be over inflated. If you set an initial capital below what the bot requires, your results will be smaller than they should.
- If you want to use exactly 100% of the capital for the grid use then first select what amount per level you want to use. Set this value in the settings of the indicator (if you are trading BTCUSD pair, how much BTC you want to use per level, 0.01 for example).
- Once you have set this value, then open the TradingView "Data Window" to be able to visualise the calculation of cash required to run the grid that the strategy is giving you. In our example with BTCUSD this value will be given in USD.
- Enter this amount in the "Properties" tab, "Initial Capital". If you enter the exact amount you will be using all for the grid usage.
- The grid first action will be to buy 0.01 for each level that is above the current price in the first candle of the chart. If there are no levels above it won't do any initial investment.
- The rest of the cash will be use to buy levels below if the price goes to the lower range of the grid later
Intention of this script
I built this script to help me understand better how grid bots work.
Understanding the flow of realised vs unrealised profits in a grid can help me understand why sometimes even if you are in red on unrealised profits, you can still compensate with realised profits and many other tricky scenarios with grids.
Sometimes I'm running a grid bot and would like to simulate how much better (or worst) it would have been to run it using different limits.
Future work and ideas
Initially I'm focusing on confirming that the grid behaves correctly and that the stats are as accurate as possible.
That is the first priority.
Once I feel more confident with the accuracy I will consider adding some of the following ideas (not in any particular order):
- Table with stats including: price of each level, times the level filled an order, times it was use for selling/buying, etc. Time it took to become in realised profit. Comparison against profits from buy & hold.
- Trailing TP/SL
- Entry/exit price
- Trading time window: only trade between the specified dates/times
- Alerts
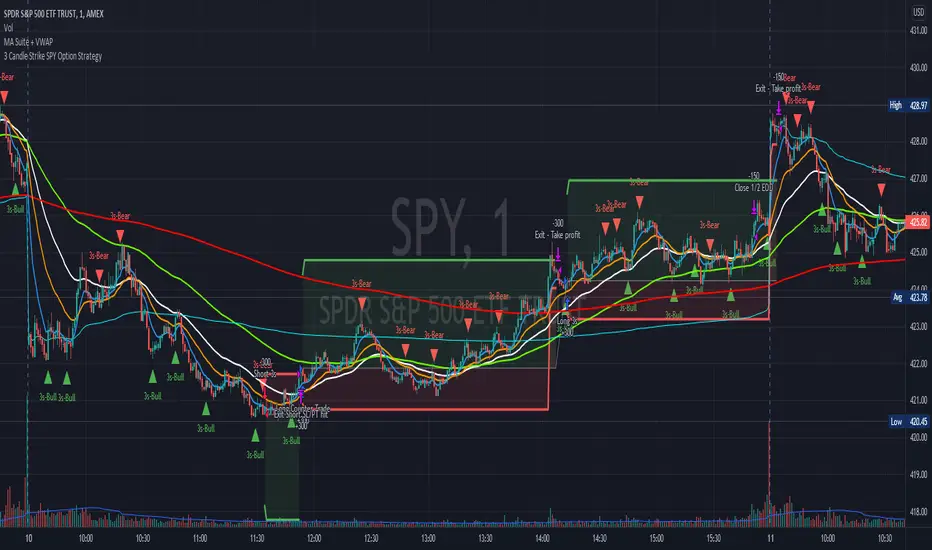
3 Candle Strike SPY Option StrategyImportant notes:
1. This strategy is designed for same day SPY option scalping. All profit shown in back testing report is based on Profit/Loss (P/L) estimates from trading options with approximately 7.5 weeks of data. By default, it is set to 10 option contracts. By default the initial capital is set to $5000.
2. This strategy also takes into account of extended market data, so turn it on for it to work as intended.
3. This strategy is mainly developed for SPY trading on 1 min chart, it probably will not work with other tickers without tweaking all the parameters first.
4. At the time of publish, the market is experiencing high volatility. Keep that in mind as market conditions changes constantly.
How it works:
Basic idea of this strategy is to look for 3 candle reversal pattern within trending market structure. The 3 candle reversal pattern consist of 3 consecutive bullish or bearish candles, followed by an engulfing candle in the opposite direction. This pattern usually signals a reversal of short term trend (a.k.a pullbacks). This strategy uses multiple moving averages to filter long or short entries. For example, if the 21 smoothed moving average is above the 50, only look for long (bullish) entries, and vise versa. There are settings to change these moving average periods to suit your needs. Linear Regression to determine whether the market is trending. The 3 candle pattern is more successful under trending market.
This strategy aims for approximately 1:3 risk to reward ratio. Stop losses are calculated using the closest low or high values for long or short entries, respectively, with an offset using a percentage of the daily ATR value. This allows some price fluctuation without being stopped out prematurely. Price target is calculated by multiplying the difference between the entry price and the stop loss by a factor of 3. When price target is reach, this strategy will set stop loss at the price target and wait for exit conditions to maximize potential profit.
By default, the strategy signals a trade in the opposite direction if the previous one had resulted in a loss. Often times, this opposite trade results in profit.
This strategy automatically signal to close all trades at 3:50 pm EST at the end of the day.
Enjoy~!!! Let's all make $$$
Trend Follower Strategy v2 [divonn1994]The Trend Follower Strategy that I made classifies red and green candles into tiny, small, and big sizes and will send buy or sell signals depending on if the candle is classified as "big" so you get into and out of a position when there is a big candle. Out during a big green candle to take profit. Out during a big red candle in case the market is turning down. It also won't enter a position unless there is positive EMA momentum.
For the chart there is a Buy and a Sell signal. Buy = 1, Sell = 0, and when the value crosses above or below 0.5 it will trigger a long position or close the long position. The graph isn't necessary to the strategy, but can help with visualizing the trade patterns in the past if you like.
This strategy works best so far with these coins at time of posting (March 4th, 2022):
KCSUSDT (621x profit), HTUSDT (45x profit), LUNAUSDT (45x profit), BNBBTC (1553x profit), ETHBTC (219x profit), KCSBTC (1222x profit), LUNABTC (83x profit), FTMBTC (52x profit).
It can work with other pairings, but I personally like these pairings best. I didn't test it with coins outside of the top 100 coins by market cap. Use it however you want.
Works best on 1 Day charts.
The strategy would rather be in the market than out. It gets out when it see's a red flag, but can immediately go back in in the next bar if the red flags are all gone. So it makes a lot of trades.
------------------------------------------------------------------------------------------------------------------------------------------------------------------------------------------------------------------------
Update: This is the same strategy I uploaded before but I made the code Open for anyone to check it out and so it has a similar description as the previous version. Let me know what you think. I'd remove the old version if I could, but I guess it's site policy to not be able to remove scripts that have been uploaded.

Titan EMA Averaging Strategy - (DYOR) By MrCryptoTitan EMA Averaging Strategy (VIP Only) Enable Longs or Shorts only Works With Crypto + Forex with correct back tested settings This is not set and forget. This requires you to back test and have relevant Risk Management in place.
The Strategy: The script uses 3EMA with engulfing candle to enter a trade in either short or long direction.
You will need to test the settings and adjust them so there isn't too many - re-entries and make sure you take profit big enough to not trigger on same candle.
When setting alerts you can use once per bar however this may trigger multiple alerts if the candle is moving very fast so this is not recommended. So doing once per bar close will mean entry is confirmed as bar is closed. You will need to select this in drop down menu.
- Max Trade Limit.
- All in one Alert. - Basically add syntax for example- Long/Take Profit/Re-entry/Emergency Stop. Then add one alert and select "Alert() function calls Only" Change Alert name to custom. That's it.
-Built-in Strategy tester.
- Trade Filter - Multi-MA Filters. - MA", "EMA", "WMA", "HullMA", "VWMA", "RMA", "DEMA", "TEMA", VWAP
- ADX Filter based on Level.
Please note when running this strategy you can only trade longs only or shorts only for this setup to be potentially profitable. Also note that setting unrealistic profit targets will make a loss. So it is very important to back test everything.
This Script does not use any Security functions. All indicators which are used part of the strategy are obtained from Trading View indicator Library and have source code has been changed to make this into Strategy.
Please Do Your Own Research before using this.
Anymore information please DM me directly

CryptoGraph Multi Algo StrategyThis is a summary of how this strategy works.
CryptoGraph Multi Algo Strategy is the second profitable real-time trading strategy by the CryptoGraph team, that generates trade signal with exact entires, exits and risk management. The strategy is intended to work nearly every crypto coin pair, stock or index.
Principles behind the strategy
Entry:
Detection of trend direction with the use of an EMA . Default setting is a length of 550.
Detection of shorter term trend direction with the use of multiple Supertrend Indicators.
Detection of an even shorter term direction with the use of a crossover of the Stochastic RSI , below or above certain levels. This would be the final condition for an entry signal.
Exit:
Once an entry signal has fired, the script will look at the current ATR Value. In the script settings there will be an option to adjust the ATR factor. While ATR factor is equal to 1, it means it will use the default ATR value distance from the candle close. When ATR factor is for example 2, it will use two times the ATR distance from the candle close.
This is a simple representation of how this strategy works, in reality there are more underlying factors.
To find the best settings for the crypto coin pair or stock you want the strategy to trade with, simply switch up the EMA , ATR Profit Multiplier and ATR Stop Multiplier and experiment which settings would fit your style best.
What to look for when testing coins or stocks?
EMA, default exponential moving average is set to 550. When above the line, it will only look for longs, when below it will only look for shorts.
The Take Profit and Stop Loss are based on ATR multiplications, adjust these in the inputs interface and you will see the exits change.
Default parameters of the strategy
This is only an example of a profitable combination of all parameters. This would be the 30 minute timeframe Bybit chart on Bitcoin.
ATR take profit at x2, ATR stop loss at x4.1.
In this example we are using an initial capital of $1.000,- while each trade 100% of this capital is used and compounds over time. Meaning every profit or loss will be added to the next trade. Also there is a 0.05% commission used based on Bybit, since we expect most trades to market in and limit out.

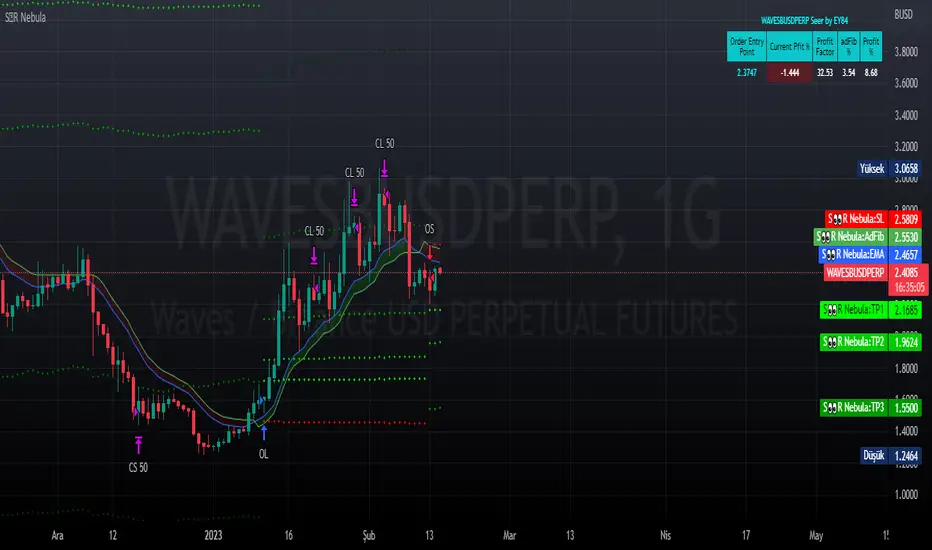
Seer by EY84This is a strategy based on Exponential Moving Averages or Volume Weighted Moving Averages against Adaptive fib resistance / support level and profit percentage which can be definetly defined by user and targeting small profits(profits will be raised by leverages).
In this strategy, there are predefined values which are collected one by one with statistical background and backtests. This gives an advantage to see which ratios are working better for each symbol.
Also this statistics are re-evaluated monthly and if there is a need they are goging to be changed with the help of libraries. Also IT IS RECOMMENDED TO USE IN HOURLY INTERVAL GRAPHICS!!!!
When we deep dive to strategy, it is based on profit percentages. it is similar to the MOST system. MOST only changes the way with default value of %2. But this hardcoded strategy is not working well with each Symbol.
So this is the point where Statistics are involved.
For Ex. while BTC is suits well with %2, it does not do wonders for RSR or RUNE which is 4-5% for each.
Library stores these values as a predefined options. Also it is allowed to change these predefined values within the settings of this strategy.
what is next ? Lets see how are we closing the positions.
Script checks cross of EMA / VWMA and adFib to decide open a position. In reversal / crosses, adFib line had been set to defined Fib. Percentage level. This sets the Full Position close / SL value for current order.
OK! we got the SL but how we get the profit ?
Now this is the place where Profit Percentage (PP) parameter involved. After the position opened it is waiting for PP to be reached. After PP had been reached, close signal had been raised for the HALF of the OPEN ORDER (with the BAR CLOSURE!!).
so tricky part has come here. Remaining position is still open and when "total available profit with remaining amount" had been reached to PP it wil raise the Close Half signal will be raised.
what happens to the SL position ? TWO possible scenarios will be raised here.
Case 1. Reversal on the adFib (short-to-long or long-to-short) will trigger full close signal.
Case 2. If the level drops the previous signal system will generate full close signal again.
Example 1:
Long Order Open : 100$
Half Close Signal : 110$
Case 1: adFib Reversal occurs : 105$ ==> Triggers Full Close Signal with Short Order.
Case 2: Price falls : 100$ ==> Only Triggers Full Close Signal.
Example 2:
Long Order Open : 100$
Half Close Signal : 110$
2. Half Close Signal : 121$
Case 1: adFib Reversal occurs : 115$ ==> Triggers Full Close Signal with Short Order.
Case 2: Price falls : 110$ ==> Only Triggers Full Close Signal.
Beside of these, strategy is also includes editable 4 EMA, 1 WMA, 1 AVWAP and Bollinger Bands Plotting (2.5x Multiplier) who wants to use them as a supportive statistics.
All feedbacks are welcome.
MA trading tool v1.0Background to the tool
The tool was built out of frustration. Having traded for many years with a reasonable level of success I was always frustrated that my trading never went up a level. The world of trading is filled with people having so much more success than me and this level of FOMO really bothered me and resulted in inconsistency and countless hours sitting in front of a screen, hoping for the best. I also became a little bit of an indicator junkie - was there a holy grail indicator out there for me? I always felt that as a retail trader I was behind the curve. I started to investigate how the major market participants trade and make money and I was astounded at the level of success that they get from creating strategies and sticking to it. The market is driven largely by a "black boxes" which, for us retail traders are outside of our ability to access. I wanted to build a tool that could give me a traders edge.
Another factor that has always bothered me was when reading investing books there is a general assumption that a standard entry, say 8/13 cross over, works on all stocks. However, it is not the case and it can be frustrating for a trader using a set up and not realizing that the set up was/is the problem, not the trader. This realization alone has made a huge impact on my trading. The big boxes that control the market know this already.
Also, a lot of indicators that are available don’t take advantage of the backtesting capability provided in Tradingview. It is fairly simple to find 8-9 trades where a set up worked and then fall into the trade of assuming that it cannot fail. Knowing which set ups work and how frequently it will print will change the way that you trade.
The goal with the tool is to identify setups that have worked in the past with a high degree of profitability, high profit factor and low drawdown and using the planning tool allows you to customize the setup to find exactly what you are looking for across any tradeable asset on TradingView.
Over the past 20 years I have realized the following:
1) Not all entries and signals work the same on all stocks and knowing the historical performance of a strategy is critical
2) Not having a plan in advance lowers your probability of success
3) Developing consistency in analysis is critical
4) Developing confidence in your own plan is more important than whose trades you try to copy
5) Having 30 indicators does not help you trade better - it leads to more frustration
So here is the product of these realisations:
1) The tool looks across the most common entry strategies (RMA / EMA/ SMA/ HMA/WMA cross on 5 dimensions of type and 5 common crossovers) and can be used on 19 different time frames giving you guidance on what the best set up is for the stock you are analysing
2) It incorporates volatility into the strategy – when stocks are trading outside of a predetermined volatility band, a trade will not be entered. This accommodates traders who tend to get shaken out of trades too early.
3) It looks at the impact of “buying the dip” – often a common strategy employed by many traders which now can be backtested and reviewed to see if it actually helped or hindered the trade.
4) It measures your trade plan against your R – what you are willing to risk – and calculates your target profit based on your R multiple
5) It provides a non repaint signal on your base strategy and provides you with signals to trade smaller or shorter signals within the bigger strategy.
There are some additional visual tools:
• Squeeze signals - I am a big fan of the TTM squeeze however the Squeeze by itself can be hard to trade. Seeing a squeeze fire long on a chart can add to trade confidence.
• Seeing zones of support and resistance rather than single lines can also give you some leeway in terms of not getting pushed out of a trade too soon.
The backtester is always reviewed on a 2 to 3 year period to get an understanding of win rate %, profit ratio and average duration of trade. As an option trader knowing that a high probability move is playing out allows me to make sure that I don’t undercut the time frame for the expiration of the option relative to the historical average duration of a trade. Backtesting on shorter times is unrealistic.
Key benefits
1) It will save you a ton of time. I don’t have to sit in front of a screen watching ticks each day. I can plan for an entry, set an alert for a trade and when the conditions are met the TradingView system sends me a message and I will go and confirm a trade, execute it, set my alerts for control and move on with my life.
2) It allows me to review trade ideas in a consistent manner using the best trade plan and set up for a stock.
3) It forces me to be patient and not panic (always a good thing). With an adjustable volatility feature I can modify the volatility band in the trade plan to accommodate choppy market conditions.
4) It looks at both sides of the market (long and short) and you can calculate the impact of being market neutral or having a directional bias.
I hope this tool helps you to achieve some degree of peace in your trading.
To get access to the tool, please contact the author.

Bollinger Bands %B - Belt Holds & Inner CandlesThis is a simple strategy that uses Bollinger Bands %B represented as a histogram combined with Candle Beltholds and Inside candles for entry signals, and combines this with "buy" and "sell" zones of the %B indicator, to buy and sell based on the zones you set.
How to use:
Long when in the green zone and an inside candle (which is highlighted in white) or a bullish belt hold (which is highlighted in yellow), and sell when inside a red zone and has an inside candle or a bearish belt hold (which is highlighted in purple) or the stop loss or take profit is hit.
Short when in the red zone and an inside candle (which is highlighted in white) or a bearish belt hold (which is highlighted in purple), and sell when inside a green zone and has an inside candle or a bullish belt hold (which is highlighted in yellow) or the stop loss or take profit is hit.
Stop loss / take profit selection:
Choose which performs best for you, ATR based uses the average true range, and % based is based on a set percent of loss or profit.
WaveTecs StrategyWelcome to the Backtesting version of "WaveTecs Strategy", the indicator itself is an invite-only script called "WaveTecs Indicator" on TradingView.
WaveTecs Strategy
WaveTecs is a Strategy that combines Wave Trend Oscillator and verifies wave momentum by using RSI and Stochastic Oscillator Values.
What is Wave Trend?
One of the most effective indicators in identifying swings is the Wave Trend indicator. Wave Trend plots waves using highs and lows between an upper band and a lower band. It looks for the opening and closing of a new wave trend movement as well as overbought and oversold areas.
How does this modified strategy work?
By using RSI and Stochastic values we are able to verify Wave inflection points to determine if there is a suitable amount of momentum to ride the swing and make profitable trades. Positions are taken or closed based on the rising or falling momentum.
Each value input can be adjusted to best suit the type of market you are trading in. By using the strategy we can optimize these value inputs to yield greater net profits. I have found the RSI and Stochastic values hugely impact entries and exits regarding trades.
For Long conditions:
- RSI & Stochastic needs to be increasing and moving out of oversold conditions to show positive momentum.
- Falling momentum results in a sell signal. I have found RSI less than 65 to be sufficient in most markets however this can be adjusted at any time to yield different results depending on your comfort level.
For Short conditions:
- RSI & Stochastic needs to be decreasing and moving out of overbought conditions to show negative momentum.
Generally, Wave Trend Strategies only take trades that are outside of the bands. This strategy allows trades inside and outside of the bands, which can be selected under the input section title "Aggressive Trading". Trading in this mode is more frequent as signals are often. Due to volatility in crypto markets, I have defaulted the source for Wave Trend waves to be Open/High/Low/Close Average which yielded great results. High/Low/Close average works very well for all other securities, and can easily be adjusted through the drop-down menu inside the inputs.
Works for all types of markets. Parameters can be adjusted but not required as indicator values are standard in the industry.
The default parameters are set to those typically used in the markets currently. However, I have found that if you adjust you to adjust the parameters based on your asset and time frame desired you will yield different results.
----------------
For example:
----------------
ETHUSDT - 4 HR, results are shown below
Wave Trend Parameters:
Aggressive Trading: Yes
Channel Length: 12
Average Length: 24
Overbought Top: 90
Overbought Bottom: 75
Oversold Bottom: -90
Oversold Top: -55
Source: hlc3
Strategy Type:
Trade Direction: Long Only
Stochastic Inputs:
Stoch Length: 18
Smoother %K: 5
Moving Average %K: 4
%K Lower Limit: 21
%K Upper Limit: 80
%K Crossunder Sell: 80
Relative Strength Index Inputs:
RSI Lower Limit: 30
RSI Upper Limit: 70
RSI Sell Value: 68
==================
WaveTecs Features
==================
Profitable Trading Strategy;
Aggressive Trading feature for more trades, with earlier entries and exits;
Customizable inputs to fine-tune your trades;
Buy & Sell Alerts (Indicator Only);
Overlay indicator only to show alerts, WaveTecs Strategy needed to see Wave Trend;
Bot Integration through webhooks;
Two different strategy modes: Long Trades Only or Long & Short Trades
Adding new features & updates whenever possible.
Add both WaveTecs Indicator and WaveTecs Strategy to your chart. WaveTecs Indicator only plots Buy & Sell Alerts, whereas WaveTecs Strategy lets you see what the strategy is doing.

DI Crossing Daily Straregy HulkTradingSimple strategy based on crossing DI+ and DI- and Average True Range.
Long entry when DI+ crossover DI-
Short entry when DI+ crossunder DI-
Stop Loss and Take Profits based on Average True Range.
Default values are 1*ATR(14) for stop loss and 2*ATR(14) for Take Profit.
Risk reward 1 to 2 ratio.
Recommended default values, but you can change it if you want.
Recommended timeframe - 1D.
Script was tested on BTCUSDT pair and have a 2.4 profit factor.

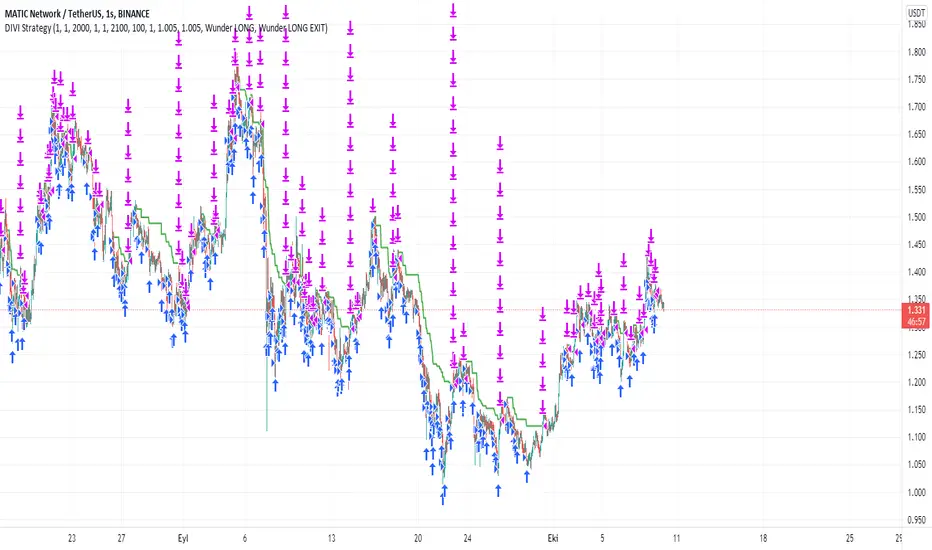
DIVI Wunder StrategyAs it is known, divergence is a situation we encounter very often on graphs. Various divergencies may occur according to many indicators. MACD divergence, RSI divergence... In the strategy I use only positive divergence. What is positive divergence I will explain on MACD positive divergence A MACD positive divergence is a situation in which the MACD does not reach a new low, despite the fact that the price of the stock reached a new low. This is seen as a bullish trading signal—hence, the term “positive divergence.” So I thought of these divergencies and came up with a new strategy. Combining the divergencies with the VOLPIN strategy I wrote earlier, a great strategy has emerged. When the divergence signals are came from MACD,RSI,CCI,OBV,Chaikin Money Flow, VWmacd and Money Flow Index all these indicators I sent a buy signal until the 40 times completed. ThenI sent to sell signal when the price come to take profit level. In this strategy, you divide your principal into as many parts as you want. For example, let's say that you have 1000 dollars of money and you make purchases by dividing this money into 40 equal parts in the default settings of the indicator. $25 per purchase. After each purchase is made as 25 dollars, you can adjust your profit rate from the profit taking settings. When you look at the results of the strategy, your profit rate will be very high. I usually use this strategy in one hour periods. Of course you change it whatever you want. Also change all settings from panel to get more profit. Have fun :)
Smart Entry BETAA Custom Unique indicator by NRTH_
Comes included with the Premium Package.
Indicator features
Built-In Alerts
Visual Risk Management
Customizable Entry Rules
Usage Tips
Smart Entry is currently a BETA algo. we are still in the process of tweaking and programming it only give entry signals when they are confirmed, and work of very strict parameters to allow for trading all the way down to the 5m timeframe. It is currently at a stage where it can produce profitable trades or even just act as a confirmation signal in use with another strategy, but this project will be ongoing until we can obtain high profitability levels on very low timeframes.
The algo uses both momentum and trend calculation to find an entry, highly recommended use with the built-in MA Filter for best results.
Works for all markets with the ability to customize to your liking.
Backtesting Results Info
Period 1/1/2021-1/10/2021
Entry value at $1000 with 10x leverage
Binance standard taker fee rate (0.04%)
ATR Exits : 1:2.9 RR
-------------------------------------------
Disclaimer
Copyright NRTH_ Indicators 2021.
NRTH_ and all affiliated parties are not registered as financial advisors. The products & services NRTH_ offers are for educational purposes only and should not be construed as financial advice. You must be aware of the risks and be willing to bear any level of risk to invest in financial markets. Past performance is not necessarily indicative of future results. NRTH_ and all individuals associated assume no responsibility for your trading results or investments.
All investments involve risk, and the past performance of a security, industry, sector, market, financial product, trading strategy, or individual’s trading does not guarantee future results or returns. Investors are fully responsible for any investment decisions they make. Such decisions should be based solely on an evaluation of their financial circumstances, investment objectives, risk tolerance, and liquidity needs.

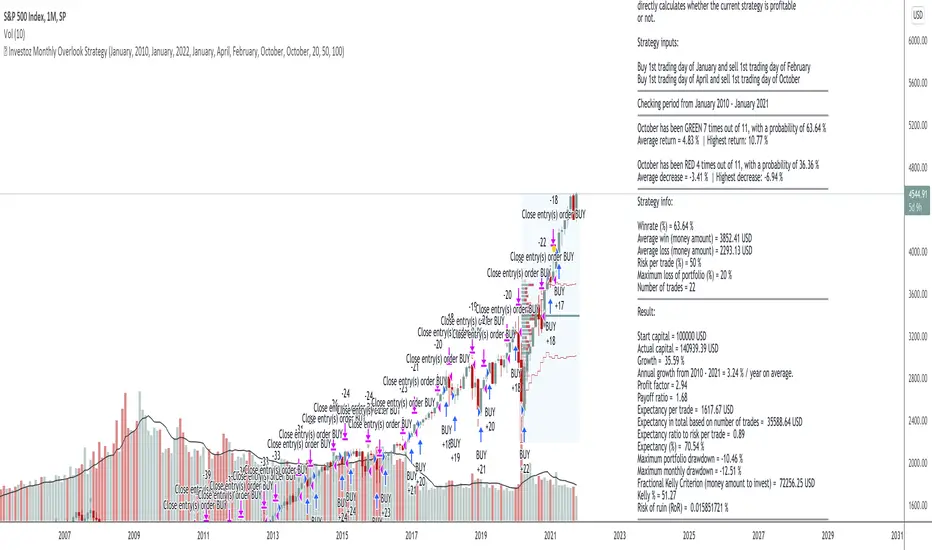
© Investoz Monthly Overlook Strategy“The best time to get involved with cyclicals is when the economy is at its weakest, earnings are at their lowest, and public sentiment is at its bleakest.”
Peter Lynch
Before I begin, read the following.
Important! The script for this strategy is only intended to work correctly for the monthly time period and does not work for other time periods, as it is based on monthly data.
The strategy
This strategy is simple and based on monthly buy and sell. However, the strategy is only intended to go long and no short positions are therefore possible.
This strategy is perfectly suited for all indices, but also for cyclical companies and cyclical markets.
Monthly analysis
You do not need to use this strategy for a buying signal only. You can use this for a more comprehensive analysis of how return per month has looked historically. It's easy to analyze, by flipping through all the months of the year. You will see average return per month, but also the largest return and decrease for each individual month.
It is also possible to choose between which time periods you want to analyze. You can go all the way back to the year 1900.
This is necessary if you are going to analyze markets that have a long historical data to analyze.
How it works
1. Start by choosing which time period the analysis or strategy should apply between.
2. Choose which month the first and second buy will be valid from. Here it is important to know that depending on which month you choose, is meant a buy after the current month's closing.
Example: 1 = January. Buy will therefore be after January closes, ie the first trading day in February. It will be displayed as 1st trading day in February. If you only want one buy option, then choose the same month for both first and second buy.
3. Choose which month the first and second sell will be valid from. The same applies here as above.
4. Choose money management according to the criteria that suit you and press "OK".
Result
Based on the choices you have made, you will now get a result of how the strategy has performed over the given period. You will be able to read following data.
Data
Start Capital -the trading capital you have from the beginning.
Actual Capital -the current trading capital you have at the moment.
Growth -percentage growth over the total trading period.
Annual growth -average return for the chosen period.
Profit factor -the profit factor looks at the total gains and losses.
Payoff ratio -looks at the average profit and loss.
Expectancy per trade -the expected profit or loss of a single trade.
Expectancy in total based on number of trades -the expected profit or loss for all the trades made.
Expectancy ratio -the power of an edge. With this, you are always looking for a positive expectancy to show you that the trade is profitable.
Expectancy % -the expected return in percentage based on all the trades
Maximun drawdown -drawdown for a single trade based on current trading capital
Fractional Kelly Criterion -the optimal amount to invest based on the strategy and multiplying it by a certain fraction (%). This results in less volatile returns and a lower chance of the account balance hitting zero.
Kelly % -percentage of capital to be put into a single trade.
Risk of ruin -the chance that you will lose all the amount you typed in for "Maximum loss of portfolio".
Conclusion
It is important to know if you have an edge in your strategy and above all to understand risk. With the help of all this information, it will therefore be easier to adapt the risk to the strategy, not the other way around. This approach applies to all types of strategies. Be aware of the risk, first!
=============================================================================================================================================================
DISCLAIMER
Any data and information is provided 'as is' solely for informational purposes, and is not intended for trading purposes or advice. Past performance is not indicative of future results.
Educate yourself on the risks associated with trading, and seek advice from an independent financial or tax advisor if you have any questions.
=============================================================================================================================================================
SQZ Multiframe StrategyThis is a first attempt to automate what my current strategy when trading is.
It uses 2 timeframes: the one you are currently using to see the chart and an "anchor trend" which is a higher order frame.
Supported timeframes are: 1m, 5m, 15m, 30m, 1H, 4H, 1D, 1W
The Strategy relies on two indicators:
Squeeze Momentum Indicator
CMF
How does it works?
It looks for a moment when the following conditions are met.
For Long:
Positive directionality in SQZM monitor in anchor timeframe
Positive directionality in SQZM monitor in current timeframe
Recent minimum in CMF
For Short:
Negative directionality in SQZM monitor in anchor timeframe
Negative directionality in SQZM monitor in current timeframe
Recent maximum in CMF
After a BUY or SELL order is executed the plot will start showing two lines: A TP line, and a SL line.
The TP and SL move dynamically based on a greedy algorithm based on 3 input parameters.
Min Profit to Start Moving SL (%): Sets an initial target for the trade.
Maximum Possible of SL (%): This is the maximum amount possible for SL. If volatility is not too high, a shorter SL will be chosen based on Kaufman's Stops method
Take profit factor: Is how much portion of the target I am taking as profit once the target is reached
Example for 5% Min profit:
When the first target is reached (+5%), the SL will be updated to 2.5% over the enter price.
When the second target is reached (+10%), the SL will be updated to 5% over the enter price.
Note: The strategy might abandon the position prematurely if a contrary signal is received while the trade is opened, and will change direction.
The Strategy has been backtested mostly for crypto. It might be good for stocks too, but the parameters mentioned might need some adjustments since price moves at a different rate.
Recommended timeframe is 4H for BTC , and 30min/1H for alts.
Comments and ideas are more than welcome!

Qullamaggie Breakout V2After publishing the Qullamaggie Breakout script and seeing that it had some decent results, I wanted to explore it a bit further. There were a few things I didn't like about that methodology that didn't really jive with the way I like to trade. So what I did was combined the Breakout Trend Follower strategy I had been using for entries with the Qullamaggie strategy for trailing stops once in profit. The results seem pretty good to me and an approach that fits my personality and something I can actually trade. Typically better profit than the Breakout Trend Follower by giving more room for your winners to run, while still protecting your entries by moving up the trailing stop until you are in profit, all while taking less trades, so that's great.
Everything is done with stop orders. So you set your buy stop at the recent swing high point and wait for a breakout. Once in a position you set your sell stop at the recent swing low point. The most recent swing high and low are shown on the chart for easy reference with the blue and orange horizontal lines. Once in a trade, trail your sell stop after a new swing low is registered (shown by the thicker orange stop line). Once you are in profit, leave that hard stop level there (the orange line will stay there helping you). Now, you wait for price to cross a Moving Average of your choosing (default is Daily 10 MA). Once the bar crosses that moving average, you move your stop to the low of that candle (shown by the blue stop line) and trail your stop along every crossing of the moving average until the trend changes and takes out your stop. So managing this trade is pretty easy...just wait for the stop lines to move and move your stop with them. It's a great way to trade when you can't be at your computer all the time because the stop orders take care of execution on both buy and sell side. If you use a daily timeframe for your moving averages (the default), you really only need to move stops around about once a day, so is a good part time trader's strategy in my opinion.
The best opportunities will come by scanning for stocks in the longer term timeframe of your moving averages. Wait for a consolidation on that timeframe so the anticipated breakout has some room to run. Once you've identified a good candidate, zoom in to your lower timeframe where the swing highs/lows will act as your entry and exit points, all while keeping the moving averages consistent between timeframes.
Hope you guys find it useful.
A few options available:
- Choose any timeframe for your moving averages, while using swing high/low points on intraday charts.
- Choose one of two moving averages shown for your trailing stops (default 10 and 20 MA).
- Choose to use the third moving average as a filter for keeping you out of trades that are below it (trading with the trend).
- Use the charts resolution candle or the moving average resolution candle for the moving average trailing stop.
- Only take trades where your buy level minus stop level is below a % of the Average Daily Range (ADR). This allows you to potentially have better risk/reward. I added a little table that shows the ADR of the stock/ticker as well as the range between the recent buy and sell levels (shown by the orange and blue horizontal lines) for easy reference.
