SWING PointJust the movement of price and its swing: after a bottom or a top if there is a inversion of trend the price has to break some area. This script show the possibles zone of pullback. The background bars color suggest possible point of entry, but are still not accurate has they should be, so look at the break of res/sup by yourself.
Поиск скриптов по запросу "pullback"

Price Action Doji Harami v0.2 by JustUncleLThis is an updated and final version of this indicator. This version distinguishes between the true Harami and the other Doji candlestick patterns as used with the Heikin Ashi candle charts. These candle patterns indicate a potential trend reversal or pullback.
The patterns identified are:
- Bearish Harami (Red Highlight above Bar):
One to three (default 3) large body Bull (green) candles followed by a small (red)
or no body candle (less than 0.5pip) with wicks top and bottom that are at least 60% of candle.
- Bullish Harami (Green Highlight below Bar):
One to three (default 3) large body Bear (red) candles followed by a small (green)
or no body candle (less than 0.5pip) with wicks top and bottom that are at least 60% of candle.
- Bearish Doji (Fuchsia Highlight above Bar):
One to three (default 3) large body Bull (green) candles followed by a small (green)
with wicks top and bottom that are at least 60% of candle.
- Bullish Doji (Aqua Highlight below Bar):
One to three (default 3) large body Bear (red) candles followed by a small (red)
with wicks top and bottom that are at least 60% of candle.
You can optionally specify how large the candles prior to Harami/Doji are in pips, default is 0 pip.
If you set this to zero then it will have no candle size consideration. You can also specify how many look back candles (1-3) are used in Harami/Doji calculations (default 3).
Included option to perform Calculations purely on Heikin Ashi candles, this helps when you want to see the HA Doji/Harami bars with the normal candle stick chart.
Also can optionally set an alert condition for when Harami/Doji found, this also displays a circle on the bottom of the screen when alert is triggered.

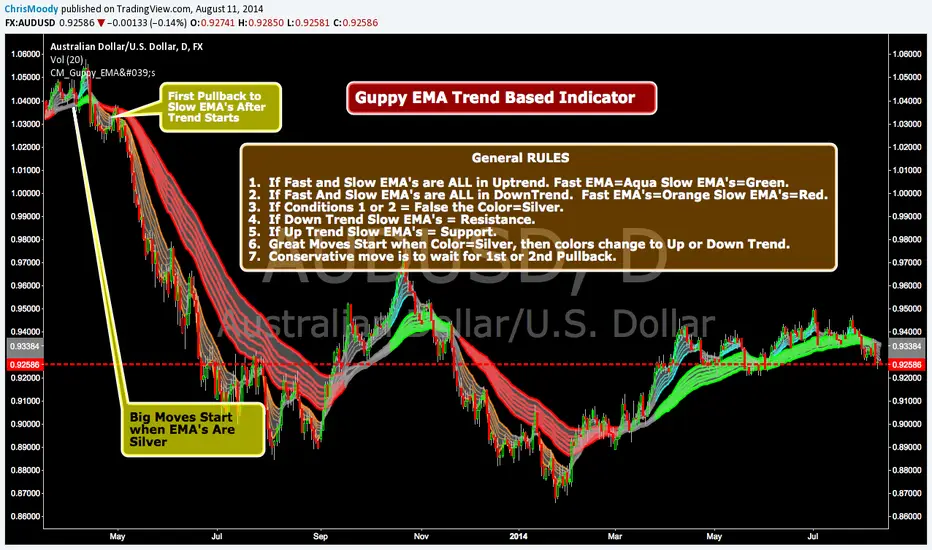
CM_Guppy_EMAGuppy EMA Trend Based Indicator Requested by 2use
General RULES
1. If Fast and Slow EMA's are ALL in Uptrend. Fast EMA=Aqua Slow EMA's=Green.
2. If Fast And Slow EMA's are ALL in DownTrend. Fast EMA's=Orange Slow EMA's=Red.
3. If Conditions 1 or 2 = False the Color=Silver.
4. If Down Trend Slow EMA's = Resistance.
5. If Up Trend Slow EMA's = Support.
6. Great Moves Start when Color=Silver, then colors change to Up or Down Trend.
7. Conservative move is to wait for 1st or 2nd Pullback.
My Swift-like Algo ALIMOJANIDSwift Algo Chart is a trend-following trading indicator designed to provide clear bias, precise entries, and visual risk management.
It combines EMA trend direction, pullback-based signals, market structure (HH/HL/LH/LL), and ATR-based Stop Loss & Take Profit levels to help traders make disciplined decisions.
🔑 Key Features
Trend Regime Detection
Identifies LONG, SHORT, or NO TRADE conditions using Fast & Slow EMAs.
Pullback Entry Signals
Signals appear only in the direction of the active trend, with optional RSI confirmation.
ATR-Based Risk Levels
Automatically plots SL, TP1, and TP2, including exact price values on the chart.
Preview Levels
Shows projected SL/TP levels when a trend is active, even before an entry.
Market Structure Visualization
Marks HH / HL / LH / LL, draws structure lines, and highlights BOS and CHOCH.
Clean & Non-Repainting Logic
Uses confirmed pivots and closed candles for stability.
Strategy-Compatible
Can be used for discretionary trading or full strategy backtesting.
🧠 Best Used For
Crypto, Forex, Indices
15m to 4H timeframes
Traders who want structure + trend + risk clarity in one tool

My Swift-like Algo J.ALIMOJANIDSwift Algo Chart — Trend, Structure & ATR Risk
Swift Algo Chart is a trend-following trading indicator designed to provide clear bias, precise entries, and visual risk management.
It combines EMA trend direction, pullback-based signals, market structure (HH/HL/LH/LL), and ATR-based Stop Loss & Take Profit levels to help traders make disciplined decisions.
🔑 Key Features
Trend Regime Detection
Identifies LONG, SHORT, or NO TRADE conditions using Fast & Slow EMAs.
Pullback Entry Signals
Signals appear only in the direction of the active trend, with optional RSI confirmation.
ATR-Based Risk Levels
Automatically plots SL, TP1, and TP2, including exact price values on the chart.
Preview Levels
Shows projected SL/TP levels when a trend is active, even before an entry.
Market Structure Visualization
Marks HH / HL / LH / LL, draws structure lines, and highlights BOS and CHOCH.
Clean & Non-Repainting Logic
Uses confirmed pivots and closed candles for stability.
Strategy-Compatible
Can be used for discretionary trading or full strategy backtesting.
🧠 Best Used For
Crypto, Forex, Indices
15m to 4H timeframes
Traders who want structure + trend + risk clarity in one tool

ADR% / ATR / LoD dist. Table - V2ADR% / ATR / LoD Distance Table (V2) + ATR Range Lines is a simple “daily volatility dashboard” that helps you quickly judge how extended a stock is during the day and where “normal” daily movement zones sit relative to price.
It’s designed to help you answer:
“Has this stock already made most of its usual daily move?”
“Am I chasing too late?”
“Where are typical +ATR / −ATR stretch and pullback zones?”
What you’ll see
ADR% (Average Daily Range %)
Shows the stock’s typical daily travel (low → high) as a percentage.
Example: ADR% = 4% means the stock often swings ~4% in a normal day.
ATR (Average True Range)
Shows the stock’s typical daily movement in price units ($ / points).
Example: ATR = 2.50 means it often moves about $2.50 per day.
LoD dist. (Low of Day distance)
Shows how far price is from today’s Low of Day, measured relative to ATR (as a %).
Higher % = more extended away from the day’s low.
Optional: ATR Range Lines (added in this version)
You can enable two guide lines that extend to the right:
ATR Up Line = Price + ATR
ATR Down Line = Price − ATR
These act like volatility guardrails to visualize “typical daily stretch” and “typical pullback” zones.
ATR “Live vs Locked” option (important)
Lock ATR to last completed day (no intraday updates):
ON (Locked): Uses the last completed daily ATR (yesterday’s finished value).
✅ ATR stays constant all day while the market is live.
OFF (Live): ATR can update intraday as today’s daily candle expands.
✅ ATR may change during the session.
Either way, ATR is still based on your chosen ATR Length (lookback period). Locking simply prevents the ATR from drifting intraday.
How to use it (Kullamägi-style principle)
Kristjan Kullamägi’s momentum style emphasizes pressing strength when conditions are right, but also respecting extension and risk/reward. This tool helps you quantify that:
If ADR%/ATR suggests the stock already moved near its usual daily range, chasing can be lower reward.
The ATR lines help you visualize when price is in a “normal stretch zone” vs a better risk area.
Locking ATR gives you stable intraday reference levels for cleaner execution.
Tips
Use ADR% to understand whether there’s likely “room” left in today’s move.
Use LoD dist. to quickly gauge if price is already far from the day’s low (extended).
Use ATR Up/Down Lines as a simple volatility framework for entries, add-ons, and risk planning.
Keep Lock ATR ON if you prefer stable levels throughout the session.
Credits
Original indicator concept & script: ArmerSchlucker
ADR% formula credit: MikeC / TheScrutiniser and GlinckEastwoot
Modifications (V2): TradersPod
Added optional ATR Up/Down lines extending to the right
Added “Lock ATR to last completed day” option for stable intraday ATR reference
Kept the original logic and purpose intact

Adaptive Log Trend Zones + Retest SignalsAdaptive Log Trend Zones + Retest Signals
Adaptive Log Trend Zones is a trend-following overlay built to identify high-probability breakout retests in strong market conditions. It combines logarithmic regression , volatility-adaptive behavior , and ATR-based trend zones to help traders stay aligned with dominant momentum while avoiding chop.
🔹 Core Features
Logarithmic Regression Midline
Uses linear regression on log price to better handle exponential market moves
Produces smoother, more realistic trend structure on higher timeframes
Volatility-Adaptive Lookback
Automatically expands or contracts the regression length based on ATR volatility
Reacts faster in high volatility, smoother in consolidation
Dynamic Trend Zones
Upper and lower bands are ATR-adjusted and trend-colored
Optional future projection for visual trend guidance
Breakout → Retest Signal Logic
Detects clean breakouts beyond the trend zone
Waits for a controlled pullback (retest) before signaling
Signals only trigger when trend strength is confirmed
Trend Quality Filter
Internal regime detection filters out low-quality, sideways conditions
Uses slope strength and volatility compression to validate entries
🔹 Signals
BUY : Bullish breakout followed by a valid retest in a trending regime
SELL : Bearish breakout followed by a valid retest in a trending regime
Signals are designed for trend continuation , not mean reversion.
🔹 Best Use Cases
Crypto, Forex, and Index markets
Higher timeframes (15m+ recommended)
Trend continuation and pullback strategies
⚠️ Notes
This indicator is not a standalone trading system . Always use proper risk management and confirm signals with structure, volume, or higher-timeframe context.
Designed for traders who prefer structure, patience, and momentum alignment.

Ultimate Futures Daytrade Suite v1 - The Strategy GuideHere is the complete **Strategy Guide** translated into English.
---
# 📘 Ultimate Futures Daytrade Suite – The Strategy Guide
### 1. The Visual Legend (What is what?)
Before you trade, you need to understand the hierarchy of your lines. Not every line has the same importance.
* **🟣 Daily EMA 50 (Neon Violet):** The **"Big Boss"**. It determines the **Macro Trend**.
* *Price above:* We are primarily looking for Longs.
* *Price below:* We are primarily looking for Shorts.
* **🟢 4h EMA 50 (Neon Green):** The **"Swing Trend"**. Your most important level for **Pullback Entries** (Re-entries).
* **🟡 POC (Gold) & TPO:** The **"Magnet"**. Price often returns here.
* *Rule:* Never open a trade directly *on* the POC (Risk of "Chop"). Use it as a **Target** (Take Profit).
* **🟠 IB High/Low (Orange Lines):** The **"Daily Structure"**.
* A breakout from the IB (Initial Balance) often indicates the trend direction for the day.
* **🟥/🟩 Boxes (Supply/Demand):** Resistance and Support zones from the 1h timeframe.
* **⬜ FVG Boxes:** "Gaps" in the market that are often filled.
---
### 2. The Trading Workflow (Top-Down Method)
Go through this mental checklist before every trade:
#### Step 1: Trend Check (The Traffic Light)
Look at the **Violet Line (Daily)** and the **Green Line (4h)**.
* **Bullish:** Price is above Violet AND above Green. -> *Focus: Buy dips.*
* **Bearish:** Price is below Violet AND below Green. -> *Focus: Sell rallies.*
* **Mixed:** Price is between Violet and Green. -> *Caution! Market is undecided (Range Trading).*
#### Step 2: Location (The Context)
Where is the price currently located?
* Are we at a **Green Demand Zone**?
* Are we testing the **4h EMA 50 (Green)** from above?
* Are we at the **VWAP**?
* *Never trade in "No Man's Land"!* Wait until the price touches one of your lines.
#### Step 3: Trigger (The Execution)
Now zoom into your lower timeframe (e.g., 5min or 15min).
* Wait for a reaction at the zone.
* Use the **EMA 9 (Yellow)** as a momentum trigger. If price breaks the EMA 9 and closes above/below it, that is your "Go".
---
### 3. The Setup Blueprints
Here are the two most profitable scenarios you can trade with this script:
#### A) The "Golden Trend" Setup (Long)
* **Context:** Price > **Daily EMA (Violet)**.
* **Preparation:** Price corrects (drops) back to the **4h EMA 50 (Green)** or to the **VWAP**.
* **Confluence:** Ideally, there is also a **Demand Zone (Green Box)** or an **FVG** at that level.
* **Entry:** As soon as a candle touches the zone and closes bullish again (or reclaims the EMA 9).
* **Stop-Loss:** Below the 4h EMA 50.
* **Take-Profit:** Next **Supply Zone (Red)** or the **IB High (Orange)**.
#### B) The "Daytrade Breakout" (Intraday)
* **Context:** Price opens inside yesterday's Value Area.
* **Signal:** Price breaks through the **IB High (Orange)** with momentum.
* **Filter:** Price must be above the **VWAP**.
* **Entry:** On the retest of the IB High or directly on the breakout.
* **Target:** Price often trends in that direction for the rest of the day.
---
### 4. Warning Signals (When NOT to trade)
1. **The "Concrete Ceiling":** If you want to go Long, but the **Violet Daily EMA 50** is running directly above you. This is massive resistance. Better wait until it is broken.
2. **The "POC Dance":** If price is dancing sideways around the **Gold Line (POC)**. This is a "No-Trade Zone". Day traders lose the most money here due to fees and whipsaws.
3. **Overextension:** If price is extremely far away from the **4h EMA 50 (Green)** (Rubber Band Effect). Do not enter in the trend direction here; wait for a pullback to the line.
### Summary
Your chart is now telling you a story:
* **Violet** tells you the Direction.
* **Green** gives you the Entry.
* **Red/Green Boxes** show you the Obstacles.
* **Yellow (EMA 9)** gives you the Timing.
Good luck with the Suite! This is a setup similar to what institutional traders use.

XAUUSD 15m - Clean Signals (Anti-Spam v3)This **XAUUSD 15m – Clean Signals (Anti-Spam v3)** is a trend-aligned signal indicator built around an **EMA basis + ATR channel**. It aims to produce **fewer but cleaner** long/short prompts. A 7-EMA acts as the basis line, ATR forms inner/outer bands, and a 50-EMA provides a trend filter. By default, it uses **ADX strength filtering** plus a **confirmation candle** rule to avoid choppy conditions and weak breakouts. Signals come in three types: **DR (pullback → reversal back above/below the basis)**, **MR (pierce the inner band then reclaim it)**, and **BO (inner-band breakout, off by default due to over-triggering)**. To control frequency, it adds a **cooldown (minimum bars between signals)** and a strict **arming/reset de-duplication**: after a same-direction signal fires, it won’t fire again until price “resets” by touching the inner band or the basis (user-selectable). A “room to outer band” filter helps prevent chasing near extremes. Overall, it’s designed for disciplined 15-minute momentum-pullback entries, especially during liquid sessions like London.

VWAP + EMA 20/50 Scalping PRO - PRAKASH✅ VWAP + EMA 20/50 SCALPING — PRO RULES
1️⃣ Chart Setup (30 seconds)
Timeframe: 1-min or 3-min
Indicators:
VWAP (Session)
EMA 20
EMA 50
Use on Index chart (NIFTY / SENSEX), not option chart
2️⃣ Trend Filter (FIRST CHECK)
Condition Market Bias
EMA 20 > EMA 50 Bullish
EMA 20 < EMA 50 Bearish
EMA 20 = EMA 50 (flat) ❌ No trade
👉 Never trade against EMA alignment
3️⃣ VWAP Position = Permission
Price vs VWAP Allowed Trade
Price above VWAP CE only
Price below VWAP PE only
Price cutting VWAP ❌ Skip
👉 VWAP decides BUY or SELL side
4️⃣ ENTRY SETUP (MOST IMPORTANT)
✅ CE ENTRY
EMA 20 > EMA 50
Price above VWAP
Pullback to EMA 20 or VWAP
Strong green candle close
✅ PE ENTRY
EMA 20 < EMA 50
Price below VWAP
Pullback to EMA 20 or VWAP
Strong red candle close
5️⃣ STOP LOSS & TARGET (FIXED)
Target: 10–15 points
SL:
Below EMA 20 (CE)
Above EMA 20 (PE)
Risk : Reward ≥ 1:2
❌ No SL = no trade
6️⃣ STRIKE SELECTION (OPTION SIDE)
Trade ATM or ±1 strike
Premium range: ₹80–₹150
Strike must move immediately
7️⃣ DO NOT TRADE WHEN ❌
EMA 20 & 50 flat
Price inside VWAP
First 5 minutes of market
Low volume candles

[CT] Daily & Weekly Percentage Price Oscillator Daily & Weekly Percentage Price Oscillator, or D&W PPO, is a dual-speed momentum oscillator that blends a slower “weekly-style” percentage oscillator with a faster “daily-style” percentage oscillator, then turns the relationship between them into a clean histogram that is easy to trade. The script builds four EMAs from the chart’s close. The first pair, L1 and L2, is used to create the W component, which behaves like a slow, higher-timeframe trend pressure line. W is calculated as the percentage distance between EMA(L1) and EMA(L2), normalized by EMA(L2). When W is rising and positive, it tells you the broader momentum is expanding upward, and when W is falling and negative, the broader momentum is expanding downward. The second pair, L3 and L4, creates the D component, which behaves like a faster, lower-timeframe momentum pulse, also expressed as a percentage but normalized by the same EMA(L2), so both components share a consistent “scale.” The script then combines them into R = W + D, which represents the total blended momentum, where W supplies the slow structure and D supplies the fast impulse.
The indicator is plotted as a histogram using “R − W,” and that choice is intentional. Because R = W + D, the histogram value “R − W” is mathematically identical to D. In other words, the columns you see are the fast momentum component, but anchored to a clear baseline that reflects whether the fast component is adding to, or subtracting from, the slower component’s trend context. The zero line is the equilibrium point where R equals W, meaning the fast component is neutral relative to the slow trend context. When the histogram is above zero, the fast component is contributing positive momentum and the script colors the columns with the Bull color, indicating that R is above W and the short-term push is aligned to the upside. When the histogram is below zero, the fast component is contributing negative momentum and the script colors the columns with the Bear color, indicating that R is below W and the short-term push is aligned to the downside. If you enable “Color price bars,” the chart candles are painted with the same logic so you can visually stay in sync with the fast momentum regime without staring at the panel.
How to trade it comes down to treating the histogram as your actionable trigger layer and using its behavior around the zero line as the decision boundary. A basic long framework is to prioritize long trades when the histogram is above zero and either expanding or printing consecutive positive columns, because that tells you the fast momentum pulse is supportive and not fighting the current regime. The cleanest long entries usually occur when the histogram flips from negative to positive and holds above zero for at least a bar or two, because that transition often marks the shift from pullback pressure into renewed upside impulse. You can add selectivity by watching for a “dip and re-strengthen” pattern above zero: after a positive run, the histogram contracts toward the baseline without breaking materially below it, then turns back up, which often corresponds to a controlled pullback followed by continuation. A basic short framework is the mirror image: prioritize shorts when the histogram is below zero and expanding downward, and treat flips from positive to negative that hold below zero as the higher-quality transition into downside impulse. In both directions, the histogram is especially useful for avoiding trades during momentum dead zones, because when columns chop tightly around the zero line with frequent flips, it is signaling indecision and a lack of clean directional impulse, which is where most “false starts” tend to happen.
Risk management with this tool is straightforward because the oscillator gives you a natural invalidation concept. For long trades, a common invalidation is the histogram losing the zero line and staying negative, since that indicates the fast component has turned from supportive to opposing. For short trades, invalidation is the histogram regaining the zero line and holding positive. Another practical way to manage trades is to use histogram contraction as an early warning that the impulse is weakening. If you are long and positive columns begin to shrink toward zero for several bars, you can tighten risk, take partials, or wait for a fresh expansion before adding. If you are short and negative columns begin to shrink toward zero, the same concept applies. The optional W line can be shown if you want a visual anchor of the slow component; while the histogram is already built to reflect the fast component relative to the slow context, viewing W can help you quickly recognize whether the larger momentum backdrop is generally rising or falling, which can be used as an additional bias filter for trade selection.
In practice, the D&W PPO is best used as a momentum alignment and timing tool: the slow component defines the “weather,” the fast component defines the “wind,” and the histogram tells you whether the wind is pushing with the weather or pushing against it. When the histogram is cleanly one-sided and expanding, it supports continuation-style trading and trend-following entries. When the histogram is choppy around zero, it warns you that conditions are rotational and patience usually pays.

Jake's Candle by Candle UpgradedJake's Candle by Candle Upgraded
The "Story of the Market" Automated
This is not just another signal indicator. Jake's Candle by Candle Upgraded is a complete institutional trading framework designed for high-precision scalping on the 1-minute and 5-minute timeframes.
Built strictly on the principles of Al Brooks Price Action and Smart Money Concepts (SMC), this tool automates the rigorous "Candle-by-Candle" analysis used by professional floor traders. It moves beyond simple pattern recognition to read the "Story" of the market—Context, Setup, and Pressure—before ever allowing a trade.
The Philosophy: Why This Tool Was Built
Most retail traders fail for two reasons:
Getting Trapped: They enter on the first sign of a reversal (H1/L1), which is often an institutional trap.
Trading Chop: They bleed capital during low-volume, sideways markets.
This tool solves both problems with an Algorithmic Discipline Engine. It does not guess. It waits for the specific "Second Leg" criteria used by institutions and physically disables itself during dangerous market conditions.
Key Features
1. The Context Dashboard (HUD)
A professional Heads-Up Display in the top-right corner keeps you focused on the macro picture while you scalp.
FLOW: Monitors the 20-period Institutional EMA. (Green = Bull Flow, Red = Bear Flow). You are prevented from trading against the dominant trend.
STATE: A built-in "Volatility Compressor." If it says "⚠️ CHOP / RANGE", the algorithm is disabled. It protects you from overtrading during lunch hours or low-volume zones.
SETUP: Live tracking of the Al Brooks leg count. It tells you exactly when the algorithm is "Waiting for Pullback" or "Searching for Entry."
2. Smart "Trap Avoidance" Logic (H2/L2)
This tool uses the "Gold Standard" of scalping setups: The High 2 (H2) and Low 2 (L2).
It ignores the first breakout attempt (Leg 1), acknowledging it as a potential trap.
It waits for the pullback and only signals on the Second Leg, statistically increasing the probability of a successful trend resumption.
3. Volatility-Adaptive Risk Management
Stop calculating pips in your head. The moment a signal is valid, the tool draws your business plan on the chart:
Stop Loss (Red Line): Automatically placed behind the "Signal Bar" (the candle that created the setup) based on strict price action rules.
Take Profit (Green Line): Automatically projected at a 1.5 Risk-to-Reward Ratio.
Smart Adaptation: The targets expand and contract based on real-time market volatility. If the market is quiet, targets are tighter. If explosive, targets are wider.
4. The "Snap Entry" Signal
The BUY and SELL badges are not lagging. They are programmed with "Stop Entry" logic—appearing the exact moment price breaks the structure of the Signal Bar, ensuring you enter on momentum, not hope.
How to Trade Strategy
Check the HUD: Ensure FLOW matches your direction and STATE says "✅ VOLATILE".
Wait for the Badge: Do not front-run the tool. Wait for the BUY or SELL badge to print.
Set Your Orders: Once the signal candle closes:
Place your Stop Loss at the Red Line.
Place your Take Profit at the Green Line.
Walk Away: The trade is now a probability event. Let the math play out.
Technical Specifications
Engine: Pine Script v6 (Strict Compliance).
Best Timeframes: 1m, 5m.
Best Assets: Indices (NQ, ES), Gold (XAUUSD), and high-volume Crypto (BTC, ETH).

SNIPER Mean Reversion V1MR SNIPER (Mean Reversion)
### When to Use
- Market is **IN BALANCE** (ranging, consolidating)
- Price **breaks out but FAILS** to hold
- **London session** or compressed summer conditions
- Failed breakouts returning to value
### The Setup Sequence
```
1. BALANCE DETECTED
└── Price rotating around POC
2. BREAKOUT ATTEMPT
└── Price pushes beyond Value Area
3. FAILURE + RECLAIM ← KEY MOMENT
└── Price comes BACK inside balance
└── DO NOT trade first move back!
4. PULLBACK INTO LVN
└── Wait for pullback after reclaim
5. AGGRESSION CONFIRMATION
└── Entry candle shows buy/sell pressure
└── Volume elevated (1.2×+ average)
└── Fat body (60%+ of range)
6. ENTRY → TARGET: POC
```
### Signal Labels
- **MR↑** = Mean Reversion Long (failed breakdown)
- **MR↓** = Mean Reversion Short (failed breakout)
- **S/A/B** = Signal quality tier
### Risk Management
- **Stop**: Below recent low (long) / Above recent high (short)
- **Target**: POC (center of value)
- **Risk**: 0.25-0.5% per trade

SNIPER ORB V4SNIPER ORB V4
### What It Does
Draws 5/15/30 minute Opening Range Breakout levels with confirmation patterns.
### Session Times
| Session | Hours (ET) |
|---------|------------|
| London | 3:00 - 9:30 |
| New York | 9:30 - 17:00 |
### Levels Drawn
| Level | Color Default | Purpose |
|-------|---------------|---------|
| 5m ORB H/L | Blue | Scalp levels |
| 15m ORB H/L | Cyan | Swing levels |
| 30m ORB H/L | Purple | **Primary levels** |
| Targets 1x-3x | Green/Red | Profit targets |
### Signals
| Signal | Meaning | Priority |
|--------|---------|----------|
| `ORB↑` | Confirmed breakout up | ⭐⭐ |
| `ORB↓` | Confirmed breakout down | ⭐⭐ |
| `RT↑` | Retest long entry | ⭐⭐⭐ **BEST** |
| `RT↓` | Retest short entry | ⭐⭐⭐ **BEST** |
| `FVG↑` | FVG zone long | ⭐⭐⭐ |
| `FVG↓` | FVG zone short | ⭐⭐⭐ |
| `ABS` | Absorption (caution) | ⚠️ Warning |
| `FK!` | Fakeout detected | ❌ Avoid |
### FVG Zones (Blue Boxes)
- **Bullish FVG** = Gap below price → Support zone
- **Bearish FVG** = Gap above price → Resistance zone
- **Best Entry** = Price touches FVG + Engulfing candle
### Bar Colors
| Color | Meaning |
|-------|---------|
| Bright Green | Bullish breakout confirmed |
| Bright Red | Bearish breakout confirmed |
| Light Green | Bullish retest entry |
| Light Red | Bearish retest entry |
### Info Table Key
| Field | Green = Good | Yellow/Orange = Caution |
|-------|--------------|-------------------------|
| Volume | HIGH VOL | Normal |
| Body | STRONG (70%+) | Normal/Weak |
| Status | BROKE HIGH/LOW | IN RANGE |
### Quick Trade Plan
```
LONG:
1. Wait for 30m ORB to complete
2. Watch for ORB↑ breakout
3. WAIT for pullback to ORB High
4. Enter on RT↑ or FVG↑ signal
5. SL = Below 30m ORB Low
6. TP = Target 1x or 2x
SHORT:
1. Wait for 30m ORB to complete
2. Watch for ORB↓ breakout
3. WAIT for pullback to ORB Low
4. Enter on RT↓ or FVG↓ signal
5. SL = Above 30m ORB High
6. TP = Target 1x or 2x
```
---

CryptoFlux Dynamo [JOAT]CryptoFlux Dynamo: Velocity Scalping Strategy
WHAT THIS STRATEGY IS
CryptoFlux Dynamo is an open-source Pine Script v6 strategy designed for momentum-based scalping on cryptocurrency perpetual futures. It combines multiple technical analysis methods into a unified system that adapts its behavior based on current market volatility conditions.
This script is published open-source so you can read, understand, and modify the complete logic. The description below explains everything the strategy does so that traders who cannot read Pine Script can fully understand how it works before using it.
HOW THIS STRATEGY IS ORIGINAL AND WHY THE INDICATORS ARE COMBINED
This strategy uses well-known indicators (MACD, EMA, RSI, MFI, Bollinger Bands, Keltner Channels, ATR). The originality is not in the individual indicators themselves, but in the specific way they are integrated into a regime-adaptive system. Here is the detailed justification for why these components are combined and how they work together:
The Problem Being Solved:
Standard indicator-based strategies use fixed thresholds. For example, a typical MACD strategy might enter when the histogram crosses above zero. However, in cryptocurrency markets, volatility changes dramatically throughout the day and week. A MACD crossover during a low-volatility consolidation period has very different implications than the same crossover during a high-volatility trending period. Using the same entry thresholds and stop distances in both conditions leads to either:
Too many false signals during consolidation (if thresholds are loose)
Missing valid opportunities during expansion (if thresholds are tight)
Stops that are too tight during volatility spikes (causing premature exits)
Stops that are too wide during compression (giving back profits)
The Solution Approach:
This strategy first classifies the current volatility regime using normalized ATR (ATR as a percentage of price), then dynamically adjusts ALL other parameters based on that classification. This creates a context-aware system rather than a static threshold comparison.
How Each Component Contributes to the System:
ATR-Based Regime Classification (The Foundation)
The strategy calculates ATR over 21 periods, smooths it with a 13-period EMA to reduce noise from wicks, then divides by price to get a normalized percentage. This ATR% is classified into three regimes:
- Compression (ATR% < 0.8%): Market is consolidating, breakouts are more likely but false signals are common
- Expansion (ATR% 0.8% - 1.6%): Normal trending conditions
- Velocity (ATR% > 1.6%): High volatility, larger moves but also larger adverse excursions
This regime classification then controls stop distances, profit targets, trailing stop offsets, and signal strength requirements. The regime acts as a "meta-parameter" that tunes the entire system.
EMA Ribbon (8/21/34) - Trend Structure Detection
The three EMAs establish trend direction and structure. When EMA 8 > EMA 21 > EMA 34, the trend structure is bullish. The slope of the middle EMA (21) is calculated over 8 bars and converted to degrees using arctangent. This slope measurement quantifies trend strength, not just direction.
Why these specific periods? The 8/21/34 sequence follows Fibonacci-like spacing and provides good separation on 5-minute cryptocurrency charts. The fast EMA (8) responds to immediate price action, the mid EMA (21) represents the short-term trend, and the slow EMA (34) acts as a trend filter.
The EMA ribbon works with the regime classification: during compression regimes, the strategy requires stronger ribbon alignment before entry because false breakouts are more common.
MACD (8/21/5) - Momentum Measurement
The MACD uses faster parameters (8/21/5) than the standard (12/26/9) because cryptocurrency markets move faster than traditional markets. The histogram is smoothed with a 5-period EMA to reduce noise.
The key innovation is the adaptive histogram baseline. Instead of using a fixed threshold, the strategy calculates a rolling baseline from the smoothed absolute histogram value, then multiplies by a sensitivity factor (1.15). This means the threshold for "significant momentum" automatically adjusts based on recent momentum levels.
The MACD works with the regime classification: during velocity regimes, the histogram baseline is effectively higher because recent momentum has been stronger, preventing entries on relatively weak momentum.
RSI (21 period) and MFI (21 period) - Independent Momentum Confirmation
RSI measures momentum using price changes only. MFI (Money Flow Index) measures momentum using price AND volume. By requiring both to confirm, the strategy filters out price moves that lack volume support.
The 21-period length is longer than typical (14) to reduce noise on 5-minute charts. The trigger threshold (55 for longs, 45 for shorts) is slightly offset from 50 to require momentum in the trade direction, not just neutral readings.
These indicators work together: a signal requires RSI > 55 AND MFI > 55 for longs. This dual confirmation reduces false signals from price manipulation or low-volume moves.
Bollinger Bands (1.5 mult) and Keltner Channels (1.8 mult) - Squeeze Detection
When Bollinger Bands contract inside Keltner Channels, volatility is compressing and a breakout is likely. This is the "squeeze" condition. When the bands expand back outside the channels, the squeeze "releases."
The strategy uses a 1.5 multiplier for Bollinger Bands (tighter than standard 2.0) and 1.8 for Keltner Channels. These values were chosen to identify meaningful squeezes on 5-minute cryptocurrency charts without triggering too frequently.
The squeeze detection works with the regime classification: squeeze releases during compression regimes receive additional signal strength points because breakouts from consolidation are more significant.
Volume Impulse Detection - Institutional Participation Filter
The strategy calculates a volume baseline (34-period SMA) and standard deviation. A "volume impulse" is detected when current volume exceeds the baseline by 1.15x OR when the volume z-score exceeds 0.5.
This filter ensures entries occur when there is meaningful market participation, not during low-volume periods where price moves are less reliable.
Volume impulse is required for all entries and adds points to the composite signal strength score.
Cycle Oscillator - Trend Alignment Filter
The strategy calculates a 55-period EMA as a cycle basis, then measures price deviation from this basis as a percentage. When price is more than 0.15% above the cycle basis, the cycle is bullish. When more than 0.15% below, the cycle is bearish.
This filter prevents counter-trend entries. Long signals require bullish cycle alignment; short signals require bearish cycle alignment.
BTC Dominance Filter (Optional) - Market Regime Filter
The strategy can optionally use BTC.D (Bitcoin Dominance) as a market regime filter. When BTC dominance is rising (slope > 0.12), the market is in "risk-off" mode and long entries on altcoins are filtered. When dominance is falling (slope < -0.12), short entries are filtered.
This filter is optional because the BTC.D data feed may lag during low-liquidity periods.
How The Components Work Together (The Mashup Justification):
The strategy uses a composite scoring system where each signal pathway contributes points:
Trend Break pathway (30 points): Requires EMA ribbon alignment + positive slope + price breaks above recent structure high
Momentum Surge pathway (30 points): Requires MACD histogram > adaptive baseline + MACD line > signal + RSI > 55 + MFI > 55 + volume impulse
Squeeze Release pathway (25 points): Requires BB inside KC (squeeze) then release + momentum bias + histogram confirmation
Micro Pullback pathway (15 points): Requires shallow retracement to fast EMA within established trend + histogram confirmation + volume impulse
Additional modifiers:
+5 points if volume impulse is present, -5 if absent
+5 points in velocity regime, -2 in compression regime
+5 points if cycle is aligned, -5 if counter-trend
A trade only executes when the composite score reaches the minimum threshold (default 55) AND all filters agree (session, cycle bias, BTC dominance if enabled).
This scoring system is the core innovation: instead of requiring ALL conditions to be true (which would generate very few signals) or ANY condition to be true (which would generate too many false signals), the strategy requires ENOUGH conditions to be true, with different conditions contributing different weights based on their reliability.
HOW THE STRATEGY CALCULATES ENTRIES AND EXITS
Entry Logic:
1. Calculate current volatility regime from ATR%
2. Calculate all indicator values (MACD, EMA, RSI, MFI, squeeze, volume)
3. Evaluate each signal pathway and sum points
4. Check all filters (session, cycle, dominance, kill switch)
5. If composite score >= 55 AND all filters pass, generate entry signal
6. Calculate position size based on risk per trade and regime-adjusted stop distance
7. Execute entry with regime name as comment
Position Sizing Formula:
RiskCapital = Equity * (0.65 / 100)
StopDistance = ATR * StopMultiplier(regime)
RawQuantity = RiskCapital / StopDistance
MaxQuantity = Equity * (12 / 100) / Price
Quantity = min(RawQuantity, MaxQuantity)
Quantity = round(Quantity / 0.001) * 0.001
This ensures each trade risks approximately 0.65% of equity regardless of volatility, while capping total exposure at 12% of equity.
Stop Loss Calculation:
Stop distance is ATR multiplied by a regime-specific multiplier:
Compression regime: 1.05x ATR (tighter stops because moves are smaller)
Expansion regime: 1.55x ATR (standard stops)
Velocity regime: 2.1x ATR (wider stops to avoid premature exits during volatility)
Take Profit Calculation:
Target distance is ATR multiplied by regime-specific multiplier and base risk/reward:
Compression regime: 1.6x ATR * 1.8 base R:R * 0.9 regime bonus = approximately 2.6x ATR
Expansion regime: 2.05x ATR * 1.8 base R:R * 1.0 regime bonus = approximately 3.7x ATR
Velocity regime: 2.8x ATR * 1.8 base R:R * 1.15 regime bonus = approximately 5.8x ATR
Trailing Stop Logic:
When adaptive trailing is enabled, the strategy calculates a trailing offset based on ATR and regime:
Compression regime: 1.1x base offset (looser trailing to avoid noise)
Expansion regime: 1.0x base offset (standard)
Velocity regime: 0.8x base offset (tighter trailing to lock in profits during fast moves)
The trailing stop only activates when it would be tighter than the initial stop.
Momentum Fail-Safe Exits:
The strategy closes positions early if momentum reverses:
Long positions close if MACD histogram turns negative OR EMA ribbon structure breaks (fast EMA crosses below mid EMA)
Short positions close if MACD histogram turns positive OR EMA ribbon structure breaks
This prevents holding through momentum reversals even if stop loss hasn't been hit.
Kill Switch:
If maximum drawdown exceeds 6.5%, the strategy disables new entries until manually reset. This prevents continued trading during adverse conditions.
HOW TO USE THIS STRATEGY
Step 1: Apply to Chart
Use a 5-minute chart of a high-liquidity cryptocurrency perpetual (BTC/USDT, ETH/USDT recommended)
Ensure at least 200 bars of history are loaded for indicator stabilization
Use standard candlestick charts only (not Heikin Ashi, Renko, or other non-standard types)
Step 2: Understand the Visual Elements
EMA Ribbon: Three lines (8/21/34 periods) showing trend structure. Bullish when stacked upward, bearish when stacked downward.
Background Color: Shows current volatility regime
- Indigo/dark blue = Compression (low volatility)
- Purple = Expansion (normal volatility)
- Magenta/pink = Velocity (high volatility)
Bar Colors: Reflect signal strength divergence. Brighter colors indicate stronger directional bias.
Triangle Markers: Entry signals. Up triangles below bars = long entry. Down triangles above bars = short entry.
Dashboard (top-right): Real-time display of regime, ATR%, signal strengths, position status, stops, targets, and risk metrics.
Step 3: Interpret the Dashboard
Regime: Current volatility classification (Compression/Expansion/Velocity)
ATR%: Normalized volatility as percentage of price
Long/Short Strength: Current composite signal scores (0-100)
Cycle Osc: Price deviation from 55-period EMA as percentage
Dominance: BTC.D slope and filter status
Position: Current position direction or "Flat"
Stop/Target: Current stop loss and take profit levels
Kill Switch: Status of drawdown protection
Volume Z: Current volume z-score
Impulse: Whether volume impulse condition is met
Step 4: Adjust Parameters for Your Needs
For more conservative trading: Increase "Minimum Composite Signal Strength" to 65 or higher
For more aggressive trading: Decrease to 50 (but expect more false signals)
For higher timeframes (15m+): Increase "Structure Break Window" to 12-15, increase "RSI Momentum Trigger" to 58
For lower liquidity pairs: Increase "Volume Impulse Multiplier" to 1.3, increase slippage in strategy properties
To disable short selling: Uncheck "Enable Short Structure"
To disable BTC dominance filter: Uncheck "BTC Dominance Confirmation"
STRATEGY PROPERTIES (BACKTEST SETTINGS)
These are the exact settings used in the strategy's Properties dialog box. You must use these same settings when evaluating the backtest results shown in the publication:
Initial Capital: $100,000
Justification: This amount is higher than typical retail accounts. I chose this value to demonstrate percentage-based returns that scale proportionally. The strategy uses percentage-based position sizing (0.65% risk per trade), so a $10,000 account would see the same percentage returns with 10x smaller position sizes. The absolute dollar amounts in the backtest should be interpreted as percentages of capital.
Commission: 0.04% (commission_value = 0.04)
Justification: This reflects typical perpetual futures exchange fees. Major exchanges charge between 0.02% (maker) and 0.075% (taker). The 0.04% value is a reasonable middle estimate. If your exchange charges different fees, adjust this value accordingly. Higher fees will reduce net profitability.
Slippage: 1 tick
Justification: This is conservative for liquid pairs like BTC/USDT on major exchanges during normal conditions. For less liquid altcoins or during high volatility, actual slippage may be higher. If you trade less liquid pairs, increase this value to 2-3 ticks for more realistic results.
Pyramiding: 1
Justification: No position stacking. The strategy holds only one position at a time. This simplifies risk management and prevents overexposure.
calc_on_every_tick: true
Justification: The strategy evaluates on every price update, not just bar close. This is necessary for scalping timeframes where waiting for bar close would miss opportunities. Note that this setting means backtest results may differ slightly from bar-close-only evaluation.
calc_on_order_fills: true
Justification: The strategy recalculates immediately after order fills for faster response to position changes.
RISK PER TRADE JUSTIFICATION
The default risk per trade is 0.65% of equity. This is well within the TradingView guideline that "risking more than 5-10% on a trade is not typically considered viable."
With the 12% maximum exposure cap, even if the strategy takes multiple consecutive losses, the total risk remains manageable. The kill switch at 6.5% drawdown provides additional protection by halting new entries during adverse conditions.
The position sizing formula ensures that stop distance (which varies by regime) is accounted for, so actual risk per trade remains approximately 0.65% regardless of volatility conditions.
SAMPLE SIZE CONSIDERATIONS
For statistically meaningful backtest results, you should select a dataset that generates at least 100 trades. On 5-minute BTC/USDT charts, this typically requires:
2-3 months of data during normal market conditions
1-2 months during high-volatility periods
3-4 months during low-volatility consolidation periods
The strategy's selectivity (requiring 55+ composite score plus all filters) means it generates fewer signals than less filtered approaches. If your backtest shows fewer than 100 trades, extend the date range or reduce the minimum signal strength threshold.
Fewer than 100 trades produces statistically unreliable results. Win rate, profit factor, and other metrics can vary significantly with small sample sizes.
STRATEGY DESIGN COMPROMISES AND LIMITATIONS
Every strategy involves trade-offs. Here are the compromises made in this design and the limitations you should understand:
Selectivity vs. Opportunity Trade-off
The 55-point minimum threshold filters many potential trades. This reduces false signals but also misses valid setups that don't meet all criteria. Lowering the threshold increases trade frequency but decreases win rate. There is no "correct" threshold; it depends on your preference for fewer higher-quality signals vs. more signals with lower individual quality.
Regime Classification Lag
The ATR-based regime detection uses historical data (21 periods + 13-period smoothing). It cannot predict sudden volatility spikes. During flash crashes or black swan events, the strategy may be classified in the wrong regime for several bars before the classification updates. This is an inherent limitation of any lagging indicator.
Indicator Parameter Sensitivity
The default parameters (MACD 8/21/5, EMA 8/21/34, RSI 21, etc.) are tuned for BTC/ETH perpetuals on 5-minute charts during 2024 market conditions. Different assets, timeframes, or market regimes may require different parameters. There is no guarantee that parameters optimized on historical data will perform similarly in the future.
BTC Dominance Filter Limitations
The CRYPTOCAP:BTC.D data feed may lag during low-liquidity periods or weekends. The dominance slope calculation uses a 5-bar SMA, adding additional delay. If you notice the filter behaving unexpectedly, consider disabling it.
Backtest vs. Live Execution Differences
TradingView backtesting does not replicate actual broker execution. Key differences:
Backtests assume perfect fills at calculated prices; real execution involves order book depth, latency, and partial fills
The calc_on_every_tick setting improves backtest realism but still cannot capture sub-bar price action or order book dynamics
Commission and slippage settings are estimates; actual costs vary by exchange, time of day, and market conditions
Funding rates on perpetual futures are not modeled in backtests and can significantly impact profitability over time
Exchange-specific limitations (position limits, liquidation mechanics, order types) are not modeled
Market Condition Dependencies
This strategy is designed for trending and breakout conditions. During extended sideways consolidation with no clear direction, the strategy may generate few signals or experience whipsaws. No strategy performs well in all market conditions.
Cryptocurrency-Specific Risks
Cryptocurrency markets operate 24/7 without session boundaries. This means:
No natural "overnight" risk reduction
Volatility can spike at any time
Liquidity varies significantly by time of day
Exchange outages or issues can occur at any time
WHAT THIS STRATEGY DOES NOT DO
To be straightforward about limitations:
This strategy does not guarantee profits. Past backtest performance does not indicate future results.
This strategy does not predict the future. It reacts to current conditions based on historical patterns.
This strategy does not account for funding rates, which can significantly impact perpetual futures profitability.
This strategy does not model exchange-specific execution issues (partial fills, requotes, outages).
This strategy does not adapt to fundamental news events or black swan scenarios.
This strategy is not optimized for all market conditions. It may underperform during extended consolidation.
IMPORTANT RISK WARNINGS
Past performance does not guarantee future results. The backtest results shown reflect specific historical market conditions and parameter settings. Markets change constantly, and strategies that performed well historically may underperform or lose money in the future. A single backtest run does not constitute proof of future profitability.
Trading involves substantial risk of loss. Cryptocurrency derivatives are highly volatile instruments. You can lose your entire investment. Only trade with capital you can afford to lose completely.
This is not financial advice. This strategy is provided for educational and informational purposes only. It does not constitute investment advice, trading recommendations, or any form of financial guidance. The author is not a licensed financial advisor.
You are responsible for your own decisions. Before using this strategy with real capital:
Thoroughly understand the code and logic by reading the open-source implementation
Forward test with paper trading or very small positions for an extended period
Verify that commission, slippage, and execution assumptions match your actual trading environment
Understand that live results will differ from backtest results
Consider consulting with a qualified financial advisor
No guarantees or warranties. This strategy is provided "as is" without any guarantees of profitability, accuracy, or suitability for any purpose. The author is not responsible for any losses incurred from using this strategy.
OPEN-SOURCE CODE STRUCTURE
The strategy code is organized into these sections for readability:
Configuration Architecture: Input parameters organized into logical groups (Core Controls, Optimization Constants, Regime Intelligence, Signal Pathways, Risk Architecture, Visualization)
Helper Functions: calcQty() for position sizing, clamp01() and normalize() for value normalization, calcMFI() for Money Flow Index calculation
Core Indicator Engine: EMA ribbon, ATR and regime classification, MACD with adaptive baseline, RSI, MFI, volume analytics, cycle oscillator, BTC dominance filter, squeeze detection
Signal Pathway Logic: Trend break, momentum surge, squeeze release, micro pullback pathways with composite scoring
Entry/Exit Orchestration: Signal filtering, position sizing, entry execution, stop/target calculation, trailing stop logic, momentum fail-safe exits
Visualization Layer: EMA plots, regime background, bar coloring, signal labels, dashboard table
You can read and modify any part of the code. Understanding the logic before deployment is strongly recommended.
- Made with passion by officialjackofalltrades

EMA RSI Adaptive (v6) [Joy]I have taken Glaz's code and converted to V6. The main logic is not mine but taken from Glaz's code
The EMA RSI Adaptive indicator smooths price with an EMA whose speed adjusts to RSI’s distance from its midpoint (50). When RSI strays far from 50 (higher momentum/volatility), the effective EMA period shrinks so the line hugs price. When RSI stays near 50 (quieter conditions), the period lengthens to filter noise. The target of the EMA update is an SMA of price (matching the original design), so you get a smoothed, adaptive trend line rather than a raw EMA of closes.
Key mechanics (what’s happening under the hood):
RSI distance: |RSI - 50| + 1 measures how “charged” momentum is. Bigger distance → faster adaptation.
Dynamic period: a nonlinear mapping turns that RSI distance into an adjusted smoothing length.
Adaptive EMA: ema = emaPrev + alpha * (SMA - emaPrev), where alpha = 2 / (1 + dynamicPeriod).
Visuals: optional color shift—blue when the line is rising, magenta when falling.
Practical use:
Trend filter: rising line = bullish bias; falling line = bearish bias.
Pullback tool: in trends, price tags or minor pierces of the adaptive line can mark pullback zones.
Volatility-aware: it tightens in fast moves (tracks closer) and relaxes in chop (filters more).
On very low timeframes or illiquid symbols, expect more whipsaw; lengthen the base EMA or RSI period to calm it.
The color toggle is cosmetic; the adaptive line itself carries the signal.
