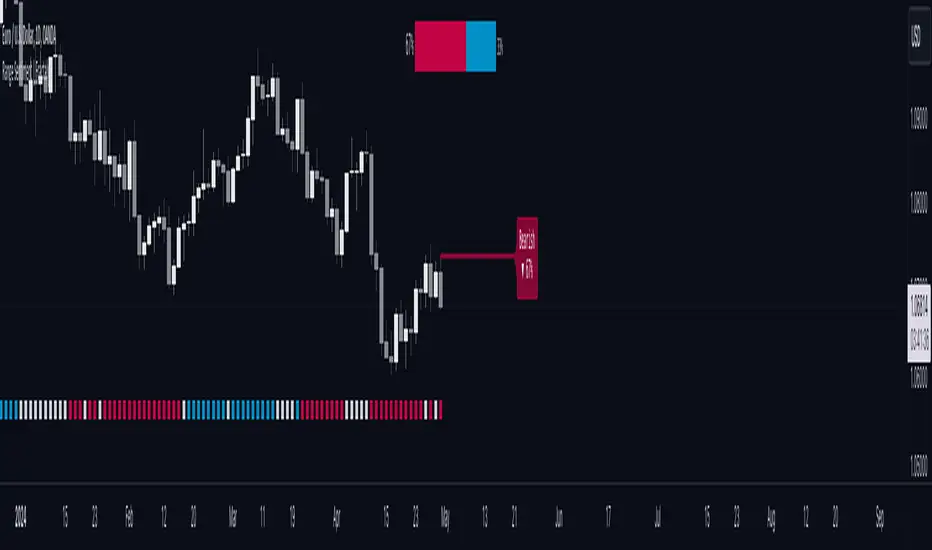
Range & Consolidation DetectorHello friends,
I’m excited to share my latest discovery with you — the Range & Consolidation Detector. This script is built on a unique methodology I’m truly proud of. It uses no traditional indicators like ADX, RSI, or ATR — just pure statistics and mathematics under the hood. No parameters to tweak, no settings to guess — it just works, right out of the box.
🛠️ How It Works
At its core is a proprietary formula that reliably identifies ranging conditions across all tickers and timeframes. It’s simple, robust, and consistent — exactly what traders need to spot sideways markets without noise or lag.
🔥 Key Features
Pine Script v6 – Uses the latest version for maximum performance
Zero configuration – No inputs to adjust, no hidden settings — the algorithm works automatically
Optimized performance – Runs efficiently for smooth charting
Universal compatibility – Works flawlessly on any asset and timeframe, in every market condition — from euphoric peaks to choppy ranges
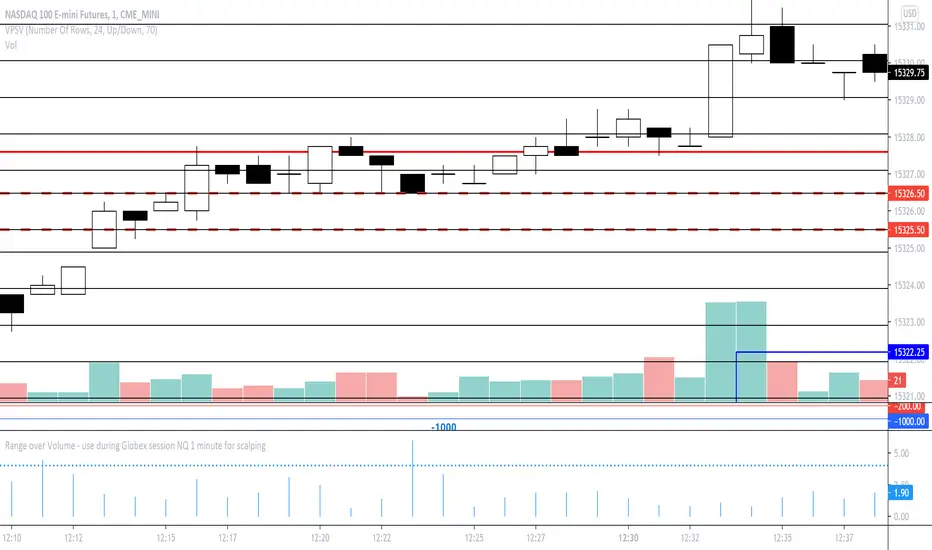
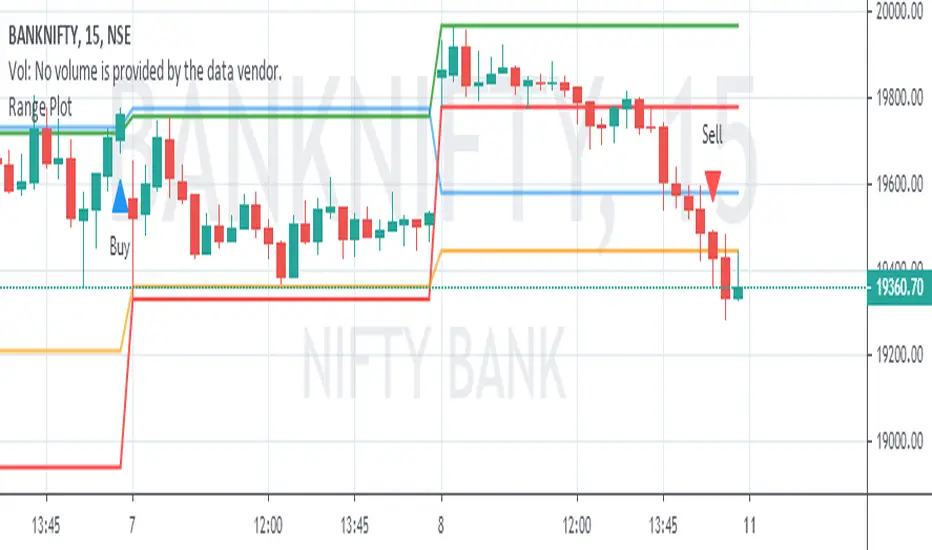
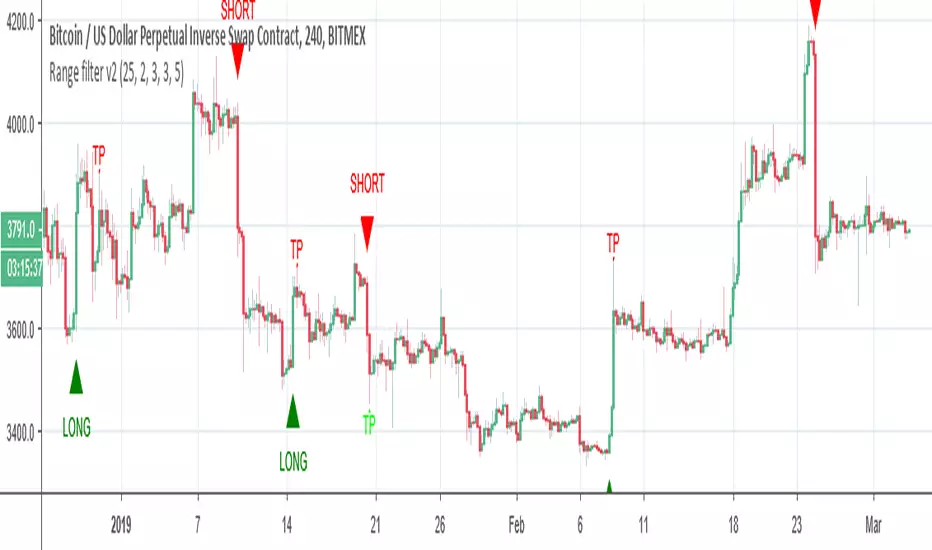
📸 Visual Examples
If you’d like access or have any questions, feel free to reach out to me directly via DM.
👋 Good luck and happy trading!
Платный скрипт