Makenai Chart Strategy Trial(日本語による説明は こちら から)
Each hourly foot can display the moving average line for the same period of time in the same color.
The average moving line that you want to see is displayed by time leg, as well as the long-term Bollinger band that should be noticed by the time leg.
1. You can get a lot of useful information at a glance by displaying the moving average line of the long-term and period setting that many traders are aware of.
○ The period setting of the moving average line displayed in each time and foot is not fixed as usual, but changed the period by time and foot, and the moving average line of the same color is the same.
It is a moving average line of time (for example, an hourly average line and a four-hour average line).Therefore, the market price is always the same even if the time to see changes
You can see it on a scale.It doesn't happen when you look at it in five minutes, but when you look at it in four hours, it looks like a downward trend.
○ The sensitivity of the rate to the moving average line displayed is very high.
You can see how rate moves, such as trends, are determined, and you can see reality in abstract chart moves
I can feel it.Purple 24 hours (one day) moving average line with 1 minute to 4 hours of foot, Green 1 week moving average line with 5 minute to day.
The sensitivity to the Blue Monthly Movement Average Line, which is displayed from 5 mins to 5 weeks, and Red One Year Movement Average Line, which is displayed from 1 hour to 5 weeks, is very high.
Just look at whether the rates are moving up or down the moving average line and you'll be able to decide what to look for.
○ What is the positional relation between the moving average line of seven (eight in addition to the weekly moving average line) in the short, short, medium, medium, long, and long periods?
To make the direction and intensity of the trend easier to recognize, it is colored between moving averages to be visible as short- and medium-term clouds.
The three clouds changed color to warm rising clouds and cold falling clouds, depending on the relation of the moving averages.
·Strong upward trend rates when all clouds are unified in either upward or downward direction and are arranged in the order of short-term, medium-term or long-term clouds
·The thickness of the clouds is strong, and when the thickness is increased, the trend rate is strong.
·Trendless market when clouds overlap or the colors of the clouds are mixed
• Range price when rates are moving back and forth between clouds
You can visually and intuitively understand the market conditions, such as .
○ Short-term, short-term, medium- and short-term positional relationships will indicate the timing of the entry payment and the direction of the long-short.It's also written.
In conjunction with this, the duration for which the background color should be long changes to light warm color and warm color, and the duration for short changes to light cold and cold color.
2. The long-term Bollinger band is displayed so that you can trade with the higher time base than the time base you see.
○ You can ride on a long-term trend by detecting and entering the trend occurrence of long-term feet with short-term feet.
Buy high prices, sell low prices, relax your trend-follow-style tears, and enable stress-free entries.
○ A light, transparent gray filter is displayed between the long-term foot Bollinger band ±1σ which sets the period suitable for the time and foot.
I understand that while the rate is moving in this zone (called gray zone), it is difficult to trend and the price range is small, so it should not be taken care of.
Yes, you can use this filter to prevent deception when the volatility is not present, and if you are out of the filter, you can use the above sign.
By trading in accordance, you can invest in trend-follow tiles while avoiding losses in range markets.
○ Bolinger bands generally display six of ±1σ, ±2σ and ±3σ, but in this indicator, two are inside ±1σ and two are outside ±3σ.
We have added a total of four bands.The former sets up early entries and the latter sets up new reverse positions, expecting a market shift from overheating.
for tips on how to
○ Expansion period (expansion period) due to characteristics of the Bollinger band is a period when volatility is big for trade, and a squeeze period
(Shrinking period) I understand that the volatility is small and it is not suitable for trade.Also, it's a squeeze period, but it's not
You can seize investment opportunities by making you expect the timing to move from contraction to expansion and by watching.
※Valid time difference by series
Multi Time : 1 minute, 5 minutes, 15 minutes, 30 minutes 1 Hour, 4 Hour, Daily, Week (Total 8 Hours)
Long Time Span : 1 hour, 4 hour, daily, 4 long-term
Short Time Span : 1 minute, 5 minutes, 15 minutes, 30 minutes
Trial (1n & 1h) : 1 min.
※See here for details of the indicator and how to use it.
★ for "Indicator Grant" and "Market Analysis Information and Indicator Signature Distribution Service" by LINE Group (for a fee)
If you wish, please send a message on private chat
Discord:
discord.gg
Поиск скриптов по запросу "range"

Makenai Chart Strategy Full(日本語による説明は こちら から)
Each hourly foot can display the moving average line for the same period of time in the same color.
The average moving line that you want to see is displayed by time leg, as well as the long-term Bollinger band that should be noticed by the time leg.
1. You can get a lot of useful information at a glance by displaying the moving average line of the long-term and period setting that many traders are aware of.
○ The period setting of the moving average line displayed in each time and foot is not fixed as usual, but changed the period by time and foot, and the moving average line of the same color is the same.
It is a moving average line of time (for example, an hourly average line and a four-hour average line).Therefore, the market price is always the same even if the time to see changes
You can see it on a scale.It doesn't happen when you look at it in five minutes, but when you look at it in four hours, it looks like a downward trend.
○ The sensitivity of the rate to the moving average line displayed is very high.
You can see how rate moves, such as trends, are determined, and you can see reality in abstract chart moves
I can feel it.Purple 24 hours (one day) moving average line with 1 minute to 4 hours of foot, Green 1 week moving average line with 5 minute to day.
The sensitivity to the Blue Monthly Movement Average Line, which is displayed from 5 mins to 5 weeks, and Red One Year Movement Average Line, which is displayed from 1 hour to 5 weeks, is very high.
Just look at whether the rates are moving up or down the moving average line and you'll be able to decide what to look for.
○ What is the positional relation between the moving average line of seven (eight in addition to the weekly moving average line) in the short, short, medium, medium, long, and long periods?
To make the direction and intensity of the trend easier to recognize, it is colored between moving averages to be visible as short- and medium-term clouds.
The three clouds changed color to warm rising clouds and cold falling clouds, depending on the relation of the moving averages.
·Strong upward trend rates when all clouds are unified in either upward or downward direction and are arranged in the order of short-term, medium-term or long-term clouds
·The thickness of the clouds is strong, and when the thickness is increased, the trend rate is strong.
·Trendless market when clouds overlap or the colors of the clouds are mixed
• Range price when rates are moving back and forth between clouds
You can visually and intuitively understand the market conditions, such as .
○ Short-term, short-term, medium- and short-term positional relationships will indicate the timing of the entry payment and the direction of the long-short.It's also written.
In conjunction with this, the duration for which the background color should be long changes to light warm color and warm color, and the duration for short changes to light cold and cold color.
2. The long-term Bollinger band is displayed so that you can trade with the higher time base than the time base you see.
○ You can ride on a long-term trend by detecting and entering the trend occurrence of long-term feet with short-term feet.
Buy high prices, sell low prices, relax your trend-follow-style tears, and enable stress-free entries.
○ A light, transparent gray filter is displayed between the long-term foot Bollinger band ±1σ which sets the period suitable for the time and foot.
I understand that while the rate is moving in this zone (called gray zone), it is difficult to trend and the price range is small, so it should not be taken care of.
Yes, you can use this filter to prevent deception when the volatility is not present, and if you are out of the filter, you can use the above sign.
By trading in accordance, you can invest in trend-follow tiles while avoiding losses in range markets.
○ Bolinger bands generally display six of ±1σ, ±2σ and ±3σ, but in this indicator, two are inside ±1σ and two are outside ±3σ.
We have added a total of four bands.The former sets up early entries and the latter sets up new reverse positions, expecting a market shift from overheating.
for tips on how to
○ Expansion period (expansion period) due to characteristics of the Bollinger band is a period when volatility is big for trade, and a squeeze period
(Shrinking period) I understand that the volatility is small and it is not suitable for trade.Also, it's a squeeze period, but it's not
You can seize investment opportunities by making you expect the timing to move from contraction to expansion and by watching.
※Valid time difference by series
Multi Time : 1 minute, 5 minutes, 15 minutes, 30 minutes 1 Hour, 4 Hour, Daily, Week (Total 8 Hours)
Long Time Span : 1 hour, 4 hour, daily, 4 long-term
Short Time Span : 1 minute, 5 minutes, 15 minutes, 30 minutes
Trial (1n & 1h) : 1 min.
※See here for details of the indicator and how to use it.
★ for "Indicator Grant" and "Market Analysis Information and Indicator Signature Distribution Service" by LINE Group (for a fee)
If you wish, please send a message on private chat

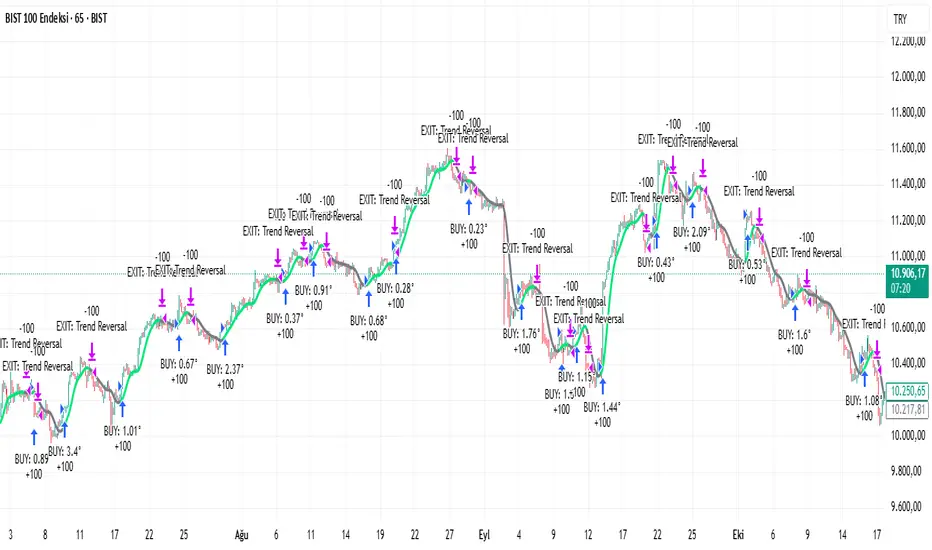
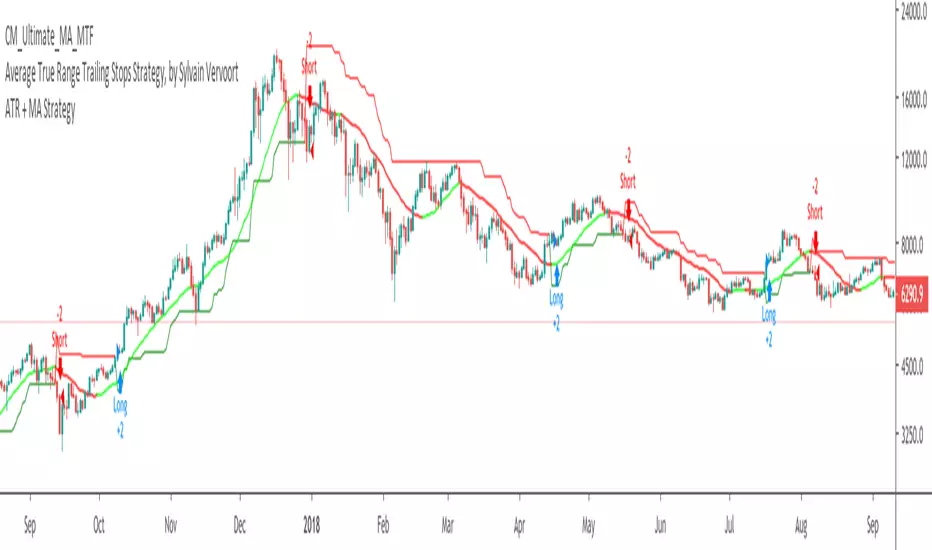
ATR + MA StrategyThis strategy combines the ATR (average true range) indicator by HPotter and the Ultimate MA indicator by Chris Moody to give buy and sell signals. Links to these indicators are provided below:
Average True Range Trailing Stops Colored by HPotter:
Ultimate Moving Average-Multi-TimeFrame-7 MA Types by Chris Moody:
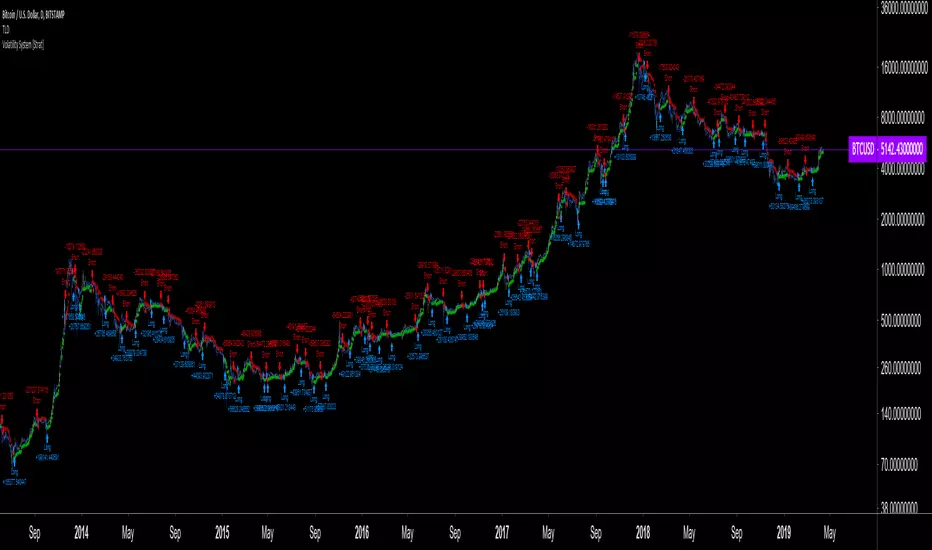
Volatility System by Wilder [LucF]The Volatility System was created by J. Welles Wilder, Jr. It first appeared in his seminal masterpiece, "New Concepts in Technical Trading Systems" (1978). He describes the system on pp.23-26, in the chapter discussing the first presentation ever of the "Volatility Index", built using a novel way of calculating a value representing volatility that he named Average True Range (ATR). The latter stuck.
The system is a pure reversal system (it is always either long or short). One of its characteristics is that its stop strategy moves up and down during a trade, widening the gap from price when volatility (ATR) increases. Because of this, this strategy can suffer large drawdowns and is not for the faint of heart.
The strategy uses a length (n) to calculate an ATR. ATR(n) is then multiplied by a factor to calculate the Average Range Constant (ARC). The ARC is then added to the lowest close n bars back to form the high Stop and Reverse points (SAR), and subtracted from the highest close n bars back to calculate the low SAR. Reversals occur when price closes above the high SAR or below the low SAR.
The system is best suited to higher time frames: 12H and above. Its performance depends heavily on calibration of the length and ARC factor. Wilder proposes a length of 7 and a factor between 2.8 to 3.1. My summary tests at 12H, 1D and 3D on stocks and cryptos yield better results with values of approximately 9-10/1.8-2.5 for cryptos and 9-10/3.0-4.0 for stocks. Small changes in the values will sometimes yield large variations in results, which I don’t particularly like because it tends to imply fragility, whereas I’d expect more robustness from a system with such simple rules. Additionally, backtests at 1D on cryptos provide so little data that no solid conclusions can be drawn from them.
All in all, the system is not very useful in my opinion; I publish it more for completeness, since as far as I can tell, it did not exist on this platform before. I also publish it out of respect for Wilder’s work. His book laid the foundation for many of the building blocks used by system designers, even today. In less than a hundred pages he presented RSI, ATR, DMI, ADXR and the Parabolic SAR indicators, some of which have become built-in functions in programming languages. This is a colossal feat and has not been repeated. Wilder is a monument.
Some lesser-known facts about his book:
It sells for the exact same price it cost in 1978: 65$,
The book has always been published by Wilder himself,
The layout hasn’t changed in 40 years,
He sells >35K copies/year.
Gotta love the guy.
The strategy is shown here on BTC /USD with settings of 12/1.8 (the defaults are 9/1.8). It shows the system under its best light. Other markets will most not reproduce such results. Also, the drawdown is as scary as the results are impressive.
Features
The code is written as a strategy but can easily be converted to an indicator if you want to use the alerts it can produce. Instructions are in the code.
You can change the length and ARC factor.
You can choose to trade only long or short positions.
You can choose to display the SARs (the stops) in multiple ways.
You can show trigger markers.
A date range can be defined.
3 alerts: reversals (both long and short), longs, shorts. Remember that for the moment, strategies cannot generate alerts in TradingView, so the strategy must be converted to an indicator in order to make the alerts available.
multi Stoch + MACD + CCI strategy (J)The Stochastic Oscillator (STOCH) is a range bound momentum oscillator. The Stochastic indicator is designed to display the location of the close compared to the high/low range over a user defined number of periods. Typically, the Stochastic Oscillator is used for three things; Identifying overbought and oversold levels, spotting divergences and also identifying bull and bear set ups or signals.
www.tradingview.com(STOCH)
MACD is an extremely popular indicator used in technical analysis. MACD can be used to identify aspects of a security's overall trend. Most notably these aspects are momentum, as well as trend direction and duration. What makes MACD so informative is that it is actually the combination of two different types of indicators. First, MACD employs two Moving Averages of varying lengths (which are lagging indicators) to identify trend direction and duration. Then, MACD takes the difference in values between those two Moving Averages (MACD Line) and an EMA of those Moving Averages (Signal Line) and plots that difference between the two lines as a histogram which oscillates above and below a center Zero Line. The histogram is used as a good indication of a security's momentum.
www.tradingview.com(Moving_Average_Convergence/Divergence)
The Commodity Channel Index (CCI) is a momentum oscillator used in technical analysis primarily to identify overbought and oversold levels by measuring an instrument's variations away from its statistical mean. CCI is a very well-known and widely-used indicator that has gained level of popularity in no small part of its versatility. Besides overbought/oversold levels, CCI is often used to find reversals as well as divergences. Originally, the indicator was designed to be used for identifying trends in commodities, however it is now used in a wide range of financial instruments.
www.tradingview.com(CCI)

TrendMaster, v. 5.1TrendMaster (ver 5.0, a.k.a. "Mr. T") is a trend-anticipating system which shows eye-popping results. Rather than a simple "trend-rider" which continually lags, TrendMaster uses pattern recognition to anticipate trend changes. It hunts for turns in market cycles using a proprietary decision matrix of 27 "trade triggers" (variants of classic technical indicators). In backtesting the annualized return (July 2017-July2018) of the top 100 largest capitalized equities, not only did its results beat the indexes, but it outstripped a buy-and-hold strategy by a whopping 700%: i.e., while the 100 largest equities had an average annual yield of 17%, the strategy produced a 129% return across the entire range of stocks.* Even more staggering results can be seen when using the system in strongly-trending markets like cryptos. (See, for instance, the particularly stunning results for Bitcoin Cash in the screen shot at the end). [ ]
The following charts give you some sample tests of best performing (top chart) and worst performing (bottom chart) equities, ETFs, and cryptos (July 2017-July2018 time range).
TrendMaster / "Mr T" 5.1, Example Annualized returns
>>> Higher Performing Instruments (best performing interval between 15min - 1 day) <<<
Symbol Description Interval % Return Trades % Profitable Profit Factor Max Drawdown Sharpe Ratio Buy & Hold
DUST 3x Short Gold miners 30 min 3050% 421 43% 1.5 ( -17% ) 1.8 ( - 27 % )
NUGT 3x Long Gold miners 15 min 3300% 423 44 1.2 ( -11% ) 1.2 ( - 10 % )
APPL Apple, Inc 1 hour 118% 354 46 2.2 ( -6% ) 1.3 32%
GOOG Alphabet, Inc 30 min 128% 660 44 1.9 ( -5% ) 1 27%
BABA Alibaba Group 30 min 389% 642 46 2.3 ( -3% ) 1.6 37%
BTC/USDT Bitcoin 1 hour 1000000% 1573 53 3.1 ( -8% ) 1 57%
ETH/USDT Ethereum 1 hour 13000000% 1533 55 3.2 ( -12% ) 1.2 56%
LTC/ USDT Litecoin 30 min 5000000% 1946 54 2.8 ( -12% ) 1.2 ( - 71% )
>>> Lower Performing Instruments and/or Lower Performing Market Settings (worst performing interval between 15 min - 1 day) <<<
Symbol Description Interval % Return Trades % Profitable Profit Factor Max Drawdown Sharpe Ratio Buy & Hold
PSQ Short Nasdaq ETF 5 min ( - 14% ) 1894 28% ( - 0.9 % ) ( -20% ) ( -0.3 ) ( - 20 % )
SH Short S&P ETF 1 day 20% 35 51% 2.8 ( -7% ) 0.5 ( - 12 % )
MSFT Microsoft 1 hour 37% 249 37% 1.4 ( -4% ) 0.5 45%
AZN Astrazeneca, PLC 1 day 22% 32 50% 1.9 ( -6% ) 0.3 ( - 4 % )
MUFG Mitsubishi UFJ 1 day 296% 1255 39% ( - 0.6 ) ( -27% ) ( - 0.3 ) ( - 16 % )
BTC/USDT Bitcoin 1 min ( - 33 % ) 1349 25% ( - 0.5 ) ( - 33% ) ( - 1.1 ) 5%
ETH/USDT Ethereum 1 min ( - 40 % ) 1595 24% ( - 0.6 ) ( -40% ) ( - 1.1 ) 6%
LTC/USDT Litecoin 1 day 123 14 57% 4.8 ( - 5% ) 1.1 ( - 48% )
Note, of course, that any trend-anticipating bot has limitations. The Lower Performing results above show that because the system seeks gains in trends, it can underperform in choppy, aimless markets. Similarly, very short time frames (i.e. 1 - 5 minutes) can provide too many gaps and too few runs for it to reliably track. Backtesting is therefore essential to make sure this system is suitable for your (a) market, (b) time frame, and (c) trading mindset. On the other hand, a broad range of data show that almost any trending market, in almost any time frame, can be very productive.
Contact us if you would like to experience this bot.

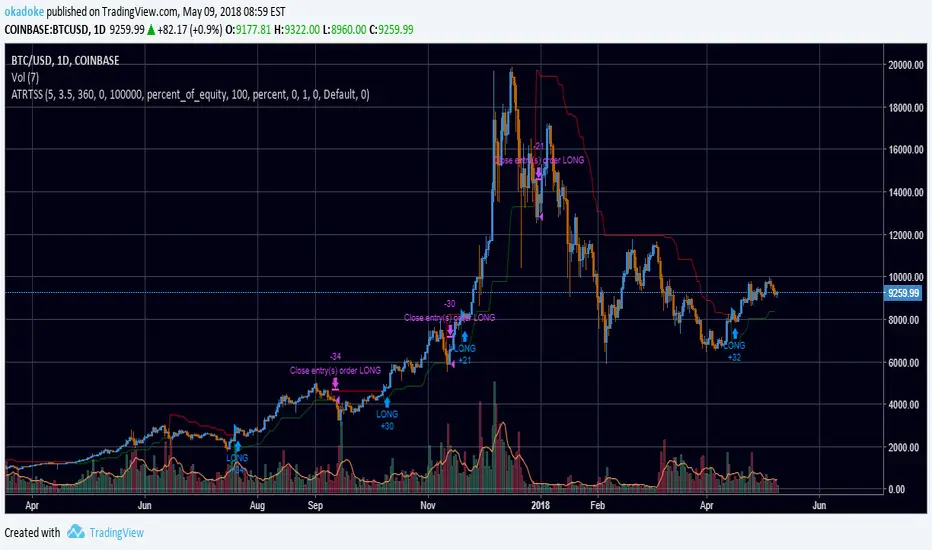
ATR Trailing Stops StrategyUpdate of Average True Range Trailing Stops Strategy by HPotter to include backtesting support
Opens longs when price crosses over trailing stop line, closes when price crosses below
Option to open/close shorts when longs are closed/opened
Option to specify a time range to test over. For example, set Max Days Back to 360 and Min Days Back to 180 to test from 1 year ago to 6 months ago. To test the entire range of data, set both to 0.
MASS Index Backtest The Mass Index was designed to identify trend reversals by measuring
the narrowing and widening of the range between the high and low prices.
As this range widens, the Mass Index increases; as the range narrows
the Mass Index decreases.
The Mass Index was developed by Donald Dorsey.
You can change long to short in the Input Settings
WARNING:
- For purpose educate only
- This script to change bars colors.

Stealthy 7 Linear Regression Channel StrategyThis is a Linear Regression Channel tool, similar to the hand tool in the left toolbar, but it automates the drawing. It has a rolling look back. Range mode shorts the upper channel and longs the lower crossover with no closing rules. Trend mode longs the break out and closes at the regression. It draws a linear line between the candles then computes an upper and lower deviation.
I find the tool random. It works sometimes. Eventually I believe Linear Channels will ruin your account. The next time you see someone posting rectangular channels remind them that its all in hindsight. The price won't stay in the rectangle. Every time you get a new candle the regression is redrawn. The range is constantly moving. Not great.
I'm publishing to show that linear regression channel isn't very good and to show people the price won't stay in a range that is tradeable. At the very least you'll have to find superior rules to avoid huge drawdown. I think that price isn't distributed well against a straight line (DUH).

Hybrid Trend-Following Inside Bar BreakoutHybrid Trend-Following Inside Bar Breakout Strategy
The Hybrid Trend-Following Inside Bar Breakout Strategy is a rule-based trading system designed to capture strong directional moves while controlling risk during uncertain market conditions. It combines trend-following, price action, and volatility-based risk management into a single robust framework.
Core Concept
The strategy trades inside bar breakouts only in the direction of the dominant market trend. Inside bars represent periods of consolidation, and when price breaks out of this consolidation in a trending market, it often leads to impulsive moves with favorable risk–reward characteristics.
Key Components
1. Trend Filter
Uses 50 EMA and 200 EMA to define the market trend.
Bullish bias: 50 EMA above 200 EMA
Bearish bias: 50 EMA below 200 EMA
This filter prevents counter-trend trades and improves trade quality.
2. Volatility Filter
Compares fast ATR (14) with slow ATR (50).
Trades are taken only when volatility is expanding or above a minimum threshold.
This avoids low-volatility, choppy market conditions.
3. Inside Bar Breakout
An inside bar forms when the current candle’s high is lower than the previous candle’s high and the low is higher than the previous candle’s low.
A trade is triggered only when price breaks above or below the inside bar range in the direction of the trend.
4. Candle Quality Filter
Requires a minimum body-to-range ratio, ensuring that the breakout candle has strong momentum and is not driven by weak wicks.
Risk Management & Trade Management
Stop Loss (SL)
Placed using ATR-based dynamic stops, adapting to current market volatility.
Prevents tight stops in volatile conditions and wide stops in calm markets.
Partial Profit Taking
50% of the position is exited at 1.5R, locking in profits early.
This reduces psychological pressure and improves equity stability.
Trailing Stop
After partial profit is taken, the remaining position is managed with an ATR-based trailing stop.
Allows the strategy to capture large trend moves while protecting gains.
Cooldown Mechanism
After a losing trade, the system enters a cooldown period and skips a fixed number of bars.
This helps avoid revenge trading and overtrading during unfavorable market phases.
Why This Strategy Works
Trades only high-probability breakouts in trending markets
Adapts automatically to changing volatility
Combines price action precision with systematic risk control
Designed for consistent performance over long historical periods

Long Bollinger Bands StrategyLong Bollinger Bands Strategy (XAUUSD) — Lower Band Reversal + 4-Step Scaling + Daily DD Guard
Long Bollinger Bands Strategy is a long-only Bollinger Bands reversal/mean-reversion strategy designed mainly for XAUUSD. It looks for a bearish push below the Lower Band followed by a bullish reclaim on candle close, then optionally scales in up to 4 entries (E1–E4) as price pulls back.
1) Risk Management & Position Sizing
The strategy includes a USD-based risk input: Risk per setup (USD).
It automatically calculates position size using the average SL distance across the 4-entry structure, then distributes size across entries with built-in weighting.
BackTest Lot checkbox:
OFF (default): uses normalized sizing (qty divided by 100)
ON: uses raw qty for backtesting workflows
2) SL/TP Management (Locked SL + Optional Range TP)
Stop Loss (SL): based on SL distance (pips from entry) from E1.
Take Profit (TP):
If TP (pips) > 0: fixed pip TP from E1
If TP (pips) = 0: TP is based on the signal candle range (high–low)
SL Lock: once the stop is tightened, it never loosens again (only moves in a protective direction) until the trade closes.
3) Daily Drawdown Protection
Tracks equity by day and stops opening new positions once Max daily drawdown (USD) is reached for that day.
4) Notes / Disclaimer
This strategy does not use volume, RSI, fundamentals, news filters, or session filters. Users should apply discretion and consider confirmations from other tools and market context. Results depend on symbol settings, spread, commission, and volatility regime. Always forward-test before using in live trading.
Designed for XAUUSD. The script uses an internal pip conversion (pipSize = 0.1) consistent with common gold quoting; verify your broker’s pip definition for best alignment.
5) Suggested Usage
Best used during volatile conditions or after a clear lower-band sweep and reclaim.
Consider pairing with trend filters or higher-timeframe bias.
6) Release Notes
Initial release: Long-only BB reclaim logic with 4-step scaling
Added: SL/TP lock logic and visual SL/TP lines
Added: Daily drawdown guard and backtest lot toggle OANDA:XAUUSD

Double&Triple Pattern[TS_Indie]📌 Description – Double & Triple Pattern Indicator
The Double & Triple Pattern Indicator is developed to help traders systematically and clearly identify Double Top, Double Bottom, Triple Top, and Triple Bottom chart patterns.
⚙️ Core Logic & Working Mechanism
The Double & Triple Pattern Indicator is built on the concept of price swing formation, based on the logic of Trend Entry_0 , which focuses on structured market analysis and price action behavior.
The indicator detects three main swing points (Swing 1, Swing 2, and Swing 3). A Fibonacci Box is then created using Swing A and Swing B as reference points to define the swing detection zone.
When all three swings remain inside the defined Fibonacci Box, the structure is considered a valid Price Action setup.
The indicator then plots key lines on the chart:
➩ Break Line – used to confirm the signal (confirmation)
➩ Cancel Line – used to invalidate the price action if price moves against the conditions
➛ When price breaks the Break Line , the structure is confirmed and a Pending Order is placed at Swing B , with the Stop Loss set at Swing 1.
➛ If price breaks the Cancel Line first, the price action structure is immediately invalidated.
⚙️ Fibonacci Entry Zone & Change SL Settings
➩ When Fibo Entry Zone is set to 0, the Pending Order is placed directly at Swing B.
➩ When the value is greater than 0, the Pending Order is calculated using Fibonacci levels drawn from Swing B to the Stop Loss level.
➩ Change SL allows switching the Stop Loss reference between Swing 1 and Swing A.
⚙️ Min & Max Control for Swing Size : xATR
When enabling Control Size Swing : xATR , the indicator filters Swing B based on the defined Min and Max range.
This allows traders to selectively test larger or smaller swing-based price actions , depending on their trading strategy.
⭐ Pending Order Cancellation Conditions
A Pending Order will be canceled under the following conditions:
1.A new Price Action signal appears on either the Buy or Sell side.
2.When Time Session is enabled, the Pending Order is canceled once price exits the selected session.
🕹 Order Management Rule
When there is an active open position, the indicator restricts the creation of new Pending Orders to prevent overlapping positions.
💡 Double Pattern Example
💡 Triple Pattern Example
⚠️ Disclaimer
This indicator is designed for technical analysis purposes only and does not constitute investment advice.
Users should apply proper risk management and make decisions at their own discretion.
🥂 Community Sharing
If you find parameter settings that work well or produce strong statistical results, feel free to share them with the community so we can improve and develop this indicator together.

Volatility Trend FollowerThe script combines several classic technical analysis techniques:
SuperTrend / Adaptive Band - The main idea comes from the SuperTrend indicator, which uses ATR (Average True Range) to create a trailing band that adapts to volatility
ATR (Average True Range) - A volatility measure developed by J. Welles Wilder Jr.
EMA (Exponential Moving Average) - Used as a global trend filter
Heikin Ashi - An option to smooth prices and reduce noise

Advanced Breakout System v2.0Advanced Breakout System v2.0
Developed by: Mohammed Bedaiwi
This script hunts for high-probability breakouts by combining price consolidation zones, volume spikes vs. average volume, smart money flow (OBV), and a Momentum Override for explosive moves that skip consolidation. Additionally, it automatically identifies and plots Support and Resistance levels with price labels to help you visualize market structure.
The system follows a "Watch & Confirm" logic: it first prints a WATCH setup, then a BUY only if price confirms strength.
💡 JUSTIFICATION OF CONCEPTS (MASHUP & ORIGINALITY)
This script is an original mashup combining several analytical concepts to address common breakout failures:
Volatility Compression Engine: Uses built-in functions like ta.highest() and ta.lowest() to mathematically define the setup phase where price volatility is compressed below a user-defined threshold.
Volume Spike Confirmation: The breakout must be confirmed by a volume increase greater than a moving average of volume, signaling strong market interest.
Smart Volume Filter (OBV): This is the key component. By checking if ta.obv is above its own Moving Average, we confirm that accumulation has been occurring during the consolidation period, suggesting institutional positioning before the price break.
Multi-Exit Risk System: Employs dynamic exits (EMA cross, volume dump, bearish pattern) instead of static stop-losses to manage risk adaptively based on real-time market action.
Market Structure Visualization: The script also includes a Support & Resistance engine to plot key swing pivots and price labels for visual context.
✅ STRATEGY RESULTS & POLICY COMPLIANCE
To ensure non-misleading and transparent backtesting results, this strategy is published with the following fully compliant properties:
Dataset Compliance: The backtest is performed on the CMTL Daily (1D) chart across a long history, generating 201 total trades. This significantly exceeds the minimum requirement of 100 trades, providing a robust test dataset.
Risk Control: The strategy uses a conservative order size set to 2% of equity (default_qty_value=2), strictly adhering to the sustainable risk recommendation of 5-10% of equity per trade.
Transaction Costs: Realistic trading conditions are modeled using 0.07% commission and 3 ticks slippage to prevent the overestimation of profitability.
⚙️ VISUAL GUIDE & SIGNAL LOGIC
Key Color Legend (Visual Guide):
WATCH – Setup (Yellow Arrow Down): Potential breakout setup detected.
BUY – Confirmation (Green Arrow Up): Confirmed breakout, triggered when price trades above the high of the WATCH candle.
SELL – Break (Orange Arrow): Short-term trend weakness, triggered when price closes below the Fast EMA (9).
SELL – Dump (Dark Red Arrow): Distribution / volume dump, triggered by a bearish candle with abnormally high volume.
SELL – Pattern (Purple Arrow): Bearish price-action pattern (such as a bearish engulfing).
Support & Resistance Lines (Red/Green): Small horizontal lines plotted at key swing points with exact price labels.
⌨️ INPUTS (DEFAULT SETTINGS)
Entry settings: Consolidation Lookback (default 20) = bars used to detect consolidation. Consolidation Range % (default 12%) = max allowed range size. Volume Spike Multiplier (default 1.2) = factor above average volume to count as a spike. Force Signal on Big Moves (default ON) = forces a WATCH signal on high-momentum moves.
Exit settings: Enable Fast Exit (EMA 9) toggles the SELL – Break signal. Dump Volume Multiplier defines what counts as “dump” volume.
Support & Resistance: Adjustable Pivot Left/Right bars control the sensitivity of the support and resistance lines.
⚠️ Disclaimer Trading involves significant risk of loss. This script is for educational and informational purposes only and is not financial advice or a recommendation to buy or sell any asset. BUY and SELL signals are rule-based and derived from historical behavior and do not guarantee future performance. Always use your own analysis and risk management. This is an open-source strategy; users are encouraged to test it across different symbols and timeframes.

ALT Risk Metric StrategyHere's a professional write-up for your ALT Risk Strategy script:
ALT/BTC Risk Strategy - Multi-Crypto DCA with Bitcoin Correlation Analysis
Overview
This strategy uses Bitcoin correlation as a risk indicator to time entries and exits for altcoins. By analyzing how your chosen altcoin performs relative to Bitcoin, the strategy identifies optimal accumulation periods (when alt/BTC is oversold) and profit-taking opportunities (when alt/BTC is overbought). Perfect for traders who want to outperform Bitcoin by strategically timing altcoin positions.
Key Innovation: Why Alt/BTC Matters
Most traders focus solely on USD price, but Alt/BTC ratios reveal true altcoin strength:
When Alt/BTC is low → Altcoin is undervalued relative to Bitcoin (buy opportunity)
When Alt/BTC is high → Altcoin has outperformed Bitcoin (take profits)
This approach captures the rotation between BTC and alts that drives crypto cycles
Key Features
📊 Advanced Technical Analysis
RSI (60% weight): Primary momentum indicator on weekly timeframe
Long-term MA Deviation (35% weight): Measures distance from 150-period baseline
MACD (5% weight): Minor confirmation signal
EMA Smoothing: Filters noise while maintaining responsiveness
All calculations performed on Alt/BTC pairs for superior market timing
💰 3-Tier DCA System
Level 1 (Risk ≤ 70): Conservative entry, base allocation
Level 2 (Risk ≤ 50): Increased allocation, strong opportunity
Level 3 (Risk ≤ 30): Maximum allocation, extreme undervaluation
Continuous buying: Executes every bar while below threshold for true DCA behavior
Cumulative sizing: L3 triggers = L1 + L2 + L3 amounts combined
📈 Smart Profit Management
Sequential selling: Must complete L1 before L2, L2 before L3
Percentage-based exits: Sell portions of position, not fixed amounts
Auto-reset on re-entry: New buy signals reset sell progression
Prevents premature full exits during volatile conditions
🤖 3Commas Automation
Pre-configured JSON webhooks for Custom Signal Bots
Multi-exchange support: Binance, Coinbase, Kraken, Bitfinex, Bybit
Flexible quote currency: USD, USDT, or BUSD
Dynamic order sizing: Automatically adjusts to your tier thresholds
Full webhook documentation compliance
🎨 Multi-Asset Support
Pre-configured for popular altcoins:
ETH (Ethereum)
SOL (Solana)
ADA (Cardano)
LINK (Chainlink)
UNI (Uniswap)
XRP (Ripple)
DOGE
RENDER
Custom option for any other crypto
How It Works
Risk Metric Calculation (0-100 scale):
Fetches weekly Alt/BTC price data for stability
Calculates RSI, MACD, and deviation from 150-period MA
Normalizes MACD to 0-100 range using 500-bar lookback
Combines weighted components: (MACD × 0.05) + (RSI × 0.60) + (Deviation × 0.35)
Applies 5-period EMA smoothing for cleaner signals
Color-Coded Risk Zones:
Green (0-30): Extreme buying opportunity - Alt heavily oversold vs BTC
Lime/Yellow (30-70): Accumulation range - favorable risk/reward
Orange (70-85): Caution zone - consider taking initial profits
Red/Maroon (85-100+): Euphoria zone - aggressive profit-taking
Entry Logic:
Buys execute every candle when risk is below threshold
As risk decreases, position sizing automatically scales up
Example: If risk drops from 60→25, you'll be buying at L1 rate until it hits 50, then L2 rate, then L3 rate
Exit Logic:
Sells only trigger when in profit AND risk exceeds thresholds
Sequential execution ensures partial profit-taking
If new buy signal occurs before all sells complete, sell levels reset to L1
Configuration Guide
Choosing Your Altcoin:
Select crypto from dropdown (or use CUSTOM for unlisted coins)
Pick your exchange
Choose quote currency (USD, USDT, BUSD)
Risk Metric Tuning:
Long Term MA (default 150): Higher = more extreme signals, Lower = more frequent
RSI Length (default 10): Lower = more volatile, Higher = smoother
Smoothing (default 5): Increase for less noise, decrease for faster reaction
Buy Settings (Aggressive DCA Example):
L1 Threshold: 70 | Amount: $5
L2 Threshold: 50 | Amount: $6
L3 Threshold: 30 | Amount: $7
Total L3 buy = $18 per candle when deeply oversold
Sell Settings (Balanced Exit Example):
L1: 70 threshold, 25% position
L2: 85 threshold, 35% position
L3: 100 threshold, 40% position (final exit)
3Commas Setup
Bot Configuration:
Create Custom Signal Bot in 3Commas
Set trading pair to your altcoin/USD (e.g., ETH/USD, SOL/USDT)
Order size: Select "Send in webhook, quote" to use strategy's dollar amounts
Copy Bot UUID and Secret Token
Script Configuration:
Paste credentials into 3Commas section inputs
Check "Enable 3Commas Alerts"
Save and apply to chart
TradingView Alert:
Create Alert → Condition: "alert() function calls only"
Webhook URL: api.3commas.io
Enable "Webhook URL" checkbox
Expiration: Open-ended
Strategy Advantages
✅ Outperform Bitcoin: Designed specifically to beat BTC by timing alt rotations
✅ Capture Alt Seasons: Automatically accumulates when alts lag, sells when they pump
✅ Risk-Adjusted Sizing: Buys more when cheaper (better risk/reward)
✅ Emotional Discipline: Systematic approach removes fear and FOMO
✅ Multi-Asset: Run same strategy across multiple altcoins simultaneously
✅ Proven Indicators: Combines RSI, MACD, and MA deviation - battle-tested tools
Backtesting Insights
Optimal Timeframes:
Daily chart: Best for backtesting and signal generation
Weekly data is fetched internally regardless of display timeframe
Historical Performance Characteristics:
Accumulates heavily during bear markets and BTC dominance periods
Captures explosive altcoin rallies when BTC stagnates
Sequential selling preserves capital during extended downtrends
Works best on established altcoins with multi-year history
Risk Considerations:
Requires capital reserves for extended accumulation periods
Some altcoins may never recover if fundamentals deteriorate
Past correlation patterns may not predict future performance
Always size positions according to personal risk tolerance
Visual Interface
Indicator Panel Displays:
Dynamic color line: Green→Lime→Yellow→Orange→Red as risk increases
Horizontal threshold lines: Dashed lines mark your buy/sell levels
Entry/Exit labels: Green labels for buys, Orange/Red/Maroon for sells
Real-time risk value: Numerical display on price scale
Customization:
All threshold lines are adjustable via inputs
Color scheme clearly differentiates buy zones (green spectrum) from sell zones (red spectrum)
Line weights emphasize most extreme thresholds (L3 buy and L3 sell)
Strategy Philosophy
This strategy is built on the principle that altcoins move in cycles relative to Bitcoin. During Bitcoin rallies, alts often bleed against BTC (high sell, accumulate). When Bitcoin consolidates, alts pump (take profits). By measuring risk on the Alt/BTC chart instead of USD price, we time these rotations with precision.
The 3-tier system ensures you're always averaging in at better prices and scaling out at better prices, maximizing your Bitcoin-denominated returns.
Advanced Tips
Multi-Bot Strategy:
Run this on 5-10 different altcoins simultaneously to:
Diversify correlation risk
Capture whichever alt is pumping
Smooth equity curve through rotation
Pairing with BTC Strategy:
Use alongside the BTC DCA Risk Strategy for complete portfolio coverage:
BTC strategy for core holdings
ALT strategies for alpha generation
Rebalance between them based on BTC dominance
Threshold Calibration:
Check 2-3 years of historical data for your chosen alt
Note where risk metric sat during major bottoms (set buy thresholds)
Note where it peaked during euphoria (set sell thresholds)
Adjust for your risk tolerance and holding period
Credits
Strategy Development & 3Commas Integration: Claude AI (Anthropic)
Technical Analysis Framework: RSI, MACD, Moving Average theory
Implementation: pommesUNDwurst
Disclaimer
This strategy is for educational purposes only. Cryptocurrency trading involves substantial risk of loss. Altcoins are especially volatile and many fail completely. The strategy assumes liquid markets and reliable Alt/BTC price data. Always do your own research, understand the fundamentals of any asset you trade, and never risk more than you can afford to lose. Past performance does not guarantee future results. The authors are not financial advisors and assume no liability for trading decisions.
Additional Warning: Using leverage or trading illiquid altcoins amplifies risk significantly. This strategy is designed for spot trading of established cryptocurrencies with deep liquidity.
Tags: Altcoin, Alt/BTC, DCA, Risk Metric, Dollar Cost Averaging, 3Commas, ETH, SOL, Crypto Rotation, Bitcoin Correlation, Automated Trading, Alt Season
Feel free to modify any sections to better match your style or add specific backtesting results you've observed! 🚀Claude is AI and can make mistakes. Please double-check responses. Sonnet 4.5

ACD STRATEGYACD Opening Range Strategy based off of the strategy of Mark Fischer. It trades off the MGC opening range of all 3 sessions (LDN, ASN, NY)

Pro Bollinger Bands Strategy [Breno]This strategy excels in highly volatile financial instruments, including cryptocurrencies, high-beta stocks, commodity futures, and certain exchange-traded funds (ETFs) that exhibit clear mean-reversion characteristics around their Bollinger Bands. The system's ability to utilize scaling (position averaging) and an ATR-based stop loss makes it particularly effective in markets with significant price swings, allowing the trader to capture profits from price extremes while managing increased volatility-related risk.
Core Strategy Logic
This Strategy implements a comprehensive trend-following and mean-reversion strategy primarily leveraging the Bollinger Bands (BB) indicator for entry and exit signals, complemented by an Average True Range (ATR)-based Stop Loss mechanism and an optional EMA filter. It is designed with robust features for capital management, including configurable leverage and a sophisticated position averaging (scaling) system.
Long Entry: A long position is initiated when the closing price crosses over the Lower Bollinger Band (ta.crossover(close,lowerBB)). This signals a potential mean-reversion opportunity following a price dip.
Short Entry: A short position is initiated when the closing price crosses under the Upper Bollinger Band (ta.crossunder(close,upperBB)). (Note: Short entries are disabled by default in the script inputs).
Exit Conditions (Profit Target): Long positions aim to exit upon interaction with the Upper Bollinger Band. Users can select from three exit methods:
"Close When Touch": Exits when close≥upperBB.
"Close Above then Below": Exits when the previous close was above the upper band, and the current close is below it (a reversal signal).
"High Above": Exits when high>upperBB. The strategy features an optional profitOnly setting, which restricts all exits to only occur if the trade is currently in profit (i.e., close is above the strategy.position_avg_price for longs).
Key Features and Customization
Bollinger Bands & Filters -
Customizable BB Parameters: The Length and Deviation of the Bollinger Bands are fully adjustable, allowing users to fine-tune the sensitivity of the entry and exit signals.
Optional EMA Filter: An optional EMA Filter can be enabled to align entries with the prevailing trend, where a Long entry is only permitted if close≥EMA(EmaFilterRange).
Risk and Capital Management -
Equity Allocation: Position size is dynamically calculated based on a Percentage of Equity (capitalPerc) combined with the set Leverage multiplier.
Dynamic Stop Loss (ATR-Based):
An optional Stop Loss (SL) is calculated using a multiple (slAtrInput) of the Average True Range (ATR).
The SL is set relative to the entry price upon trade activation, providing a volatility-adjusted risk management layer.
Position Averaging (Scaling): The script supports the addition of multiple units (pyramiding) to an existing position based on three user-selected criteria:
"No": No averaging.
"Percent": Adds to the position if the price has dropped by a set percentage (addPct) from the average price.
"ATR": Adds to the position if the current price is significantly below a calculated ATR-based support level from the average price.

Gemini Wyckoff Trend SystemStrategy Name: Gemini Wyckoff-Trend System
1. Core Design Philosophy
This strategy fuses Wyckoff Theory (specifically the "Law of Effort vs. Result") with classic Trend Following principles. Its primary goal is not to catch every minor fluctuation, but to filter out 80% of market noise and fakeouts, ensuring that you only pull the trigger when "Smart Money" enters the market with genuine volume.
It operates on a strict "3-Dimension Verification" logic:
Trend (Context): Never trade against the macro trend.
Structure (Price Action): Identify accumulation zones and wait for the breakout.
Volume (Effort): Require massive volume confirmation to validate the move.
2. The 3-Filter System
Filter 1: The Trend Filter (EMA 200)
Rule: The strategy only looks for Long setups when the price is ABOVE the 200-period Exponential Moving Average (EMA).
Purpose: To strictly prevent "catching falling knives" or counter-trend trading during a bear market.
Filter 2: The Structure Filter (Donchian Channel)
Rule: The script automatically identifies the highest high of the past 20 bars to define the "Accumulation Box." A signal is only possible if the price closes above this resistance level.
Wyckoff Term: This represents "Jumping the Creek" (JTC)—signaling that price is leaving the trading range.
Filter 3: The Volume Filter (RVOL > 1.5)
Rule: The breakout bar must have a volume that is at least 1.5x higher than the average volume of the past 20 bars.
Purpose: To eliminate "Upthrusts" (Fake Breakouts). If price breaks out on low volume, the system ignores it.
3. Visual Guide
Once loaded, here is how to read the chart:
📉 Orange Line (EMA 200): The Bull/Bear divider. If price is below this line, stay in cash.
🌫️ Grey Zone: The "No-Trade Zone" (Accumulation/Consolidation). Do not trade while price is inside this box.
🟢 Lime Green Bar: The Entry Signal. This indicates a valid breakout confirmed by high volume (Smart Money entry).
🪜 Red Step Line: Your Trailing Stop (ATR-based). As long as you hold a position, watch this line. If price closes below it, exit immediately.
📊 Dashboard (Top Right): Monitors market "Heat." If RVOL is Green, volume is significant.
4. Best Practices
Ideal For: Traders who struggle with over-trading or FOMO. This script enforces patience and discipline.
Timeframe: Recommended for 4-Hour (4H) or Daily (1D) charts to catch major crypto trends (e.g., Bitcoin main waves).
Asset Class: Crypto, Stocks, or any asset with high volume liquidity.
5. Risk Warning
This strategy includes a built-in ATR Volatility Stop. The stop-loss level adjusts dynamically based on market volatility. Please adhere strictly to the stop-loss signals to protect your capital.

Volume Momentum Strategy [MA/VWAP Cross]Deconstructing the Volume Momentum Strategy: An Analysis of MA-VWAP Cross Mechanics
Introduction
The "Volume Momentum Strategy " is a technical trading algorithm programmed in Pine Script v6 for the TradingView platform. At its core, the strategy is a trend-following system that utilizes the interaction between a specific Moving Average (MA) and the Volume Weighted Average Price (VWAP) to generate trade signals. While the primary execution logic relies on price crossovers, the strategy incorporates a sophisticated secondary layer of analysis using the Commodity Channel Index (CCI) and Stochastic Oscillator. Uniquely, these secondary indicators are applied to volume data rather than price, serving as a gauge for market participation and momentum intensity.
The Core Engine: MA and VWAP Crossover
The primary engine driving the strategy's buy and sell decisions is the crossover relationship between a user-defined Moving Average and the VWAP.
1. The Anchor (VWAP): The strategy calculates the Volume Weighted Average Price based on the HLC3 (High, Low, Close divided by 3) source. VWAP serves as the dynamic benchmark for "fair value" throughout the trading session.
2. The Trigger (Moving Average): The script allows for flexibility in defining the "fast" line, offering options such as Simple (SMA), Exponential (EMA), or Hull Moving Averages.
3. The Signal:
o A Long (Buy) signal is generated when the chosen MA crosses over the VWAP. This suggests that short-term price momentum is exceeding the average volume-weighted price of the session, indicating bullish sentiment.
o A Short (Sell) signal is generated when the MA crosses under the VWAP, indicating bearish pressure where price is being pushed below the session's volume-weighted average.
The Role of CCI and Stochastic: Analyzing Volume Momentum
The prompt specifically inquires about how the CCI and Stochastic indicators fit into this process. In standard technical analysis, these oscillators are used to identify overbought or oversold price conditions. However, this strategy repurposes them to analyze Volume Momentum.
1. The Calculation
Instead of using close prices as the input source, the script passes volume data into both indicator functions:
• Volume CCI: Calculated as ta.cci(volume, cciLength). This measures the deviation of current volume from its statistical average.
• Volume Stochastic: Calculated as ta.stoch(volume, volume, volume, stochLength). This gauges the current volume relative to its recent range.
2. The "Volume Spike" Condition
The strategy combines these two indicators to define a specific market condition labeled isVolumeSpike. A volume spike is confirmed only when both conditions are met simultaneously:
• The Volume CCI must be greater than a defined threshold (default: 100).
• The Volume Stochastic must be greater than a defined threshold (default: 80).
3. Integration into the Process
It is critical to note how this script currently applies this "Volume Spike" logic:
• Visual Confirmation: In the current version of the code, the isVolumeSpike boolean is used strictly for visual feedback. When a spike is detected, the script paints the specific price bar yellow and plots a small triangle marker below the bar.
• Strategic Implication: While the code calculates these metrics, the variables long_condition and short_condition currently rely solely on the MA/VWAP crossover. The developer has left the volume logic as a visual overlay, noting in the comments that it serves as a "visual/alert" or a potential filter.
• Potential Alpha: Conceptually, this setup implies that a trader should look for the MA/VWAP crossover to occur coincidentally with—or shortly after—a "Volume Spike" (yellow bar). This would confirm that the price move is backed by significant institutional participation (volume) rather than just retail noise.
Risk Management and Time Constraints
The strategy wraps these technical signals in a robust risk management framework. It includes hard-coded time windows (start/stop trading times) and a "Close All" function to prevent holding positions overnight. Furthermore, it employs both percentage-based and dollar-based Stop Loss and Take Profit mechanisms, ensuring that every entry—whether generated by a high-momentum crossover or a standard trend move—has a predefined exit plan.
Conclusion
The "Volume Momentum Strategy" is a hybrid system. It executes trades based on the reliable trend signal of MA crossing VWAP but informs the trader with advanced volume analytics. By processing volume through the CCI and Stochastic calculations, it provides a "heads-up" display regarding the intensity of market participation, allowing the trader to distinguish between low-volume drifts and high-volume breakout moves.

Retracement Strategy [OmegaTools]Retracement Strategy is a systematic trend–retracement framework designed to identify directional opportunities after a confirmed momentum shift, and to manage exits using either trend reversals or overextension conditions. It is built around a smoothed RSI regime filter and a simple, price-based retracement trigger, making it applicable across a wide range of markets and timeframes while remaining transparent and easy to interpret.
The strategy begins by defining the underlying trend through a two-stage RSI signal. A standard RSI is computed over the user-defined Length input, then smoothed with a short moving average to reduce noise. Two symmetric thresholds are derived from the Threshold parameter: an upper band at 100 minus the threshold and a lower band at the threshold itself. When the smoothed RSI crosses above the upper band, the environment is classified as bullish and the internal trend state is set to uptrend. When the smoothed RSI crosses below the lower band, the environment is classified as bearish and the trend state becomes downtrend. When RSI moves back into the central zone between the two bands, the trend is considered neutral. In addition to the current trend, the strategy tracks the last non-neutral trend direction, which is used to detect genuine trend changes rather than transient oscillations.
Once a trend is established, the strategy looks for retracement entries in the direction of that trend. For long setups in an uptrend, it computes the lowest low over the previous Length minus one bars, excluding the current bar. A long signal is generated when price dips below this recent low while the trend state remains bullish. Symmetrically, for short setups in a downtrend, it computes the highest high over the previous Length minus one bars and enters short when price spikes above this recent high while the trend state remains bearish. This logic is designed to capture pullbacks against the prevailing RSI-defined trend, entering when the market tests or slightly violates recent extremes, rather than chasing breakouts. The candles are visually coloured to reflect the detected trend, highlighting bullish and bearish environments while keeping neutral phases distinguishable on the chart. An ATR-based measure is used solely to position the “UP” and “DN” labels on the chart for clearer visualisation of entry points; it does not directly influence position sizing or stop calculation in this implementation.
Take profit and stop loss behaviour are fully parameterized through the “Take Profit” and “Stop Loss” inputs, each offering three modes: None, Trend Change and Extension. When “Trend Change” is selected for the take profit, the strategy will only exit profitable positions when a confirmed trend reversal occurs. For a long position, this means that the strategy will close the trade when the trend state flips from uptrend to downtrend, and the last recorded trend direction validates that this is a genuine reversal rather than a neutral fluctuation; the same logic applies symmetrically for short positions. When “Extension” is selected as the take profit mode, the strategy closes profitable long trades when the smoothed RSI reaches or exceeds the upper threshold, interpreted as an overbought extension within the bullish regime, and closes profitable short trades when the smoothed RSI falls to or below the lower threshold, interpreted as an oversold extension within the bearish regime. When “None” is chosen, the strategy does not apply any explicit take profit logic, leaving trades to be managed by the stop loss settings or by user discretion in backtesting.
The stop loss parameter works in a parallel way. With “Trend Change” selected as stop loss, any open long position is closed when the trend flips from uptrend to downtrend, regardless of whether the trade is currently in profit or loss, and any open short is closed when the trend flips from downtrend to uptrend. This turns the RSI trend regime into a hard invalidation rule: once the underlying momentum structure reverses, the position is exited. With “Extension” selected for stop loss, long positions are closed when RSI falls back below the upper band and moves towards the opposite side of the range, while short positions are closed when RSI rises above the lower band and moves towards the upper side. In practice, this acts as a dynamic exit based on the oscillator moving out of a favourable context for the existing trade. Selecting “None” for stop loss disables these automatic exits, leaving only the take profit logic, if any, to manage the position. Because take profit and stop loss configuration are independent, the user can construct different profiles, such as pure trend-change exits on both sides, pure overextension exits, or a mix (for example, take profit on overextension and stop loss on trend reversal).
This strategy is designed as an analytical and backtesting framework rather than a finished plug-and-play trading system. It does not include position sizing, risk-per-trade controls, multi-timeframe confirmation, volatility filters or instrument-specific fine-tuning. Its primary purpose is to provide a clear, rule-based structure for testing retracement logic within RSI-defined trends, and to allow users to explore how different exit regimes (trend-change based versus extension based) affect performance on their instruments and timeframes of interest.
Nothing in this script or its description should be interpreted as financial advice, investment recommendation or solicitation to buy or sell any financial instrument. Past performance on backtests does not guarantee future results. The behaviour of this strategy can vary significantly across symbols, timeframes and market conditions, and correlations, volatility and liquidity can change without warning. Before considering any live application, users should thoroughly backtest and forward test the strategy on their own data, adjust parameters to their risk profile and instrument characteristics, and integrate proper money management and trade management rules. Use of this script is entirely at the user’s own risk.

Stratégie SMC V18.2 (BTC/EUR FINAL R3 - Tendance)This strategy is an automated implementation of Smart Money Concepts (SMC), designed to operate on the Bitcoin/Euro (BTC/EUR) chart using the 15-minute Timeframe (M15).It focuses on identifying high-probability zones (Order Blocks) after a confirmed Break of Structure (BOS) and a Liquidity Sweep, utilizing an H1/EMA 200 trend filter to only execute trades in the direction of the dominant market flow.Risk management is strict: every trade uses a fixed Risk-to-Reward Ratio (R:R) of 1:3.🧱 Core Logic Components
1. Trend Filter (H1/EMA 200)Objective: To avoid counter-trend entries, which has allowed the success rate to increase to nearly $65\%$ in backtests.Mechanism: A $200$-period EMA is plotted on a higher timeframe (Default: H1/60 minutes).Long (Buy): Entry is only permitted if the current price (M15) is above the trend EMA.Short (Sell): Entry is only permitted if the current price (M15) is below the trend EMA.
2. Order Block (OB) DetectionA potential Order Block is identified on the previous candle if it is
accompanied by an inefficiency (FVG - Fair Value Gap).
3. Advanced SMC ValidationBOS (Break of Structure): A recent BOS must be confirmed by breaking the swing high/low defined by the swing length (Default: 4 M15 candles).Liquidity (Liquidity Sweep): The Order Block zone must have swept recent liquidity (defined by the Liquidity Search Length) within a certain tolerance (Default: $0.1\%$).Point of Interest: The OB must form in a premium zone (for shorts) or a discount zone (for longs) relative to the current swing range (above or below the $50\%$ level of the range).
4. Execution and Risk ManagementEntry: The trade is triggered when the price touches the active Order Block (mitigation).Stop Loss (SL): The SL is fixed at the low of the OB (for longs) or the high of the OB (for shorts).Take Profit (TP): The TP is strictly set at a level corresponding to 3 times the SL distance (R:R 1:3).Lot Sizing: The trade quantity is calculated to risk a fixed amount (Default: 2.00 Euros) per transaction, capped by a Lot Max and Lot Min defined by the user.
Input Parameters (Optimized for BTC/EUR M15)Users can adjust these parameters to modify sensitivity and risk profile. The default values are those optimized for the high-performing backtest (Profit Factor $> 3$).ParameterDescriptionDefault Value (M15)Long. Swing (BOS)Candle length used to define the swing (and thus the BOS).4Long. Recherche Liq.Number of candles to scan to confirm a liquidity sweep.7Tolérance Liq. (%)Price tolerance to validate the liquidity sweep (as a percentage of price).0.1Timeframe TendanceChart timeframe used for the EMA filter (e.g., 60 = H1).60 (H1)Longueur EMA TendancePeriods used for the trend EMA.200Lot Max (Quantité Max BTC)Maximum quantity of BTC the strategy is allowed to trade.0.01Lot Min Réel (Exigence Broker)Minimum quantity required by the broker/exchange.0.00001

Recursive WMA Angle StrategyDescription: This strategy utilizes a recursive Weighted Moving Average (WMA) calculation to determine the trend direction and strength based on the slope (angle) of the curve. By calculating the angle of the smoothed moving average in degrees, the script filters out noise and aims to enter trades only during strong momentum phases.
How it Works:
Recursive WMA: The script calculates a series of nested WMAs (M1 to M5), creating a very smooth yet responsive curve.
Angle Calculation: It measures the rate of change of this curve over a user-defined lookback period and converts it into an angle (in degrees).
Entry Condition (Long): A long position is opened when the calculated angle exceeds the Min Angle for BUY threshold (default: 0.2), indicating a strong upward trend.
Exit Condition: The position is closed when the angle drops below the Min Angle for SELL threshold (default: -0.2), indicating a sharp trend reversal.
Settings:
MA Settings: Adjust the base lengths for the recursive calculation.
Angle Settings: Fine-tune the sensitivity by changing the Buy/Sell angle thresholds.
Date Filter: Restrict the backtest to a specific date range.
Note: This strategy is designed for Long-Only setups.