The Barking Rat PercentilesPercentile Reversion with Multi-Layered Smoothing
The Barking Rat Percentiles is a multi-tiered reversion strategy based on fixed percentage movements away from the mean, designed to capture price extremes through a structured, practical approach. It combines statistically derived percentile bands, RSI momentum filtering, and ATR-driven exits to identify potential turning points while managing opportunity with precision. The aim is to isolate high-quality reversal opportunities at progressively deeper extremes while avoiding noise and low-conviction setups.
At its core, the strategy measures the current market position relative to long-term percentile thresholds. When price moves significantly beyond these smoothed levels and momentum shows signs of exhaustion, staged entries are triggered. Exits are managed using independent ATR-based take profit and stop loss logic to adapt to varying volatility conditions.
🧠 Core Logic: Tiered Extremes & Structured Management
This strategy is intentionally methodical, layering multiple thresholds and validation checks before highlighting potential setups. By combining percentile-based extremes with momentum confirmation and adaptive trade management, it offers a disciplined and repeatable framework for mean reversion trading.
1. Percentile Thresholds as the Primary Framework
The script calculates the highest high and lowest low over a long lookback period of more than 1000 candles to define the overall price range. It then derives upper and lower percentile thresholds to determine extreme price levels. These thresholds are smoothed using a simple moving average to filter out short-term noise, ensuring that only statistically significant deviations from the mean are considered for potential trades.
2. Multi-Tier Entry Levels
Based on the percentile distance away from the mean, the script plots and references five discrete trigger levels beyond the primary thresholds for both long and short positions. Each tier represents progressively deeper extremes, typically 1–3% beyond the smoothed threshold, balancing the benefits of early entries with the safety of more confirmed extremes. Custom logic ensures only one signal is generated per threshold level, avoiding duplicate entries in the same zone.
3. RSI Momentum Filter
A 14-period RSI filter is applied to prevent entering trades against strong momentum. Long trades are only triggered when RSI falls below 30 (oversold), and short trades only when RSI rises above 70 (overbought). This helps align entries with potential exhaustion points, reducing the risk of entering prematurely into a strong ongoing trend.
4. ATR-Based Trade Management
For each trade sequence, the strategy will exit on the first exit condition met: either the take profit (TP) or the stop loss (SL). Because the TP uses a smaller ATR multiplier, it’s generally closer to the entry price, so most trades will hit the TP before reaching the SL. The SL is intentionally set with a larger ATR multiplier to give the trade room to develop, acting as a protective fallback rather than a frequent exit.
So in practice, you’ll usually see the TP executed for a trade, and the SL only triggers in cases where price moves further against the position than expected.
5. Position Reset Logic
Once price returns to the smoothed threshold region, all entry tiers in that direction are reset. This allows the system to prepare for new opportunities if the market revisits extreme levels, without triggering duplicate trades at the same threshold.
Why These Parameters Were Chosen
Multi-tier thresholds ensure that only meaningful extremes are acted upon, while the long-range SMA provides historical context and filters out noise. The staged entry logic per level balances the desire for early participation with the discipline of risk management. ATR-based TP and SL levels adapt to changing volatility, while the RSI filter improves timing by aligning trades with potential exhaustion points. Together, these elements create a balanced, structured, and repeatable approach to mean reversion trading.
📈 Chart Visuals: Clear & Intuitive
Green “▲” below a candle: Potential long entry
Red “▼” above a candle: Potential short entry
Blue “✔️”: Exit when ATR take profit is hit
Orange “✘”: Exit when ATR stop loss is hit
Tier threshold lines (smoothed upper/lower bounds)
🔔Alerts: Stay Notified Without Watching
The strategy supports real-time alerts on candle close, ensuring that signals are only triggered once fully confirmed.
You must manually set up alerts within your TradingView account. Once configured, you’ll be able to set up one alert per instrument. This one alert covers all relevant signals and exits — ideal for hands-free monitoring.
⚙️Strategy report properties
Position size: 25% equity per trade
Initial capital: 10,000.00 USDT
Pyramiding: 10 entries per direction
Slippage: 2 ticks
Commission: 0.055% per side
Backtest timeframe: 1-minute
Backtest instrument: SOLUSDT
Backtesting range: Jul 28, 2025 — Aug 14, 2025
Note on Sample Size:
You’ll notice the report displays fewer than the ideal 100 trades in the strategy report above. This is intentional. The goal of the script is to isolate high-quality, short-term reversal opportunities while filtering out low-conviction setups. This means that the Barking Rat Percentiles strategy is ultra-selective, filtering out over 90% of market noise by enforcing multiple validation layers. The brief timeframe shown in the strategy report here illustrates its filtering logic over a short window — not its full capabilities. As a result, even on lower timeframes like the 1-minute chart, signals are deliberately sparse — each one must pass all criteria before triggering.
For a larger dataset:
Once the strategy is applied to your chart, users are encouraged to expand the lookback range or apply the strategy to other volatile pairs to view a full sample.
💡Why 25% Equity Per Trade?
While it's always best to size positions based on personal risk tolerance, we defaulted to 25% equity per trade in the backtesting data — and here’s why:
Backtests using this sizing show manageable drawdowns even under volatile periods
The strategy generates a sizeable number of trades, reducing reliance on a single outcome
Combined with conservative filters, the 25% setting offers a balance between aggression and control
Users are strongly encouraged to customize this to suit their risk profile.
🔍 What Makes This Strategy Unique?
Multi-Tier Percentile Triggers – Instead of relying on a single overbought/oversold zone, this strategy uses five distinct entry tiers per direction, allowing for staged, precision entries at progressively deeper extremes.
Long-Term Percentile Smoothing – By calculating extremes over a 1000+ candle range and smoothing them with a moving average, the strategy focuses only on statistically significant deviations.
Custom One-Signal-Per-Tier Logic – Prevents duplicate trades at the same threshold level, reducing overtrading and noise.
Dual ATR Exit System – Independent TP and SL levels adapt to volatility. TP uses a smaller ATR multiplier for realistic, achievable exits and generally executes first, while the SL has a larger ATR multiplier to provide protective breathing room if the trade moves further against the position.
Momentum-Aware Filtering – A 14-period RSI filter ensures trades are only taken when momentum is likely exhausted, avoiding entries into strong trends.
Automatic Position Reset – Once price normalizes, tiers reset, allowing for fresh entries without interference from previous trades.
Поиск скриптов по запросу "range"

ORB 5M + VWAP + Braid Filter + TP 2R o Niveles PreviosORB 5-Minute Breakout Strategy Summary
Strategy Name:
ORB 5M + VWAP + Braid Filter + TP 2R or Previous Levels
Timeframe:
5-minute chart
Trading Window:
9:35 AM to 11:00 AM (New York time)
✅ Entry Conditions:
Opening Range: Defined from 9:30 to 9:35 AM (first 5-minute candle).
Breakout Entry:
Long trade: Price breaks above the opening range high.
Short trade: Price breaks below the opening range low.
Confirmation Filters (All must be met):
Strong candle (green for long, red for short).
VWAP in the direction of the trade.
Braid Filter by Mango2Juice supports the breakout direction (green for long, red for short).
📉 Stop Loss:
Placed at the opposite side of the opening range.
🎯 Take Profit (TP):
+2R (Risk-to-Reward Ratio of 2:1),
or
Closest of the following: previous day’s high/low or premarket levels.
⚙️ Additional Rules:
Only valid signals between 9:35 and 11:00 AM.
Only one trade per breakout direction per day.
Filter out "trap candles" (very small or indecisive candles).
Avoid trading after 11:00 AM.
📊 Performance Goals:
Maintain a high Profit Factor (above 3 ideally).
Focus on tickers with good historical performance under this strategy (e.g., AMZN, PLTR, CVNA).

Scalping Strategy Signal v2 by [INFINITYTRADER]Overview
This Pine Script (v6) implements a scalping strategy that uses higher timeframe data (default: 4H) to generate entry and exit signals, originally designed for the 15-minute timeframe with an option for 30-minute charts. The "Scalping Strategy Signal v2 by " integrates moving averages, RSI, volume, ATR, and candlestick patterns to identify trading opportunities. It features adjustable risk management with ATR-based stop-loss, take-profit, and trailing stops, plus dynamic position sizing based on user-set capital. Trades trigger only on the higher timeframe candle close (e.g., 4H) to limit activity within the same period. This closed-source script offers a structured scalping approach, blending multiple entry methods and risk controls for adaptability across market conditions.
What Makes It Unique
Unlike typical scalping scripts relying on single-indicator triggers (e.g., RSI alone or basic MA crossovers), this strategy combines four distinct entry methods—standard MA crossovers, RSI-based momentum shifts, trend-following shorts, and candlestick pattern logic—evaluated on a 4H timeframe for confirmation. This multi-layered design, paired with re-entry logic after losses and a mix of manual, ATR-based, and trailing exits, aims to balance trade frequency and reliability. The higher timeframe filter adds precision not commonly found in simpler scalping tools, while the 30-minute option enhances consistency by reducing noise.
How It Works
Timeframe Logic
Runs on a base timeframe (designed for 15-minute charts, with a 30-minute option) while pulling data from a user-chosen higher timeframe (default: 4H) for signal accuracy.
Limits entries to the close of each 4H candle, ensuring one trade per period to avoid over-trading in volatile conditions.
Indicators and Data
Moving Averages : Employs 21-period and 50-period simple moving averages on the higher timeframe to detect trends and signal entries/exits.
Volume : Requires volume to exceed 70% of its 20-period average on the higher timeframe for momentum confirmation.
RSI : Uses a 14-period RSI for overbought/oversold filtering and a 6-period RSI for precise entry timing.
ATR : Applies a 14-period Average True Range on the higher timeframe to set adaptive stop-loss and take-profit levels.
Candlestick Patterns : Analyzes consecutive green or red 4H bars for trend continuation signals.
Why These Indicators
The blend of moving averages, RSI, volume, ATR, and candlestick patterns forms a robust scalping framework. Moving averages establish trend context, RSI filters momentum and avoids extremes, volume confirms market activity, ATR adjusts risk to volatility, and candlestick patterns enhance entry timing with price action insights. Together, they target small, frequent moves in flat or trending markets, with the 4H filter reducing false signals common in lower-timeframe scalping.
Entry Conditions
Four entry methods are evaluated at the 4H candle close:
Standard Long Entry: Price crosses above the 21-period moving average, volume exceeds 70% of its 20-period average, and the 1H 14-period RSI is below 70—confirms uptrend momentum.
Special Long Entry: The 6-period RSI crosses above 23, price is more than 1.5 times the ATR from the 21-period moving average, and price exceeds its prior close—targets oversold bounces with a stop-loss at the 4H candle’s low.
Short Entries:
- RSI-Based: The 6-period RSI crosses below 68 with volume support—catches overbought pullbacks.
- Trend-Based: Price crosses below the 21-period moving average, volume is above 70% of its average, and the 1H 14-period RSI is above 30—confirms downtrends.
Red/Green Bar Logic: Two consecutive green 4H bars for longs or red 4H bars for shorts—uses candlestick patterns for continuation, with a tight stop-loss from the base timeframe candle.
Re-Entry Logic
Long : After a losing special long, triggers when the 6-period RSI crosses 27 and price crosses the 21-period moving average.
Short : After a losing short, triggers when the 6-period RSI crosses 50 and price crosses below the 21-period moving average.
Purpose: Offers recovery opportunities with stricter conditions.
Exit Conditions
Manual Exits: Longs close if the 21-period MA crosses below the 50-period MA or the 1H 14-period RSI exceeds 68; shorts close if the 21-period MA crosses above the 50-period MA or RSI drops below 25.
ATR-Based TP/SL: Stop-loss is entry price ± ATR × 1.5 (default); take-profit is ± ATR × 4 (default), checked at 4H close.
Trailing Stop: Adjusts ±6x ATR from peak/trough, closing if price retraces within 1x ATR.
Special/Tight SL: Special longs exit if price opens below the 4H candle’s low; 4th method entries use the base timeframe candle’s low/high, checked every bar.
Position Sizing
Bases trade value on user-set capital (default: 100 USDT), dividing by the higher timeframe close price for dynamic sizing.
Visualization
Displays a table at the bottom-right with current/previous signals, TP/SL levels, equity, trading pair, and trade size—color-coded for clarity (green for buy, red for sell).
Inputs
Initial Capital (USDT): Sets trade value (default: 100, min: 1).
ATR Stop-Loss Multiplier: Adjusts SL distance (default: 1.5, min: 1).
ATR Take-Profit Multiplier: Adjusts TP distance (default: 4, min: 1).
Higher Timeframe: Selects analysis timeframe (options: 1m, 5m, 15m, 30m, 1H, 4H, D, W; default: 4H).
Usage Notes
Intended Timeframe: Designed for 15-minute charts with 4H confirmation for precision and frequency; 30-minute charts improve consistency by reducing noise.
Backtesting: Adjust ATR multipliers and capital to match your asset’s volatility and risk tolerance.
Risk Management: Combines manual, ATR, and trailing exits—monitor to avoid overexposure.
Limitations: 4H candle-close dependency may delay entries in fast markets; RSI/volume filters can reduce trades in low-momentum periods.
Backtest Observations
Tested on BTC/USDT (4H higher timeframe, default settings: Initial Capital: 100 USDT, ATR SL: 1.5x, ATR TP: 4x) across market conditions, comparing 15-minute and 30-minute charts:
Bull Market (Jul 2023 - Dec 2023):
15-Minute: 277 long, 219 short; Win Rate: 42.74%; P&L: 108%; Drawdown: 1.99%; Profit Factor: 3.074.
30-Minute: 257 long, 215 short; Win Rate: 49.58%; P&L: 116.85%; Drawdown: 2.34%; Profit Factor: 3.14.
Notes: Moving average crossovers and green bar patterns suited this bullish phase; 30-minute improved win rate and P&L by filtering weaker signals.
Bear Market (Jan 2022 - Jun 2022):
15-Minute: 262 long, 211 short; Win Rate: 44.4%; P&L: 239.80%; Drawdown: 3.74%; Profit Factor: 3.419.
30-Minute: 250 long, 200 short; Win Rate: 52.22%; P&L: 258.77%; Drawdown: 5.34%; Profit Factor: 3.461.
Notes: Red bar patterns and RSI shorts thrived in the downtrend; 30-minute cut choppy reversals for better consistency.
Flat Market (Jan 2021 - Jun 2021):
15-Minute: 280 long, 208 short; Win Rate: 51.84%; P&L: 340.33%; Drawdown: 9.59%; Profit Factor: 2.924.
30-Minute: 270 long, 209 short; Win Rate: 55.11%; P&L: 315.42%; Drawdown: 7.21%; Profit Factor: 2.598.
Notes: High trade frequency and P&L showed strength in ranges; 30-minute lowered drawdown for better risk control.
Results reflect historical performance on BTC/USDT with default settings—users should test on their assets and timeframes. Past performance does not guarantee future results and is shared only to illustrate the strategy’s behavior.
Why It Works Well in Flat Markets
A "flat market" lacks strong directional trends, with price oscillating around moving averages, as in Jan 2021 - Jun 2021 for BTC/USDT. This strategy excels here because its crossover-based entries trigger frequently in tight ranges. In trending markets, an exit might not be followed by a new entry without a pullback, but flat markets produce multiple crossovers, enabling more trades. ATR-based TP/SL and trailing stops capture these small swings, while RSI and volume filters ensure momentum, driving high P&L and win rates.
Technical Details
Built in Pine Script v6 for TradingView compatibility.
Prevents overlapping trades with long/short checks.
Handles edge cases like zero division and auto-detects the trading pair’s base currency (e.g., BTC from BTCUSDT).
This strategy suits scalpers seeking structured entries and risk management. Test on 15-minute or 30-minute charts to match your style and market conditions.

QuantJazz Turbine Trader BETA v1.17QuantJazz Turbine Trader BETA v1.17 - Strategy Introduction and User Guide
Strategy Introduction
Welcome to the QuantJazz Turbine Trader BETA v1.17, a comprehensive trading strategy designed for TradingView. This strategy is built upon oscillator principles, drawing inspiration from the Turbo Oscillator by RedRox, and incorporates multiple technical analysis concepts including RSI, MFI, Stochastic oscillators, divergence detection, and an optional FRAMA (Fractal Adaptive Moving Average) filter.
The Turbine Trader aims to provide traders with a flexible toolkit for identifying potential entry and exit points in the market. It presents information through a main signal line oscillator, a histogram, and various visual cues like dots, triangles, and divergence lines directly on the indicator panel. The strategy component allows users to define specific conditions based on these visual signals to trigger automated long or short trades within the TradingView environment.
This guide provides an overview of the strategy's components, settings, and usage. Please remember that this is a BETA version (v1.17). While developed with care, it may contain bugs or behave unexpectedly.
LEGAL DISCLAIMER: QuantJazz makes no claims about the fitness or profitability of this tool. Trading involves significant risk, and you may lose all of your invested capital. All trading decisions made using this strategy are solely at the user's discretion and responsibility. Past performance is not indicative of future results. Always conduct thorough backtesting and risk assessment before deploying any trading strategy with real capital.
This work is licensed under Creative Commons Attribution-NonCommercial-ShareAlike 4.0 International.
Core Concepts and Visual Elements
The Turbine Trader indicator displays several components in its own panel below the main price chart:
1. Signal Line (Avg & Avg2): This is the primary oscillator. It's a composite indicator derived from RSI, MFI (Money Flow Index), and Stochastic calculations, smoothed using an EMA (Exponential Moving Average).
Avg: The faster smoothed signal line.
Avg2: The slower smoothed signal line.
Color Coding: The space between Avg and Avg2 is filled. The color (Neon Blue/gColor or Neon Purple/rColor) indicates the trend based on the relationship between Avg and Avg2. Blue suggests bullish momentum (Avg > Avg2), while Purple suggests bearish momentum (Avg2 > Avg).
Zero Line Crosses: Crossovers of the Avg line with the zero level can indicate shifts in momentum.
2. Histogram (resMfi): This histogram is based on smoothed and transformed MFI calculations (Fast MFI and Slow MFI).
Color Coding: Bars are colored Neon Blue (histColorUp) when above zero, suggesting bullish pressure, and Neon Purple (histColorDn) when below zero, suggesting bearish pressure. Transparency is applied.
Zero Line Crosses: Crossovers of the histogram with the zero level can signal potential shifts in money flow.
3. Reversal Points (Dots): Dots appear on the Signal Line (specifically on Avg2) when the color changes (i.e., Avg crosses Avg2).
Small Dots: Appear when a reversal occurs while the oscillator is in an "extreme" zone (below -60 for bullish reversals, above +60 for bearish reversals).
Large Dots: Appear when a reversal occurs outside of these extreme zones.
Colors: Blue (gRdColor) for bullish reversals (Avg crossing above Avg2), Purple (rRdColor) for bearish reversals (Avg crossing below Avg2).
4. Take Profit (TP) Signals (Triangles): Small triangles appear above (+120) or below (-120) the zero line.
Bearish Triangle (Down, Purple rTpColor): Suggests a potential exit point for long positions or an entry point for short positions, based on the oscillator losing upward momentum above the 50 level.
Bullish Triangle (Up, Blue gTpColor): Suggests a potential exit point for short positions or an entry point for long positions, based on the oscillator losing downward momentum below the -50 level.
5. Divergence Lines: The strategy automatically detects and draws potential regular and hidden divergences between the price action (highs/lows) and the Signal Line (Avg).
Regular Bullish Divergence (White bullDivColor line, ⊚︎ label): Price makes a lower low, but the oscillator makes a higher low. Suggests potential bottoming.
Regular Bearish Divergence (White bearDivColor line, ⊚︎ label): Price makes a higher high, but the oscillator makes a lower high. Suggests potential topping.
Hidden Bullish Divergence (bullHidDivColor line, ⊚︎ label): Price makes a higher low, but the oscillator makes a lower low. Suggests potential continuation of an uptrend.
Hidden Bearish Divergence (bearHidDivColor line, ⊚︎ label): Price makes a lower high, but the oscillator makes a higher high. Suggests potential continuation of a downtrend.
Delete Broken Divergence Lines: If enabled, newer divergence lines originating from a similar point will replace older ones.
6. Status Line: A visual bar at the top (95 to 105) and bottom (-95 to -105) of the indicator panel. Its color intensity reflects the confluence of signals:
Score Calculation: +1 if Avg > Avg2, +1 if Avg > 0, +1 if Histogram > 0.
Top Bar (Bullish): Bright Blue (gStatColor) if score is 3, Faded Blue if score is 2, Black otherwise.
Bottom Bar (Bearish): Bright Purple (rStatColor) if score is 0, Faded Purple if score is 1, Black otherwise.
Strategy Settings Explained
The strategy's behavior is controlled via the settings panel (gear icon).
1. Date Range:
Start Date, End Date: Define the period for backtesting. Trades will only occur within this range.
2. Optional Webhook Configuration: (For Automation)
3C Email Token, 3C Bot ID: Enter your 3Commas API credentials if you plan to automate trading using webhooks. The strategy generates JSON alert messages compatible with 3Commas. You can go ahead and just leave the text field as defaulted, "TOKEN HERE" / "BOT ID HERE" if not using any bot automations at this time. You can always come back later and automate it. More info can be made available from QuantJazz should you need automation assistance with custom indicators and trading strategies.
3. 🚀 Signal Line:
Turn On/Off: Show or hide the main signal lines (Avg, Avg2).
gColor, rColor: Set the colors for bullish and bearish signal line states.
Length (RSI): The lookback period for the internal RSI calculation. Default is 2.
Smooth (EMA): The smoothing period for the EMAs applied to the composite signal. Default is 9.
RSI Source: The price source used for RSI calculation (default: close).
4. 📊 Histogram:
Turn On/Off: Show or hide the histogram.
histColorUp, histColorDn: Set the colors for positive and negative histogram bars.
Length (MFI): The base lookback period for MFI calculations. Default is 5. Fast and Slow MFI lengths are derived from this.
Smooth: Smoothing period for the final histogram output. Default is 1 (minimal smoothing).
5.💡 Other:
Show Divergence Line: Toggle visibility of regular divergence lines.
bullDivColor, bearDivColor: Colors for regular divergence lines.
Show Hidden Divergence: Toggle visibility of hidden divergence lines.
bullHidDivColor, bearHidDivColor: Colors for hidden divergence lines.
Show Status Line: Toggle visibility of the top/bottom status bars.
gStatColor, rStatColor: Colors for the status line bars.
Show TP Signal: Toggle visibility of the TP triangles.
gTpColor, rTpColor: Colors for the TP triangles.
Show Reversal points: Toggle visibility of the small/large dots on the signal line.
gRdColor, rRdColor: Colors for the reversal dots.
Delete Broken Divergence Lines: Enable/disable automatic cleanup of older divergence lines.
6. ⚙️ Strategy Inputs: (CRITICAL for Trade Logic)
This section defines which visual signals trigger trades. Each signal (Small/Large Dots, TP Triangles, Bright Bars, Signal/Histogram Crosses, Signal/Histogram Max/Min, Divergences) has a dropdown menu:
Long: This signal can trigger a long entry.
Short: This signal can trigger a short entry.
Disabled: This signal will not trigger any entry.
Must Be True Checkbox: If checked for a specific signal, that signal's condition must be met for any trade (long or short, depending on the dropdown selection for that signal) to be considered. Multiple "Must Be True" conditions act as AND logic – all must be true simultaneously.
How it Works:
The strategy first checks if all conditions marked as "Must Be True" (for the relevant trade direction - long or short) are met.
If all "Must Be True" conditions are met, it then checks if at least one of the conditions not marked as "Must Be True" (and set to "Long" or "Short" respectively) is also met.
If both steps pass, and other filters (like Date Range, FRAMA) allow, an entry order is placed.
Example: If "Large Bullish Dot" is set to "Long" and "Must Be True" is checked, AND "Bullish Divergence" is set to "Long" but "Must Be True" is not checked: A long entry requires BOTH the Large Bullish Dot AND the Bullish Divergence to occur simultaneously. If "Large Bullish Dot" was "Long" but not "Must Be True", then EITHER a Large Bullish Dot OR a Bullish Divergence could trigger a long entry (assuming no other "Must Be True" conditions are active).
Note: By default, the strategy is configured for long-only trades (strategy.risk.allow_entry_in(strategy.direction.long)). To enable short trades, you would need to comment out or remove this line in the Pine Script code and configure the "Strategy Inputs" accordingly.
7. 💰 Take Profit Settings:
Take Profit 1/2/3 (%): The percentage above the entry price (for longs) or below (for shorts) where each TP level is set. (e.g., 1.0 means 1% profit).
TP1/2/3 Percentage: The percentage of the currently open position to close when the corresponding TP level is hit. The percentages should ideally sum to 100% if you intend to close the entire position across the TPs.
Trailing Stop (%): The percentage below the highest high (for longs) or above the lowest low (for shorts) reached after the activation threshold, where the stop loss will trail.
Trailing Stop Activation (%): The minimum profit percentage the trade must reach before the trailing stop becomes active.
Re-entry Delay (Bars): The minimum number of bars to wait after a TP is hit before considering a re-entry. Default is 1 (allows immediate re-entry on the next bar if conditions met).
Re-entry Price Offset (%): The percentage the price must move beyond the previous TP level before a re-entry is allowed. This prevents immediate re-entry if the price hovers around the TP level.
8. 📈 FRAMA Filter: (Optional Trend Filter)
Use FRAMA Filter: Enable or disable the filter.
FRAMA Source, FRAMA Period, FRAMA Fast MA, FRAMA Slow MA: Parameters for the FRAMA calculation. Defaults provided are common starting points.
FRAMA Filter Type:
FRAMA > previous bars: Allows trades only if FRAMA is significantly above its recent average (defined by FRAMA Percentage and FRAMA Lookback). Typically used to confirm strong upward trends for longs.
FRAMA < price: Allows trades only if FRAMA is below the current price (framaSource). Can act as a baseline trend filter.
FRAMA Percentage (X), FRAMA Lookback (Y): Used only for the FRAMA > previous bars filter type.
How it Affects Trades: If Use FRAMA Filter is enabled:
Long entries require the FRAMA filter condition to be true.
Short entries require the FRAMA filter condition to be false (as currently coded, this acts as an inverse filter for shorts if enabled).
How to Use the Strategy
1. Apply to Chart: Open your desired chart on TradingView. Click "Indicators", find "QuantJazz Turbine Trader BETA v1.17" (you might need to add it via Invite-only scripts or if published publicly), and add it to your chart. The oscillator appears below the price chart, and the strategy tester panel opens at the bottom.
2. Configure Strategy Properties: In the Pine Script code itself (or potentially via the UI if supported), adjust the strategy() function parameters like initial_capital, default_qty_value, commission_value, slippage, etc., to match your account, broker fees, and risk settings. The user preferences provided (e.g., 1000 initial capital, 0.1% commission) are examples. Remember use_bar_magnifier is false by default in v1.17.
3. Configure Inputs (Settings Panel):
Set the Date Range for backtesting.
Crucially, configure the ⚙️ Strategy Inputs. Decide which signals should trigger entries and whether they are mandatory ("Must Be True"). Start simply, perhaps enabling only one or two signals initially, and test thoroughly. Remember the default long-only setting unless you modify the code.
Set up your 💰 Take Profit Settings, including TP levels, position size percentages for each TP, and the trailing stop parameters. Decide if you want to use the re-entry feature.
Decide whether to use the 📈 FRAMA Filter and configure its parameters if enabled.
Adjust visual elements (🚀 Signal Line, 📊 Histogram, 💡 Other) as needed for clarity.
4. Backtest: Use the Strategy Tester panel in TradingView. Analyze the performance metrics (Net Profit, Max Drawdown, Profit Factor, Win Rate, Trade List) across different assets, timeframes, and setting configurations. Pay close attention to how different "Strategy Inputs" combinations perform.
5. Refine: Based on backtesting results, adjust the input settings, TP/SL strategy, and signal combinations to optimize performance for your chosen market and timeframe, while being mindful of overfitting.
6. Automation (Optional): If using 3Commas or a similar platform:
Enter your 3C Email Token and 3C Bot ID in the settings.
Create alerts in TradingView (right-click on the chart or use the Alert panel).
Set the Condition to "QuantJazz Turbine Trader BETA v1.17".
In the "Message" box, paste the corresponding placeholder, which will pass the message in JSON from our custom code to TradingView to pass through your webhook: {{strategy.order.alert_message}}.
In the next tab, configure the Webhook URL provided by your automation platform. Put a Whale sound, while you're at it! 🐳
When an alert triggers, TradingView will send the pre-formatted JSON message from the strategy code to your webhook URL.
Final Notes
The QuantJazz Turbine Trader BETA v1.17 offers a wide range of customizable signals and strategy logic. Its effectiveness heavily depends on proper configuration and thorough backtesting specific to the traded asset and timeframe. Start with the default settings, understand each component, and methodically test different combinations of signals and parameters. Remember the inherent risks of trading and never invest capital you cannot afford to lose.

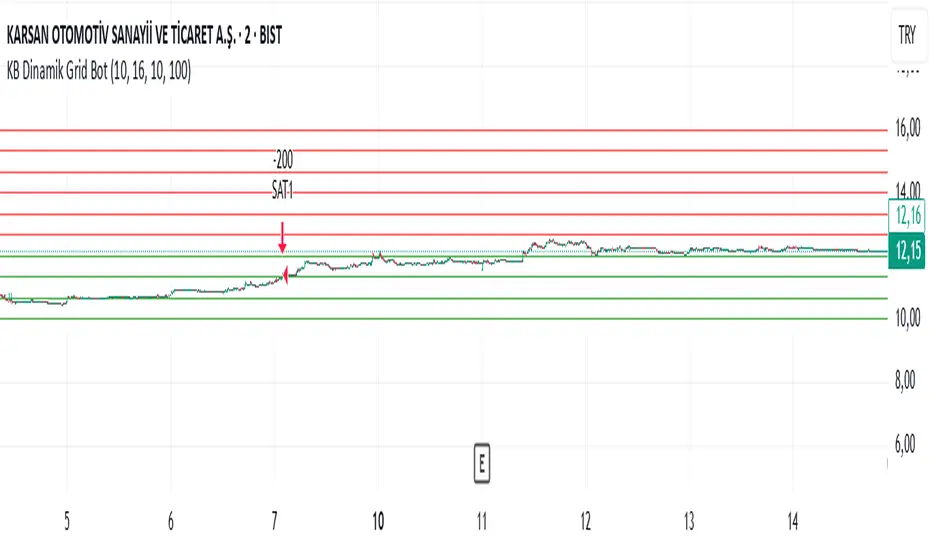
KB Dinamik Grid Bot V8 TrailingThis Pine Script code aims to create a "Dynamic Grid Trading Bot" and perform automatic trading between price ranges. Let's break it down into sections to better understand its functions:
1. Settings and User Inputs
The user can specify the following parameters for the bot:
Lower and Upper Price Limit: Determines the price range where the grid levels are defined.
Number of Grid Lines: Defines how many levels the grid will consist of.
Transaction Amount: Specifies the trading volume for each trading transaction.
Start Date: The date when the bot will start trading.
Price Step (priceStep): Specifies specific steps after the comma to adjust the grid levels more precisely.
Trailing: A feature that activates dynamic selling by following price movements.
2. Calculating Grid Levels
Grid levels: Divides the specified price range into user-defined levels and rounds each level with priceStep.
Lines and labels: Lines and labels are created to visually represent grid levels.
3. Buying and Selling Logic
Buying Transaction: When the price approaches a lower grid level (as much as the offset) and the position is empty, a purchase is made.
Trailing Selling: If Trailing is active, a sale is made when the price passes the specified "trailing step" level.
Normal Selling: If Trailing is not active, a sale is made when the price approaches an upper grid level.
4. Profit and Statistics Tracking
The bot tracks the profit-loss status per transaction and in total.
The number of purchases and sales and net profit information are calculated from the start date.
5. Table Display
The bot places statistical data in a table:
Number of purchases and sales.
Starting date.
Total number of transactions.
Net profit.
Amount of open positions.
6. Drawing and Tracking
Each price movement is updated and the color of the grid lines (green or red) is changed depending on the price's status relative to the level.
This code is a strategy that aims to make a profit by continuously buying and selling in the event of price fluctuations within a range. The "Trailing" feature allows you to keep your profits when the price moves upwards. Net profit, open positions and other statistics are displayed in the table.
Fractional Accumulation Distribution Strategy🔹 INTRODUCTION:
As traders and investors, we often find ourselves searching for ways to maximize our market positioning—trying to capture the best price, manage risk, and adapt to ever-changing volatility. Through years of working with a variety of traders and investors, a common theme emerged: the most successful market participants were those who accumulated positions strategically over time, rather than relying on one-off, rigid entry points. However, even the best of them struggled to consistently time their entries and exits for optimal results.
That's why I created the Fractional Accumulation/Distribution Strategy (FADS)—an adaptable solution designed to dynamically adjust position sizing and entry points based on changing market conditions, enabling both passive and active market participants to optimize their approach.
The FADS trading strategy combines volatility-based trend detection and adaptive position scaling to maximize profitability across varied market conditions. By using the price ranges from higher timeframes, FADS pinpoints extreme demand and supply zones with a high statistical probability of reversal, making it effective in both high and low volatility environments. By applying adjustable threshold settings, users can focus on meaningful price movements to reduce unnecessary trades. Adaptive position scaling further enhances this approach by adjusting position sizes based on entry level distances, allowing for strategic position building that balances risk and reward in uncertain markets. This systematic scaling begins with smaller positions, expanding as the trend solidifies, creating a refined, robust trading experience.
🔹 FEATURES:
Multi-Timeframe Volatility-Based Trend Detection
Accumulation/Distribution Level Filter
Customizable Period for Highest/Lowest Prices Capture
Adjustable Sensitivity & Frequency in Positioning
Broad control settings of Strategy
Adaptive Position Scaling
🔹 SETTINGS:
Volatility : Determines trading range based on market volatility . Highest range value number of periods.
Factor : Adjusts the width of the Accumulation & Distribution bands separately. The Level Filter feature offers customizable triggering bands, allowing users to fine-tune the initiation point for the Accumulation/Distribution sequence. This flexibility enables traders to align entries more precisely with market conditions, setting optimal thresholds for initiating trade chains, whether in accumulating positions during uptrends or distributing in downtrends.
Lowest : Choose the price source (e.g., Close, Low). Number of bars considered when determining the lowest price level. Selecting the checkbox generate a signal when the price crosses below the previous lowest value for calculating the lowest value used for trade signals.
Highest : Choose the price source (e.g., Close, High). Number of bars considered when determining the highest price levels. Selecting the checkbox generate a signal when the price crosses above the previous highest value for calculating the highest value used for trade signals.
Accumulation Spread : Adjusts the buying frequency sensitivity by setting the distance between entries based on personal risk tolerance. Larger values for less frequent buys; smaller values for more frequent buys.
Distribution Spread : Adjusts the selling frequency sensitivity by setting the distance between exits based on reward preference. Larger values for less frequent sells; smaller values for more frequent sells.
Percentage of Capital Allocation : Sets the portion of total capital used for the initial trade in a strategy. It sets the scale for subsequent trades during accumulation phase.
🔹 APPLICATIONS:
❖ Accumulation and Distribution Phases
Early entries are avoided by initiating accumulation only after a trend reversal is confirmed and price breaks below long-term range.
Position sizes are determined by the distance between consecutive trades, smaller distance results in smaller position sizes and vice versa.
Average position cost is reduced by accumulating larger positions at the lower prices, potentially resulting in improved profitability.
Early exits are avoided by initiating distribution only after trend reversal is confirmed and price breaks above long-term range.
The pace of distribution can be tracked by the violet line that represents average positions during distribution phase
❖ Use Cases (Different than default setting input is used for illustration purposes)
If the starting point of accumulation starts too high for the risk preference, Accumulation Level Filter can be lowered by increasing the 🟢 threshold Factor.
If the starting point of distribution is too low for the reward preference, the Distribution Level Filter can be raised by increasing the 🔴 threshold Factor.
In lower timeframes, positions during the accumulation phase could be purchased at higher levels relative to prior entry positions. To optimize for this, consider extending the period used to capture the lowest prices. Similarly, during the distribution phase, increasing the period for identifying higher prices can improve accuracy.
🔹 Strategy Properties:
Adjusting properties within the script settings is recommended to align with specific accounts and trading platforms, ensuring realistic strategy results.
Balance (default): $100,000
Initial Order Size: 1% of the default balance
Commission: 0.1%
Slippage: 5 Ticks
Backtesting: Backtested using TradingView’s built-in strategy testing tool with default commission rates of 0.1% and slippage of 5 ticks. It reflects average market conditions for Apple Inc. (APPL) on 1-hour timeframe
Disclaimers: Commission and slippage varies with market conditions and brokerage policies. The assumed value may not represent all trading environments.
PAST PERFORMANCE DOESN’T GUARANTEE FUTURE RESULTS!
Disclaimer: Please remember that past performance may not be indicative of future results. Due to various factors, including changing market conditions, the strategy may no longer perform as well as in historical backtesting. This post and the script don’t provide any financial advice.
This invite-only script is being published as part of my commitment to developing tools that align with TradingView’s community standards. Access requests will be reviewed carefully after the script passes TradingView's moderation process.

Strategy without indicators v11. General Script Strategy
The objective of this strategy is to open buy or sell orders every new hour based on:
Whether the previous candle closed high (buy) or low (sell).
The presence of tops and bottoms to avoid opening orders at times of possible reversals.
The strategy also allows the user to set a date range (start date and end date) to calculate profit, loss, percentage of gain and percentage of loss only in that period.
2. Initial Settings and Parameters
Start Date and End Date: The start_date and end_date variables define the date range to account for profits and losses. These dates can be adjusted by the user to view results in specific periods.
3. Conditions for Order Entry
At each time change, the script checks the conditions for buying or selling, using the following variables and logic:
Detection of Bullish or Bearish Candle:
bullish_candle: True if the previous candle closed high.
bearish_candle: True if the previous candle closed lower.
Analysis of Tops and Bottoms:
To avoid opening orders close to tops and bottoms, the script uses the function find_top_and_bottom(period), which analyzes the last 500 candles and identifies the highest value (top) and the lowest value (bottom).
The variables current_top and current_bottom store these values.
next_top and next_bottom indicate whether the current candle is close to a top (prevents buying) or a bottom (prevents selling).
4. Opening Orders (Buy and Sell)
At each time change, the script checks the conditions to open buy or sell orders:
Condition for Sell:
The sell order is opened if the previous candle was bullish (bullish_candle) and is not close to a top (not next_top).
If there is an open buy order, it is closed before the new sell order.
Buy Condition:
The buy order is opened if the previous candle was bearish (bearish_candle) and is not near a bottom (not_near_bottom).
If there is an open sell order, it is closed before the new buy order.
5. Calculating Profit and Loss
The profit and loss calculation is only done within the configured date range (start_date and end_date):
Profit and Loss:
total_profit and total_loss accumulate the profit and loss values of all operations during the defined period.
percentage_gain and percentage_loss calculate the percentage of gain and loss in relation to the initial capital.
6. Displaying Results on the Chart
The script displays on the chart, next to the candles, the information on Total Profit, Total Loss, % Gain and % Loss:
Strategy Summary
Setting the Date Range: Allows you to set the period for calculating profit and loss.
Previous Candlestick Analysis: Decide whether to buy or sell based on the previous candlestick.
Preventing Entries at Tops and Bottoms: Avoids buying at tops and selling at bottoms to reduce false signals.
Result Calculation: Accumulates profits, losses and percentages within the configured date range.
Results Display on Chart: Displays the configured statistics directly on the chart, next to the candlesticks.
1. Estratégia Geral do Script
O objetivo dessa estratégia é abrir ordens de compra ou venda a cada nova hora com base em:
Se a vela anterior fechou em alta (compra) ou em baixa (venda).
A presença de topos e fundos para evitar abrir ordens em momentos de possíveis reversões.
A estratégia também permite que o usuário configure um intervalo de datas (data inicial e data final) para calcular o lucro, perda, percentual de ganho e percentual de perda apenas nesse período.
2. Configurações e Parâmetros Iniciais
Data Inicial e Data Final: As variáveis data_inicial e data_final definem o intervalo de datas para contabilizar os lucros e perdas. Essas datas podem ser ajustadas pelo usuário para visualizar resultados em períodos específicos.
3. Condições para Entrada de Ordens
A cada mudança de hora, o script verifica as condições de compra ou venda, usando as seguintes variáveis e lógicas:
Detecção de Vela de Alta ou Baixa:
vela_de_alta: Verdadeiro se a vela anterior fechou em alta.
vela_de_baixa: Verdadeiro se a vela anterior fechou em baixa.
Análise de Topos e Fundos:
Para evitar abrir ordens próximas de topos e fundos, o script utiliza a função find_top_and_bottom(periodo), que analisa as últimas 500 velas e identifica o valor mais alto (topo) e o valor mais baixo (fundo).
As variáveis topo_atual e fundo_atual armazenam esses valores.
topo_proximo e fundo_proximo indicam se a vela atual está perto de um topo (evita compra) ou de um fundo (evita venda).
4. Abertura de Ordens (Compra e Venda)
A cada mudança de hora, o script verifica as condições para abrir ordens de compra ou venda:
Condição para Venda:
A ordem de venda é aberta se a vela anterior foi de alta (vela_de_alta) e não está perto de um topo (not topo_proximo).
Se houver uma ordem de compra aberta, ela é fechada antes da nova ordem de venda.
Condição para Compra:
A ordem de compra é aberta se a vela anterior foi de baixa (vela_de_baixa) e não está perto de um fundo (not fundo_proximo).
Se houver uma ordem de venda aberta, ela é fechada antes da nova ordem de compra.
5. Cálculo de Lucros e Perdas
O cálculo de lucro e perda só é feito dentro do intervalo de datas configurado (data_inicial e data_final):
Lucro e Perda:
lucro_total e perca_total acumulam os valores de lucro e perda de todas as operações durante o período definido.
percentual_ganho e percentual_perca calculam o percentual de ganho e perda em relação ao capital inicial.
6. Exibição dos Resultados no Gráfico
O script exibe no gráfico, próximo das velas, as informações de Lucro Total, Perda Total, % de Ganho e % de Perda:
Resumo da Estratégia
Configuração de Intervalo de Datas: Permite configurar o período para cálculo do lucro e da perda.
Análise de Vela Anterior: Decide se a ordem é de compra ou venda com base na vela anterior.
Prevenção de Entradas em Topos e Fundos: Evita compras em topos e vendas em fundos para reduzir sinais falsos.
Cálculo de Resultados: Acumula lucros, perdas e percentuais dentro do período de datas configurado.
Exibição dos Resultados no Gráfico: Exibe as estatísticas configuradas diretamente no gráfico, próximo das velas.

Liquidity strategy tester [Influxum]This tool is based on the concept of liquidity. It includes 10 methods for identifying liquidity in the market. Although this tool is presented as a strategy, we see it more as a data-gathering instrument.
Warning: This indicator/strategy is not intended to generate profitable strategies. It is designed to identify potential market advantages and help with identifying effective entry points to capitalize on those advantages.
Once again, we have advanced the methods of effectively searching for liquidity in the market. With strategies, defined by various entry methods and risk management, you can find your edge in the market. This tool is backed by thorough testing and development, and we plan to continue improving it.
In its current form, it can also be used to test well-known ICT or Smart Money concepts. Using various methods, you can define market structure and identify areas where liquidity is located.
Fair Value Gaps - one of the entry signal options is fair value gaps, where an imbalance between buyers and sellers in the market can be expected.
Time and Price Theory - you can test this by setting liquidity from a specific session and testing entries as that liquidity is grabbed
Judas Swing - can be tested as a market reversal after a breakout during the first hours of trading.
Power of Three - accumulation can be observed as the market moving within a certain range, identified as cluster liquidity in our tool, manipulation occurs with the break of liquidity, and distribution is the direction of the entry.
🟪 Methods of Identifying Liquidity
Pivot Liquidity
This refers to liquidity formed by local extremes – the highest or lowest prices reached in the market over a certain period. The period is defined by a pivot number and determines how many candles before and after the high/low were higher/lower. Simply put, the pivot number represents the number of adjacent candles to the left and right, with a lower high for a pivot high and a higher low for a pivot low. The higher the number, the more significant the high/low is. Behind these local market extremes, we expect to find orders waiting for breakout as well as stop-losses.
Gann Swing
Similar to pivot liquidity, Gann swing identifies significant market points. However, instead of candle highs and lows, it focuses on the closing prices. A Gann swing is formed when a candle closes above (or below) several previous closes (the number is again defined by a strength parameter).
Percentage Change
Apart from ticks, percentages are also a key unit of market movement. In the search for liquidity, we monitor when a local high or low is formed. For liquidity defined by percentage change, a high must be a certain percentage higher than the last low to confirm a significant high. Similarly, a low must be a defined percentage away from the last significant high to confirm a new low. With the right percentage settings, you can eliminate market noise.
Session Range (3x)
Session range is a popular concept for finding liquidity, especially in smart money concepts (SMC). You can set up liquidity visualization for the Asian, London, or New York sessions – or even all three at once. This tool allows you to work with up to three sessions, so you can easily track how and if the market reacts to liquidity grabs during these sessions.
Tip for traders: If you want to see the reaction to liquidity grab during a specific session at a certain time (e.g., the well-known killzone), you can set the Trading session in this tool to the exact time where you want to look for potential entries.
Unfinished Auction
Based on order flow theory, an unfinished auction occurs when the market reverses sharply without filling all pending orders. In price action terms, this can be seen as two candles at a local high or low with very similar or identical highs/lows. The maximum difference between these values is defined as Tolerance, with the default setting being 3 ticks. This setting is particularly useful for filtering out noise during slower market periods, like the Asian session.
Double Tops and Bottoms
A very popular concept not only from smart money concepts but also among price pattern traders is the double bottom and double top. This occurs when the market stops and reverses at a certain price twice in a row. In the tool, you can set how many candles apart these bottoms/tops can be by adjusting the Length parameter. According to some theories, double bottoms are more effective when there is a significant peak between the two bottoms. You can set this in the tool as the Swing value, which defines how large the movement (expressed in ticks) must be between the two peaks/bottoms. The final parameter you can adjust is Tolerance, which defines the possible price difference between the two peaks/bottoms, also expressed in ticks.
Range or Cluster Liquidity
When the market stays within a certain price range, there’s a chance that breakout orders and stop-losses are accumulating outside of this range. Our tool defines ranges in two ways:
Candle balance calculates the average price within a candle (open, high, low, and close), and it defines consolidation when the centers of candles are within a certain distance from each other.
Overlap confirms consolidation when a candle overlaps with the previous one by a set percentage.
Daily, Weekly, and Monthly Highs or Lows
These options simply define liquidity as the previous day’s, week’s, or month’s highs or lows.
Visual Settings
You can easily adjust how liquidity is displayed on the chart, choosing line style, color, and thickness. To display only uncollected liquidity, select "Delete grabbed liquidity."
Liquidity Duration
This setting allows you to control how long liquidity areas remain valid. You can cancel liquidity at the end of the day, the second day, or after a specific number of candles.
🟪 Strategy
Now we come to the part of working with strategies.
Max # of bars after liquidity grab – This parameter allows you to define how many candles you can search for entry signals from the moment liquidity is grabbed. If you are using engulfing as an entry signal, which consists of 2 candles, keep in mind that this number must be at least 2. In general, if you want to test a quick and sharp reaction, set this number as low as possible. If you want to wait for a structural change after the liquidity grab, which may require more candles, set the number a bit higher.
🟪 Strategy - entries
In this section, we define the signals or situations where we can enter the market after liquidity has been taken out.
Liquidity grab - This setup triggers a trade immediately after liquidity is grabbed, meaning the trade opens as the next candle forms.
Close below, close above - This refers to situations where the price closes below liquidity, but then reverses and closes above liquidity again, suggesting the liquidity grab was a false breakout.
Over bar - This occurs when the entire candle (high and low) passes beyond the liquidity level but then experiences a pullback.
Engulfing - A popular price action pattern that is included in this tool.
2HL - weak, medium, strong - A variation of a popular candlestick pattern.
Strong bar - A strong reactionary candle that forms after a liquidity grab. If liquidity is grabbed at a low, this would be a strong long candle that closes near its high and is significantly larger compared to typical volatility.
Naked bar - A candlestick pattern we’ve tested that serves as a good confirmation of market movement.
FVG (Fair Value Gap) - A currently popular concept. This is the only signal with additional settings. “Pending FVG order valid” means if a fair value gap forms after a liquidity grab, a limit order is placed, which remains valid for a set number of candles. “FVG minimal tick size” allows you to filter based on the gap size, measured in ticks. “GAP entry model” lets you decide whether to place the limit order at the gap close or its edge.
🟪 Strategy - General
Long, short - You can choose whether to focus on long or short trades. It’s interesting to see how long and short trades yield different results across various markets.
Pyramiding - By default, the tool opens only one trade at a time. If a new signal arises while a trade is open, it won’t enter another position unless the pyramiding box is checked. You also need to set the maximum number of open trades in the Properties.
Position size - Simply set the size of the traded position.
🟪 Strategy - Time
In this section, you can set time parameters for the strategy being tested.
Test since year - As the name implies, you can limit the testing to start from a specific year.
Trading session - Define the trading session during which you want to test entries. You can also visualize the background (BG) for confirmation.
Exclude session - You can set a session period during which you prefer not to search for trades. For example, when the New York session opens, volatility can sharply increase, potentially reducing the long-term success rate of the tested setup.
🟪 Strategy - Exits
This section lets you define risk management rules.
PT & SL - Set the profit target (PT) and stop loss (SL) here.
Lowest/highest since grab - This option sets the stop loss at the lowest point after a liquidity grab at a low or at the highest point after a liquidity grab at a high. Since markets usually overshoot during liquidity grabs, it’s good practice to place the stop loss at the furthest point after the grab. You can also set your risk-reward ratio (RRR) here. A value of 1 sets an RRR of 1:1, 2 means 2:1, and so on.
Lowest/highest last # bars - Similar to the previous option, but instead of finding the extreme after a liquidity grab, it identifies the furthest point within the last number of candles. You can set how far back to look using the # bars field (for an engulfing pattern, 2 is optimal since it’s made of two candles, and the stop loss can be placed at the edge of the engulfing pattern). The RRR setting works the same way as in the previous option.
Other side liquidity grab - If this option is checked, the trade will exit when liquidity is grabbed on the opposite side (i.e., if you entered on a liquidity grab at a low, the trade will exit when liquidity is grabbed at a high).
Exit after # bars - A popular exit strategy where you close the position after a set number of candles.
Exit after # bars in profit - This option exits the trade once the position is profitable for a certain number of consecutive candles. For example, if set to 5, the position will close when 5 consecutive candles are profitable. You can also set a maximum number of candles (in the max field), ensuring the trade is closed after a certain time even if the profit condition hasn’t been met.
🟪 Alerts
Alerts are a key tool for traders to ensure they don’t miss trading opportunities. They also allow traders to manage their time effectively. Who would want to sit in front of the computer all day waiting for a trading opportunity when they could be attending to other matters? In our tool, you currently have two options for receiving alerts:
Liquidity grabs alert – if you enable this feature and set an alert, the alert will be triggered every time a candle on the current timeframe closes and intersects with the displayed liquidity line.
Entry signals alert – this feature triggers an alert when a signal for entry is generated based on the option you’ve selected in the Entry type. It’s an ideal way to be notified only when a trading opportunity appears according to your predefined rules.

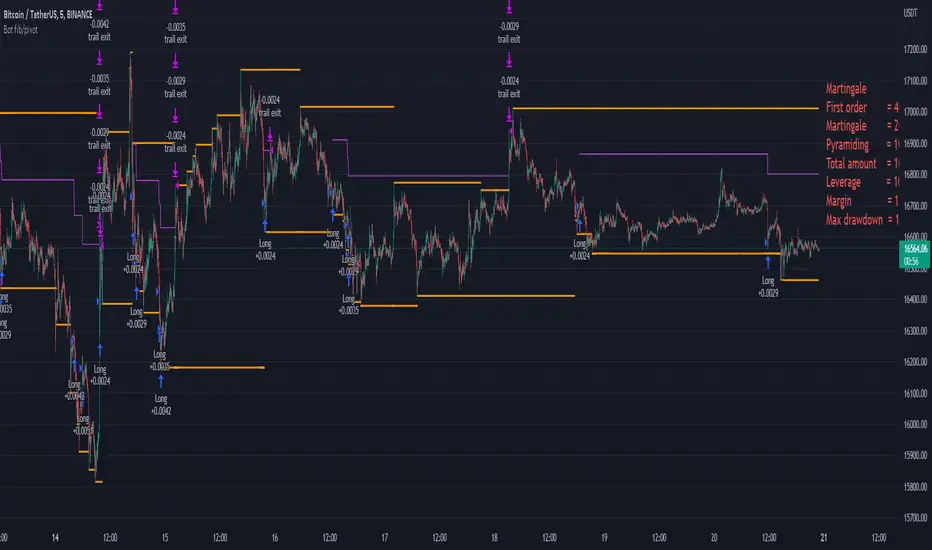
Bot fib/pivot Hello, friends!
This strategy is based on the fibonacci level you choose in the setup and possible pivot points under the control of Williams’ Percent Range.
Williams' Percent Range is a dynamic indicator that detects overbought/oversold conditions.
When the possible reversal points coincide with the fibonacci level, and the high or low points according to Williams also coincide, then an entry occurs.
One of the oldest and most reliable trading tools are widely used support and resistance levels.
In this strategy, we are trying to find these reversal levels based on fibonacci.
//LOGIC ENTRY SETTINGS
Deviation-deviation from the pivot point, the lower this figure, the more entries. The yellow lines on the chart are pivot points.
Fibonacci lvl-fibonacci level, from which the entry will occur, provided that other conditions match
Highest lookback-The setting, which refers to Williams' Percent Range , looks at how many candles ago, was high or low. The smaller the number, the larger, but less accurate inputs.
//AMOUNT(USDT) FIRST ORDER AND > % NEXT
-Martingale first order (the amount of the entrance to the usdt) / next order (Increase of each subsequent order as a percentage)
//EXIT SETTINGS (%, RSI)
-Use RSI for close position? (the position will not be closed if it is in the red, even if the RSI conditions worked)
-Use % for exit? Exit immediately upon reaching the specified percentage
-Use trailing? When the checkbox is checked, the position will be exited by trailing.
Activation trail,after?- When the specified percentage is reached, trailing is activated!
Stop_trail,%- if the last candle falls from the high (after the trailing is activated), the position will be exited.
For example:
We entered the purchase at 100 per asset, activation costs 10, and stop is 2.
the price reached 110, there was an activation, after that it went up to 120, and from the high of the last candle, a 2% drop occurs and the trade is exited.
PS:The default value is 1%, what does this give us? if there is a sharp increase, then we take away all the movement
Use only long?
Allow long?- Only long trades will be displayed
Allow short? Only short trades will be displayed
Allo reverse? Upon receipt of a return signal, the opposite position will be closed.
//MARTINGALE GRID
If there is a check mark in the line "Use martingale and grid?"
then the grid will be active
If there is a check mark in the "Limit each next entry,%?" then, even if the entry from the bot logic is triggered, and the price does not fall by the specified percentage, then there will be no entry!
If there is a check mark in the "Grid,%" column, then purchases with martingale support will be added with a decrease by the specified percentage!
PS: "Grid" always starts anew, as the input from logic triggered!
//FILTER SETTINGS
1) Use filter oscillator? (The filter uses 7 averaged oscillators)
Period-the period for which you will be billing
Upper line-Short entry border.
(if 40, then there will be no entry until it reaches)
Lower line-Long entry border.
(20 until below 20 no entry)
2)Use filter range?
Filter type-moving average selection
Bars back-offset speed based on number of last bars
Period-period to calculate
3)Use filter supertrend?
Supertrend filter with multitimeframe
// How do filters work 2 and 3?
Filters can work either one by one or together.
A trade is entered when conditions from the logic and filters in the red zone are triggered, when there are no entries in the green zone.
//DATA RANGE:
-Testing results for any period of time
//PIRAMIDING
-Also in the settings there is a pyramid of order, keep this in mind. Make a deal for a small part of the deposit, and not for all the money at once!
PS: to use martingale, you need to write in the hook messages:
"amount": "{{strategy.order.contracts}}" (purchases will be in the amount of coins equivalent to USDT)
The default settings for TF are 1 minute, 10 inputs.
You can choose your settings for any TF, but look at different coins to make sure you have good statistics
Multi-Mode Grid StrategyGrid Strategy (SIMPLE)
█ Overview
This script is a system trading tool designed to generate cash flow from market volatility without relying on short-term directional predictions. It operates on the principle of Grid Trading , creating a mesh of buy and sell orders within a user-defined price range.
The strategy automates the process of "buying the dip" and "selling the bounce" repeatedly. It is most effective in sideways markets or during accumulation phases where the price oscillates within a specific channel.
█ TRADING MINDSET & SETUP GUIDE
To use this tool effectively, you must shift your perspective from "Sniper" (trying to hit the perfect entry) to "Manager" (managing a zone). Here is the required mindset for setting up this strategy:
Shift from Prediction to Range Definition
Don't ask: "Will the price go up or down tomorrow?"
Ask instead: "What is the price range the asset is unlikely to break out of in the coming weeks?"
Your primary job is to define the Grid Top Price (Ceiling) and Grid Bottom Price (Floor). As long as the price stays within this "Arena," the strategy will continue to execute trades.
Embrace Volatility as Fuel
For a trend follower, chop/sideways action is a nightmare. For a Grid Trader, it is fuel. Every time the price crosses a grid line down, it builds inventory. Every time it crosses back up, it realizes profit. You want the price to wiggle as much as possible within your defined boundaries.
Capital Allocation & Survivability
The biggest risk in grid trading is the price crashing below your Grid Bottom Price .
Mindset Check: Before launching, assume the price WILL drop to your bottom price immediately. Can your account handle that drawdown?
The script includes leverage and capital percentage inputs to help you size your position correctly. Never allocate 100% of your capital to a tight range without understanding the liquidation risk.
█ HOW IT WORKS
Grid Construction:
The script divides the space between your Upper Border and Lower Border into specific levels based on the Grid Quantity .
- Arithmetic: Equal spacing between lines (Standard).
- Geometric: Spacing based on mathematical ratios (useful for wider ranges).
Execution Logic:
- Entry: When price crosses below a grid line, a Long position is opened.
- Exit: When price bounces back up by a specific number of grid levels (defined by "Distance of TP"), the specific position is closed for a profit.
Time & Backtesting:
You can set specific Start and End Times . This allows you to backtest how the grid would have performed during specific historical volatility events before deploying it on live markets.
█ VISUALIZATION DASHBOARD
To keep you informed without cluttering the chart, the script features an information table at the bottom right:
Cash Out: Total realized profit booked into the account.
Open Position: How many grid levels are currently active (holding bags) vs. total levels.
Open Trade: The current floating P/L of held positions (Unrealized).
Max Drawdown: The deepest drawdown the strategy experienced during the test period.
RISK DISCLAIMER
Grid trading involves significant risk, particularly in strong trending markets that break out of your range against your position. This strategy does not use a stop-loss per trade; it relies on the user defining a safe "Bottom Price" and allocating capital accordingly. Past performance in backtesting does not guarantee future results. This script is a tool for execution and analysis, not financial advice.

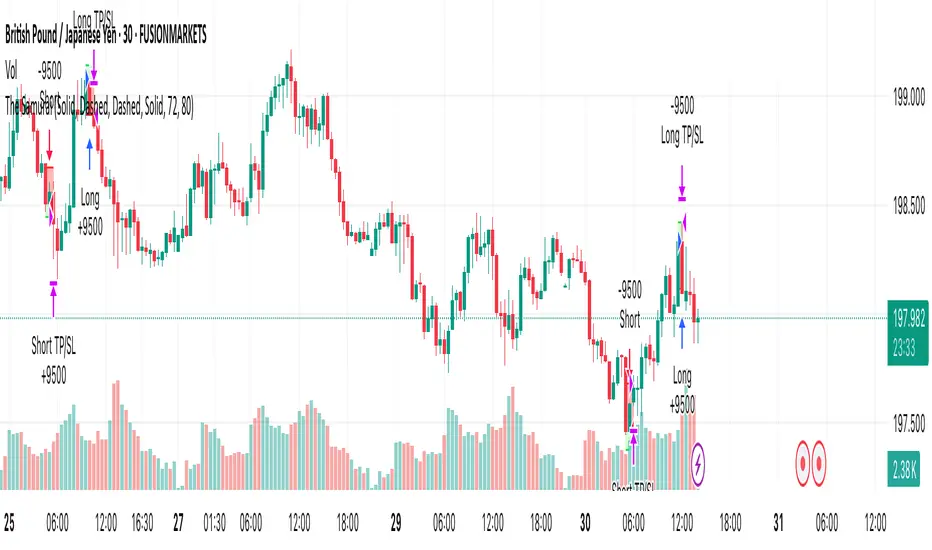
The SamuraiOverview
This strategy implements a session-based range breakout system specifically designed for GBP/JPY trading. The approach focuses on identifying key price ranges during specific market sessions and trading breakouts of these ranges during optimal trading windows. The strategy combines multi-timeframe analysis using 30-minute data with precise session timing to capture high-probability breakout moves.
Entry Logic
The strategy operates on a two-phase approach:
Range Collection Phase:
Monitors price action during a specified session window
Identifies session high and low levels
Only collects ranges on selected trading days
Trading Phase:
Long Entry: Price closes above the established session high
Short Entry: Price closes below the established session low
Entries only occur on valid trading days (day after range collection)
One trade per direction per session to prevent overtrading
Exit Conditions
Stop Loss: Set at a percentage of the session range below entry (long) or above entry (short)
Take Profit: Calculated using a Risk-Reward Ratio based on stop loss distance
Session Close: All positions are closed at the end of the trading window
Risk Management Features
Fixed risk-reward ratio of for consistent risk management
Stop loss calculated as percentage of session range for adaptive sizing
Visual risk/reward boxes display potential outcomes before entry
Daily session close protection prevents overnight exposure
Visual Features
Customizable Colors: Full control over line colors, styles, and box opacities
Risk/Reward Visualization: Color-coded boxes showing potential profit and loss zones
Take Profit Lines: TP level with different line styles for clarity
Stop Loss Line: Clear visual indication of risk level
Clean Interface: Streamlined settings focused on essential visual customization
Important Notes
Timeframe Dependency: Strategy uses 30-minute data regardless of chart timeframe for consistency
Session Timing: All times are in UTC - ensure proper timezone conversion for your location
Trading Days: Default setup trades Tuesday-Friday ranges (Monday-Thursday collection)
Single Position: Only one position per direction per session to maintain discipline
No Pyramiding: Strategy prevents position averaging to maintain clear risk parameters
Suggested Use
Recommended Pairs: Optimized for GBP/JPY but may work on other volatile pairs
Best Timeframes: Display on any timeframe (strategy uses 30m data internally)
Session Awareness: Most effective during high-volatility session transitions
Risk Management: Consider position sizing based on account risk tolerance
Market Conditions: Performs best in trending or breakout market environments
Backtesting Considerations
Strategy includes realistic entry/exit conditions based on closing prices
Visual elements help understand historical performance context
Built-in position management prevents unrealistic results
Session-based logic ensures trades align with actual market sessions
This strategy is designed for traders who prefer systematic, rule-based approaches to breakout trading with clear risk management parameters. The visual feedback helps in understanding market context and decision-making process.
Disclaimer: Past performance does not guarantee future results. Always test thoroughly on historical data and consider your risk tolerance before live trading.
Price Flip StrategyPrice Flip Strategy with User-Defined Ticker Max/Max
This strategy leverages an inverted price calculation based on user-defined maximum and minimum price levels over customizable lookback periods. It generates buy and sell signals by comparing the previous bar's original price to the inverted price, within a specified date range. The script plots key metrics, including ticker max/min, original and inverted prices, moving averages, and HLCC4 averages, with customizable visibility toggles and labels for easy analysis.
Key Features:
Customizable Inputs: Set lookback periods for ticker max/min, moving average length, and date range for signal generation.
Inverted Price Logic: Calculates an inverted price using ticker max/min to identify trading opportunities.
Flexible Visualization: Toggle visibility for plots (e.g., ticker max/min, prices, moving averages, HLCC4 averages) and last-bar labels with user-defined colors and sizes.
Trading Signals: Generates buy signals when the previous original price exceeds the inverted price, and sell signals when it falls below, with alerts for real-time notifications.
Labeling: Displays values on the last bar for all plotted metrics, aiding in quick reference.
How to Use:
Add to Chart: Apply the script to a TradingView chart via the Pine Editor.
Configure Settings:
Date Range: Set the start and end dates to define the active trading period.
Ticker Levels: Adjust the lookback periods for calculating ticker max and min (e.g., 100 bars for max, 100 for min).
Moving Averages: Set the length for exponential moving averages (default: 20 bars).
Plots and Labels: Enable/disable specific plots (e.g., Inverted Price, Original HLCC4) and customize label colors/sizes for clarity.
Interpret Signals:
Buy Signal: Triggered when the previous close price is above the inverted price; marked with an upward label.
Sell Signal: Triggered when the previous close price is below the inverted price; marked with a downward label.
Set Alerts: Use the built-in alert conditions to receive notifications for buy/sell signals.
Analyze Plots: Review plotted lines (e.g., ticker max/min, HLCC4 averages) and last-bar labels to assess price behavior.
Tips:
Use in trending markets by enabling ticker max for uptrends or ticker min for downtrends, as indicated in tooltips.
Adjust the label offset to prevent overlapping text on the last bar.
Test the strategy on a demo account to optimize lookback periods and moving average settings for your asset.
Disclaimer: This script is for educational purposes and should be tested thoroughly before use in live trading. Past performance is not indicative of future results.

iD EMARSI on ChartSCRIPT OVERVIEW
The EMARSI indicator is an advanced technical analysis tool that maps RSI values directly onto price charts. With adaptive scaling capabilities, it provides a unique visualization of momentum that flows naturally with price action, making it particularly valuable for FOREX and low-priced securities trading.
KEY FEATURES
1 PRICE MAPPED RSI VISUALIZATION
Unlike traditional RSI that displays in a separate window, EMARSI plots the RSI directly on the price chart, creating a flowing line that identifies momentum shifts within the context of price action:
// Map RSI to price chart with better scaling
mappedRsi = useAdaptiveScaling ?
median + ((rsi - 50) / 50 * (pQH - pQL) / 2 * math.min(1.0, 1/scalingFactor)) :
down == pQL ? pQH : up == pQL ? pQL : median - (median / (1 + up / down))
2 ADAPTIVE SCALING SYSTEM
The script features an intelligent scaling system that automatically adjusts to different market conditions and price levels:
// Calculate adaptive scaling factor based on selected method
scalingFactor = if scalingMethod == "ATR-Based"
math.min(maxScalingFactor, math.max(1.0, minTickSize / (atrValue/avgPrice)))
else if scalingMethod == "Price-Based"
math.min(maxScalingFactor, math.max(1.0, math.sqrt(100 / math.max(avgPrice, 0.01))))
else // Volume-Based
math.min(maxScalingFactor, math.max(1.0, math.sqrt(1000000 / math.max(volume, 100))))
3 MODIFIED RSI CALCULATION
EMARSI uses a specially formulated RSI calculation that works with an adaptive base value to maintain consistency across different price ranges:
// Adaptive RSI Base based on price levels to improve flow
adaptiveRsiBase = useAdaptiveScaling ? rsiBase * scalingFactor : rsiBase
// Calculate RSI components with adaptivity
up = ta.rma(math.max(ta.change(rsiSourceInput), adaptiveRsiBase), emaSlowLength)
down = ta.rma(-math.min(ta.change(rsiSourceInput), adaptiveRsiBase), rsiLengthInput)
// Improved RSI calculation with value constraint
rsi = down == 0 ? 100 : up == 0 ? 0 : 100 - (100 / (1 + up / down))
4 MOVING AVERAGE CROSSOVER SYSTEM
The indicator creates a smooth moving average of the RSI line, enabling a crossover system that generates trading signals:
// Calculate MA of mapped RSI
rsiMA = ma(mappedRsi, emaSlowLength, maTypeInput)
// Strategy entries
if ta.crossover(mappedRsi, rsiMA)
strategy.entry("RSI Long", strategy.long)
if ta.crossunder(mappedRsi, rsiMA)
strategy.entry("RSI Short", strategy.short)
5 VISUAL REFERENCE FRAMEWORK
The script includes visual guides that help interpret the RSI movement within the context of recent price action:
// Calculate pivot high and low
pQH = ta.highest(high, hlLen)
pQL = ta.lowest(low, hlLen)
median = (pQH + pQL) / 2
// Plotting
plot(pQH, "Pivot High", color=color.rgb(82, 228, 102, 90))
plot(pQL, "Pivot Low", color=color.rgb(231, 65, 65, 90))
med = plot(median, style=plot.style_steplinebr, linewidth=1, color=color.rgb(238, 101, 59, 90))
6 DYNAMIC COLOR SYSTEM
The indicator uses color fills to clearly visualize the relationship between the RSI and its moving average:
// Color fills based on RSI vs MA
colUp = mappedRsi > rsiMA ? input.color(color.rgb(128, 255, 0), '', group= 'RSI > EMA', inline= 'up') :
input.color(color.rgb(240, 9, 9, 95), '', group= 'RSI < EMA', inline= 'dn')
colDn = mappedRsi > rsiMA ? input.color(color.rgb(0, 230, 35, 95), '', group= 'RSI > EMA', inline= 'up') :
input.color(color.rgb(255, 47, 0), '', group= 'RSI < EMA', inline= 'dn')
fill(rsiPlot, emarsi, mappedRsi > rsiMA ? pQH : rsiMA, mappedRsi > rsiMA ? rsiMA : pQL, colUp, colDn)
7 REAL TIME PARAMETER MONITORING
A transparent information panel provides real-time feedback on the adaptive parameters being applied:
// Information display
var table infoPanel = table.new(position.top_right, 2, 3, bgcolor=color.rgb(0, 0, 0, 80))
if barstate.islast
table.cell(infoPanel, 0, 0, "Current Scaling Factor", text_color=color.white)
table.cell(infoPanel, 1, 0, str.tostring(scalingFactor, "#.###"), text_color=color.white)
table.cell(infoPanel, 0, 1, "Adaptive RSI Base", text_color=color.white)
table.cell(infoPanel, 1, 1, str.tostring(adaptiveRsiBase, "#.####"), text_color=color.white)
BENEFITS FOR TRADERS
INTUITIVE MOMENTUM VISUALIZATION
By mapping RSI directly onto the price chart, traders can immediately see the relationship between momentum and price without switching between different indicator windows.
ADAPTIVE TO ANY MARKET CONDITION
The three scaling methods (ATR-Based, Price-Based, and Volume-Based) ensure the indicator performs consistently across different market conditions, volatility regimes, and price levels.
PREVENTS EXTREME VALUES
The adaptive scaling system prevents the RSI from generating extreme values that exceed chart boundaries when trading low-priced securities or during high volatility periods.
CLEAR TRADING SIGNALS
The RSI and moving average crossover system provides clear entry signals that are visually reinforced through color changes, making it easy to identify potential trading opportunities.
SUITABLE FOR MULTIPLE TIMEFRAMES
The indicator works effectively across multiple timeframes, from intraday to daily charts, making it versatile for different trading styles and strategies.
TRANSPARENT PARAMETER ADJUSTMENT
The information panel provides real-time feedback on how the adaptive system is adjusting to current market conditions, helping traders understand why the indicator is behaving as it is.
CUSTOMIZABLE VISUALIZATION
Multiple visualization options including Bollinger Bands, different moving average types, and customizable colors allow traders to adapt the indicator to their personal preferences.
CONCLUSION
The EMARSI indicator represents a significant advancement in RSI visualization by directly mapping momentum onto price charts with adaptive scaling. This approach makes momentum shifts more intuitive to identify and helps prevent the scaling issues that commonly affect RSI-based indicators when applied to low-priced securities or volatile markets.

Maxima MAX1📌 Overview:
This strategy is a Simple Moving Average (SMA) Crossover system with an optional Relative Strength Index (RSI) filter for better trade confirmation. It allows traders to customize key parameters and backtest results within a specific date range.
📊 How It Works:
✅ Entry Conditions:
The closing price must be above both the Fast SMA and Slow SMA.
(Optional) RSI must be above a threshold (default: 50) for additional confirmation.
❌ Exit Condition:
The closing price drops below the Fast SMA, signaling an exit.
🔧 Customizable Inputs:
SMA Lengths: Adjust both Fast and Slow SMA values.
RSI Filter: Enable/disable RSI confirmation with a custom length & threshold.
Backtest Date Range: Choose a start and end date for testing historical performance.
🚀 Why Use This Strategy?
✔ Ideal for trend-following traders looking for momentum-based entries.
✔ Provides an additional RSI filter to reduce false signals.
✔ Helps traders refine their strategy by testing different parameters.
📢 How to Use:
1️⃣ Customize the SMA lengths, RSI settings, and date range.
2️⃣ Enable/Disable the RSI filter as needed.
3️⃣ Analyze historical performance and optimize for different markets.
⚠ Disclaimer:
This strategy is for educational purposes only. Always backtest thoroughly before using it in live trading.

[3Commas] HA & MAHA & MA
🔷What it does: This tool is designed to test a trend-following strategy using Heikin Ashi candles and moving averages. It enters trades after pullbacks, aiming to let profits run once the risk-to-reward ratio reaches 1:1 while securing the position.
🔷Who is it for: It is ideal for traders looking to compare final results using fixed versus dynamic take profits by adjusting parameters and trade direction—a concept applicable to most trading strategies.
🔷How does it work: We use moving averages to define the market trend, then wait for opposite Heikin Ashi candles to form against it. Once these candles reverse in favor of the trend, we enter the trade, using the last swing created by the pullback as the stop loss. By applying the breakeven ratio, we protect the trade and let it run, using the slower moving average as a trailing stop.
A buy signal is generated when:
The previous candle is bearish (ha_bear ), indicating a pullback.
The fast moving average (ma1) is above the slow moving average (ma2), confirming an uptrend.
The current candle is bullish (ha_bull), showing trend continuation.
The Heikin Ashi close is above the fast moving average (ma1), reinforcing the bullish bias.
The real price close is above the open (close > open), ensuring bullish momentum in actual price data.
The signal is confirmed on the closed candle (barstate.isconfirmed) to avoid premature signals.
dir is undefined (na(dir)), preventing repeated signals in the same direction.
A sell signal is generated when:
The previous candle is bullish (ha_bull ), indicating a temporary upward move before a potential reversal.
The fast moving average (ma1) is below the slow moving average (ma2), confirming a downtrend.
The current candle is bearish (ha_bear), showing trend continuation to the downside.
The Heikin Ashi close is below the fast moving average (ma1), reinforcing bearish pressure.
The real price close is below the open (close < open), confirming bearish momentum in actual price data.
The signal is confirmed after the candle closes (barstate.isconfirmed), avoiding premature entries.
dir is undefined (na(dir)), preventing consecutive signals in the same direction.
In simple terms, this setup looks for trend continuation after a pullback, confirming entries with both Heikin Ashi and real price action, supported by moving average alignment to avoid false signals.
If the price reaches a 1:1 risk-to-reward ratio, the stop will be moved to the entry point. However, if the slow moving average surpasses this level, it will become the new exit point, acting as a trailing stop
🔷Why It’s Unique
Easily visualizes the benefits of using risk-to-reward ratios when trading instead of fixed percentages.
Provides a simple and straightforward approach to trading, embracing the "keep it simple" concept.
Offers clear visualization of DCA Bot entry and exit points based on user preferences.
Includes an option to review the message format before sending signals to bots, with compatibility for multi-pair and futures contract pairs.
🔷 Considerations Before Using the Indicator
⚠️Very important: The indicator must be used on charts with real price data, such as Japanese candlesticks, line charts, etc. Do not use it on Heikin Ashi charts, as this may lead to unrealistic results.
🔸Since this is a trend-following strategy, use it on timeframes above 4 hours, where market noise is reduced and trends are clearer. Also, carefully review the statistics before using it, focusing on pairs that tend to have long periods of well-defined trends.
🔸Disadvantages:
False Signals in Ranges: Consolidating markets can generate unreliable signals.
Lagging Indicator: Being based on moving averages, it may react late to sudden price movements.
🔸Advantages:
Trend Focused: Simplifies the identification of trending markets.
Noise Reduction: Uses Heikin Ashi candles to identify trend continuation after pullbacks.
Broad Applicability: Suitable for forex, crypto, stocks, and commodities.
🔸The strategy provides a systematic way to analyze markets but does not guarantee successful outcomes. Use it as an additional tool rather than relying solely on an automated system.
Trading results depend on various factors, including market conditions, trader discipline, and risk management. Past performance does not ensure future success, so always approach the market cautiously.
🔸Risk Management: Define stop-loss levels, position sizes, and profit targets before entering any trade. Be prepared for potential losses and ensure your approach aligns with your overall trading plan.
🔷 STRATEGY PROPERTIES
Symbol: BINANCE:BTCUSDT (Spot).
Timeframe: 4h.
Test Period: All historical data available.
Initial Capital: 10000 USDT.
Order Size per Trade: 1% of Capital, you can use a higher value e.g. 5%, be cautious that the Max Drawdown does not exceed 10%, as it would indicate a very risky trading approach.
Commission: Binance commission 0.1%, adjust according to the exchange being used, lower numbers will generate unrealistic results. By using low values e.g. 5%, it allows us to adapt over time and check the functioning of the strategy.
Slippage: 5 ticks, for pairs with low liquidity or very large orders, this number should be increased as the order may not be filled at the desired level.
Margin for Long and Short Positions: 100%.
Indicator Settings: Default Configuration.
MA1 Length: 9.
MA2 Length: 18.
MA Calculations: EMA.
Take Profit Ratio: Disable. Ratio 1:4.
Breakeven Ratio: Enable, Ratio 1:1.
Strategy: Long & Short.
🔷 STRATEGY RESULTS
⚠️Remember, past results do not guarantee future performance.
Net Profit: +324.88 USDT (+3.25%).
Max Drawdown: -81.18 USDT (-0.78%).
Total Closed Trades: 672.
Percent Profitable: 35.57%.
Profit Factor: 1.347.
Average Trade: +0.48 USDT (+0.48%).
Average # Bars in Trades: 13.
🔷 HOW TO USE
🔸 Adjust Settings:
The default values—MA1 (9) and MA2 (18) with EMA calculation—generally work well. However, you can increase these values, such as 20 and 40, to better identify stronger trends.
🔸 Choose a Symbol that Typically Trends:
Select an asset that tends to form clear trends. Keep in mind that the Strategy Tester results may show poor performance for certain assets, making them less suitable for sending signals to bots.
🔸 Experiment with Ratios:
Test different take profit and breakeven ratios to compare various scenarios—especially to observe how the strategy performs when only the trade is protected.
🔸This is an example of how protecting the trade works: once the price moves in favor of the position with a 1:1 risk-to-reward ratio, the stop loss is moved to the entry price. If the Slow MA surpasses this level, it will act as a trailing stop, aiming to follow the trend and maximize potential gains.
🔸In contrast, in this example, for the same trade, if we set a take profit at a 1:3 risk-to-reward ratio—which is generally considered a good risk-reward relationship—we can see how a significant portion of the upward move is left on the table.
🔸Results Review:
It is important to check the Max Drawdown. This value should ideally not exceed 10% of your capital. Consider adjusting the trade size to ensure this threshold is not surpassed.
Remember to include the correct values for commission and slippage according to the symbol and exchange where you are conducting the tests. Otherwise, the results will not be realistic.
If you are satisfied with the results, you may consider automating your trades. However, it is strongly recommended to use a small amount of capital or a demo account to test proper execution before committing real funds.
🔸Create alerts to trigger the DCA Bot:
Verify Messages: Ensure the message matches the one specified by the DCA Bot.
Multi-Pair Configuration: For multi-pair setups, enable the option to add the symbol in the correct format.
Signal Settings: Enable whether you want to receive long or short signals (Entry | TP | SL), copy and paste the the messages for the DCA Bots configured.
Alert Setup:
When creating an alert, set the condition to the indicator and choose "alert() function call only.
Enter any desired Alert Name.
Open the Notifications tab, enable Webhook URL, and paste the Webhook URL.
For more details, refer to the section: "How to use TradingView Custom Signals".
Finalize Alerts: Click Create, you're done! Alerts will now be sent automatically in the correct format.
🔷 INDICATOR SETTINGS
MA 1: Fast MA Length
MA 2: Slow MA Length
MA Calc: MA's Calculations (SMA,EMA, RMA,WMA)
TP Ratio: This is the take profit ratio relative to the stop loss, where the trade will be closed in profit.
BE Ratio: This is the breakeven ratio relative to the stop loss, where the stop loss will be updated to breakeven or if the MA2 is greater than this level.
Strategy: Order Type direction in which trades are executed.
Use Custom Test Period: When enabled signals only works in the selected time window. If disabled it will use all historical data available on the chart.
Test Start and End: Once the Custom Test Period is enabled, here you select the start and end date that you want to analyze.
Check Messages: Enable the table to review the messages to be sent to the bot.
Entry | TP | SL: Enable this options to send Buy Entry, Take Profit (TP), and Stop Loss (SL) signals.
Deal Entry and Deal Exit : Copy and paste the message for the deal start signal and close order at Market Price of the DCA Bot. This is the message that will be sent with the alert to the Bot, you must verify that it is the same as the bot so that it can process properly so that it executes and starts the trade.
DCA Bot Multi-Pair: You must activate it if you want to use the signals in a DCA Bot Multi-pair in the text box you must enter (using the correct format) the symbol in which you are creating the alert, you can check the format of each symbol when you create the bot.
👨🏻💻💭 We hope this tool helps enhance your trading. Your feedback is invaluable, so feel free to share any suggestions for improvements or new features you'd like to see implemented.
__
The information and publications within the 3Commas TradingView account are not meant to be and do not constitute financial, investment, trading, or other types of advice or recommendations supplied or endorsed by 3Commas and any of the parties acting on behalf of 3Commas, including its employees, contractors, ambassadors, etc.

[3Commas] Alligator StrategyThe Alligator Strategy
🔷 What it does: This script implements the Alligator Strategy, a trend-following method created by Bill Williams. It uses three customizable moving averages (SMMAs or RMAs) "Jaws," "Teeth," and "Lips" to identify market trends and potential trade opportunities. Additionally, it includes built-in stop-loss and take-profit options for enhanced risk management.
🔷 Who is it for:
Trend Traders: Those who prefer trading in markets with clear directional movement.
Advanced Users: Traders who require customizable tools and dynamic risk management features.
Beginners: Accessible to those new to trading, thanks to its intuitive visual representation of trends and pre-configured settings.
Bot Users: Supports direct signal integration for bot automation, including entries, take-profits, and stop-losses.
🔷 How does it work: The Alligator Jaws, Teeth, and Lips are smoothed moving averages (SMA, EMA, RMA, or WMA) calculated based on the selected source price ( hl2 = (high+low)/2 by default). Their lengths and offsets are customizable:
Jaws: Length 21 , offset 13.
Teeth: Length 13, offset 8.
Lips: Length 8 , offset 5.
When the lines align and spread apart (e.g., Lips > Teeth > Jaws for an uptrend), the strategy identifies a trending market.
Entry Conditions:
Long Trades: Triggered when Close > Lips > Teeth > Jaws.
Short Trades: Triggered when Close < Lips < Teeth < Jaws.
🔷 Why it’s unique:
Customization: Flexible settings for moving average types and lengths to adapt to different market conditions and strategy tester configurations.
Built-in Filters: Trend filters that can reduce false signals in certain scenarios, making it more reliable for trending markets.
Take Profit and Stop Loss:
Configurable as either percentage-based or dynamic.
Stop-loss levels adjust dynamically using the Alligator lines.
Fast exit logic moves the stop-loss closer to the price when trades are in profit.
3Commas Bot Compatibility: Designed for automated trading, allowing traders to configure and execute the strategy seamlessly.
🔷 Considerations Before Using the Indicator
🔸Why the Forward Offset: By shifting the averages forward, the Alligator helps traders focus on established trends while filtering out short-term market noise.
The standard configurations of 13-8, 8-5, and 5-3 were selected based on Bill Williams’ studies of market behavior. However, these values can be adjusted to suit different market conditions:
Volatile Markets: Faster settings (e.g., 10-6, 6-4, 3-2) may provide earlier signals.
Less Volatile Markets: Slower settings (e.g., 21-13, 13-8, 8-5) can help avoid noise and reduce false signals.
🔸Best Timeframes to Use: The Alligator can be applied across all timeframes, but certain timeframes offer better reliability.
Higher Timeframes (H4, D1, W1): Ideal for identifying significant trends and for swing or position trading.
Lower Timeframes: Not recommended due to increased noise but may work for scalping with additional confirmation tools.
🔸Disadvantages of the Alligator Strategy:
Exhausted Entry Levels: High buying levels or low selling levels can lead to momentum exhaustion and potential pullbacks.
False Signals in Ranges: Consolidating markets can produce unreliable signals.
Lagging Indicator: As it is based on moving averages, it may delay reacting to sudden price changes.
🔸Advantages of the Alligator Strategy:
Trend Focused: Simplifies the identification of trending markets.
Noise Reduction: Forward shifts and smoothed averages help filter out short-term price fluctuations.
Broad Applicability: Suitable for forex, crypto, stocks, and commodities.
🔸Important Considerations:
While the Alligator Strategy provides a systematic way to analyze markets, it does not guarantee successful outcomes. Results in trading depend on multiple factors, including market conditions, trader discipline, and risk management. Past performance of the strategy does not ensure future success, and traders should always approach the market with caution.
Risk Management: Define stop-loss levels, position size, and profit targets before entering any trade. Be prepared for the possibility of losses and ensure that your approach aligns with your overall trading plan.
🔷 STRATEGY PROPERTIES
Symbol: BINANCE:BTCUSDT (Spot).
Timeframe: 1D (Daily Timeframe).
Test Period: All historical data available.
Initial Capital: 10000 USDT.
Order Size per Trade: 1% of Capital, you can use a higher value e.g. 5%, be cautious that the Max Drawdown does not exceed 10%, as it would indicate a very risky trading approach.
Commission: Binance commission 0.1%, adjust according to the exchange being used, lower numbers will generate unrealistic results. By using low values e.g. 5%, it allows us to adapt over time and check the functioning of the strategy.
Slippage: 5 ticks, for pairs with low liquidity or very large orders, this number should be increased as the order may not be filled at the desired level.
Margin for Long and Short Positions: 100%.
Indicator Settings: Default Configuration.
Alligator: Source hl2 | Calculation RMA | Jaw 21-13, Teeth 13-8, Lips 8-5.
Strategy: Long & Short.
Max Stop Loss per Trade: 10% of Trade Size.
Exit trades on opposite signal: Enable.
Alligator Stop Loss: Enable.
Alligator Fast Exit: Enable.
🔷 STRATEGY RESULTS
⚠️ Remember, past results do not guarantee future performance.
Net Profit: +355.68 USDT (+3.56%).
Total Closed Trades: 103.
Percent Profitable: 47.57%.
Profit Factor: 1.927.
Max Drawdown: -57.99 USDT (-0.56%).
Average Trade: +3.45 USDT (+3.41%).
Average # Bars in Trades: 16.
🔷 HOW TO USE
🔸Adjust the Alligator Settings:
The default values generally work well: Source hl2 | Calculation RMA | Jaw 21-13, Teeth 13-8, Lips 8-5. However, if you want to use it on timeframes smaller than 4H (4 hours), consider increasing the values to better filter market noise.
Please review the "Indicator Settings" section for configuration.
🔸Choose a Symbol that Typically Trends:
Select an asset that tends to create trends. However, the Strategy Tester results may display poor performance, making it less suitable for sending signals to bots.
🔸Add Trend Filters:
You can enable trend filters like MA and SuperTrend. By default, these are disabled as they are often unnecessary, but you can experiment with their configuration to see if they optimize the strategy's results.
Please review the "Indicator Settings" section for configuration.
🔸Enable Stop Loss Levels:
Activate Stop Loss features, such as Stop Loss % or Alligator Stop Loss. If both are enabled, the one closest to the price during the trade will be applied.
Please review the "Indicator Settings" section for configuration.
🔸Enable Take Profit Levels:
Activate Take Profit options, such as Take Profit % or Alligator Fast Exit. If both are enabled, the one that triggers first will be executed.
Please review the "Indicator Settings" section for configuration.
This is an example with the default settings and how Alligator Stop Loss and Alligator Fast Exit are activated:
In this example, we additionally enable the Take Profit at 10%. We can observe that the Alligator Stop Loss is the active one since it is closer to the price. When the price moves 10% in favor or against the trade, the position is closed. Although the Alligator Fast Exit is enabled, it does not activate because the trades are closed beforehand.
🔸Results Review:
It is important to check the Max Drawdown. This value should ideally not exceed 10% of your capital. Consider adjusting the trade size to ensure this threshold is not surpassed.
Remember to include the correct values for commission and slippage according to the symbol and exchange where you are conducting the tests. Otherwise, the results will not be realistic.
If you are satisfied with the results, you may consider automating your trades. However, it is strongly recommended to use a small amount of capital or a demo account to test proper execution before committing real funds.
🔸Create alerts to trigger the DCA Bot
Verify Messages: Ensure the message matches the one specified by the DCA Bot.
Multi-Pair Configuration: For multi-pair setups, enable the option to add the symbol in the correct format.
Signal Settings: Enable whether you want to receive long or short signals (Entry | TP | SL), copy and paste the the messages for the DCA Bots configured in 3Commas.
Alert Setup:
When creating an alert, set the condition to the indicator and choose "alert() function call only.
Enter any desired Alert Name.
Open the Notifications tab, enable Webhook URL, and paste the Webhook URL from 3Commas.
For more details, refer to the 3Commas section: "How to use TradingView Custom Signals.
Finalize Alerts: Click Create, you're done! Alerts will now be sent automatically in the correct format to 3Commas.
🔷 INDICATOR SETTINGS
🔸Alligator Settings
MA's source: Source price for Alligator moving averages.
MA's Type: Type of calculation for MA's.
Jaw and Offset: Jaw length and offset to the right.
Teeth and Offset: Teethlength and offset to the right.
Lips and Offset: Lips length and offset to the right.
🔸Alligator Style
Plot Alligator: Show Alligator Ribbon.
Plot MA's: Show Alligator MA's.
Colors: Main and Gradient Colors for Bullish Alligator, Berish Alligator, Neutral Alligator. For gradient colors it is recommended to use an opacity of 15.
🔸MA & SuperTrend Filters
MA & Plot: Activate MA Filter and Plot MA on the chart.
Long Entries: When activated, it will only execute entries if the price is above the MA
Short Entries: When activated, it will only execute entries if the price is below the MA.
Source: Source price for moving average calculations.
Length: Candles to be used by the MA calculations.
Type: Type of calculation for MA.
Timeframe: Here you can select a larger timeframe for the filter.
ST & Plot: Activate SuperTrend Filter and Plot SuperTrend on the chart.
Long Entries: When activated, it will only execute entries if the price is above the SuperTrend.
Short Entries: When activated, it will only execute entries if the price is below the SuperTrend.
Source: Source price for SuperTrend calculations.
Length: Candles to be used by the SuperTrend calculations.
Factor: ATR multiplier of the SuperTrend.
Timeframe: Here you can select a larger timeframe for the filter.
🔸Strategy Tester
Strategy: Order Type direction in which trades are executed.
Take Profit %: When activated, the entered value will be used as the Take Profit in percentage from the entry price level.
Stop Loss %: When activated, the entered value will be used as the Stop Loss in percentage from the entry price level. If Alligator Stop Loss is activated, the closest one to the price will be used.
Exit trades on opposite signal: This option closes the trade if the opposite condition is met. For instance, if we are in a long position and a sell signal is triggered, the long position will be closed, and a short position will be opened. The same applies inversely.
Alligator Stop Loss: In a long trade, the lower part of the Alligator indicator will be used as a dynamic stop loss. Similarly, in a short trade, the upper part of the indicator will be used.
Alligator Fast Exit: Its purpose is to attempt to protect movements in favor of the trade's direction. In the case of long trades, once the price and the upper part of the Alligator indicator are above the trade's entry price, the stop loss will be moved to the upper part. For short trades, once the price and the lower part of the Alligator indicator are below the trade's entry price, the stop loss will be moved to the lower part of the Alligator indicator.
Alligator Squeeze Entry: When activated, entries will only be executed if they meet the condition after a neutral zone of the Alligator indicator.
Alligator Squeeze Exit: When this option is activated, any open trades will be closed when the Alligator indicator enters a neutral mode.
Use Custom Test Period: When enabled signals only works in the selected time window. If disabled it will use all historical data available on the chart.
Test Start and End: Once the Custom Test Period is enabled, here you select the start and end date that you want to analyze.
🔸3Commas DCA Bot Signals
Check Messages: Enable the table to review the messages to be sent to the bot.
Entry | TP | SL: Enable this options to send Buy Entry, Take Profit (TP), and Stop Loss (SL) signals to 3Commas.
Deal Entry and Deal Exit : Copy and paste the message for the deal start signal and close order at Market Price of the DCA Bot you created in 3Commas. This is the message that will be sent with the alert to the Bot, you must verify that it is the same as the 3Commas bot so that it can process properly so that it executes and starts the trade.
DCA Bot Multi-Pair: You must activate it if you want to use the signals in a DCA Bot Multi-pair in the text box you must enter (using the 3Commas format) the symbol in which you are creating the alert, you can check the format of each symbol when you create the bot.
🔷 CONCLUSION
The Alligator Strategy is a valuable tool for identifying potential trends and improving decision-making. However, no trading strategy is foolproof. Careful consideration of market conditions, proper risk management, and personal trading goals are essential. Use the Alligator as part of a broader trading system, and remember that consistent learning and discipline are key to success in trading.
👨🏻💻💭 We hope this tool helps enhance your trading. Your feedback is invaluable, so feel free to share any suggestions for improvements or new features you'd like to see implemented.
____________________________________________________________________
The information and publications within the 3Commas TradingView account are not meant to be and do not constitute financial, investment, trading, or other types of advice or recommendations supplied or endorsed by 3Commas and any of the parties acting on behalf of 3Commas, including its employees, contractors, ambassadors, etc.

EMA SHIFT & PARALLEL [n_dot]BINANCE:ETHUSDT.P
This strategy was developed for CRYPTO FUTURES, (the settings for ETHUSDT.P) . I aimed for the strategy to function in a live environment, so I focused on making its operation realistic:
When determining the position, only 80% (adjustable) of the available cash is invested to reduce the risk of position liquidation.
I account for a 0.05% commission, typical on the futures market, for each entry and exit.
Concept:
I modified a simple, well-known method: the crossover of two exponential moving averages (FAST, SLOW) generates the entry and exit signals.
I enhanced the base idea as follows:
For the fast EMA, I incorporated a multiplier (offset) to filter out market noise and focus only on strong signals.
I use different EMAs for long and short entry points; both have their own FAST and SLOW EMAs and their own offset. For longs, the FAST EMA is adjusted downward (<1), while for shorts, it is adjusted upward (>1). Consequently, the signal is generated when the modified FAST EMA crosses the SLOW EMA.
Risk Management:
The position includes the following components:
Separate stop-losses for long and short positions.
Separate trailers for long and short positions.
The strategy operates so that the entry point is determined by the EMA crossover, while the exit is governed only by the Stop Loss or Trailer. Optionally, it can be set to close the position at the EMA recrossing ("Close at Signal").
Trailer Operation:
An entry percentage and offset are defined. The trailer activates when the price surpasses the entry price, calculated automatically by the system.
The trailer closes the position when the price drops by the offset percentage from the highest reached price.
Example for trailer:
Purchase Price = 100
Trailer Enter = 5% → Activation Price = 105 (triggers trailer if market price crosses it).
Trailer Offset = 2%
If the price rises to 110, the exit price becomes 107.8.
If the price goes to 120, the exit price becomes 117.6.
If the price falls below 117.6, the trailer closes the position.
Settings:
Source: Determines the market price reference.
End Close: Closes positions at the end of the simulation to avoid "shadow positions" and provide an objective result.
Lot proportional to free cash (%): Only a portion of free cash is invested to meet margin requirements.
Plot Short, Plot Long: Simplifies displayed information by toggling indicator lines on/off.
Long Position (toggleable):
EMA Fast ws: Window size for FAST EMA.
EMA Slow ws: Window size for SLOW EMA.
EMA Fast down shift: Adjustment factor for FAST EMA.
Stop Loss long (%): Percent drop to close the position.
Trailer enter (%): Percent above the purchase price to activate the trailer.
Trailer offset (%): Percent drop to close the position.
Short Position (toggleable):
EMA Fast ws: Window size for FAST EMA.
EMA Slow ws: Window size for SLOW EMA.
EMA Fast up shift: Adjustment factor for FAST EMA.
Stop Loss short (%): Percent rise to close the position.
Trailer enter (%): Percent below the purchase price to activate the trailer.
Trailer offset (%): Percent rise to close the position.
Operational Framework:
If in a long position and a short EMA crossover occurs, the strategy closes the long and opens a short (flip).
If in a short position and a long EMA crossover occurs, the strategy closes the short and opens a long (flip).
A position can close in three ways:
Stop Loss
Trailer
Signal Recrossing
If none are active, the position remains open until the end of the simulation.
Observations:
Shifts significantly deviating from 1 increase overfitting risk. Recommended ranges: 0.96–0.99 (long) and 1.01–1.05 (short).
The strategy's advantage lies in risk management, crucial in leveraged futures markets. It operates with relatively low DrawDown.
Recommendations:
Bullish Market: Higher entry threshold (e.g., 6%) and larger offset (e.g., 3%).
Volatile/Sideways Market: Tighter parameters (e.g., 3%, 1%).
The method is stable, and minor parameter adjustments do not significantly impact results, helping assess overfitting: if small changes lead to drastic differences, the strategy is over-optimized.
EMA Settings: Adjust FAST and SLOW EMAs based on the asset's volatility and cyclicality.
On the crypto market, especially in the Futures market, short time periods (1–15 minutes) often show significant noise, making patterns/repetitions hard to identify. I recommend setting the interval to at least 1 hour.
I hope this contributes to your success!

PercentX Trend Follower [Trendoscope]"Trendoscope" was born from our trading journey, where we first delved into the world of trend-following methods. Over time, we discovered the captivating allure of pattern analysis and the exciting challenges it presented, drawing us into exploring new horizons. However, our dedication to trend-following methodologies remains steadfast and continues to be an integral part of our core philosophy.
Here we are, introducing another effective trend-following methodology, employing straightforward yet powerful techniques.
🎲 Concepts
Introducing the innovative PercentX Oscillator , a representation of Bollinger PercentB and Keltner Percent K. This powerful tool offers users the flexibility to customize their PercentK oscillator, including options for the type of moving average and length.
The Oscillator Range is derived dynamically, utilizing two lengths - inner and outer. The inner length initiates the calculation of the oscillator's highest and lowest range, while the outer length is used for further calculations, involving either a moving average or the opposite side of the highest/lowest range, to obtain the oscillator ranges.
Next, the Oscillator Boundaries are derived by applying another round of high/low or moving average calculations on the oscillator range values.
Breakouts occur when the close price crosses above the upper boundary or below the lower boundary, signaling potential trading opportunities.
🎲 How to trade a breakout?
To reduce false signals, we employ a simple yet effective approach. Instead of executing market trades, we use stop orders on both sides at a certain distance from the current close price.
In case of an upper side breakout, a long stop order is placed at 1XATR above the close, and a short stop order is placed at 2XATR below the close. Conversely, for a lower side breakout, a short stop order is placed at 1XATR below the close, and a long stop order is placed at 2XATR above the ATR. As a trend following method, our first inclination is to trade on the side of breakout and not to find the reversals. Hence, higher multiplier is used for the direction opposite to the breakout.
The script provides users with the option to specify ATR multipliers for both sides.
Once a trade is initiated, the opposite side of the trade is converted into a stop-loss order. In the event of a breakout, the script will either place new long and short stop orders (if no existing trade is present) or update the stop-loss orders if a trade is currently running.
As a trend-following strategy, this script does not rely on specific targets or target levels. The objective is to run the trade as long as possible to generate profits. The trade is only stopped when the stop-loss is triggered, which is updated with every breakout to secure potential gains and minimize risks.
🎲 Default trade parameters
Script uses 10% equity per trade and up to 4 pyramid orders. Hence, the maximum invested amount at a time is 40% of the equity. Due to this, the comparison between buy and hold does not show a clear picture for the trade.
Feel free to explore and optimize the parameters further for your favorite symbols.
🎲 Visual representation
The blue line represents the PercentX Oscillator, orange and lime colored lines represent oscillator ranges. And red/green lines represent oscillator boundaries. Oscillator spikes upon breakout are highlighted with color fills.
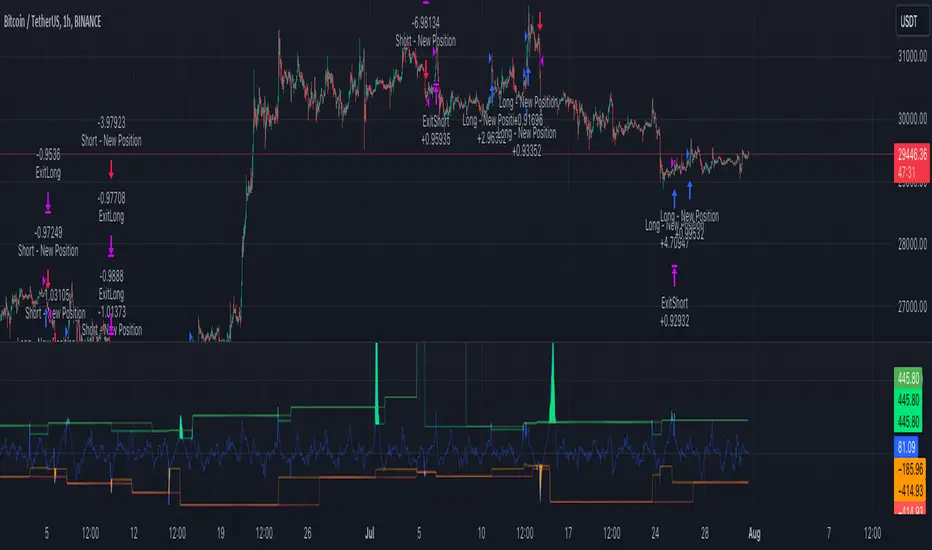
Ultimate Strategy Template (Advanced Edition)Hello traders
This script is an upgraded version of that one below
New features
- Upgraded to Pinescript version 5
- Added the exit SL/TP now in real-time
- Added text fields for the alerts - easier to send the commands to your trading bots
Step 1: Create your connector
Adapt your indicator with only 2 lines of code and then connect it to this strategy template.
For doing so:
1) Find in your indicator where are the conditions printing the long/buy and short/sell signals.
2) Create an additional plot as below
I'm giving an example with a Two moving averages cross.
Please replicate the same methodology for your indicator wether it's a MACD , ZigZag , Pivots , higher-highs, lower-lows or whatever indicator with clear buy and sell conditions.
//@version=5
indicator(title='Moving Average Cross', shorttitle='Moving Average Cross', overlay=true, precision=6, max_labels_count=500, max_lines_count=500)
type_ma1 = input.string(title='MA1 type', defval='SMA', options= )
length_ma1 = input(10, title=' MA1 length')
type_ma2 = input.string(title='MA2 type', defval='SMA', options= )
length_ma2 = input(100, title=' MA2 length')
// MA
f_ma(smoothing, src, length) =>
rma_1 = ta.rma(src, length)
sma_1 = ta.sma(src, length)
ema_1 = ta.ema(src, length)
iff_1 = smoothing == 'EMA' ? ema_1 : src
iff_2 = smoothing == 'SMA' ? sma_1 : iff_1
smoothing == 'RMA' ? rma_1 : iff_2
MA1 = f_ma(type_ma1, close, length_ma1)
MA2 = f_ma(type_ma2, close, length_ma2)
// buy and sell conditions
buy = ta.crossover(MA1, MA2)
sell = ta.crossunder(MA1, MA2)
plot(MA1, color=color.new(color.green, 0), title='Plot MA1', linewidth=3)
plot(MA2, color=color.new(color.red, 0), title='Plot MA2', linewidth=3)
plotshape(buy, title='LONG SIGNAL', style=shape.circle, location=location.belowbar, color=color.new(color.green, 0), size=size.normal)
plotshape(sell, title='SHORT SIGNAL', style=shape.circle, location=location.abovebar, color=color.new(color.red, 0), size=size.normal)
/////////////////////////// SIGNAL FOR STRATEGY /////////////////////////
Signal = buy ? 1 : sell ? -1 : 0
plot(Signal, title='🔌Connector🔌', display = display.data_window)
Basically, I identified my buy, sell conditions in the code and added this at the bottom of my indicator code
Signal = buy ? 1 : sell ? -1 : 0
plot(Signal, title="🔌Connector🔌", transp=100)
Important Notes
🔥 The Strategy Template expects the value to be exactly 1 for the bullish signal, and -1 for the bearish signal
Now you can connect your indicator to the Strategy Template using the method below or that one
Step 2: Connect the connector
1) Add your updated indicator to a TradingView chart
2) Add the Strategy Template as well to the SAME chart
3) Open the Strategy Template settings and in the Data Source field select your 🔌Connector🔌 (which comes from your indicator)
From then, you should start seeing the signals and plenty of other stuff on your chart
🔥 Note that whenever you'll update your indicator values, the strategy statistics and visual on your chart will update in real-time
Settings
- Color Candles: Color the candles based on the trade state ( bullish , bearish , neutral)
- Close positions at market at the end of each session: useful for everything but cryptocurrencies
- Session time ranges: Take the signals from a starting time to an ending time
- Close Direction: Choose to close only the longs, shorts, or both
- Date Filter: Take the signals from a starting date to an ending date
- Set the maximum losing streak length with an input
- Set the maximum winning streak length with an input
- Set the maximum consecutive days with a loss
- Set the maximum drawdown (in % of strategy equity)
- Set the maximum intraday loss in percentage
- Limit the number of trades per day
- Limit the number of trades per week
- Stop-loss: None or Percentage or Trailing Stop Percentage or ATR - I'll add shortly multiple options for the trailing stop loss
- Take-Profit: None or Percentage or ATR - I'll add also a trailing take profit
- Risk-Reward based on ATR multiple for the Stop-Loss and Take-Profit
Special Thanks
Special thanks to @JosKodify as I borrowed a few risk management snippets from his website: kodify.net
Best
Dave

Trend Breakout high/low #1What is the Trend Breakout high/low #1?
This script uses the high/low of each fixed time period as a conditional judgment, and when the high/low is broken as a buy/sell signal, trying to capture a trend.
How to use this script?
Start date and Stop date: You can choose the date of the test.
Trading cycle: Selected time period is used as the basis for determining the high/low and is limited to one trade only.
Stop range: This value will calculate the stop loss range. Set 50-100 that is better
Fixed mode: Fixed of lots per transaction.
---Additional Functions---
Reversal mode: Reversing the buy and sell signals, may be useful in certain situations.
Wighted mode: Increased profitability under certain conditions
When win & When lose:Judgment when there is an ongoing loss/profit as a condition, may be useful in certain situations.
Use closing price: Use the closing price breakout high/low as a conditional judgment, but this function sometimes fails.
Notes:
Trading cycle and your chart time period can't be set too close,that will result repainting.
Stop range can't be set too small,that will result repainting either.
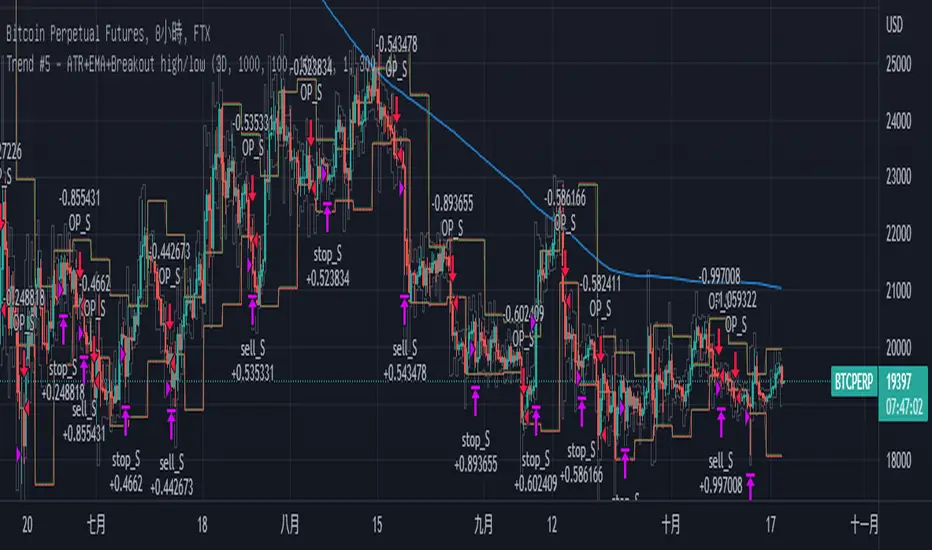
Combo Strategy 123 Reversal & CCI This is combo strategies for get a cumulative signal.
First strategy
This System was created from the Book "How I Tripled My Money In The
Futures Market" by Ulf Jensen, Page 183. This is reverse type of strategies.
The strategy buys at market, if close price is higher than the previous close
during 2 days and the meaning of 9-days Stochastic Slow Oscillator is lower than 50.
The strategy sells at market, if close price is lower than the previous close price
during 2 days and the meaning of 9-days Stochastic Fast Oscillator is higher than 50.
Second strategy
The Commodity Channel Index (CCI) is best used with markets that display cyclical or
seasonal characteristics, and is formulated to detect the beginning and ending of these
cycles by incorporating a moving average together with a divisor that reflects both possible
and actual trading ranges. The final index measures the deviation from normal, which indicates
major changes in market trend.
To put it simply, the Commodity Channel Index (CCI) value shows how the instrument is trading
relative to its mean (average) price. When the CCI value is high, it means that the prices are
high compared to the average price; when the CCI value is down, it means that the prices are low
compared to the average price. The CCI value usually does not fall outside the -300 to 300 range
and, in fact, is usually in the -100 to 100 range.
WARNING:
- For purpose educate only
- This script to change bars colors.

Default Strategy Inputs (Forex / Crypto)The code in this post contains a set of default strategy inputs I use in new projects / backtests in Tradingview.
Full code commentary is available on the Backtest-Rookies website. To comply with house rules, I cannot post the direct link here.
Features
Trade Direction: So that you can limit the strategy for long only, short only or trade in both directions. It is important to note that when you select “Long Only”, you will still see Short signals on the chart. However, they are only used to close a position rather than reverse it. This is the default behaviour for strategies. The same applies to “Short Only”.
Date Ranges: So that you can isolate backtesting to specific periods of interest such as bull or bear markets.
Sessions: So you can easily get an idea of the expected results during your own session. You may also notice that performance of the strategy varies depending on which session it is deployed in.
Some example stop losses: It is not an exhaustive list but it should be enough to provide some inspiration for different types of stops that you can experiment with.
Happy Scripting. I hope the community finds it useful.
CCI Strategy Reversed Backtest The Commodity Channel Index (CCI) is best used with markets that display cyclical or
seasonal characteristics, and is formulated to detect the beginning and ending of these
cycles by incorporating a moving average together with a divisor that reflects both possible
and actual trading ranges. The final index measures the deviation from normal, which indicates
major changes in market trend.
To put it simply, the Commodity Channel Index (CCI) value shows how the instrument is trading
relative to its mean (average) price. When the CCI value is high, it means that the prices are
high compared to the average price; when the CCI value is down, it means that the prices are low
compared to the average price. The CCI value usually does not fall outside the -300 to 300 range
and, in fact, is usually in the -100 to 100 range.
You can change long to short in the Input Settings
Please, use it only for learning or paper trading. Do not for real trading.
