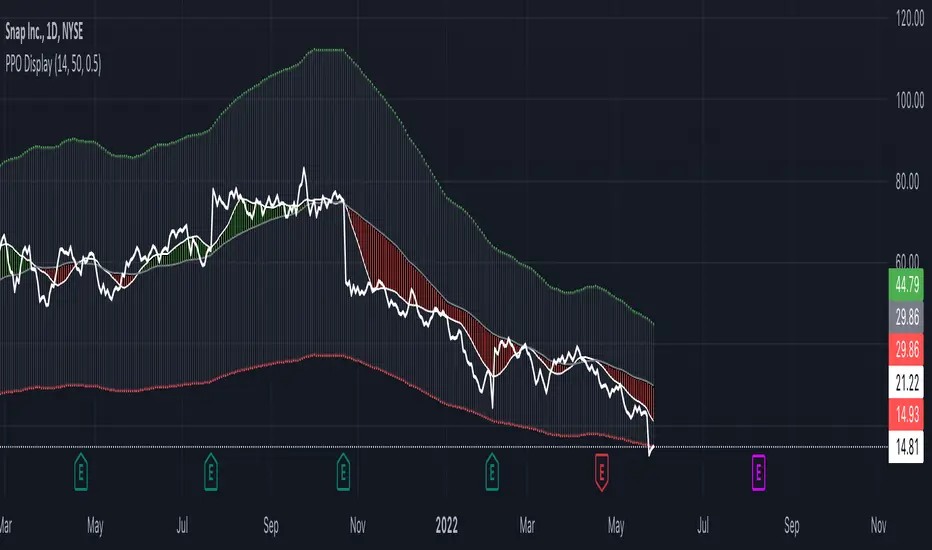
Relative Price Volume
Relative Price Volume is an indicator which shows anomalies between price and volume on a chart over a given period. The goal is to identify potential reversal and/consolidation areas for price as it relates to volume. It is a simple variation of a Volume at Price indicators. It can also be used to mark potential support and resistance lines on the chart as the areas it signals is where the price battles are waged.
Settings:
Period = length for which to calculate average candle body and average volume
Long Factor = relative size multiplier to determine if a candle is larger than average or if volume is higher than average
Short Factor = relative size multiplier to determine if a candle is smaller than average or if volume is lower than average
Anomaly Conditions
1. If a candle is larger than average and volume is lower than average, then this is an anomaly, and we should be on alert for a change in momentum.
2. if a candle is smaller than average and volume is higher than average, then this too is an anomaly and should put us on alert.
The indicator will draw a cross on the chart indicating the candle is that is flashing the warning that the run is done and a potential consolidation and/or reversal is pending. Used in conjunction with support and resistance levels this could signal a time to enter or exit a trade.
The default size factors considers a candle or volume:
1. Larger than average if it is 60% or more (.6) larger than average.
2. Smaller than average if it is 40% or less (.4) smaller than average.
Hope this helps! Happy trading!
Поиск скриптов по запросу "reversal"
ETS Price Deviation Reversal AreasThis indicator tracks the degree to which price moves away from an average and triggers potential direction changes based on standard deviation levels.
The reason I created this script is because I wanted to see how far price moved away from the moving average in a more clearly defined way than just saying "wow, price is pretty far away from the 9 EMA..." or whichever moving average you were looking at.
Typically when price moves "too far" away from the moving averages, it corrects itself, I think mainly because a lot of people say "wow, price is pretty far away from the 9 EMA..." and then enter a trade. This indicator tries to make it easier to see when that switches around, which could indicate that price will be reversing.
Of course the indicator is not a silver bullet, but I have found it pretty useful and I hope that you do too!
It also tries to avoid giving signals when prices are in a very small range. When the deviation bars contract, the indicator switches to only signal "breakout" type moves to try and limit whipsaw signals.
The smaller dots are spots that could indicate a potentially early reversal, and the larger dots show up a bit later when the reversal is a bit more established. There are also alerts that you can use if you want.
Change this code as you want to, but please let the community know and send me a message if you found something to share! Thanks!
[blackcat] L2 Reversal Labels StrategyLevel: 2
Background
There is a Chinese proverb that says: "The great way leads to simplicity". This indicator is the representative of this meaning. Through the processing of the most common MACD indicator data, it is possible to quickly determine the market price: whether the current price is at a historical high or low, whether a reversal will happen soon, etc. at a glance.
Function
This is the strategy version of the same indicator which performs screening and filtering through the fast and slow line data corresponding to the output of the standard MACD indicator, so as to realize the function of judging the top and bottom of the trend.
Inputs
N/A
Key Signal
Near Top --> Top is reached and reversal may happen soon. (red labels)
Near Bottom --> Bottom is reached and reversal may happen soon. (green labels)
Remarks
The backtest result is picked up and optimized for BTCUSD '2D' time frame, it does not work constantly well for any time frame. You need to combine other indicators for other trading pair and time frame.
You can add alerts for this version.
This is a Level 2 free and open source indicator.
Feedbacks are appreciated.
Simplified candlesticksSimplified candlesticks tracks sticks for their body and wick
- For Long bars sticks ( LS ) tracks and marks them on down trend as continuation and reversal if moves appositive direction.
- For largest wicks on ends marks as regular Doji
- For large wicks and medium body marks as possible consolidation
- For only bottom bigger wick as bears weakness if trend down and possible reversal if trend is up.
- For only upper bigger wick as bulls weakness if trend up and possible reversal if trend is down
[blackcat] L2 Reversal LabelsLevel: 2
Background
There is a Chinese proverb that says: "The great way leads to simplicity". This indicator is the representative of this meaning. Through the processing of the most common MACD indicator data, it is possible to quickly determine the market price: whether the current price is at a historical high or low, whether a reversal will happen soon, etc. at a glance.
Function
This indicator performs screening and filtering through the fast and slow line data corresponding to the output of the standard MACD indicator, so as to realize the function of judging the top and bottom of the trend.
Inputs
N/A
Key Signal
Near Top --> Top is reached and reversal may happen soon. (red labels)
Near Bottom --> Bottom is reached and reversal may happen soon. (green labels)
Remarks
This is a Level 2 free and open source indicator.
Feedbacks are appreciated.
Fear Of Missing Out grid of forex tradingAbstract
This script finds potential safe grids placing limit orders without fear of missing out.
This script computes grids according to power of 1.0025 .
You can reference those price levels for your trading.
Introduction
Grid trading is a popular trading method.
Traders plan several price levels as grids and repeat buying at lower grids and selling at higher grids.
Grids can be round number like multiple of 100 pips.
Grids can also be support and resistance according to price history.
Some traders may think they need to adjust grids to trade.
However, there are several problems in choosing grids.
One problem is rate of change is related and therefore exponential. 20 to 30 is different from 30 to 40.
Another interesting point is there are some special impressing reversal price levels.
Several months ago, I had a question why usdjpy bounced near 108.3 .
After using a calculator, I found that 108.3 = 100 * 1.083 ≒ 100 * pow(1.0025,31) .
1.0025 , as known as 0.25% of change, is a potential stop out zone.
Therefore, we can compute grids and one grid is a little more than 1.0025 times than an another one.
After we finished computing grids, we can consider buy and sell near those grids.
Note that different traders may obtain different grid values.
For example, from 1.0 to 2.0 , it can be splited as 270 grids or 277 grids because pow(1.0025,277)<2 .
Those grids cannot always imply potential reversal points but they can be useful for traders looking for 0.25% profit targets with reducing fearing of buying or selling too early.
Computing grids
This script split from 1.0 to 10.0 into three segments.
One is 1.0 to 2.0 .
The second segment is from 2.0 to 5.0 .
The third segment is from 5.0 to 10.0 .
This script does the same thing for 0.1 to 1.0 , 10.0 to 100.0 , and so on.
For 1.0 to 2.0 and 5.0 to 10.0 , this script split a segment as 270 grids.
For 2.0 to 5.0 , this script split a segment as 360 grids.
The last step is display the next grids to the daily low and daily high.
Maybe also display the grids behind grids shown.
Parameters
x1,x2,x3,x4 : display the next x1,x2,x3,x4 grids to daily high and daily low. 1 means the next grid to daily high and daily low. 2 means the next grid to 1.
x_seg : default 2.0 . This script split from 1.0 to 10.0 into three segments. One is 1.0 to x_seg. The second segment is from x_seg to 10.0/x_seg . The third segment is from 10.0/x_seg to 10.0 .
x_grid1 : how many grids in the first segment
x_grid2 : how many grids in the second segment
x_lowprice : add this number for bigger grid distance. Generally, you don't need this number when trading forex but you may need it in stock trading. For stocks with price between 50 to 100, I recommend you use x_lowprice=100.
Conclusion and suggestions
This script can find potential grids for trading.
If price touches grids usually, we can consider buy and sell after price touches grids.
If price reverses before touching grids usually, we may consider buy and sell before price touches grids.
Those grids can remind us don't buy too much unless the price touches the next grid.
For instruments with less volatility, maybe we need more grids.
For traders with more money, they may also consider more grids for more dedicated range trading to collect more profit.
Reference
Sorry, I forgot them.
Continuation and Reversal Patterns
This script helps in identifying the reversal and continuation patterns in the japanese candle sticks this can be applied across all time frames
we can configure the maximum number of weak candles in the zone such that we can configure the strength as per end user but maximum base candles is restricted to 5
as any candles greater than that will make the pattern weak
Note : This is not a strategy rather a useful tool which suggests there might be continuation to the existing trend or there might be reversal , so use them with combination of other indicators and price action for better results
Key ReversalA key reversal is possible reversal in trend when a the candle engulf completely, the body and wick, of the two previous candles.
HOLP/LOHPThe HOLP strategy was developed by trader-author John F. Carter in his book 'Mastering the trade: proven techniques for profiting from intraday and swing trading set ups' (ISBN 0-07-145958-8). The strategy, which gives buy signals, is a reversal strategy. Reversal strategies try to determine the point in time when a trend reverses direction. In his book John F. Carter is actually skeptical of taking a position against the trend, quoting classics like "never catch a falling knife" (buy a steep sell off) and "never step in front of a train" (short sell a strong market). Given his skepticism he decides to base his strategy on the one single factor which he deems relevant: the market price.
Inverse BandsThis was the result of quite some time spent examining how much information could be gleamed by studying the interactions between Keltner Channels, STARC Bands and Bollinger Bands. I was surprised by the results.
First of all, there are four fills that are black. Set the transparency of those to 0 and you'll see this indicator the way that it's meant to be seen. Those fills belong to unused sections of the Bollinger Bands.
There are two clouds which represent STARC Bands and the Keltner Channel. There is some delay when they flip from bullish (green) to bearish (red), but they are indicative of the trend. The space between them is black and the narrower that space is, the greater volatility is. Because of this, we don't need the exterior Bollinger Bands.
The Bollinger Bands remain visible as the yellow interior clouds on the top cloud and the blue interior clouds on the bottom cloud. Often, the thicker the yellow or blue cloud is, the less severe a throwback from a given trend reversal will be. Often the thinner that yellow or blue cloud is, the more severe the trend reversal will be. If price is rising into a thin interior yellow cloud, the following dip will be substantial. If price action dips towards a thicker interior blue cloud, often the pump following that dump will be less enthusiastic.
We preserve the Keltner Channel and STARC bands as our cloud because the way that they interact with the three basis lines yields a lot of information.
The yellow Bollinger basis line tells us about trend strength. The closer the BB basis line is to the top of the top cloud or the bottom of the bottom cloud, the stronger the trend is. When it enters the cloud very close to the bottom of the bottom cloud, you know you're looking at a strong pump, and vice versa when it's close to the top of the top cloud.
The purple Keltner Channel basis line and orange STARC Band basis line can forecast short term trend changes one candlestick in advance by contacting any line in either cloud. The moment either basis line touches or crosses any boundary of the clouds, you know that the next candle will change directions. In an uptrend, a touch or cross means the next candle will have a lower high point. In a downtrend, a cross or touch means the next candle will have a higher high point. This is most useful in scalping.
It'd be pretty easy to slap some crossover alerts on to this and useful considering that they come a candle in advance. Feel free to further explore and develop this.
Pivot Reversal AlertsPivot Reversal Study script, for generating Alerts and visual plotting of Pivot Reversal lines on the charts. Use a Strategy script (like Figs & Dates), for backtesting different settings on various time frames and charts.
Pivot of Pivot Reversal Strategy [QuantNomad]Continue looking for more signifcant pivot points.
This script is based on my "Significant Pivot Reversal Strategy".
In this strategy I use concept of pivot of pivot points.
So for PoP I require that pivot highs point should have 2 lower pivot highs points around them and pivot low 2 higher pivot lows points.
Transparent lines represent usual pivot levels ints.
Not transparent lines represent pivot of pivot levels.
Link to original script:
QuantNomad - Significant Pivot Reversal Strategy AlertsAlerts for "Significant Pivot Reversal Strategy":
As one of the ways to filter out insignificant levels I decided to check that pivot point is not above/below neighbors, but check that it's above/below at least by a certain amount.
I use ATR, so in params, you can set length of ATR and also ATR multiplier. The new level will be calculated only if PP will be above/below neighbors by atr * atr_mult.
It seems this approach might help in some cases.
QuantNomad - Significant Pivot Reversal StrategyI'm working on improving the Pivot Points Reversal Strategy.
As one of the ways to filter out insignificant levels I decided to check that pivot point is not above/below neighbors, but check that it's above/below at least by a certain amount.
I use ATR, so in params, you can set length of ATR and also ATR multiplier. The new level will be calculated only if PP will be above/below neighbors by atr * atr_mult.
It seems this approach might help in some cases.
Here I have PivotPoint + RSI strategy:
Pivot Point Reversal + RSI AlertsThese are alerts for previously published strategy:
This strategy joins the Pivot Reversal strategy with the RSI indicator.
We check RSI level at the pivot point level and only if RSI condition is satisfied we update levels for stop orders.
Inside Reversal Engulfing BarInside bar bullish = yellow
Inside Bar bearish = orange
engulfing bar bullish = green
engulfing bar bearish = red
reversal bar bullish = blue
reversal bar bearish = purple
PivotBoss Extreme Reversal SetupPATTERN SUMMARY
1. The first bar of the pattern is about two times larger than the average size of the candles in the lookback
period.
2. The body of the first bar of the pattern should encompass more than 50 percent of the bar's total range, but
usually not more than 85 percent.
3. The second bar of the pattern opposes the first. If the first bar of the pattern is bullish (C > 0), then the second
bar must be bearish (C < 0). If the first bar is bearish (C < 0), then the second bar must be bullish (C > 0).
PATTERN PSYCHOLOGY
The extreme reversal setup is a clever pattern that capitalizes on the ongoing psychological patterns of
investors, traders, and institutions. Basically, the setup looks for an extreme pattern of selling pressure and then
looks to fade this behavior to capture a bullish move higher (reverse for shorts). In essence, this setup is visually
pointing out oversold and overbought scenarios that forces responsive buyers and sellers to come out of the dark
and put their money to work-price has been over-extended and must be pushed back toward a fair area of value
so two-sided trade can take place.
This setup works because many normal investors, or casual traders, head for the exits once their trade
begins to move sharply against them. When this happens, price becomes extremely overbought or oversold,
creating value for responsive buyers and sellers. Therefore, savvy professionals will see that price is above or
below value and will seize the opportunity. When the scared money is selling, the smart money begins to buy, and
Vice versa.
Look at it this way, when the market sells off sharply in one giant candlestick, traders that were short
during the drop begin to cover their profitable positions by buying. Likewise, the traders that were on the
sidelines during the sell-off now see value in lower prices and begin to buy, thus doubling up on the buying
pressure. This helps to spark a sharp v-bottom reversal that pushes price in the opposite direction back toward
fair value.
Kozlod - Pivot Reversal Strategy Alerts V2Its' new version of previously published Kozlod - Pivot Reversal Strategy Alerts
Indicator now better correspond to original strategy. However, there can be some differences. Problem is that it's pretty tricky to implement in plain PineScript same "stop" logic used in strategy.entry of the original script
HV Spike Strategy (HVP + OR Breakout + Reversal + TP/SL Modes)Here is a script that I tried to make it simple, although it has several parameters, I will try to explain, here we go:
Logic: Open Range Breakout: otherwise knows as First Candle Rule, usually used for the first candle in the opening of a market session, in my strategy there is an option to use it even for Crypto that operate 24/7, how to do that? Simply by detecting Volatility from the HVP (Historical Volatility Percentile). Then the ORB logic kicks in and the first candle with high volatility gives the ranges for the trades. The proper HVP Activation Threshold has to be selected for each currency pair/index/crypto in order to have maximum profit.
Enter a trade: when the price goes 100% above/below the First Candle Rule Range. That way it is filtering fake breakouts. Also if the price reverses back into the range the strategy takes the opposite trade.
Exit a trade: SL/TP By percentage or ATR, selection in the input menu.
My intention is to avoid using lagging indicators or guessing of Price Action, purely Bull/Bear indication by the first candle.
I hope you find this helpful! Wishing all successful Trades!
Ultra Simple ReversalThis is a simple script that combines Key Features:
✅ No plotting - Only text labels and candle color changes
✅ Reversal candle detection - Changes candle color on high-probability signals
✅ BUY/SELL text labels - Clear directional signals
✅ Four-module confluence - SSL + Squeeze + MTF Pivots + ORB Breakout
✅ Non-repainting - Reliable signals using proper security calls
✅ Pine Script v6 compatible - All syntax errors fixed
Hilly's 0010110 Reversal Scalping Strategy - 5 Min CandlesKey Features and Rationale:
Timeframe: Restricted to 5-minute candles as requested.
Pattern Integration: Includes single (Hammer, Shooting Star, Doji), two (Engulfing, Harami), and three-plus (Morning Star, Evening Star) candlestick patterns, plus reversal patterns based on RSI extremes.
VWAP Cross: Incorporates bullish (price crosses above VWAP) and bearish (price crosses below VWAP) signals, enhanced by trend context.
Volume Analysis: Uses a volume spike threshold to filter noise, with a simple day-start volume comparison for financial environment context.
Financial Environment: Approximates the day's sentiment using early-hour volume compared to current volume, adjusted by trend.
Aggregation: Scores each condition (e.g., 1 for basic patterns, 2 for strong patterns like Engulfing, 3 for three-candle patterns) and decides based on weighted consensus, with trendStrength as a tunable threshold.
Risky Approach: Minimal filtering and a low trendStrength (default 0.5) allow frequent signals, aligning with your $100-to-$200 goal, but expect higher risk.
Suggested Inputs:
EMA Length: 10 (short enough for 5-minute sensitivity).
VWAP Lookback: 1 (uses current session VWAP).
Volume Threshold Multiplier: 1.2 (moderate spike requirement).
RSI Length: 14 (standard, adjustable to 7 for more sensitivity).
Trend Strength Threshold: 0.5 (balance between signals; lower to 0.4 for more trades, raise to 0.6 for fewer).


