RSI Divergence Screener [Pineify]RSI Divergence Screener
Key Features
Multi-symbol and multi-timeframe support for advanced market screening.
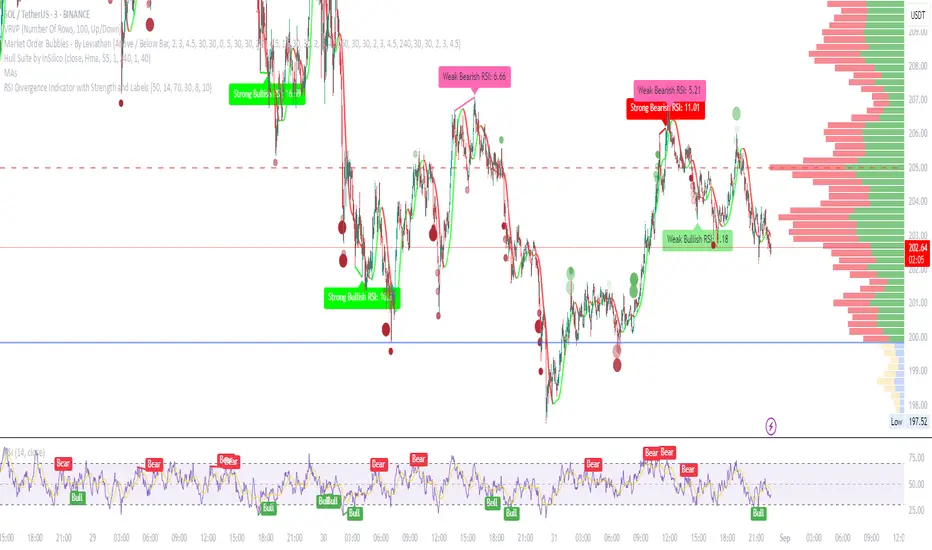
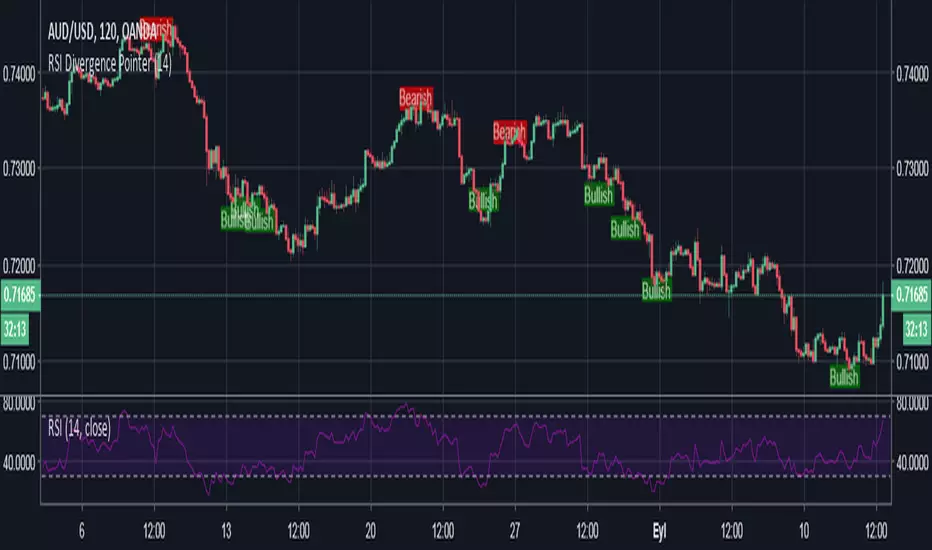
Real-time detection and visualization of bullish and bearish RSI divergences.
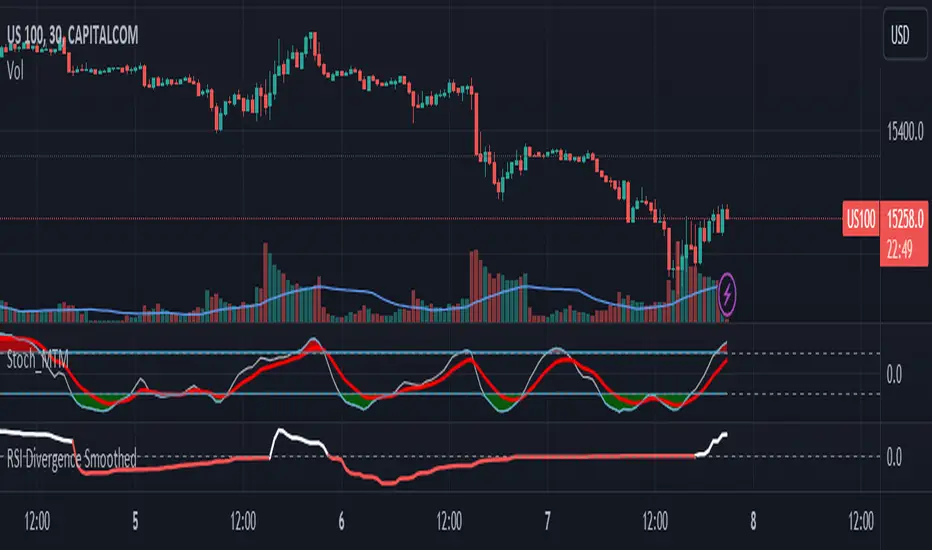
Seamless integration with core technical indicators and custom divergences.
Highly customizable parameters for precise adaptation to personal trading strategies.
Comprehensive screener table for swift asset comparison and analysis.
How It Works
The RSI Divergence Screener leverages the power of Relative Strength Index (RSI) to systematically track momentum shifts across cryptocurrencies and their respective timeframes. By monitoring both fast and slow RSI calculations, the screener isolates divergence signals—key reversal points that often precede major price moves.
The indicator calculates two RSI values for each selected asset: one with a short lookback (Fast RSI) and another with a longer period (Slow RSI).
It runs a comparative algorithm to find divergences—whenever Fast RSI deviates significantly from Slow RSI, it flags the signal as bullish or bearish.
All detected divergences are dynamically presented in a table view, allowing traders to scan symbols and timeframes for optimal trading setups.
Trading Ideas and Insights
Spot early momentum reversals and preempt major price swings via divergence signals.
Combine multiple symbols and timeframes for cross-market trending opportunities.
Identify high-probability scalping and swing trading setups informed by RSI divergence logic.
Quickly compare crypto asset strength and trend exhaustion across short and long-term horizons.
How Multiple Indicators Work Together
This screener’s edge lies in its synergistic use of multi-setting RSI calculations and customizable input groups.
The dual-RSI approach (Fast vs. Slow) isolates subtle trend shifts missed by traditional single-period RSI.
Safe and reliable divergences arise only when the mathematical difference between Fast RSI and Slow RSI meets predefined thresholds, minimizing false positives.
Divergences are contextualized using tailored color codes and backgrounds, rendering insights immediately actionable.
You can expand analysis with additional moving average filters or overlays for further confirmation.
Unique Aspects
First-of-its-kind screener dedicated solely to RSI divergence, designed especially for crypto volatility.
Efficient screening of up to eight assets and multiple timeframes in one compact dashboard.
Intuitive iconography, color logic, and table layouts optimized for rapid decision-making.
Advanced input group design for fine-tuning indicator settings per symbol, timeframe, and source.
How to Use
Select up to eight cryptocurrency symbols to screen for divergence signals.
Assign individual timeframes and source prices for each asset to customize analysis.
Set Fast RSI and Slow RSI lengths according to your preferred strategy (e.g., scalping, swing, or trend following).
Review the screener table: colored cells highlight actionable bullish (green) and bearish (red) divergences.
Confirm trade setups with additional indicators or price action for robust risk management.
Customization
Symbols: Choose any crypto pair or ticker for dynamic divergence tracking.
Timeframes: Scan across 1m, 5m, 10m, 30m, and more for full market coverage.
RSI lengths: Configure Fast and Slow RSI periods based on volatility and trading style.
Visuals: Tailor table colors, fonts, and alert backgrounds per your preference.
Conclusion
The RSI Divergence Screener is a versatile, original TradingView indicator that empowers traders to scan, compare, and act on divergence signals with speed and precision. Its multi-symbol design, robust logic, and extensive customization options set a new standard for market screening tools. Integrate it into your crypto trading process to capture actionable opportunities ahead of the crowd and optimize your technical analysis workflow.
Индикатор Pine Script®