RSI ProfitGuard [CHE]The RSI ProfitGuard Indicator is a comprehensive tool designed to assist traders in making informed decisions by integrating the Relative Strength Index (RSI) with automated Take Profit (TP) and Stop Loss (SL) levels. This indicator enhances trading strategies by providing clear entry signals and risk management parameters.
Key Features
RSIBased Signals: Utilizes RSI crossovers and crossunders to generate trade signals.
Automated TP and SL: Automatically calculates and plots Take Profit and Stop Loss levels based on userdefined methods.
Customizable Trade Types: Supports Long trades, Short trades, or both simultaneously.
Flexible Calculation Methods: Choose between Percentagebased or ATRbased methods for determining TP and SL levels.
Visual Enhancements: Highlights overbought and oversold RSI regions with background colors and marks trade entries with arrows.
Alerts: Provides realtime alerts when TP or SL levels are reached, ensuring timely trade management.
How It Works
1. RSI Calculation: The indicator calculates the RSI value based on the specified length.
2. Trade Signals:
Long Entry: Triggered when RSI crosses above the defined crossover threshold.
Short Entry: Triggered when RSI crosses below the defined crossunder threshold.
3. TP/SL Level Determination:
Percentage Method: Sets TP and SL as a percentage above and below the entry price.
ATR Method: Sets TP and SL based on the Average True Range (ATR), allowing for dynamic adjustments based on market volatility.
4. Visualization: Draws lines and labels on the chart to indicate TP, SL, and entry points.
5. Trade Management: Monitors price movements to determine if TP or SL levels are hit, automatically managing the trade state.
Customization Options
Trade Type Selection: Choose to execute Long trades, Short trades, or both.
RSI Settings:
RSI Length: Defines the period for RSI calculation (default is 14).
Crossover Threshold: RSI level above which a Long entry is signaled (default is 65).
Crossunder Threshold: RSI level below which a Short entry is signaled (default is 35).
Delay Settings: Sets the minimum number of bars between consecutive trade signals to avoid overtrading.
TP/SL Settings:
Method Selection: Choose between Percentage or ATRbased calculations.
Percentage Values: Define the percentage for TP and SL levels.
ATR Settings: Define ATR length and multipliers for TP and SL when using the ATR method.
Visual Settings:
Line Colors and Styles: Customize the appearance of TP, SL, crossover, and crossunder lines.
Transparency: Adjust the transparency of lines for better chart visibility.
Label Offset: Position labels at a specified number of bars to the right for clarity.
Using the Indicator
1. Add to Chart: Apply the RSI ProfitGuard Indicator to your TradingView chart.
2. Configure Settings: Adjust the parameters according to your trading strategy and risk tolerance.
3. Interpret Signals:
Long Entries: Look for green upward arrows indicating potential buy opportunities.
Short Entries: Look for red downward arrows indicating potential sell opportunities.
4. Monitor TP and SL Levels: Observe the plotted lines and labels to manage your trades effectively.
5. Set Up Alerts: Enable alerts to receive notifications when TP or SL levels are reached, ensuring you can act promptly.
Benefits
Enhanced DecisionMaking: Combines RSI signals with clear risk management levels.
Time Efficiency: Automates the calculation and plotting of TP and SL, saving time and reducing manual errors.
Flexibility: Adapts to various trading styles and market conditions through customizable settings.
Risk Management: Helps in defining and adhering to risk parameters, essential for longterm trading success.
Conclusion
The RSI ProfitGuard Indicator is an invaluable tool for traders seeking to integrate technical analysis with automated risk management. Its customizable features and realtime alerts provide a robust framework for executing and managing trades with confidence.
Disclaimer
The content provided with our RSI ProfitGuard Indicator, including all code, scripts, lessons, and materials, is strictly for educational and informational purposes only. It is not intended as, and should not be interpreted as, financial advice, a recommendation to buy or sell, or an offer of any financial product or service.
Key Points:
Educational Purpose:
All strategies, tools, and examples included within the RSI ProfitGuard Indicator are provided solely for illustrative purposes. They are designed to demonstrate coding techniques and the functionality of Pine Script within a trading context.
No Financial Advice:
The RSI ProfitGuard Indicator does not constitute financial advice. Users should not rely on it as a basis for making investment or trading decisions.
Hypothetical Results:
Any results or performance metrics derived from using the RSI ProfitGuard Indicator are purely hypothetical. Past performance is not indicative of future results, and there is no guarantee of profitability.
Risk Disclosure:
Trading and investing involve significant risks, including the potential loss of principal. The RSI ProfitGuard Indicator is not suitable for all persons, and users should be aware of the inherent risks involved in trading.
Professional Consultation:
Before making any trading decisions, it is strongly recommended to consult with a qualified financial professional to fully understand the risks and ensure that such decisions align with your financial situation and goals.
User Responsibility:
By using the RSI ProfitGuard Indicator, you acknowledge and agree that all trading decisions are made solely at your own discretion and risk. The developers and providers of the RSI ProfitGuard Indicator assume no responsibility or liability for any losses or damages resulting from its use.
Additional Notes:
No Guarantees:
There are no guarantees regarding the accuracy, reliability, or completeness of the RSI ProfitGuard Indicator. Users utilize the tool at their own risk.
No Endorsement:
Any mention of third-party products, services, or strategies within the RSI ProfitGuard Indicator does not constitute an endorsement or recommendation.
Updates and Modifications:
The RSI ProfitGuard Indicator may be updated or modified over time. Users are responsible for staying informed about any changes and understanding how they may impact the use of the tool.
Summary
This disclaimer clearly states that the RSI ProfitGuard Indicator is intended for educational purposes and should not be used as financial advice. It highlights the risks associated with trading, the hypothetical nature of any results, and the importance of consulting with a financial professional. Additionally, it emphasizes that users are solely responsible for their trading decisions and any outcomes that result from using the indicator.
Tips for Implementation:
Visibility:
Ensure that this disclaimer is prominently displayed wherever the RSI ProfitGuard Indicator is offered, such as on your website, within the TradingView description, or in any accompanying documentation.
Clarity:
Use clear and concise language to make sure that all users understand the limitations and responsibilities associated with using the indicator.
Legal Review:
Consider having the disclaimer reviewed by a legal professional to ensure that it meets all necessary legal requirements and adequately protects your interests.
Regular Updates:
Periodically review and update the disclaimer to reflect any changes in the indicator's functionality or in relevant laws and regulations.
Поиск скриптов по запросу "rsi"

RSI K-Means Clustering [UAlgo]The "RSI K-Means Clustering " indicator is a technical analysis tool that combines the Relative Strength Index (RSI) with K-means clustering techniques. This approach aims to provide more nuanced insights into market conditions by categorizing RSI values into overbought, neutral, and oversold clusters.
The indicator adjusts these clusters dynamically based on historical RSI data, allowing for more adaptive and responsive thresholds compared to traditional fixed levels. By leveraging K-means clustering, the indicator identifies patterns in RSI behavior, which can help traders make more informed decisions regarding market trends and potential reversals.
🔶 Key Features
K-means Clustering: The indicator employs K-means clustering, an unsupervised machine learning technique, to dynamically determine overbought, neutral, and oversold levels based on historical RSI data.
User-Defined Inputs: You can customize various aspects of the indicator's behavior, including:
RSI Source: Select the data source used for RSI calculation (e.g., closing price).
RSI Length: Define the period length for RSI calculation.
Training Data Size: Specify the number of historical RSI values used for K-means clustering.
Number of K-means Iterations: Set the number of iterations performed by the K-means algorithm to refine cluster centers.
Overbought/Neutral/Oversold Levels: You can define initial values for these levels, which will be further optimized through K-means clustering.
Alerts: The indicator can generate alerts for various events, including:
Trend Crossovers: Alerts for when the RSI crosses above/below the neutral zone, signaling potential trend changes.
Overbought/Oversold: Alerts when the RSI reaches the dynamically determined overbought or oversold thresholds.
Reversals: Alerts for potential trend reversals based on RSI crossing above/below the calculated overbought/oversold levels.
RSI Classification: Alerts based on the current RSI classification (ranging, uptrend, downtrend).
🔶 Interpreting Indicator
Adjusted RSI Value: The primary plot represents the adjusted RSI value, calculated based on the relative position of the current RSI compared to dynamically adjusted overbought and oversold levels. This value provides an intuitive measure of the market's momentum. The final overbought, neutral, and oversold levels are determined by K-means clustering and are displayed as horizontal lines. These levels serve as dynamic support and resistance points, indicating potential reversal zones.
Classification Symbols : The "RSI K-Means Clustering " indicator uses specific symbols to classify the current market condition based on the position of the RSI value relative to dynamically determined clusters. These symbols provide a quick visual reference to help traders understand the prevailing market sentiment. Here's a detailed explanation of each classification symbol:
Ranging Classification ("R")
This symbol appears when the RSI value is closest to the neutral threshold compared to the overbought or oversold thresholds. It indicates a ranging market, where the price is moving sideways without a clear trend direction. In this state, neither buyers nor sellers are in control, suggesting a period of consolidation or indecision. This is often seen as a time to wait for a breakout or reversal signal before taking a position.
Up-Trend Classification ("↑")
The up-trend symbol, represented by an upward arrow, is displayed when the RSI value is closer to the overbought threshold than to the neutral or oversold thresholds. This classification suggests that the market is in a bullish phase, with buying pressure outweighing selling pressure. Traders may consider this as a signal to enter or hold long positions, as the price is likely to continue rising until the market reaches an overbought condition.
Down-Trend Classification ("↓")
The down-trend symbol, depicted by a downward arrow, appears when the RSI value is nearest to the oversold threshold. This indicates a bearish market condition, where selling pressure dominates. The market is likely experiencing a downward movement, and traders might view this as an opportunity to enter or hold short positions. This symbol serves as a warning of potential further declines, especially if the RSI continues to move toward the oversold level.
Bullish Reversal ("▲")
This signal occurs when the RSI value crosses above the oversold threshold. It indicates a potential shift from a downtrend to an uptrend, suggesting that the market may start to move higher. Traders might use this signal as an opportunity to enter long positions.
Bearish Reversal ("▼")
This signal appears when the RSI value crosses below the overbought threshold. It suggests a possible transition from an uptrend to a downtrend, indicating that the market may begin to decline. This signal can alert traders to consider entering short positions or taking profits on long positions.
These classification symbols are plotted near the adjusted RSI line, with their positions adjusted based on the standard deviation and a distance multiplier. This placement helps in visualizing the classification's strength and ensuring clarity in the indicator's presentation. By monitoring these symbols, traders can quickly assess the market's state and make more informed trading decisions.
🔶 Disclaimer
Use with Caution: This indicator is provided for educational and informational purposes only and should not be considered as financial advice. Users should exercise caution and perform their own analysis before making trading decisions based on the indicator's signals.
Not Financial Advice: The information provided by this indicator does not constitute financial advice, and the creator (UAlgo) shall not be held responsible for any trading losses incurred as a result of using this indicator.
Backtesting Recommended: Traders are encouraged to backtest the indicator thoroughly on historical data before using it in live trading to assess its performance and suitability for their trading strategies.
Risk Management: Trading involves inherent risks, and users should implement proper risk management strategies, including but not limited to stop-loss orders and position sizing, to mitigate potential losses.
No Guarantees: The accuracy and reliability of the indicator's signals cannot be guaranteed, as they are based on historical price data and past performance may not be indicative of future results.

RSI Analysis with Statistical Summary Scientific Analysis of the Script "RSI Analysis with Statistical Summary"
Introduction
I observed that there are outliers in the price movement liquidity, and I wanted to understand the RSI value at those points and whether there are any notable patterns. I aimed to analyze this statistically, and this script is the result.
Explanation of Key Terms
1. Outliers in Price Movement Liquidity: An outlier is a data point that significantly deviates from other values. In this context, an outlier refers to an unusually high or low liquidity of price movement, which is the ratio of trading volume to the price difference between the open and close prices. These outliers can signal important market changes or unusual trading activities.
2. RSI (Relative Strength Index): The RSI is a technical indicator that measures the speed and change of price movements. It ranges from 0 to 100 and helps identify overbought or oversold conditions of a trading instrument. An RSI value above 70 indicates an overbought condition, while a value below 30 suggests an oversold condition.
3. Mean: The mean is a measure of the average of a dataset. It is calculated by dividing the sum of all values by the number of values. In this script, the mean of the RSI values is calculated to provide a central tendency of the RSI distribution.
4. Standard Deviation (stdev): The standard deviation is a measure of the dispersion or variation of a dataset. It shows how much the values deviate from the mean. A high standard deviation indicates that the values are widely spread, while a low standard deviation indicates that the values are close to the mean.
5. 68% Confidence Interval: A confidence interval indicates the range within which a certain percentage of values of a dataset lies. The 68% confidence interval corresponds to a range of plus/minus one standard deviation around the mean. It indicates that about 68% of the data points lie within this range, providing insight into the distribution of values.
Overview
This Pine Script™, written in Pine version 5, is designed to analyze the Relative Strength Index (RSI) of a stock or other trading instrument and create statistical summaries of the distribution of RSI values. The script identifies outliers in price movement liquidity and uses this information to calculate the frequency of RSI values. At the end, it displays a statistical summary in the form of a table.
Structure and Functionality of the Script
1. Input Parameters
- `rsi_len`: An integer input parameter that defines the length of the RSI (default: 14).
- `outlierThreshold`: An integer input parameter that defines the length of the outlier threshold (default: 10).
2. Calculating Price Movement Liquidity
- `priceMovementLiquidity`: The volume is divided by the absolute difference between the close and open prices to calculate the liquidity of the price movement.
3. Determining the Boundary for Liquidity and Identifying Outliers
- `liquidityBoundary`: The boundary is calculated using the Exponential Moving Average (EMA) of the price movement liquidity and its standard deviation.
- `outlier`: A boolean value that indicates whether the price movement liquidity exceeds the set boundary.
4. Calculating the RSI
- `rsi`: The RSI is calculated with a period length of 14, using various moving averages (e.g., SMA, EMA) depending on the settings.
5. Storing and Limiting RSI Values
- An array `rsiFrequency` stores the frequency of RSI values from 0 to 100.
- The function `f_limit_rsi` limits the RSI values between 0 and 100.
6. Updating RSI Frequency on Outlier Occurrence
- On an outlier occurrence, the limited and rounded RSI value is updated in the `rsiFrequency` array.
7. Statistical Summary
- Various variables (`mostFrequentRsi`, `leastFrequentRsi`, `maxCount`, `minCount`, `sum`, `sumSq`, `count`, `upper_interval`, `lower_interval`) are initialized to perform statistical analysis.
- At the last bar (`bar_index == last_bar_index`), a loop is run to determine the most and least frequent RSI values and their frequencies. Sum and sum of squares of RSI values are also updated for calculating mean and standard deviation.
- The mean (`mean`) and standard deviation (`stddev`) are calculated. Additionally, a 68% confidence interval is determined.
8. Creating a Table for Result Display
- A table `resultsTable` is created and filled with the results of the statistical analysis. The table includes the most and least frequent RSI values, the standard deviation, and the 68% confidence interval.
9. Graphical Representation
- The script draws horizontal lines and fills to indicate overbought and oversold regions of the RSI.
Interpretation of the Results
The script provides a detailed analysis of RSI values based on specific liquidity outliers. By calculating the most and least frequent RSI values, standard deviation, and confidence interval, it offers a comprehensive statistical summary that can help traders identify patterns and anomalies in the RSI. This can be particularly useful for identifying overbought or oversold conditions of a trading instrument and making informed trading decisions.
Critical Evaluation
1. Robustness of Outlier Identification: The method of identifying outliers is solely based on the liquidity of price movement. It would be interesting to examine whether other methods or additional criteria for outlier identification would lead to similar or improved results.
2. Flexibility of RSI Settings: The ability to select various moving averages and period lengths for the RSI enhances the adaptability of the script, allowing users to tailor it to their specific trading strategies.
3. Visualization of Results: While the tabular representation is useful, additional graphical visualizations, such as histograms of RSI distribution, could further facilitate the interpretation of the results.
In conclusion, this script provides a solid foundation for analyzing RSI values by considering liquidity outliers and enables detailed statistical evaluation that can be beneficial for various trading strategies.

RSI / Connectable [Azullian]Enhance your trading approach with the modular RSI indicator, skilled in identifying market extremes. Simplify pattern visualization and signal weighting for more efficient strategy formulation.
This connectable RSI indicator is part of an indicator system designed to help test, visualize and build strategy configurations without coding. Like all connectable indicators , it interacts through the TradingView input source, which serves as a signal connector to link indicators to each other. All connectable indicators send signal weight to the next node in the system until it reaches either a connectable signal monitor, signal filter and/or strategy.
█ UNIFORM SETTINGS AND A WAY OF WORK
Although connectable indicators may have specific weight scoring conditions, they all aim to follow a standardized general approach to weight scoring settings, as outlined below.
■ Connectable indicators - Settings
• 🗲 Energy: Energy applies an ATR multiplier to the plotted shapes on the chart. A higher value plots shapes farther away from the candle, enhancing visibility.
• ☼ Brightness: Brightness determines the opacity of the shape plotted on the chart, aiding visibility. Indicator weight also influences opacity.
• → Input: Use the input setting to specify a data source for the indicator. Here you can connect the indicator to other indicators.
• ⌥ Flow: Determine where you want to receive signals from:
○ Both: Weights from this indicator and the connected indicator will apply
○ Indicator only: Only weights from this indicator will apply
○ Input only: Only weights from the connected indicator will apply
• ⥅ Weight multiplier: Multiply all weights in the entire indicator by a given factor, useful for quickly testing different indicators in a granular setup.
• ⥇ Threshold: Set a threshold to indicate the minimum amount of weight it should receive to pass it through to the next indicator.
• ⥱ Limiter: Set a hard limit to the maximum amount of weight that can be fed through the indicator.
■ Connectable indicators - Weight scoring settings
▢ Weight scoring conditions
• SM – Signal mode: Enable specific conditions for weight scoring
○ All: All signals will be scored.
○ Entries only: Only entries will score.
○ Exits only: Only exits will score.
○ Entries & exits: Both entries and exits will score.
○ Zone: Continuous scoring for each candle within the zone.
• SP – Signal period: Defines a range of candles within which a signal can score.
• SC - Signal count: Specifies the number of bars to retrospectively examine and score.
○ Single: Score for a single occurrence
○ All occurrences: Score for all occurrences
○ Single + Threshold: Score for single occurrences within the signal period (SP)
○ Every + Threshold: Score for all occurrences within the signal period (SP)
▢ Weight scoring direction
• ES: Enter Short weight
• XL: Exit long weight
• EL: Enter Long weight
• XS: Exit Short weight
▢ Weight scoring values
• Weights can hold either positive or negative scores. Positive weights enhance a particular trading direction, while negative weights diminish it.
■ Entries, exits and zone illustrated on a standard RSI indicator when the RSI is overbought.
█ RSI - INDICATOR SETTINGS
■ Main settings
• Enable/Disable Indicator: Toggle the entire indicator on or off.
• S - Source: Choose an alternative data source for the RSI calculation.
• T - Timeframe: Select an alternative timeframe for the RSI calculation.
• LE - Length: Define the number of bars or periods used in the RSI calculation.
• OB - Overbought Level: Determine the RSI value at which overbought conditions are met.
• OS - Oversold Level: Specify the RSI value at which oversold conditions are met.
■ Scoring functionality
• The RSI scores long entries when the RSI enters OS: oversold area
• The RSI scores long exits when the RSI exits OS: oversold area
• The RSI scores long zones the entire time the RSI is in OS: oversold area
• The RSI scores short entries when the RSI enters OB: overbought area
• The RSI scores short exits when the RSI exits OB: overbought area
• The RSI scores short zones the entire time the RSI is in OB: overbought area
█ PLOTTING
• Standard: Symbols (EL, XS, ES, XL) appear relative to candles based on set conditions. Their opacity and position vary with weight.
• Conditional Settings: A larger icon appears if global conditions are met. For instance, with a Threshold(⥇) of 12, Signal Period (SP) of 3, and Scoring Condition (SC) set to "EVERY", an RSI signaling over two times in 3 candles (scoring 6 each) triggers a larger icon.
█ USAGE OF CONNECTABLE INDICATORS
■ Connectable chaining mechanism
Connectable indicators can be connected directly to the signal monitor, signal filter or strategy , or they can be daisy chained to each other while the last indicator in the chain connects to the signal monitor, signal filter or strategy. When using a signal filter you can chain the filter to the strategy input to make your chain complete.
• Direct chaining: Connect an indicator directly to the signal monitor, signal filter or strategy through the provided inputs (→).
• Daisy chaining: Connect indicators using the indicator input (→). The first in a daisy chain should have a flow (⌥) set to 'Indicator only'. Subsequent indicators use 'Both' to pass the previous weight. The final indicator connects to the signal monitor, signal filter, or strategy.
■ Set up this indicator with a signal filter and strategy
The indicator provides visual cues based on signal conditions. However, its weight system is best utilized when paired with a connectable signal filter, signal monitor, or strategy .
Let's connect the RSI to a connectable signal filter and a strategy :
1. Load all relevant indicators
• Load RSI / Connectable
• Load Signal filter / Connectable
• Load Strategy / Connectable
2. Signal Filter: Connect the RSI to the Signal Filter
• Open the signal filter settings
• Choose one of the three input dropdowns (1→, 2→, 3→) and choose : RSI / Connectable: Signal Connector
• Toggle the enable box before the connected input to enable the incoming signal
3. Signal Filter: Update the filter signals settings if needed
• The default settings of the filter enable EL (Enter Long), XL (Exit Long), ES (Enter Short) and XS (Exit Short).
4. Signal Filter: Update the weight threshold settings if needed
• All connectable indicators load by default with a score of 6 for each direction (EL, XL, ES, XS)
• By default, weight threshold (TH) is set at 5. This allows each occurrence to score, as the default score in each connectable indicator is 1 point above the threshold. Adjust to your liking.
5. Strategy: Connect the strategy to the signal filter in the strategy settings
• Select a strategy input → and select the Signal filter: Signal connector
6. Strategy: Enable filter compatible directions
• Set the signal mode of the strategy to a compatible direction with the signal filter.
Now that everything is connected, you'll notice green spikes in the signal filter representing long signals, and red spikes indicating short signals. Trades will also appear on the chart, complemented by a performance overview. Your journey is just beginning: delve into different scoring mechanisms, merge diverse connectable indicators, and craft unique chains. Instantly test your results and discover the potential of your configurations. Dive deep and enjoy the process!
█ BENEFITS
• Adaptable Modular Design: Arrange indicators in diverse structures via direct or daisy chaining, allowing tailored configurations to align with your analysis approach.
• Streamlined Backtesting: Simplify the iterative process of testing and adjusting combinations, facilitating a smoother exploration of potential setups.
• Intuitive Interface: Navigate TradingView with added ease. Integrate desired indicators, adjust settings, and establish alerts without delving into complex code.
• Signal Weight Precision: Leverage granular weight allocation among signals, offering a deeper layer of customization in strategy formulation.
• Advanced Signal Filtering: Define entry and exit conditions with more clarity, granting an added layer of strategy precision.
• Clear Visual Feedback: Distinct visual signals and cues enhance the readability of charts, promoting informed decision-making.
• Standardized Defaults: Indicators are equipped with universally recognized preset settings, ensuring consistency in initial setups across different types like momentum or volatility.
• Reliability: Our indicators are meticulously developed to prevent repainting. We strictly adhere to TradingView's coding conventions, ensuring our code is both performant and clean.
█ COMPATIBLE INDICATORS
Each indicator that incorporates our open-source 'azLibConnector' library and adheres to our conventions can be effortlessly integrated and used as detailed above.
For clarity and recognition within the TradingView platform, we append the suffix ' / Connectable' to every compatible indicator.
█ COMMON MISTAKES, CLARIFICATIONS AND TIPS
• Removing an indicator from a chain: Deleting a linked indicator and confirming the "remove study tree" alert will also remove all underlying indicators in the object tree. Before removing one, disconnect the adjacent indicators and move it to the object stack's bottom.
• Point systems: The azLibConnector provides 500 points for each direction (EL: Enter long, XL: Exit long, ES: Enter short, XS: Exit short) Remember this cap when devising a point structure.
• Flow misconfiguration: In daisy chains the first indicator should always have a flow (⌥) setting of 'indicator only' while other indicator should have a flow (⌥) setting of 'both'.
• Hide attributes: As connectable indicators send through quite some information you'll notice all the arguments are taking up some screenwidth and cause some visual clutter. You can disable arguments in Chart Settings / Status line.
• Layout and abbreviations: To maintain a consistent structure, we use abbreviations for each input. While this may initially seem complex, you'll quickly become familiar with them. Each abbreviation is also explained in the inline tooltips.
• Inputs: Connecting a connectable indicator directly to the strategy delivers the raw signal without a weight threshold, meaning every signal will trigger a trade.
█ A NOTE OF GRATITUDE
Through years of exploring TradingView and Pine Script, we've drawn immense inspiration from the community's knowledge and innovation. Thank you for being a constant source of motivation and insight.
█ RISK DISCLAIMER
Azullian's content, tools, scripts, articles, and educational offerings are presented purely for educational and informational uses. Please be aware that past performance should not be considered a predictor of future results.

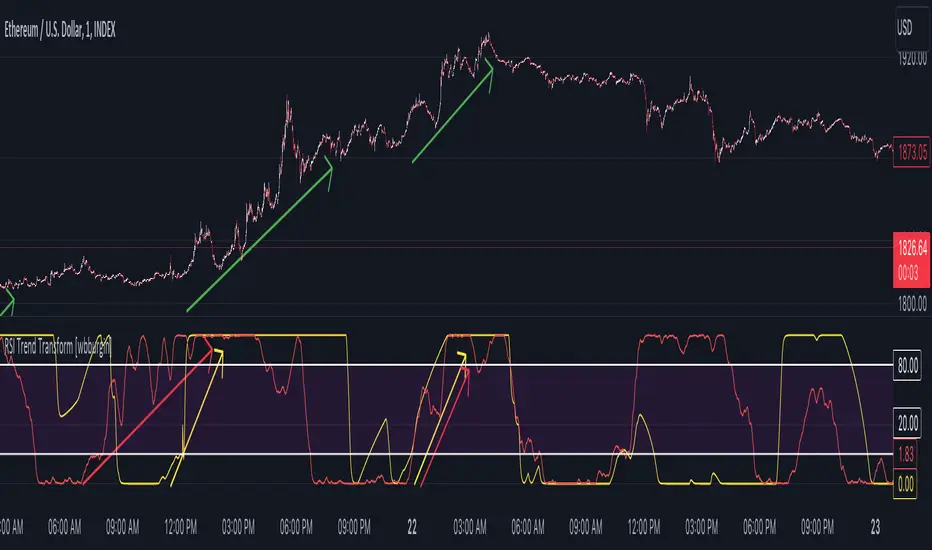
RSI Trend Transform [wbburgin]The RSI Trend Transform indicator is a dual-concept indicator that transforms volume data and price data into two different RSI values, which can then be used together to determine trend strength and momentum. The volume RSI does not use any price data in its calculation - it is purely a transform from nondirectional volume into a directional indicator.
The RSI for all three RSI values (price, volume,combined average) can be plotted as either stochastic or normal. The RSI calculation is adapted for use on volume, which is why the normal ta.rsi() function is not used for the price RSI calculation; both use the same formula for indicator consistency.
How to Use the Indicator
In the examples below, the Price RSI is plotted in yellow and the Volume RSI is plotted in red (length = 200, which is why the indicator is large in these examples). The indicator can be used on any timeframe and any asset, provided volume data is provided by the vendor to TradingView.
Identifying Bullish Trends
A rising volume RSI with a rising price RSI signifies a bullish trend. Example 1:
Example 2:
You can use the combined RSI (the average of the volume RSI and the price RSI) to help with the identification of these trends:
Identifying Bearish Trends
A falling volume RSI with a falling price RSI signifies a bearish trend:
Example 2:
Settings
Source is the source of the price RSI, the volume RSI will by default use volume in its calculations. If you have other indicators on-chart, you could even use the ATR, a volatility indicator, or any nondirectional or directional indicator and transform it into the "price" RSI.
Length is both the length of the RSI and the stochastic.
The next three rows are for each RSI you can plot on the indicator: price RSI, volume RSI, and combined RSI (average of price and volume). The first checkbox plots/removes them from the chart, you can subsequently choose the type of RSI (regular or stochastic), the color of the plot, and the length of the EMA smoothing applied afterward to the plot.
Upper Band and Lower Band refer to the overbought and oversold lines, respectively.
A note about the combined RSI- you will be unable to spot divergences if the combined RSI is the only plot on the indicator, so I encourage you to use the combined RSI as a way to confirm the overall trend if you notice the price RSI and the volume RSI and trending similarly.
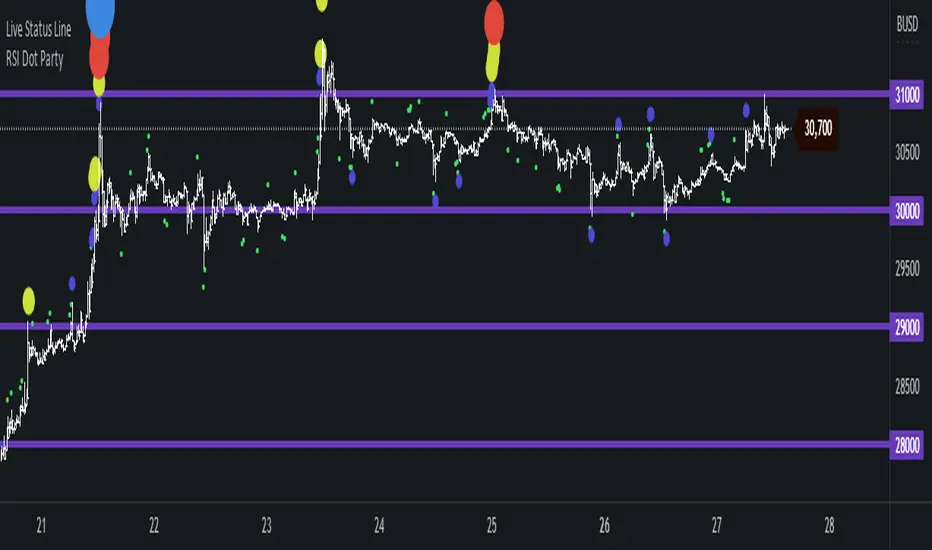
RSI Dot Party - All Lengths From 1 To 120The RSI Dot Party indicator displays all RSI lengths from 1 to 120 as different colored dots on the chart.
🔶 Purpose
Show the reversal point of price action to time entries and exits.
🔶 USAGE
When a dot displays it is a indication of the reversal of the price/trend. The larger the dot the more likely it is to reverse.
The Default settings generates dots for extreme cases where the RSI is over = 90 or under = 10 for every RSI length in the range of 1-120.
Example if the RSI of length 1 or 2 or 3 or 4 or ... or 15 or 16 or 17 or ... or 80 or 81 or 82 or ... if any of does RSI crosses a boundary a dot is shown.
A boundary is the over/under the RSI oscillates in.
Customize the settings until the dots match up with the high and lows of past price action.
🔶 SETTINGS
🔹 Source
Source 1: Is the First Source RSI is calculated from
Source 2: Is the Second Source RSI is calculated from
🔹 Meta Settings
Hours back to draw: To speed up the script calculate it only draws a set number of hours back, default is 300 hours back in time to draw then it cuts off.
Show Dots: Show or disable dots
Show Bar Color: Color the bars for each RSI incident
Filter Cross: Filters and only shows dots when the RSI crosses above or bellow a boundary. If not all candles above or bellow the boundaries will display a dot.
Dots Location Absolute: Instead of showing the dots above or bellow the candle, the dots will show up on the top and bottom of the window.
🔹 7 RSI Groups
There are a total of 7 RSI colors.
Range Very Tiny: Default Color Green
Range Tiny: Default Color Purple
Range Small: Default Color Yellow
Range Normal: Default Color Red
Range Large: Default Color Blue
Range Huge: Default Color Dark Purple
Range Very Huge: Default Color White
🔹 RSI Group Settings
Hi/Low Color: Change the Color of that group.
Start/End: The Start and End range of this RSI color. Example if start = 5 and end = 10 the RSI of 5,6,7,8,9,10 will be displayed on the chart for that color, if any of does RSI goes above or bellow the boundary a dot is displayed on that candle.
Delay: The RSI needs to be above or bellow a boundary for x number of candles before displaying a dot. For example if delay = 2 and the RSI is over = 70 for 2 candles then it will display a dot.
Under/Over: Boundaries that indicate when to draw a dot, if over = 70 and RSI crosses above 70 a dot is displayed.
🔹 Show
Section that allows you to disable RSI grounds you dont want to see, this also removes them from the alert signal generated.
Show Low: Show or disable Low RSI dots
Show High: Show or disable High RSI dots
🔶 ALERTS
Alert for all New RSIs Dots Created in real time
The alert generated depends on what groups are showing or not, if the green group is disabled for example the alert will not be generated.
🔶 Warning
When a dot shows up it can continue moving. For example if a purple dot shows itself above a 15 minute candle, if that candle/price continue to extend up the dot will move up with it.
Dots can also disappear occasionally if the RSI moves in and out of a boundary within that candles life span.
🔶 Community
I hope you guys find this useful, if you have any questions or feature requests leave me a comment! Take care :D
RSI-CCI Fusion StrategyRSI-CCI Fusion Strategy: Harnessing the Power of RSI and CCI
The "RSI-CCI Fusion Strategy" is a powerful trading approach that combines the strengths of the Relative Strength Index (RSI) and the Commodity Channel Index (CCI) to provide enhanced trading insights. This strategy is based on the popular "RSI & CCI Fusion + Alerts" indicator, which utilizes the RSI and CCI indicators from TradingView .
1. Overview of RSI and CCI:
The Relative Strength Index (RSI) is a widely used momentum oscillator that measures the speed and change of price movements. It helps traders identify overbought and oversold conditions in the market. On the other hand, the Commodity Channel Index (CCI) is a versatile indicator that identifies cyclical trends and provides insights into overbought and oversold levels.
2. The RSI-CCI Fusion Strategy:
The RSI-CCI Fusion Strategy harnesses the combined power of the RSI and CCI indicators to generate robust trading signals. By blending the RSI and CCI, this strategy captures both momentum and cyclical trend dynamics, offering a more comprehensive view of the market.
3. Utilizing the RSI-CCI Fusion Indicator + Alerts:
The "RSI & CCI Fusion + Alerts" indicator serves as the backbone of the RSI-CCI Fusion Strategy. It integrates the RSI and CCI indicators from TradingView, providing traders with a clear and actionable trading signal.
4. How it Works:
- The indicator calculates the RSI and CCI values, standardizes them using z-score, and combines them with a weighted fusion approach.
- The resulting RSI-CCI Fusion indicator is plotted on the chart, accompanied by dynamic upper and lower bands, which help identify potential overbought and oversold conditions.
- Traders can customize alerts based on their preferred thresholds and timeframes, enabling them to receive timely notifications for potential buy and sell signals.
5. Implementing the RSI-CCI Fusion Strategy:
Traders following the RSI-CCI Fusion Strategy can utilize the buy and sell signals generated by the RSI-CCI Fusion indicator. When the indicator crosses below the upper band, it may signal a potential selling opportunity. Conversely, when it crosses above the lower band, it may indicate a potential buying opportunity. Traders can also consider additional factors and technical analysis tools to validate the signals before making trading decisions.
Conclusion: The RSI-CCI Fusion Strategy provides traders with a robust approach to analyze the market and make well-informed trading decisions. By incorporating the RSI and CCI indicators through the "RSI & CCI Fusion + Alerts" indicator, traders can take advantage of the combined strengths of these indicators. However, it is important to remember that no strategy guarantees success, and traders should always practice risk management and conduct thorough analysis before executing trades using this strategy.
Disclaimer: Trading involves risks, and it is important to conduct your own research and consult with a financial advisor before making any investment decisions.
Note: The RSI-CCI Fusion Strategy serves as a general guide, and individual traders may have different preferences and trading styles.

RSI Statistics [Honestcowboy]⯁ Overview
Research tool for analysing price behaviour based on RSI, find out how your favorite trading pair / timeframe combinations react to RSI. 5 Different projections based on 5 different value zones of RSI:
RSI between 100-80 (very overbought)
RSI between 80-60 (overbought)
RSI between 60-40 (normal)
RSI between 40-20 (oversold)
RSI between 20-00 (very oversold)
The script simply show price projections of different RSI environments so you can get an idea of what price could do when RSI reaches this RSI value zone. Ofcourse past price performance does not guarantee future returns and this is just projections based on the past.
The script also projects RSI just like it does with price so you can get an idea of how long RSI might stay in overbought or very overbought etc
Script is mainly a research tool to use to get ideas to explore further and build upon. Here are some examples:
⯁ Settings
RSI Lenght: this is just normal RSI settings you find in standard RSI (bars used to calculate RSI)
Projection Length: Amount of bars to save for projections. The projections will also project this many bars in futre. Higher values here increase loading time drastically.
Price Action Boundaries: turn the highs / lows of projection zone on or off. I usually turn this off to look more closely at the averages themselves.
Maximum Stats history: Not on by default, in case you only want to show the average projection of last X amount of occurences RSI was in a specific RSI value zone
Selection of the different zones: in case you want to look at a specific zone alone or turn of some zones. It will no longer project for that zone both in the price projection and RSI projections.
⯁ How are these calculated?
To calculate the average price reaction script uses a very simple approach. On each bar it will save price action array up to projection length back in time. It will then check what the RSI value was there and store the array inside the right matrix.
It will use this matrix to calculate the averages, highs and lows of all these arrays for that specific RSI zone. It uses a simple arithmatic averaging method to get average value.
The script uses a similar approach for projecting the RSI itself into the future.
I include a visual showing it a bit better. This is from a different indicator of me using same approach:
The script will force you into a specific background, bar color and color template. Script is not meant to be used with other scripts and should be used as a standalone tool.

RSI Multi-Timeframe TableHow the RSI Multi-Timeframe Table Indicator Works
This indicator displays a table showing the RSI (14) from multiple timeframes at the same time.
It helps you quickly see whether the RSI is in overbought or oversold zones across different periods (1m, 5m, 15m, 30m, 1h, 4h, and 1D).
Below is a clear explanation of how each part works:
1) Timeframes Used
The indicator analyzes the RSI from the following timeframes:
1 minute (1m)
5 minutes (5m)
15 minutes (15m)
30 minutes (30m)
1 hour (1h)
4 hours (4h)
1 day (1D)
Each row of the table represents one of these timeframes.
2) How the RSI Is Retrieved
For each timeframe, the script uses the request.security() function to fetch the RSI(14) value from that specific timeframe, even if your current chart is set to a different one.
Example: On a 1h chart, you can still see the RSI from 1m, 5m, 30m, etc.
3) Table Structure
The table appears in the top-right corner and contains 8 columns:
TF – shows the timeframe name
RSI – shows the RSI value with two decimal places
10 – marks if RSI is ≤ 10
20 – marks if RSI is ≤ 20
30 – marks if RSI is ≤ 30
70 – marks if RSI is ≥ 70
80 – marks if RSI is ≥ 80
90 – marks if RSI is ≥ 90
The extreme levels (10, 20, 80, 90) help identify possible reversal zones.
4) Markings in the Table
When a condition is true, a ● circle appears in the corresponding cell.
Examples:
If the 5m RSI is ≤ 20, a circle appears in the 20 column for the 5m row.
If the 1H RSI is ≥ 80, a circle appears in the 80 column for the 1H row.
Colors also help interpretation:
Red for strong oversold levels (≤10)
Orange and yellow for intermediate levels
Green, teal, and blue for overbought levels
5) Alerts
The indicator includes four built-in alerts:
RSI ≤ 10
RSI ≤ 20
RSI ≥ 80
RSI ≥ 90
These alerts use the RSI from the current chart timeframe.
To enable them:
Open Alerts in TradingView
Click Create Alert
Select the indicator
Choose the alert you want
Confirm
6) Purpose of This Indicator
It is useful for:
Quickly checking market strength across multiple timeframes
Identifying when several periods are overbought or oversold
Avoiding trades against market momentum
Helping confirm potential reversal points
Summary
This indicator creates a table that shows RSI values from multiple timeframes and visually highlights overbought or oversold conditions in each one.
It also includes ready-to-use alerts for the most extreme RSI levels.

RSI Divergence Screener [Pineify]RSI Divergence Screener
Key Features
Multi-symbol and multi-timeframe support for advanced market screening.
Real-time detection and visualization of bullish and bearish RSI divergences.
Seamless integration with core technical indicators and custom divergences.
Highly customizable parameters for precise adaptation to personal trading strategies.
Comprehensive screener table for swift asset comparison and analysis.
How It Works
The RSI Divergence Screener leverages the power of Relative Strength Index (RSI) to systematically track momentum shifts across cryptocurrencies and their respective timeframes. By monitoring both fast and slow RSI calculations, the screener isolates divergence signals—key reversal points that often precede major price moves.
The indicator calculates two RSI values for each selected asset: one with a short lookback (Fast RSI) and another with a longer period (Slow RSI).
It runs a comparative algorithm to find divergences—whenever Fast RSI deviates significantly from Slow RSI, it flags the signal as bullish or bearish.
All detected divergences are dynamically presented in a table view, allowing traders to scan symbols and timeframes for optimal trading setups.
Trading Ideas and Insights
Spot early momentum reversals and preempt major price swings via divergence signals.
Combine multiple symbols and timeframes for cross-market trending opportunities.
Identify high-probability scalping and swing trading setups informed by RSI divergence logic.
Quickly compare crypto asset strength and trend exhaustion across short and long-term horizons.
How Multiple Indicators Work Together
This screener’s edge lies in its synergistic use of multi-setting RSI calculations and customizable input groups.
The dual-RSI approach (Fast vs. Slow) isolates subtle trend shifts missed by traditional single-period RSI.
Safe and reliable divergences arise only when the mathematical difference between Fast RSI and Slow RSI meets predefined thresholds, minimizing false positives.
Divergences are contextualized using tailored color codes and backgrounds, rendering insights immediately actionable.
You can expand analysis with additional moving average filters or overlays for further confirmation.
Unique Aspects
First-of-its-kind screener dedicated solely to RSI divergence, designed especially for crypto volatility.
Efficient screening of up to eight assets and multiple timeframes in one compact dashboard.
Intuitive iconography, color logic, and table layouts optimized for rapid decision-making.
Advanced input group design for fine-tuning indicator settings per symbol, timeframe, and source.
How to Use
Select up to eight cryptocurrency symbols to screen for divergence signals.
Assign individual timeframes and source prices for each asset to customize analysis.
Set Fast RSI and Slow RSI lengths according to your preferred strategy (e.g., scalping, swing, or trend following).
Review the screener table: colored cells highlight actionable bullish (green) and bearish (red) divergences.
Confirm trade setups with additional indicators or price action for robust risk management.
Customization
Symbols: Choose any crypto pair or ticker for dynamic divergence tracking.
Timeframes: Scan across 1m, 5m, 10m, 30m, and more for full market coverage.
RSI lengths: Configure Fast and Slow RSI periods based on volatility and trading style.
Visuals: Tailor table colors, fonts, and alert backgrounds per your preference.
Conclusion
The RSI Divergence Screener is a versatile, original TradingView indicator that empowers traders to scan, compare, and act on divergence signals with speed and precision. Its multi-symbol design, robust logic, and extensive customization options set a new standard for market screening tools. Integrate it into your crypto trading process to capture actionable opportunities ahead of the crowd and optimize your technical analysis workflow.

RSI (8 & 13) + Fibonacci LevelsIndicator Description: RSI (8 & 13) + Fibonacci Levels
This custom indicator is designed to provide a dual-speed RSI framework with embedded Fibonacci retracement levels for advanced momentum and reversal analysis. It combines the power of relative strength measurement with the natural harmony of Fibonacci ratios to give traders a structured approach to market timing and confluence trading.
The indicator plots two RSI lines on a dedicated sub-chart:
RSI Fast (8) → short-term momentum, highly sensitive to price action, helps identify quick shifts and micro-trends.
RSI Slow (13) → smoother and less volatile, acts as confirmation of broader trend direction and underlying strength.
By combining both RSI speeds, traders can spot alignment, divergences, and crossover signals between fast and slow momentum. When both lines move in sync, it reflects strong conviction; when they diverge, it signals potential exhaustion or trend shifts.
Overlaying Fibonacci retracement levels on RSI adds an extra dimension of precision. Instead of using arbitrary zones, the indicator relies on mathematically significant levels tied to natural market cycles:
23.6% → shallow pullbacks, early momentum pauses.
38.2% → minor retracements, often signaling trend continuation.
50% → balance point between strength and weakness.
61.8% → golden ratio, strong correction or reversal zone.
78.6% → deep retracement, last line before full reversal.
In addition, the script marks the classic RSI boundaries:
70 (Overbought) → potential profit-taking, stretched bullish conditions.
30 (Oversold) → potential accumulation, stretched bearish conditions.
Together, these zones help traders gauge not only when the RSI is “too high” or “too low,” but also where price momentum aligns with natural Fibonacci retracement zones. This approach transforms RSI from a simple oscillator into a multi-layered momentum map.
Practical Uses:
Trend Confirmation → When RSI(8) and RSI(13) are both above 50 and rising, bullish strength is confirmed.
Divergence Detection → If price makes higher highs but RSI(8) fails to confirm, it warns of weakening momentum.
Reversal Hunting → Look for RSI rejection candles at Fib levels (e.g., fast RSI hitting 61.8 and rolling over).
Entry/Exit Timing → Use fast RSI crossovers with slow RSI as tactical entries within the broader structure.
Confluence Trading → Strong signals occur when RSI rejection coincides with price structure (double tops/bottoms, Fibonacci levels on chart, Bollinger Band rejections).
This indicator is especially powerful when paired with Bollinger Bands or price action rejection patterns, creating a system where price extremes are validated against RSI Fib zones.
Ultimately, the RSI (8 & 13) + Fibonacci Levels indicator acts as a precision filter — helping traders separate noise from genuine turning points and reinforcing entries/exits with multiple layers of confluence.

RSI Pivots with Divergence Overlay█ OVERVIEW
The RSI Pivots with Divergence Overlay indicator is an advanced tool based on RSI, displaying dynamic bands on the price chart to simplify the identification of overbought and oversold conditions. Pivot points and divergences between them are derived from these bands, providing a comprehensive view of the market and enabling the creation of various trading strategies based on this single indicator.
█ CONCEPTS
Areas where RSI exits the bands are often reversal points in the market. The concept of this indicator is to highlight places where the probability of a trend reversal increases. Therefore, pivots and divergences have been added to better identify these key moments. Additionally, the bands allow viewing the market context in relation to the RSI indicator, facilitating analysis of momentum and volatility.
█ KEY FEATURES
Dynamic Bands and RSI Signals: The bands are calculated based on the closing price and RSI value, with dynamic scaling adjusted to market volatility. The upper band corresponds to overbought levels, the lower to oversold, and the midline is their average. The price level relative to the bands serves as a visual RSI signal, indicating potential overbought or oversold conditions.
Pivot Points: The indicator identifies local price highs and lows in relation to RSI levels. The pivot level is taken from the high/low of the candle. A high pivot is detected when the high of the candle reaches a local maximum after crossing the upper RSI level (overbought), signaling a potential reversal. A low pivot appears after a local price minimum following a drop below the lower RSI level (oversold), indicating a possible uptrend reversal. The pivot length (default 2 bars) defines the search range for these extremes, meaning that with a length of 2, a potential divergence signal will appear with a 2-candle delay, as this is the minimum time required to confirm a local pivot. Pivot lines are drawn on the chart, and labels display the RSI value (from the close of the candle) and price at the detection moment. Pivot lines disappear after the detection of the next low pivot for lower lines and high pivot for upper lines, but unbreached lines or those with high volume may still serve as support or resistance levels.
Divergence Detection: The indicator automatically detects divergences to predict trend changes. Bearish divergence occurs when the price forms a higher high pivot, but the RSI (from the close of the candle) is lower than in the previous pivot, indicating weakening upward momentum and a potential bearish reversal. Bullish divergence appears when the price forms a lower low pivot, but the RSI is higher, suggesting building momentum and a possible bullish reversal. Divergences are marked in pivot labels (e.g., "Bear Div" or "Bull Div") and supported by alerts upon detection.
Return Signals: The indicator generates buy and sell signals based on RSI (price) returning to the bands after extreme conditions, independently of pivots and divergences. A buy signal is triggered when RSI (price) crosses above the lower level (exiting oversold), suggesting a potential price rise toward the midline or upper band. A sell signal occurs when RSI (price) falls below the upper level (exiting overbought), indicating a possible price drop toward the lower band. Signals are visualized as arrows (up/down triangles) on the chart, with customizable colors.
█ CONFIGURATION
The indicator offers extensive customization options:
RSI Length (rsiLength): Sets the number of periods used to calculate RSI (default 14).
RSI Upper Level (rsiUpper): Defines the overbought threshold (default 70).
RSI Lower Level (rsiLower): Defines the oversold threshold (default 30).
Band Scaling (scale): Determines the scaling multiplier for bands based on market volatility (default 15.0).
SMA Length for Candle Midpoint (length): Number of periods for calculating the moving average of candle midpoints (default 200). This parameter is used to smooth price data, enabling more accurate volatility assessment and band width adjustment to market dynamics.
Pivot Length (pivotLength): Sets the range (in bars) for detecting local price extremes (default 2).
Pivot Label Offset (pivotLabelOffset): Multiplier for the candle range to position pivot labels (default 0.3).
Show Bands (showBands): Enables/disables the display of bands on the chart.
Show Fill (showFill): Enables/disables the fill between bands and the midline.
Show Pivot Lines (showPivotLines): Enables/disables pivot lines on the chart.
Show Pivot Labels (showPivotLabels): Enables/disables labels with RSI and price values at pivots.
Show Return Signals (showReturnSignals): Enables/disables the display of buy and sell signals.
Colors and Style: Customizable colors for bands, fills, pivot lines, labels, and line widths (default 1).
█ USAGE
The indicator performs best when combined with other technical analysis tools, such as Fibonacci levels, moving averages, or trendlines, to confirm pivot, divergence, and return signals. It enables traders to identify key reversal points, detect hidden trend weaknesses through divergences, and confirm trade entries with return signals.
Usage Examples:
Price bounces off a previous pivot with high volume – this increases the probability of a trend change or correction.
A similar situation when RSI is outside the bands strengthens the signal.
If divergence occurs in addition, we have further confirmation.
This can be combined with Fibonacci levels to check if Fibo zones overlap with pivot lines – this may increase the chance of a strong price reaction.
█ ALERTS
The indicator supports alerts for:
Buy and sell signals (RSI returning to bands).
Detection of bearish and bullish divergences.

RSI Divergence ProjectionRSI Divergence Projection
Go beyond traditional, lagging indicators with this advanced RSI Divergence tool. It not only identifies four types of confirmed RSI divergence but also introduces a unique, forward-looking engine. This engine spots potential divergences as they form on the current candle and then projects the exact price threshold required to validate them.
Our core innovation is the Divergence Projection Line, a clean, clutter-free visualization that extends this calculated price target into the future, providing a clear and actionable level for your trading decisions.
The Core Logic: Understanding RSI Divergence
For those new to the concept, RSI Divergence is a powerful tool used to spot potential market reversals or continuations. It occurs when the price of an asset is moving in the opposite direction of the Relative Strength Index (RSI). This indicator automatically detects and plots four key types:
Regular Bullish Divergence: Price prints a lower low, but the RSI prints a higher low. This often signals that bearish momentum is fading and a potential reversal to the upside is near.
Hidden Bullish Divergence: Price prints a higher low, but the RSI prints a lower low. This is often seen in an uptrend and can signal a continuation of the bullish move.
Regular Bearish Divergence: Price prints a higher high, but the RSI prints a lower high. This suggests that bullish momentum is weakening and a potential reversal to the downside is coming.
Hidden Bearish Divergence: Price prints a lower high, but the RSI prints a higher high. This is often seen in a downtrend and can signal a continuation of the bearish move.
Confirmed divergences are plotted with solid-colored lines on the price chart and marked with a "B" (Bearish/Bullish) or "HB" (Hidden Bearish/Hidden Bullish) label.
The Core Innovation: The Divergence Projection
This is where the indicator truly shines and sets itself apart. Instead of waiting for a pivot point to be confirmed, our engine analyzes the current, unclosed candle.
Potential Divergence Detection: When the indicator notices that the current price and RSI are setting up for a potential divergence against the last confirmed pivot, it will draw a dashed line on the chart. This gives you a critical head-start before the signal is confirmed.
The Projection Line (Our Innovation): This is the game-changer. Rather than cluttering your chart with messy labels, the indicator calculates the exact closing price the next candle needs to achieve to make the current RSI level equal to the RSI of the last pivot.
It then projects a clean, horizontal dashed line at this price level into the future.
Attached to the end of this line is a single, consolidated label that tells you the type of potential divergence and the exact threshold price.
This unique visualization transforms a vague concept into a precise, actionable price target, completely free of chart clutter.
How to Use This Indicator
1. Trading Confirmed Divergences:
Look for the solid lines and the "B" or "HB" labels that appear after a candle has closed and a pivot is confirmed.
A Regular Bullish divergence can be an entry signal for a long position, often placed after the confirmation candle closes.
A Regular Bearish divergence can be an entry signal for a short position.
Hidden Divergences can be used as confirmation to stay in a trade or to enter a trade in the direction of the prevailing trend.
2. Using the Divergence Projection for a Tactical Advantage:
When a dashed line appears on the current price action, you are seeing a potential divergence in real-time.
Look to the right of the current candle for the Projection Line. The price level of this line is your key level to watch.
Example (Potential Bullish Divergence): You see a dashed green line forming from a previous low to the current lower low. To the right, you see a horizontal line projected with a label: "Potential Bull Div | Thresh: 10,750.50".
Interpretation: This means that if the next candle closes below 10,750.50, the RSI will not be high enough to form a divergence. However, if the price pushes up and the next candle closes above 10,750.50, the bullish divergence remains intact and is more likely to be confirmed. This gives you a concrete price level to monitor for entry or exit decisions.
How the Projection Engine Works: A Deeper Dive
To fully trust this tool, it's helpful to understand the logic behind it. The projection engine is not based on guesswork or repainting; it's based on a precise mathematical reverse-engineering of the RSI formula.
The Concept: The engine calculates the "tipping point." The Threshold Price is the exact closing price at which the new RSI value would be identical to the RSI value of the previous pivot point. It answers the question: "For this potential divergence to remain valid, where does the next candle need to close?"
The Technicals: The script takes the target RSI from the last pivot, reverse-engineers the formula to find the required average gain/loss ratio, and then solves for the one unknown variable: the gain or loss needed on the next candle. This required price change is then added to or subtracted from the previous close to determine the exact threshold price.
This calculation provides the precise closing price needed to hit our target, which is then plotted as the clean and simple Projection Line on your chart.
Features and Customization
- RSI Settings: Adjust the RSI period and source.
- Divergence Detection: Fine-tune the pivot lookback periods and the min/max range for detecting divergences.
- Price Source: Choose whether to detect divergences using candle Wicks or Bodies.
- Display Toggles: Enable or disable any of the four divergence types, as well as the entire projection engine, to keep your chart as clean as you need it.
Summary of Advantages
- Proactive Signals: Get ahead of the market by seeing potential divergences before they are confirmed.
- Unprecedented Clarity: Our unique Projection Line eliminates chart clutter from overlapping labels.
- Actionable Data: The threshold price provides a specific, objective level to watch, removing guesswork.
- Fully Customizable: Tailor the indicator's settings to match any timeframe or trading strategy.
- All-in-One Tool: No need for a separate RSI indicator; everything you need is displayed directly and cleanly on the price action.
We hope this tool empowers you to make more informed and timely trading decisions. Happy trading

RSI with Trend LinesThe RSI with Trend Lines indicator is a tool designed to analyze the behavior of the Relative Strength Index (RSI) combined with dynamic trend lines. This indicator not only provides the standard RSI reading but also identifies pivot points on the RSI and draws bullish and bearish trend lines based on these points. It also includes customizable options for adjusting trend lines, displaying the RSI moving average, and highlighting key levels such as overbought, oversold, and the center line.
This indicator is ideal for finding and identifying clear trends in the RSI and taking advantage of market breakout or consolidation signals. It also includes a table with the POC value, which represents the price level at which the most trading activity has occurred, indicating the highest liquidity and highest trading volume.
Key Features:
1. Basic RSI:
• Calculates the RSI using a configurable period length (default 14).
• Colors the RSI based on its direction (green for rising, red for falling) and its position relative to the center line (50).
2. Key Levels:
• Displays overbought (70 and 80), oversold (20 and 30), and the center line (50) levels for easy visual interpretation.
3. RSI Moving Average:
• Enables and configures an RSI moving average (SMA, EMA, WMA, or ALMA) to smooth out fluctuations and detect clearer trends.
4. Dynamic Trend Lines:
• Identifies pivot points on the RSI and draws bullish and bearish trend lines.
• Trend lines can be extended into the future or limited to the visible range.
• Includes options to display broken lines (trends that are no longer valid) and customize the style (solid or dashed).
5. Pivot Points:
• Displays the high and low pivot points on the chart for a better understanding of trend changes.
6. Advanced Customization:
• Adjust the pivot point period.
• Control the number of pivot points to consider for trend lines.
• Customize the line thickness and style.
How to Use the Indicator:
1. RSI Interpretation:
• Overbought Zone (RSI > 70): Indicates that the asset may be overvalued and could correct downward.
• Oversold Zone (RSI < 30): Suggests that the asset may be undervalued and could rebound.
• Centerline Crossover (50): A cross above 50 indicates bullish strength, while a cross below suggests weakness.
2. Trend Lines:
• Bullish Lines: Drawn when the RSI forms ascending low pivot points. These lines represent dynamic support.
• Bearish Lines: These are drawn when the RSI forms descending high pivot points. These lines represent dynamic resistance.
• Broken Lines: When a trend line becomes invalid (the RSI breaks the line), they are displayed in a dotted style to highlight the breakout.
3. Possible Trading Signals:
• Buy: When the RSI breaks an upward downtrend line.
• Sell: When the RSI breaks a downward uptrend line.
• Trend Confirmation: When the RSI stays within a valid trend line, it suggests that the current trend is strong.
4. A chart with the POC value:
• The point of control is a price level at which the highest trading volume occurs in a given time period. It is a key component of the Volume Profile indicator, which displays volume by price.
• Use of the POC in trading:
• The POC is used to identify areas of high interest and liquidity for trading.
• The POC provides information about the equilibrium point where buyers and sellers are most evenly matched.
• Therefore, it can be considered a zone of interest, meaning it can act as support or resistance.

RSI Crossover dipali parikhThis script generates buy and sell signals based on the crossover of the Relative Strength Index (RSI) and the RSI-based Exponential Moving Average (EMA). It also includes an additional condition for both buy and sell signals that the RSI-based EMA must be either above or below 50.
Key Features:
Buy Signal: Triggered when:
The RSI crosses above the RSI-based EMA.
The RSI-based EMA is above 50.
A green "BUY" label will appear below the bar when the buy condition is met.
Sell Signal: Triggered when:
The RSI crosses below the RSI-based EMA.
The RSI-based EMA is below 50.
A red "SELL" label will appear above the bar when the sell condition is met.
Customizable Inputs:
RSI Length: Adjust the period for calculating the RSI (default is 14).
RSI-based EMA Length: Adjust the period for calculating the RSI-based EMA (default is 9).
RSI Threshold: Adjust the threshold (default is 50) for when the RSI-based EMA must be above or below.
Visuals:
The RSI is plotted as a blue line.
The RSI-based EMA is plotted as an orange line.
Buy and sell signals are indicated by green "BUY" and red "SELL" labels.
Alerts:
Alerts can be set for both buy and sell conditions to notify you when either condition is met.
How to Use:
Use this script to identify potential buy and sell opportunities based on the behavior of the RSI relative to its EMA.
The buy condition indicates when the RSI is strengthening above its EMA, and the sell condition signals when the RSI is weakening below its EMA.
Strategy Use:
Ideal for traders looking to leverage RSI momentum for entering and exiting positions.
The RSI-based EMA filter helps smooth out price fluctuations, focusing on stronger signals.
This script is designed for both discretionary and algorithmic traders, offering a simple yet effective method for spotting trend reversals and continuation opportunities using RSI.

RSI + Normalized Fisher Transform with SignalsThis indicator combines three tools for market analysis: the Relative Strength Index (RSI), the RSI's moving average, and the Fisher Transform. RSI is a momentum oscillator that measures the speed and change of price movements, helping identify overbought and oversold conditions. The RSI moving average is a smoothed version of the RSI that filters noise and confirms trends. The Fisher Transform is a mathematical technique that transforms price data into a Gaussian normal distribution, making it easier to identify turning points. It has been normalized to the same scale as the RSI (0-100) for consistency.
Purpose
The goal of this indicator is to identify potential buy and sell opportunities with varying degrees of strength (strong and weak). By combining the RSI, its moving average, and the Fisher Transform, the indicator ensures signals are based on both momentum and reversals, making it highly versatile across different market conditions.
Key Features
This indicator provides strong and weak buy and sell signals. A strong buy occurs when the RSI crosses above its moving average while both the RSI and its moving average are oversold (below the default threshold of 30), and the Fisher Transform reverses direction within the same or prior bar while also being oversold. A weak buy occurs when the Fisher Transform is oversold, and the RSI crosses above its moving average while its value is between the default oversold threshold (30) and 50. A strong sell occurs when the RSI crosses below its moving average while both the RSI and its moving average are overbought (above the default threshold of 70), and the Fisher Transform reverses direction within the same or prior bar while also being overbought. A weak sell occurs when the Fisher Transform is overbought, and the RSI crosses below its moving average while its value is between 50 and the default overbought threshold (70).
The indicator includes customizable thresholds and lengths. Users can adjust the oversold and overbought thresholds to suit their trading style. The RSI length, moving average length, and Fisher Transform length are also customizable. The Fisher Transform is scaled to the RSI’s range of 0-100 to simplify analysis and signal interpretation.
How to Use the Indicator
On the chart, you will see the RSI line in blue, the RSI moving average in orange, and the Fisher Transform in purple. Horizontal lines at the default oversold (30) and overbought (70) levels mark critical zones for signals. Adjust these thresholds in the indicator settings as needed.
Strong buy signals are shown as larger, darker green arrows below the price. Weak buy signals are small lime arrows below the price. Strong sell signals are larger, darker red arrows above the price. Weak sell signals are small fuchsia arrows above the price.
Signal Interpretation
A strong buy indicates a highly favorable buying opportunity. This typically occurs when the asset is in a downtrend but shows signs of reversal, particularly in oversold zones. A weak buy suggests a potential buying opportunity but with less conviction, often when the market is neutral to slightly bearish but showing upward momentum. A strong sell indicates a highly favorable selling opportunity, usually occurring when the asset is in an uptrend but shows signs of reversal, particularly in overbought zones. A weak sell suggests a potential selling opportunity but with less conviction, often in neutral to slightly bullish markets showing downward momentum.
Practical Tips
Avoid using signals in isolation. Combine this indicator with other tools such as trendlines, moving averages, or support/resistance levels for greater accuracy. Adjust the parameters for different assets to match their volatility. For volatile assets, consider wider thresholds like 20/80 for oversold/overbought levels. For less volatile assets, tighter thresholds like 35/65 may be more appropriate. Use higher timeframes to confirm signals before trading on lower timeframes. Be cautious in sideways markets, as both RSI and the Fisher Transform perform better in trending conditions.
Instructions for Adjustments
To change the oversold or overbought levels, open the indicator settings by clicking the gear icon and modify the "Oversold Threshold" and "Overbought Threshold" values. To adjust lengths for RSI and Fisher Transform, update the "RSI Length," "RSI Moving Average Length," and "Fisher Transform Length" settings. If needed, toggle signal visibility by enabling or disabling specific arrows (Strong Buy, Weak Buy, Strong Sell, Weak Sell) in the "Style" tab.
Best Practices
Risk management is essential. Always set appropriate stop-loss levels and position sizes based on your risk tolerance. Backtest the indicator on historical data to understand its performance and behavior for your chosen asset and timeframe. Combining this indicator with volume or volatility analysis (Bollinger Band Width, for example) can help confirm signal validity.
This indicator simplifies decision-making by identifying high-probability trading opportunities using a combination of momentum, trend, and reversals. Follow these instructions to fully utilize its capabilities without needing to analyze the underlying code.

RSI with Dynamic ColorsThe "RSI with Dynamic Colors" is a custom indicator built on top of the traditional Relative Strength Index (RSI), which helps traders identify overbought or oversold market conditions. This enhanced version includes added functionality like dynamic colors, highlighting specific conditions, and more customization options. Here's a breakdown of how this indicator works:
Indicator Components:
Relative Strength Index (RSI) Calculation:
The RSI is a momentum oscillator that measures the speed and change of price movements. It oscillates between 0 and 100, helping traders determine if an asset is overbought or oversold.
In this version, the RSI is calculated with a configurable lookback period (default is 14) and applies smoothing to both upward and downward price changes using the Relative Moving Average (RMA).
Dynamic Coloring:
The indicator dynamically changes the color of the RSI line based on its value. Specific thresholds include:
Blue: When the RSI is at or above an extreme overbought level (≥ 85).
Red: When the RSI is in the overbought zone (≥ 70 but < 85).
Yellow: When the RSI is at or below the extreme oversold level (≤ 15).
Green: When the RSI is in the oversold zone (≤ 30 but > 15).
White: When the RSI is between the oversold and overbought zones.
Moving Average Options (MA):
The indicator allows the user to plot an optional moving average of the RSI for additional trend confirmation. Users can select from various types of moving averages, including Simple Moving Average (SMA), Exponential Moving Average (EMA), and others.
Bollinger Bands can be optionally applied around the RSI to visualize volatility.
Overbought and Oversold Highlights:
It provides visual highlights (green for overbought and red for oversold) in the background of the RSI plot, making it easier to identify potential reversal zones.
Divergence Detection (Optional):
The indicator can optionally display regular bullish or bearish divergence, which can signal potential trend reversals. Divergence occurs when price moves in the opposite direction of the RSI.
Bullish divergence is indicated when the price makes lower lows while the RSI makes higher lows.
Bearish divergence is shown when the price makes higher highs while the RSI makes lower highs.
Alerts:
Users can set up alerts for bullish or bearish divergence, making it easier to get notified when key conditions occur in the market.
Use Case:
This custom RSI indicator is designed for traders who want to combine the classic RSI functionality with enhanced visual aids, such as color coding for different RSI zones, customizable moving averages, and Bollinger Bands. It is particularly useful for identifying potential market tops and bottoms by highlighting overbought/oversold conditions and divergence signals.
In summary, this indicator not only retains the traditional RSI's power but also adds new layers of insight through color, moving averages, and divergence detection, helping traders make better-informed decisions.

RSI Multi-Timeframe PINESCRIPTLABS📈 Use the Relative Strength Index (RSI) calculated across multiple time frames to generate signals
🔹 Intraday: Displays a table with real-time RSI values for the time frames of 5 minutes, 15 minutes, 30 minutes, 1 hour, 4 hours, and 1 day.
🔹 Standard: Displays a table with real-time RSI values for the time frames of 30 minutes, 1 hour, 4 hours, 1 day, 1 week, and 1 month.
The indicator allows you to customize overbought and oversold thresholds, as well as choose between viewing RSI values for intraday or standard time frames, tailoring the analysis to your specific needs. 🔧📊
🔔 Signals are generated when in 4 of the 6 time frames we define below:
Overbought Signal (When RSI indicates overbought conditions):
• Intraday: Activated when the RSI in the time frames of 5 minutes, 15 minutes, 30 minutes, and 1 hour is above the 70 threshold. 📈
• Standard: Activated when the RSI in the time frames of 30 minutes, 1 hour, 4 hours, and 1 day is above the 70 threshold. 📈
Oversold Signal (When RSI indicates oversold conditions):
• Intraday: Activated when the RSI in the time frames of 5 minutes, 15 minutes, 30 minutes, and 1 hour is below the 30 threshold. 📉
• Standard: Activated when the RSI in the time frames of 30 minutes, 1 hour, 4 hours, and 1 day is below the 30 threshold. 📉
Español:
📈 Utiliza el Índice de Fuerza Relativa (RSI) calculado en varios marcos de tiempo para generar señales
🔹 Intraday: Muestra una tabla con los valores del RSI en tiempo real para los marcos de tiempo de 5 minutos, 15 minutos, 30 minutos, 1 hora, 4 horas y 1 día.
🔹 Standard: Muestra una tabla con los valores del RSI en tiempo real para los marcos de tiempo de 30 minutos, 1 hora, 4 horas, 1 día, 1 semana y 1 mes.
El indicador te permite personalizar los umbrales de sobrecompra y sobreventa, así como elegir entre ver los valores RSI para marcos de tiempo intradía o estándar, adaptando el análisis a tus necesidades específicas. 🔧📊
🔔 Las señales se generan cuando en 4 de los 6 marcos de tiempo que definimos a continuación:
Señal de Sobrecompra (Cuando el RSI indica sobrecompra):
• Intraday: Se activa cuando el RSI en los marcos de tiempo de 5 minutos, 15 minutos, 30 minutos y 1 hora está por encima del umbral de 70. 📈
• Standard: Se activa cuando el RSI en los marcos de tiempo de 30 minutos, 1 hora, 4 horas y 1 día están por encima del umbral de 70. 📈
Señal de Sobreventa (Cuando el RSI indica sobreventa):
• Intraday: Se activa cuando el RSI en los marcos de tiempo de 5 minutos, 15 minutos, 30 minutos y 1 hora está por debajo del umbral de 30. 📉
• Standard: Se activa cuando el RSI en los marcos de tiempo de 30 minutos, 1 hora, 4 horas y 1 día están por debajo del umbral de 30. 📉

RSI Overlay Table - 30 Tickers Sorted with ColorOverview
The RSI Overlay Table script provides traders with a powerful tool to monitor the Relative Strength Index (RSI) across multiple tickers in real-time. This script enables users to keep track of up to 30 different assets simultaneously, displaying their RSI values in an easy-to-read table format directly on the chart. It helps traders identify overbought and oversold conditions quickly, enhancing their ability to make informed trading decisions.
Key Features
Monitor Multiple Tickers: Track the RSI values of up to 30 different tickers at once. This allows users to have a broad view of market conditions across various assets without the need to switch between charts.
Dynamic RSI Calculations: The script calculates the RSI using the user-defined length, providing flexibility to adjust sensitivity based on the trading strategy. The default RSI length is set to 14, a commonly used period in technical analysis.
Customizable Overbought and Oversold Levels: Users can define their own overbought and oversold RSI levels, allowing them to tailor the script to their trading style. By default, the overbought level is set at 70, and the oversold level is set at 30.
Hide Neutral Rows Option: To help traders focus on the most critical signals, the script includes an option to hide rows where the RSI values are neither overbought nor oversold. This feature helps traders concentrate on assets that are more likely to experience a price reversal.
Color-Coded Alerts: The script highlights overbought and oversold conditions with distinct colors:
Red: Indicates that the asset is overbought (RSI above the user-defined overbought level).
Green: Indicates that the asset is oversold (RSI below the user-defined oversold level).
How to Use the RSI Overlay Table Script
Input Tickers: Enter up to 30 ticker symbols in the script settings. The script will automatically fetch the RSI values for each ticker and display them in the overlay table on the chart.
Adjust RSI Settings: Modify the RSI length and the overbought/oversold levels according to your trading strategy. These settings can be adjusted in the script input panel.
Use the Hide Neutral Rows Option: Toggle the “Hide Neutral Rows” option to focus only on tickers that are in overbought or oversold conditions. This feature is useful for traders who wish to filter out less significant signals and only act on strong RSI indicators.
Interpret the Table: The table will display each ticker symbol alongside its current RSI value. Tickers with RSI values above the overbought level will be highlighted in red, suggesting a potential sell signal. Tickers with RSI values below the oversold level will be highlighted in green, indicating a potential buy signal.
Application and Strategy
The RSI Overlay Table script is designed for traders who manage multiple assets and need to monitor their technical indicators efficiently. It is particularly useful for:
Swing Traders: Identifying overbought and oversold conditions to time entries and exits.
Portfolio Managers: Monitoring the relative strength of various assets in a portfolio.
Scalpers: Quickly spotting extreme price movements across multiple assets.
Notes
This script is intended to be used as a supplementary tool for technical analysis. Always use it in conjunction with other indicators and market analysis techniques.
The RSI values and signals provided by this script should not be taken as financial advice.
The RSI Overlay Table script provides a clear and efficient way to track RSI values across multiple assets, helping traders make more informed decisions. By offering customizable settings and a clean, color-coded interface, this tool aims to enhance the user's trading experience and streamline their analysis process.

RSI & Backed-Weighted MA StrategyRSI & MA Strategy :
INTRODUCTION :
This strategy is based on two well-known indicators that work best together: the Relative Strength Index (RSI) and the Moving Average (MA). We're going to use the RSI as a trend-follower indicator, rather than a reversal indicator as most are used to. To the signals sent by the RSI, we'll add a condition on the chart's MA, filtering out irrelevant signals and considerably increasing our winning rate. This is a medium/long-term strategy. There's also a money management method enabling us to reinvest part of the profits or reduce the size of orders in the event of substantial losses.
RSI :
The RSI is one of the best-known and most widely used indicators in trading. Its purpose is to warn traders when an asset is overbought or oversold. It was designed to send reversal signals, but we're going to use it as a trend indicator by increasing its length to 20. The RSI formula is as follows :
RSI (n) = 100 - (100 / (1 + (H (n)/L (n))))
With n the length of the RSI, H(n) the average of days closing above the open and L(n) the average of days closing below the open.
MA :
The Moving Average is also widely used in technical analysis, to smooth out variations in an asset. The SMA formula is as follows :
SMA (n) = (P1 + P2 + ... + Pn) / n
where n is the length of the MA.
However, an SMA does not weight any of its terms, which means that the price 10 days ago has the same importance as the price 2 days ago or today's price... That's why in this strategy we use a RWMA, i.e. a back-weighted moving average. It weights old prices more heavily than new ones. This will enable us to limit the impact of short-term variations and focus on the trend that was dominating. The RWMA used weights :
The 4 most recent terms by : 100 / (4+(n-4)*1.30)
The other oldest terms by : weight_4_first_term*1.30
So the older terms are weighted 1.30 more than the more recent ones. The moving average thus traces a trend that accentuates past values and limits the noise of short-term variations.
PARAMETERS :
RSI Length : Lenght of RSI. Default is 20.
MA Type : Choice between a SMA or a RWMA which permits to minimize the impact of short term reversal. Default is RWMA.
MA Length : Length of the selected MA. Default is 19.
RSI Long Signal : Minimum value of RSI to send a LONG signal. Default is 60.
RSI Short signal : Maximum value of RSI to send a SHORT signal. Default is 40.
ROC MA Long Signal : Maximum value of Rate of Change MA to send a LONG signal. Default is 0.
ROC MA Short signal : Minimum value of Rate of Change MA to send a SHORT signal. Default is 0.
TP activation in multiple of ATR : Threshold value to trigger trailing stop Take Profit. This threshold is calculated as multiple of the ATR (Average True Range). Default value is 5 meaning that to trigger the trailing TP the price need to move 5*ATR in the right direction.
Trailing TP in percentage : Percentage value of trailing Take Profit. This Trailing TP follows the profit if it increases, remaining selected percentage below it, but stops if the profit decreases. Default is 3%.
Fixed Ratio : This is the amount of gain or loss at which the order quantity is changed. Default is 400, which means that for each $400 gain or loss, the order size is increased or decreased by a user-selected amount.
Increasing Order Amount : This is the amount to be added to or subtracted from orders when the fixed ratio is reached. The default is $200, which means that for every $400 gain, $200 is reinvested in the strategy. On the other hand, for every $400 loss, the order size is reduced by $200.
Initial capital : $1000
Fees : Interactive Broker fees apply to this strategy. They are set at 0.18% of the trade value.
Slippage : 3 ticks or $0.03 per trade. Corresponds to the latency time between the moment the signal is received and the moment the order is executed by the broker.
Important : A bot has been used to test the different parameters and determine which ones maximize return while limiting drawdown. This strategy is the most optimal on BITSTAMP:ETHUSD with a timeframe set to 6h. Parameters are set as follows :
MA type: RWMA
MA Length: 19
RSI Long Signal: >60
RSI Short Signal : <40
ROC MA Long Signal : <0
ROC MA Short Signal : >0
TP Activation in multiple ATR : 5
Trailing TP in percentage : 3
ENTER RULES :
The principle is very simple:
If the asset is overbought after a bear market, we are LONG.
If the asset is oversold after a bull market, we are SHORT.
We have defined a bear market as follows : Rate of Change (20) RWMA < 0
We have defined a bull market as follows : Rate of Change (20) RWMA > 0
The Rate of Change is calculated using this formula : (RWMA/RWMA(20) - 1)*100
Overbought is defined as follows : RSI > 60
Oversold is defined as follows : RSI < 40
LONG CONDITION :
RSI > 60 and (RWMA/RWMA(20) - 1)*100 < -1
SHORT CONDITION :
RSI < 40 and (RWMA/RWMA(20) - 1)*100 > 1
EXIT RULES FOR WINNING TRADE :
We have a trailing TP allowing us to exit once the price has reached the "TP Activation in multiple ATR" parameter, i.e. 5*ATR by default in the profit direction. TP trailing is triggered at this point, not limiting our gains, and securing our profits at 3% below this trigger threshold.
Remember that the True Range is : maximum(H-L, H-C(1), C-L(1))
with C : Close, H : High, L : Low
The Average True Range is therefore the average of these TRs over a length defined by default in the strategy, i.e. 20.
RISK MANAGEMENT :
This strategy may incur losses. The method for limiting losses is to set a Stop Loss equal to 3*ATR. This means that if the price moves against our position and reaches three times the ATR, we exit with a loss.
Sometimes the ATR can result in a SL set below 10% of the trade value, which is not acceptable. In this case, we set the SL at 10%, limiting losses to a maximum of 10%.
MONEY MANAGEMENT :
The fixed ratio method was used to manage our gains and losses. For each gain of an amount equal to the value of the fixed ratio, we increase the order size by a value defined by the user in the "Increasing order amount" parameter. Similarly, each time we lose an amount equal to the value of the fixed ratio, we decrease the order size by the same user-defined value. This strategy increases both performance and drawdown.
Enjoy the strategy and don't forget to take the trade :)

RSI + Divergences + Alerts [MisterMoTA]The indicator RSI + Divergences + Alerts by MisterMoTA is an RSI indicator that fills the RSI and RSI moving average with 4 different colors (growing up, falling up, falling down and rising down colors), users can customize colors from dashboard , also can be disabled the fill if the user want a standard RSI.
The dafault value of RSI is 14 and value of the moving average is 50 ( a dynamic 50 rsi line is better for trend identification than a standard 50 line) and users can change the values from indicator settings.
For detecting the divergences displayed in the indicator, I integrated in our script the default Divergences indicator from Tradingview, users can display, hide and change colors for regular and hidden divergences.
RSI indicator display also trend conditions for RSI and RSI MA, the RSI MA angle is calculated using ATR value, the slope of the RSI Noving Average can help to identify trend conditions too.
The script comes with 12 different alerts, if need different alerts please let me know in the comments and will update the script with your request:
Alert for Regular Bullish Divergence
Alert for Regular Bearish Divergence
Alert for Hidden Bullish Divergence
Alert for Hidden Bearish Divergence
Alert for RSI Overbought
Alert for RSI Extreme Overbought
"Alert for RSI Oversold
Alert for RSI Extreme Oversold
Alert for RSI Crossing Above RSI MA
Alert for RSI Crossing Bellow RSI MA
Alert for RSI Crossing Above 50
Alert for RSI Crossing Bellow 50
Please follow me for other script like this one.
Kind regards,
MisterMoTA

RSI Supreme Multi-Method [MyTradingCoder]Introducing the "RSI Supreme Multi-Method" indicator, a powerful tool that combines the Relative Strength Index (RSI) with selectable manipulation methods to identify overbought and oversold conditions in the market, along with the ability to detect divergences for enhanced trading insights.
The indicator features four distinct manipulation methods for the RSI, each providing valuable insights into market conditions:
1. Standard RSI Method: The indicator uses the traditional RSI calculation to identify overbought and oversold areas.
2. Volatility Weighted RSI Method: This method applies a volatility formula to the RSI calculation, allowing for a more responsive indication of market conditions during periods of heightened volatility. Users can adjust the length of the volatility formula to fine-tune this method.
3. Smoothed RSI Method: The smoothed RSI method utilizes a smoothing algorithm to reduce noise in the RSI values, presenting a clearer representation of overbought and oversold conditions. The length of the smoothing can be adjusted to match your trading preferences.
4. Session Weighted RSI Method: With this innovative method, users can specify multipliers for different time sessions throughout the day to manipulate the base RSI. Each session can be customized with start and end times, enabling or disabling specific sessions, and specifying the multiplier for each session. This feature allows traders to adapt the RSI to different market sessions dynamically.
Additionally, the "RSI Supreme Multi-Method" indicator draws divergences on the oscillator, providing an extra layer of analysis for traders. Divergences occur when the direction of the RSI differs from the direction of the price movement, potentially signaling trend reversals.
Key Settings:
RSI Length: Adjust the length of the base RSI before applying any manipulation.
RSI Source: Determine the data source for the base RSI calculation.
Overbought Value: Set the RSI value at which overbought conditions are indicated.
Oversold Value: Set the RSI value at which oversold conditions are indicated.
RSI Type: Choose from four options: Standard, Smoothed, Volatility Manipulated, or Session Manipulated.
Volatility Manipulated Settings: Adjust the length of the volatility formula (applicable to Volatility Manipulated method).
Smoothed Settings: Adjust the length of the smoothing (applicable to Smoothed method).
Session Manipulated Settings: Customize six different time sessions with start and end times, enable or disable specific sessions, and specify multipliers for each session.
Divergence Color: Adjust the color of the drawn divergences to suit your chart's aesthetics.
Divergence Tuning: Fine-tune the sensitivity of the divergence detection for more accurate signals.
The "RSI Supreme Multi-Method" indicator is a versatile and comprehensive tool that can be used to identify overbought and oversold areas, as well as to spot potential trend reversals through divergences. However, like all technical analysis tools, it should be used in conjunction with other indicators and analysis methods to make well-informed trading decisions.
Enhance your trading insights with the "RSI Supreme Multi-Method" indicator and gain an edge in identifying critical market conditions and divergences with precision.

RSI-CCI Fusion + AlertsThe "RSI-CCI Fusion" indicator combines the Relative Strength Index (RSI) and Commodity Channel Index (CCI) from TradingView.
RSI-CCI Fusion: Unlocking Synergies in Technical Analysis
Technical analysis plays a crucial role in understanding market dynamics and making informed trading decisions. I often rely on a combination of indicators to gain insights into price movements and identify potential trade opportunities. In the lines below, I will explore the "RSI-CCI Fusion" indicator, a powerful tool that combines the strengths of the Relative Strength Index (RSI) and the Commodity Channel Index (CCI) to provide enhanced trading insights.
1. Understanding the RSI and CCI Indicators
Before delving into the fusion of these indicators, let's briefly review their individual characteristics. The RSI is a widely used momentum oscillator that measures the speed and change of price movements. It oscillates between 0 and 100, with readings above 70 indicating overbought conditions and readings below 30 indicating oversold conditions.
On the other hand, the CCI is a versatile indicator designed to identify cyclical trends in prices. It measures the distance between the price and its statistical average, thereby providing valuable insights into overbought and oversold levels.
2. The Concept of RSI-CCI Fusion
The RSI-CCI Fusion indicator is born out of my desire to harness the collective power of the RSI and CCI. By combining these indicators, I can benefit from a more comprehensive trading signal that captures both momentum and cyclical trend dynamics.
The fusion process involves assigning weights to the RSI and CCI, creating a blended indicator that reflects their relative importance. The weighted combination ensures that both indicators contribute meaningfully to the final result.
To maintain consistency, the RSI and CCI values are standardized using the z-score technique. This normalization process brings the values to a common scale, making them directly comparable. Rescaling is then applied to bring the combined indicator back to its original scale, facilitating intuitive interpretation.
3. Interpreting the RSI-CCI Fusion Indicator
When plotting the RSI-CCI Fusion indicator on a chart, I gain valuable insights into market dynamics and potential trading opportunities. The indicator's plot typically includes dynamic upper and lower bands, which are calculated based on the indicator's standard deviation. These bands provide boundaries for evaluating overbought and oversold conditions.
When the RSI-CCI Fusion indicator crosses above the lower band, it suggests oversold conditions and potential buying opportunities. Conversely, when the indicator crosses below the upper band, it indicates overbought conditions and potential selling opportunities. I also pay attention to the baseline, which represents the neutral level and may signal potential trend reversals.
4. Utilizing Alerts for Trading Decisions
The RSI-CCI Fusion indicator can be further enhanced by incorporating alerts. These alerts notify me when the indicator generates buy or sell signals, enabling me to take prompt action. I can customize the alerts based on my preferred thresholds and timeframes.
However, it is crucial to remember that the RSI-CCI Fusion indicator should not be relied upon in isolation. To increase the robustness of my trading decisions, it is recommended to combine the indicator with other analysis techniques such as trend lines, support and resistance levels, or additional indicators. This convergence of analysis methodologies enhances the overall accuracy of my trade signals.
Conclusion: The RSI-CCI Fusion indicator represents a compelling approach to technical analysis by synergizing the strengths of the RSI and CCI. By combining momentum and cyclical trend dynamics, I gain a more comprehensive view of market conditions. The fusion of these indicators, accompanied by timely alerts, equips me with valuable insights and facilitates well-informed trading decisions.
As with any technical analysis tool, it is essential for me to backtest the RSI-CCI Fusion indicator to evaluate its performance across different market conditions and timeframes. Additionally, applying proper risk management strategies is crucial to ensure consistent and disciplined trading practices.
