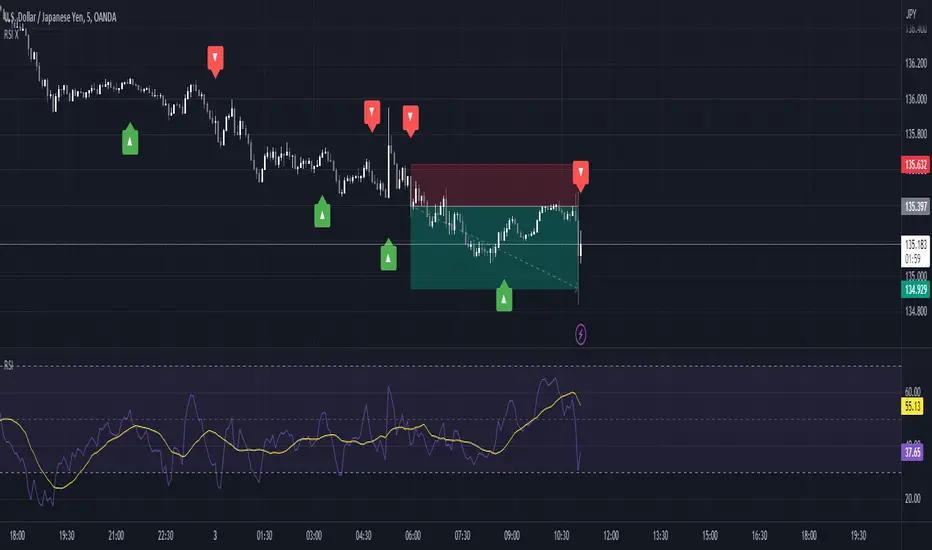
RSI + Stoch/RSIThis is a combination of 2 of the most used indicators. RSI and stochastic/RSI
Ive coded them both to work together to save space on your chart and work as only ONE indicator.
I specifically only use the D line with my rsi , but you have the option to use the K and D line if you so choose.
RSI is good for momentum
Stochastic is good for short term momentum.
They work very well together and if you are a swing trader or scalper they can help immensely when looking for sniper entry areas after you've done you're initial pattern, level, fibonacci and wave analysis.
I like the way this works and have been using these two indicators for a while so I figured I would share.
Happy new year everyone, God bless!
Поиск скриптов по запросу "rsi"
RSI Stochastic Extreme Combo alertThis script will give you red or green columns as an indication for oversold/overbought based upon the rsi and stochastic both being at extreme levels (you set). The default oversold is at 35. If Stochastic and RSI fall below 35, you will get a green column (Both indicators at the extreme). Play with your levels to see how your stock reacts. RSI and Stochastic can both be changed along with each of the levels you would like the color change. I have set mine at RSI low: 37, RSI high: 63, Stoch low: 10, and Stoch high: 90. These levels have been working well for me on AAPL. Enjoy and don't forget to leave a comment if it helps your trading or you have other ideas about what is working for you.

RSI Swing + VWAP + EMA + Camarilla + PDH/PDL+CPRThis script provide the follwing -
1. Daily CPR level
2. Camarilla S3/R3
3. Previous Day High/Low (PDH/PDL)
4. Dynamic VWAP
5. Dynamic EMA 20/200
6. Dynamic RSi Swing
Dec 10
Release Notes
This script provide the follwing -
1. Daily CPR level
2. Camarilla S3/R3
3. Previous Day High/Low (PDH/PDL)
4. Dynamic VWAP
5. Dynamic EMA 20/200/36
6. Dynamic RSi Swing
Which is better: 36 EMA or 36 SMA for Support/Resistance?
✔ 36 EMA (Exponential Moving Average)
Better for intraday, short-term trading, scalping, and momentum trading.
Why?
Reacts faster to price.
Captures trend shifts early.
Works great when market is trending or volatile.
Most traders use EMA for dynamic support/resistance → works better because of crowd behavior.
Ideal for:
NIFTY, BANKNIFTY, FINNIFTY intraday | Options entries | Trend continuation trades.
Why 20 EMA is Important
The 20 EMA is one of the most widely used moving averages for intraday, swing, and positional trading because it captures short-term trend strength and momentum.
📌 20 EMA Works Best For
✔ Intraday trend identification
✔ Momentum continuation entries
✔ Dynamic support/resistance
✔ Quick reversal detection
✔ Options trading (NIFTY/BNF)
✔ Breakout & pullback trades
EMA 200 – Why It’s Extremely Important
The 200 EMA represents the long-term trend and is respected by:
Institutions
Algo systems
Big traders
Swing traders
Index traders
It acts like a major wall of support or resistance.
💡 What EMA 200 Tells You
✔ Long-term trend direction
Price above 200 EMA → Long-term uptrend
Price below 200 EMA → Long-term downtrend
✔ Strong trend reversal signals
When price crosses the 200 EMA on 15m/1h/1D charts → a deeper trend change is possible.
✔ Institutional support/resistance
Very powerful bounce/rejection zones
Many markets reverse exactly at 200 EMA
What is Previous Day High (PDH)?
The highest price the market reached in the previous trading session.
Why PDH is Important?
Acts as strong resistance
Breakout level for uptrend
Sellers often defend this zone
If broken with volume → strong bullish momentum
🔴 What is Previous Day Low (PDL)?
The lowest price the market reached in the previous trading session.
Why PDL is Important?
Acts as strong support
Breakdown level for downtrend
Buyers defend this level
If broken with volume → strong bearish trend
📌 How PDH/PDL Help in Intraday Trading
1️⃣ Range Breakout Trades
If price breaks PDH → bullish breakout (Buy CE)
If price breaks PDL → bearish breakdown (Buy PE)
What is Camarilla R3?
R3 = Resistance Level 3 in the Camarilla Pivot system.
Why R3 is important?
Acts as a major intraday resistance
Price often reverses from R3
If broken with force → strong uptrend starts
Many traders use R3 as a decision zone
Typical Market Behavior at R3
Rejection from R3 → Sell/PE opportunity
Break + Retest above R3 → CE opportunity
🔴 What is Camarilla S3?
S3 = Support Level 3 in the Camarilla Pivot system.
Why S3 is important?
Acts as a major intraday support
Buyers defend this zone
Breakdown of S3 → strong fall
S3 is often a bounce zone in the morning
Typical Market Behavior at S3
Bounce from S3 → Buy/CE opportunity
Break + Retest below S3 → PE opportunity
📌 Trader Logic: R3 & S3 Zones
⭐ 1. Range Reversal Strategy (Most Popular)
At R3 → Sell/PE
At S3 → Buy/CE
What is VWAP?
VWAP = Volume Weighted Average Price
It shows the average price at which most trading has happened during the day, based on both price and volume.
It resets every day at market open.
🔥 Why VWAP Is So Powerful?
VWAP is used by:
Institutions
Algo traders
Scalpers
Intraday traders
Dec 10
Release Notes
This script provide the follwing -
1. Daily CPR level
2. Camarilla S3/R3
3. Previous Day High/Low (PDH/PDL)
4. Dynamic VWAP
5. Dynamic EMA 20/200
6. Dynamic RSi Swing
3 hours ago
Release Notes
This script provide the follwing -
1. Daily CPR level
2. Camarilla S3/R3
3. Previous Day High/Low (PDH/PDL)
4. Dynamic VWAP
5. Dynamic EMA 20/200/36
6. Dynamic RSi Swing
Which is better: 36 EMA or 36 SMA for Support/Resistance?
✔ 36 EMA (Exponential Moving Average)
Better for intraday, short-term trading, scalping, and momentum trading.
Why?
Reacts faster to price.
Captures trend shifts early.
Works great when market is trending or volatile.
Most traders use EMA for dynamic support/resistance → works better because of crowd behavior.
Ideal for:
NIFTY, BANKNIFTY, FINNIFTY intraday | Options entries | Trend continuation trades.
Why 20 EMA is Important
The 20 EMA is one of the most widely used moving averages for intraday, swing, and positional trading because it captures short-term trend strength and momentum.
📌 20 EMA Works Best For
✔ Intraday trend identification
✔ Momentum continuation entries
✔ Dynamic support/resistance
✔ Quick reversal detection
✔ Options trading (NIFTY/BNF)
✔ Breakout & pullback trades
EMA 200 – Why It’s Extremely Important
The 200 EMA represents the long-term trend and is respected by:
Institutions
Algo systems
Big traders
Swing traders
Index traders
It acts like a major wall of support or resistance.
💡 What EMA 200 Tells You
✔ Long-term trend direction
Price above 200 EMA → Long-term uptrend
Price below 200 EMA → Long-term downtrend
✔ Strong trend reversal signals
When price crosses the 200 EMA on 15m/1h/1D charts → a deeper trend change is possible.
✔ Institutional support/resistance
Very powerful bounce/rejection zones
Many markets reverse exactly at 200 EMA
What is Previous Day High (PDH)?
The highest price the market reached in the previous trading session.
Why PDH is Important?
Acts as strong resistance
Breakout level for uptrend
Sellers often defend this zone
If broken with volume → strong bullish momentum
🔴 What is Previous Day Low (PDL)?
The lowest price the market reached in the previous trading session.
Why PDL is Important?
Acts as strong support
Breakdown level for downtrend
Buyers defend this level
If broken with volume → strong bearish trend
📌 How PDH/PDL Help in Intraday Trading
1️⃣ Range Breakout Trades
If price breaks PDH → bullish breakout (Buy CE)
If price breaks PDL → bearish breakdown (Buy PE)
What is Camarilla R3?
R3 = Resistance Level 3 in the Camarilla Pivot system.
Why R3 is important?
Acts as a major intraday resistance
Price often reverses from R3
If broken with force → strong uptrend starts
Many traders use R3 as a decision zone
Typical Market Behavior at R3
Rejection from R3 → Sell/PE opportunity
Break + Retest above R3 → CE opportunity
🔴 What is Camarilla S3?
S3 = Support Level 3 in the Camarilla Pivot system.
Why S3 is important?
Acts as a major intraday support
Buyers defend this zone
Breakdown of S3 → strong fall
S3 is often a bounce zone in the morning
Typical Market Behavior at S3
Bounce from S3 → Buy/CE opportunity
Break + Retest below S3 → PE opportunity
📌 Trader Logic: R3 & S3 Zones
⭐ 1. Range Reversal Strategy (Most Popular)
At R3 → Sell/PE
At S3 → Buy/CE
What is VWAP?
VWAP = Volume Weighted Average Price
It shows the average price at which most trading has happened during the day, based on both price and volume.
It resets every day at market open.
🔥 Why VWAP Is So Powerful?
VWAP is used by:
Institutions
Algo traders
Scalpers
Intraday traders

RSI-ma Wave Sensor (Free ver.)RSI-ma Wave Sensor is a 3-line RSI-based oscillator (Main / Middle / Wave) that shows trend direction, momentum and higher timeframe context in a single pane.
Compared with many classic MA/RSI tools it aims to:
• react with very low lag (almost real-time feeling)
• detect trend direction early
• avoid “overbought/oversold sticking” so you can hold calmly until the trend really starts to end
This Free version is a DAY trade preset for the 15m chart:
• Main = 14, Middle = EMA 9, Wave = EMA 28
• 1h higher timeframe wave sensor included
• good for learning / testing how to read trends with RSI waves

RSI ✶ YSTCThis is a Bonus Indicator from YSTC's Volume Profile Tools.
Relative Strength Index (RSI)
A momentum based oscillator which is used to measure the speed (velocity) as well as the change (magnitude) of directional price movements.
What Different about this RSI by YSTC.
You get Support and Resistance lines for RSI which are 20, 30, 40, 50, 60, 70, 80. as shown below.
It can also show RSI Candles as shown below.
For those who want all types of MA with MA Cross can play with this indicator. Below is MA Cross of 9, 21.
And for NEW user with untrained eyes who cant yet detect Divergence this indicator Saves you the trouble of finding.
Below is Regular Bullish and Bearish Divergence. Linewidth 2.
Below is Hidden Bullish and Bearish Divergence. Linewidth 1.
You can add this script to your chart by clicking "Add to favorites" button.
Have Questions ?
Contact: +91 9637070868.
Name: Yogesh Patil (YS Trading Coach).
Time: Monday to Saturday (10:00 AM - 06:00 PM).
Visit our website - YS Trading Coach .
FREE Self Study Yourself Course: Trading with Price Action Volume .
Free Stock Market Introduction Available here .
Paid Course: Trading with Price Action Volume
Paid Volume Profile Tools available here.

RSI (Custom Background) KDMThis code is a custom version of the RSI (Relative Strength Index) indicator.
Its main purpose is to compare recent price gains and losses to determine whether the market is in an overbought or oversold condition.
30–50 zone (purple tone): represents a weak or pullback area.
50–70 zone (green tone): represents a strengthening or dominant buying area.
Additionally, when the RSI line moves above 70, a green gradient background highlights the overbought region; when it moves below 30, a red gradient background emphasizes the oversold region.
Like the classic RSI, this version is a momentum indicator showing whether the price is losing or gaining strength.
The key difference is the colored background, which allows you to visually identify the RSI zones (e.g., 30–50 weak, 50–70 strong) much faster and more clearly.

RSI FlipIndicator Description: RSI Flip (30/70 Threshold)
This indicator uses a 7-period Relative Strength Index (RSI) to detect potential market reversals based on classic momentum thresholds:
- RSI < 30 → triggers a Long Deal Signal (1) indicating potential bullish reversal.
- RSI > 70 → triggers a Short Deal Signal (2) indicating potential bearish reversal.
🔧 Features:
- Backtest-compatible output: Hidden plots emit 1 for long and 2 for short, enabling seamless integration with strategy scripts.
- Bias tracking: Internal bias state updates on each trigger, allowing for modular lifecycle logic.
- Background tinting ready: The bias variable can be used to drive visual overlays or downstream automation.
🧩 Integration Notes:
- Designed for symbol-specific use — no external feeds or dependencies.
- Ideal for modular signal stacking, lifecycle-safe deal initiation, or audit-grade strategy mapping.
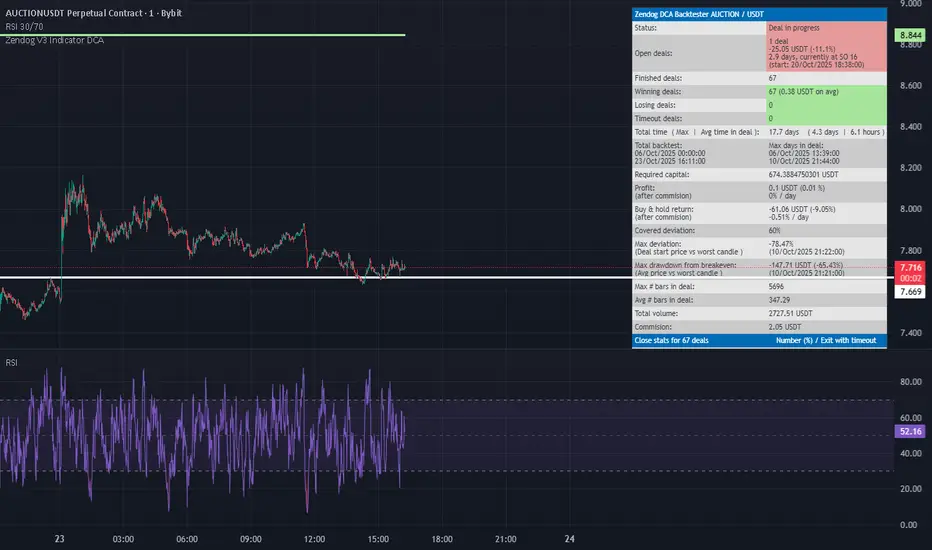
Rsi- bybitbot - JSON v3Backtesting based on the RSI indicator, based on the RSI length, RSI level, and the number of candles at the RSI level. Backtesting for monitoring in-points.
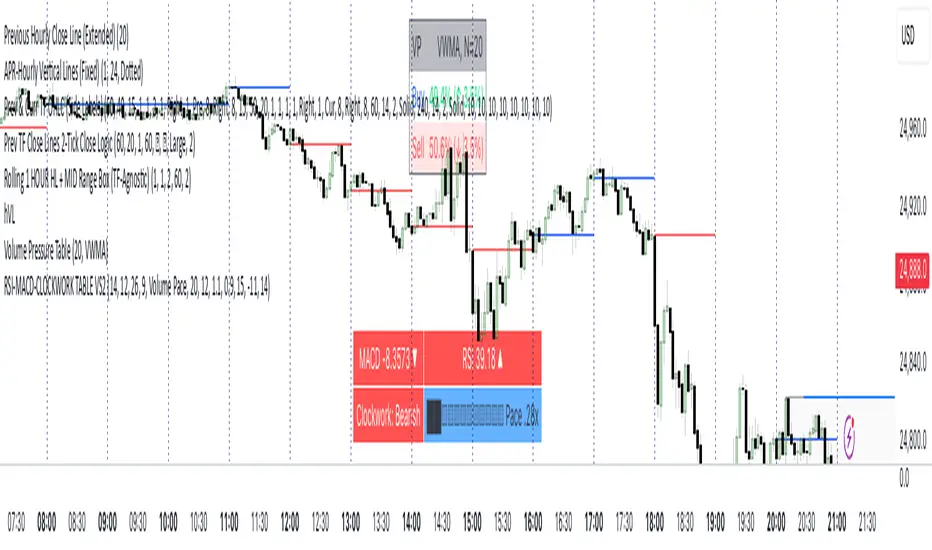
RSI MACD CLOCKWORK TABLEWhat you get, at a glance:
• MACD Cell — Shows the current MACD value and a small direction icon (▲ rising, ▼ falling, ⏺ flat). The background color adapts to regime: green above zero, red below zero, gray near the line. Lengths are configurable (fast/slow/signal).
• RSI Cell — Plots the latest RSI with an identical direction icon and background logic (green above 50, red below 50, gray around 50). RSI length is configurable.
• Clockwork Row — This is the structure check. The script computes the slope (in degrees) of EMA(5), EMA(8), and EMA(13). If all three exceed your bullish threshold, you’ll see “Clockwork: Bullish” (lime). If all three are below your bearish threshold, you’ll see “Clockwork: Bearish” (red). Otherwise, it’s “Neutral” (gray). Thresholds are fully user-tunable.
Smart right-hand cell (choose your readout):
• Duplicate — Mirrors the Clockwork label.
• Time to Close — A clean mm:ss countdown for the current timeframe (with safe defaults on unusual timeframes).
• Slope Degrees — Prints the 5/8/13 EMA slopes in degrees (e.g., +12.3°).
• Slope Pack ▲▼ — Only the direction of each slope (less noise, more speed).
• EMA Spread (5↔13) — Shows the slope differential (degrees) between short and long EMAs.
• Volume Pace — Projects end-of-bar volume from live progress, compares it to your N-bar average, and renders a tiny text progress bar (██░░…) with a neutral “thermo” palette: black = hot (> high threshold), light blue = cold (< low threshold), silver = typical. All inputs (length, bar width, thresholds) are configurable.
• ATR — Current ATR with direction vs previous bar (▲/▼/⏺).
Quality-of-life:
• Optional top padding (~20px) to keep the table visually separated from other overlays.
• Lightweight string/emoji UI for clarity without heavy graphics.
• Defensive guards around timeframe math so the TTC keeps working smoothly.
How to use:
Add to any symbol/timeframe.
Set your MACD/RSI lengths and Clockwork slope thresholds to match your system’s sensitivity.
Pick a right-cell mode that complements your workflow (TTC for day trading, Volume Pace for intrabar context, ATR for volatility).
Note: This tool is informational, not a standalone signal generator. Combine the Clockwork alignment with your entries/exits and risk management.
RSI-like VWAP — DivergencesThis script introduces a unique RSI-style oscillator built from VWAP (Volume-Weighted Average Price) instead of price alone, offering a more volume-aware perspective of market momentum.
🔹 Key Features:
Computes an RSI-like indicator using either a per-bar VWAP proxy (HLC3/OHLC4) or true intrabar VWAP (via lower timeframe aggregation).
Customizable overbought, oversold, midline, and deadband levels for better signal filtering.
Divergence detection (regular + hidden) between price and the VWAP-RSI oscillator, with clear lines and labels in the indicator pane.
Auto-scaled pivot sensitivity across different chart timeframes to maintain consistency.
Built-in alert conditions for bullish/bearish divergences, making it watchlist-friendly.
🔹 Use Cases:
This tool helps traders spot momentum shifts and early reversal signals by blending the logic of RSI with the weighting power of VWAP. It’s especially useful for detecting divergences where price action may be misleading without volume context.

RSI (1 y 5m) + divergences y rsiNDX 1mWith this indicator we incorporate
RSI of the selected asset in 1 minute.
RSI of the selected asset in 5 minutes.
RSI of the NASDAQ 100 in 1 minute.
Includes divergences that are drawn at the extremes of the RSI of the symbol in 1 minute.
Objective of the indicator:To use it in scalping (intraday) with assets from the Nasdaq 100 ETF, to compare the behavior of the asset against its base index.

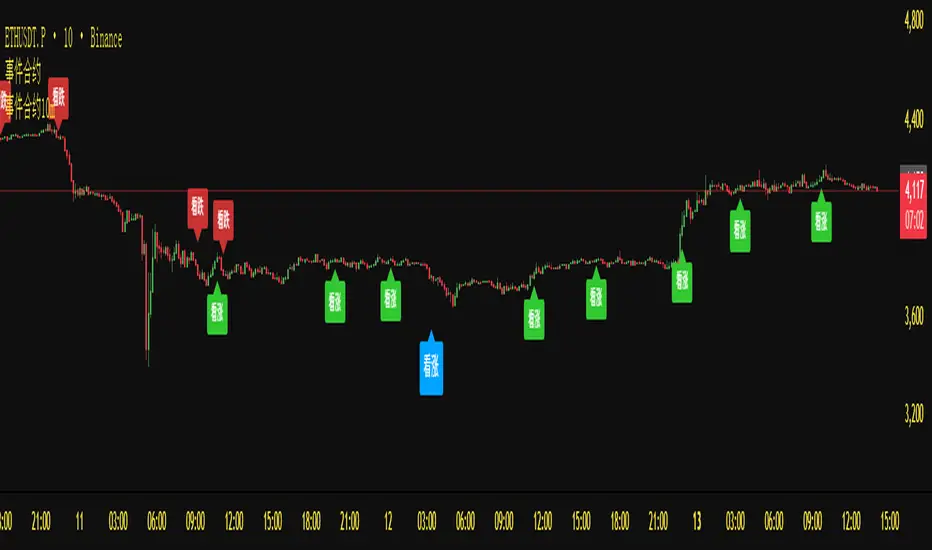
RSI+VOL——Binary(One bar)Overview
This indicator integrates Stochastic RSI, MACD trend alignment, ADX trend strength, and multi-dimensional volume analysis to provide intelligent signal guidance and market activity monitoring. It is suitable for short-term, swing, and event-driven trading, offering clear visualization of trend direction, market strength, and volume anomalies.
Core Features
1️⃣ Stochastic RSI Signals
Automatically identifies overbought and oversold conditions to generate buy and sell reference signals.
Signals are filtered with candle closing direction to reduce counter-trend entries.
2️⃣ MACD Trend Alignment
Signals trigger only when MACD trend direction aligns with Stochastic RSI, improving accuracy.
Real-time trend alignment reduces noise from ranging markets.
3️⃣ ADX Trend Strength Filter
Signals trigger only when ADX indicates a significant trend, filtering out low-strength movements.
Helps capture primary market directions.
4️⃣ Multi-Dimensional Volume Analysis
Differentiates bullish and bearish volume to identify breakout signals.
Relative volume (RVOL) ensures signals occur during periods of active trading.
Background highlights abnormal spikes and extreme volume, clearly reflecting market activity.
5️⃣ Signal Visualization and Alerts
Buy and sell labels with corresponding RSI values are displayed on the chart.
Built-in alert conditions support TradingView notifications and strategy integration.
Indicator Value
Multi-dimensional alignment: combines trend, momentum, and market activity for comprehensive assessment.
High-precision signal reference: filters noise and provides clear entry indications.
Market activity monitoring: highlights extreme volume to reflect market participation.
Broad applicability: suitable for short-term, swing, and event-driven trading across various markets.
RSI - (R.A Trader)Of course. Here is a descriptive text in English for the custom RSI indicator, written for the students of R.A. Trader.
The R.A. Trader Custom RSI Indicator
1. Overview
Welcome, students of R.A. Trader!
This is the official custom Relative Strength Index (RSI) indicator designed specifically to support the analytical methods taught by Rudá Alves. This tool replaces the standard RSI with a specialized configuration, providing a more nuanced view of market momentum that aligns directly with the R.A. Trader strategy.
Its purpose is to help you quickly and accurately identify key zones of strength, weakness, and potential market exhaustion.

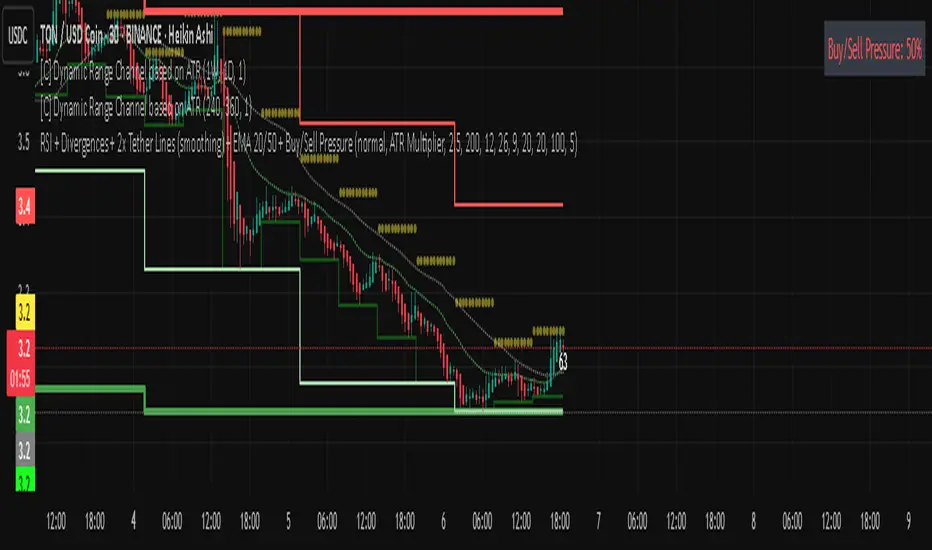
Rsi bar, divergences, tether line, ema 20,50 -Ema 20,50
-Tether Line dominance
-Buy/sell pressure
-Rsi last candle
-byu sell signal
-rsi divergence
-macd divergence
-Coloured candles 25,30 rsi and 70 rsi
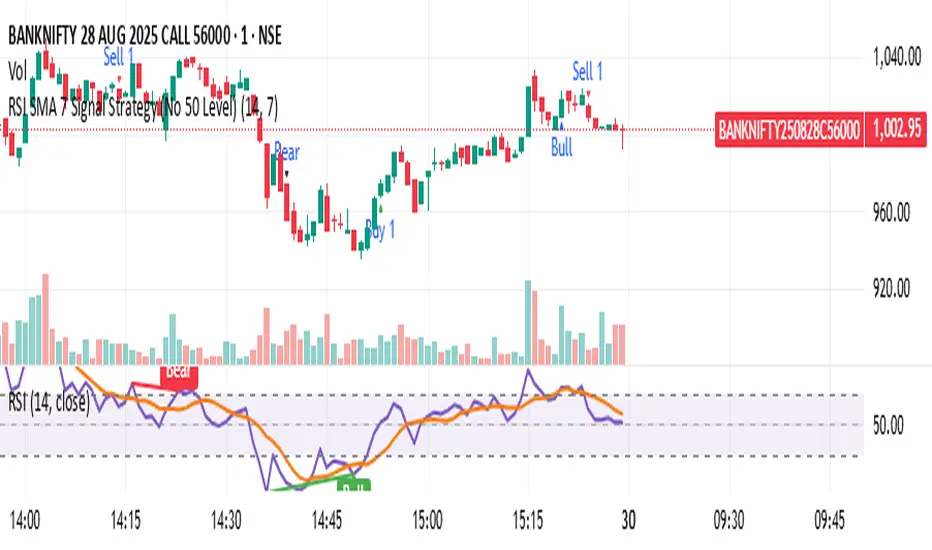
RSI SMA 7 Signal Strategy (No 50 Level)Script uses SMA 7 Perio and 14 Period RSI
If SMA crosses 40 RSI level from below consider it a buy zone or buy signal, if SMA crosses from below 60 RSI level, then super bullish, IF SMA crosses 60 RSI level from above its a profit taking time and Sell zone, if SMA crosses 40 level from above then super bearish sell signal.
RSI+BOLLINGER (LONG & SHORT)This indicator combines two of the most popular tools in technical analysis, the Relative Strength Index (RSI) and Bollinger Bands (BB), to generate both long (BUY) and short (SELL) trading signals.
Strategy:
Entries (Buy/Short): Entry signals are based on the RSI.
A BUY is suggested when the RSI crosses above an oversold level (default: 29), indicating a possible upward reversal.
A SHORT is suggested when the RSI crosses below an overbought level (default: 71), indicating a possible downward reversal.
Exits (Position Closure): Exit signals are based on Bollinger Bands.
A long position is closed when the price crosses below the upper Bollinger Band.
A short position is closed when the price crosses above the lower Bollinger Band.
Key Features:
Cascade Filter: Includes a smart filter that prevents opening new consecutive trades if the price hasn't moved significantly in favor of a new entry, optimizing signal quality.
Automation Alerts: Generates detailed alerts in JSON format for each event (buy, sell, close), designed for easy integration with trading bots and automated systems via webhooks.
Fully Configurable: All parameters of the RSI, Bollinger Bands, and strategy filters can be adjusted from the indicator’s settings menu.

RSI PotentialRSI Potential
This indicator does more than just track RSI; it measures the "energy" or "fuel" left in a trend. It answers a critical question: how much further can the price move before momentum is exhausted?
The key insight is that high momentum often means low potential, and vice versa. This inverse relationship is what allows the indicator to provide powerful, forward-looking signals about trend health and potential reversals.
Think of it like a race car:
Momentum is the car's current speed.
Potential is the amount of fuel left in the tank.
A car at top speed (high momentum) is burning fuel rapidly (potential is decreasing). A car just starting (low momentum) has a full tank of fuel (high potential). This indicator helps you see the fuel gauge, not just the speedometer.
This indicator plots three distinct components in a separate pane below your chart:
1. Upside Potential (Green Line)
What it shows: The percentage price increase required to hit the Overbought RSI Level. In other words, how much "fuel" is left for the upward trend.
How to interpret it:
Low Value (Approaching Zero): This is a warning sign. It means the price is already in high gear, and there is very little room left to run before hitting overbought exhaustion. Even if the price is rocketing up (high momentum), low potential signals the rally is likely on its last legs.
High Value: This indicates the market has a full tank of fuel for a rally. Even if the price is moving sideways or slowly (low momentum), the high potential suggests that if a new uptrend starts, it has the energy to be sustainable and significant.
2. Downside Potential (Red Line)
What it shows: The percentage price decrease required to hit the Oversold RSI Level—the "fuel" for a downtrend.
How to interpret it:
Low Value (Approaching Zero): A warning for bears. The price may be dropping fast (high momentum), but it's running out of energy to fall further. This signals seller exhaustion and increases the probability of a bounce or reversal.
High Value: The market has significant room to fall before becoming oversold. This can confirm the health of a new downtrend or suggest that a current downtrend has more to go.
3. Net Potential (Columns / Histogram)
What it shows: The net balance of energy: Upside Potential - Downside Potential. It answers, "Which side has more fuel in the tank?"

RSI Phan Ky FullThe RSI divergence indicator is like a magnifying glass that spots gaps between price swings and momentum. When price keeps climbing but RSI quietly sags, it’s a flashing U‑turn sign: the bulls are winded, and the bears are lacing up their boots. Flip it around—price is sliding yet RSI edges higher—and you’ve got bulls secretly stockpiling. Hidden divergences shore up the trend; regular divergences hint at a pivot. Blend those signals with overbought/oversold zones, support‑resistance, and volume, and RSI divergence turns into a radar that helps traders jump in with swagger and bail out just in time.

RSI & MACD Exit IndicatorThis indicator is designed to assist traders in identifying potential exit points for long and short trades by combining the Relative Strength Index (RSI) and Moving Average Convergence Divergence (MACD).
Unlike traditional indicators that provide entry signals, this script is specifically optimized for exit strategies, helping traders manage their positions efficiently.
How It Works
The script identifies potential exit points based on the following conditions:
🔴 Exit Long:
- RSI crosses above the user-defined overbought threshold (default: 65).
- MACD crosses below the signal line (bearish crossover).
🟢 Exit Short:
- RSI crosses below the user-defined oversold threshold (default: 35).
- MACD crosses above the signal line (bullish crossover).
When these conditions align, a label appears on the price chart indicating an exit point.
Key Features
- Customizable RSI & MACD Settings – Adjust lengths and thresholds to suit your strategy.
- ATR-Based Adjustments – The script incorporates an ATR multiplier for dynamic signal adjustments based on market volatility.
- Clear Visual Labels – Exit points are clearly marked on price candles.
- Color-Coded Background – Highlights buy/sell zones for quick identification.
- Alerts for Exit Signals – Receive notifications when exit conditions are met.
- Clean Chart Design – The MACD plots are placed below the main chart to avoid clutter.
How to Use
⚠ This indicator is for exits only and does not generate buy/sell entry signals.
For long trades: When an Exit Long signal appears, traders may consider closing or reducing their long positions.
For short trades: When an Exit Short signal appears, traders may consider closing or reducing their short positions.
ATR Settings: Users can adjust the ATR multiplier to fine-tune the signal frequency based on market conditions.
Important Notes
- This indicator does not guarantee future performance—it should be used alongside other analysis methods.
- No financial advice – Always use proper risk management.
- TradingView users who do not read Pine Script can still fully utilize this script thanks to the detailed signal labels and alerts.
💡 Developed with advice from @CoffeeshopCrypto based on user feedback.

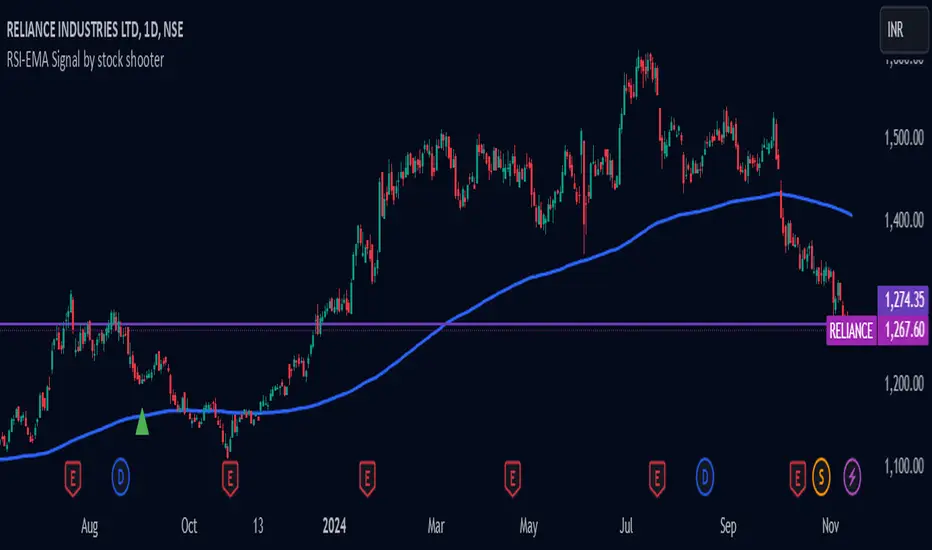
RSI-EMA Signal by stock shooter## Strategy Description: 200 EMA Crossover with RSI, Green/Red Candles, Volume, and Exit Conditions
This strategy combines several technical indicators to identify potential long and short entry opportunities in a trading instrument. Here's a breakdown of its components:
1. 200-period Exponential Moving Average (EMA):
* The 200-period EMA acts as a long-term trend indicator.
* The strategy looks for entries when the price is above (long) or below (short) the 200 EMA.
2. Relative Strength Index (RSI):
* The RSI measures the momentum of price movements and helps identify overbought and oversold conditions.
* The strategy looks for entries when the RSI is below 40 (oversold) for long positions and above 60 (overbought) for short positions.
3. Green/Red Candles:
* This indicator filters out potential entries based on the current candle's closing price relative to its opening price.
* The strategy only considers long entries on green candles (closing price higher than opening) and short entries on red candles (closing price lower than opening).
4. Volume:
* This indicator adds a volume filter to the entry conditions.
* The strategy only considers entries when the current candle's volume is higher than the average volume of the previous 20 candles, aiming for stronger signals.
Overall:
This strategy aims to capture long opportunities during potential uptrends and short opportunities during downtrends, based on a combination of price action, momentum, and volume confirmation.
Important Notes:
Backtesting is crucial to evaluate the historical performance of this strategy before deploying it with real capital.
Consider incorporating additional risk management techniques like stop-loss orders.
This strategy is just a starting point and can be further customized based on your trading goals and risk tolerance.
RSI with SMA and DisplacementThis RSI contains SMA 50 (which can be edited). Same SMA Line is displaced 10 rsi points above and below.
One can study crossing of rsi with these lines and where rsi taking support or experiencing resistance on these lines and build unique strategy.

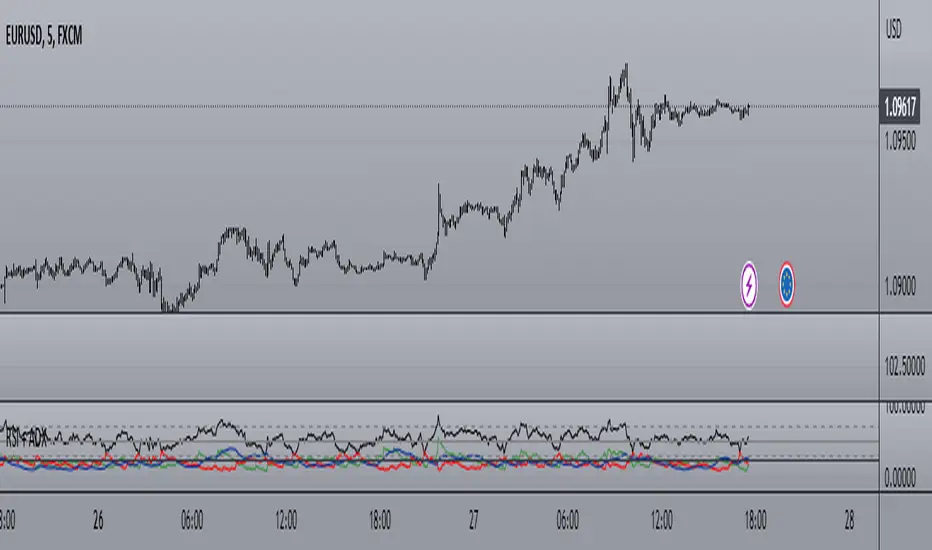
RSI + ADX + MACDINDICADOR COMBINADO DE RSI + ADX
Aprovecha las ventajas de cada indicador en uno solo.
Teniendo en un solo indicador el momentum de cada tendencia y la fuerza relativa con sus puntos de sobre compra y sobre venta.
También al poder analizar divergencias en el indicador oscilador RSI y poder crear estrategias de entrada con el ADX
-------------------------------------------------------------------------------------------------------------------------------------------------------------------------------
RSI + ADX COMBINED INDICATOR
Take advantage of each indicator in one.
Having in a single indicator the momentum of each trend and the relative strength with its points of overbought and oversold.
Also by being able to analyze divergences in the RSI oscillator indicator and being able to create entry strategies with the ADX
DERECHOS DEL CREADOR PARA: Dvd_trading
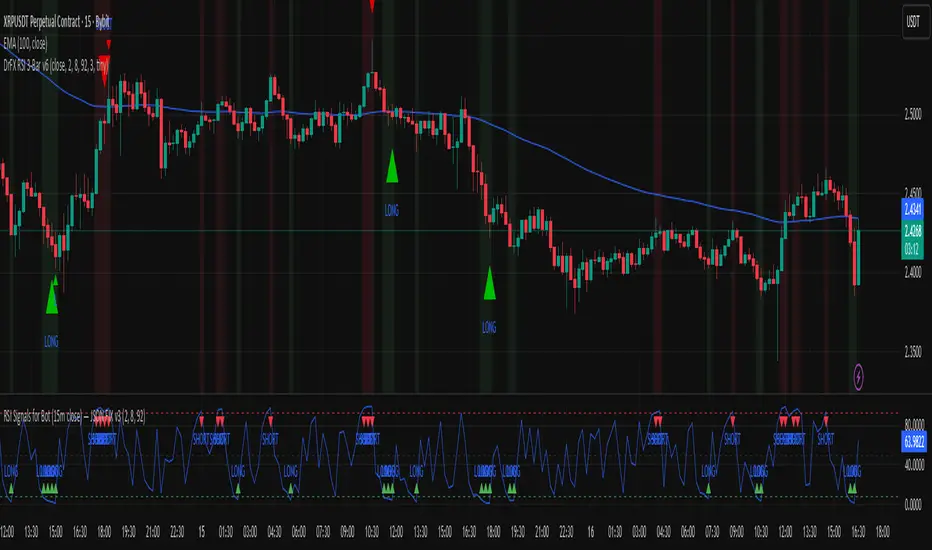
RSI Trending with DivergencesThis script uses the RSI and RSI divergences to mark signals where the rsi is both below/above the 50, below/above its moving average, and where the last regular or hidden divergence matches that state. The RSI is built into the indicator, so you don't need it in your bottom pane if you don't want it, I just put one there for illustrative purposes. Please note it will not print the same signal consecutively, as it is meant to show an overall direction, not the in and out fluctuations. I suggest using it in conjunction with some moving averages so you can ignore signals not in the trend.