Amazing Crossover System - 100+ pips per day!I got the main concept for this system on another site. While I have made one important change, I must stress that the heart of this system was created by someone else! We must give credit where credit is due!
Y'all know baby pips. @ForexPhantom published about this system and did both back and forward test around 10 years ago.
I found it on the sit and now I put it to code to see how it performs. I assume 10 points spread for every trade. I use Renesource or AxiTrader to get the low spreads.
There are 2 mods, the single trades and constant trading on the direction.
Main concept
Indicators
5 EMA -- YELLOW
10 EMA -- RED
RSI (10 - Apply to Median Price: HL/2) -- One level at 50.
TIME FRAME
1 Hour Only (very important!)
PAIRS
Virtually any pair seems to work as this is strictly technical analysis.
I recommend sticking to the main currencies and avoiding cross currencies (just his preference).
WHEN TO ENTER A TRADE
Enter LONG when the Yellow EMA crosses the Red EMA from underneath.
RSI must be approaching 50 from the BOTTOM and cross 50 to warrant entry.
Enter SHORT when the Yellow EMA crosses the Red EMA from the top.
RSI must be approaching 50 from the TOP and cross 50 to warrant entry.
I've attached a picture which demonstrates all these conditions.
That's it!
f.bpcdn.co
Поиск скриптов по запросу "rsi"

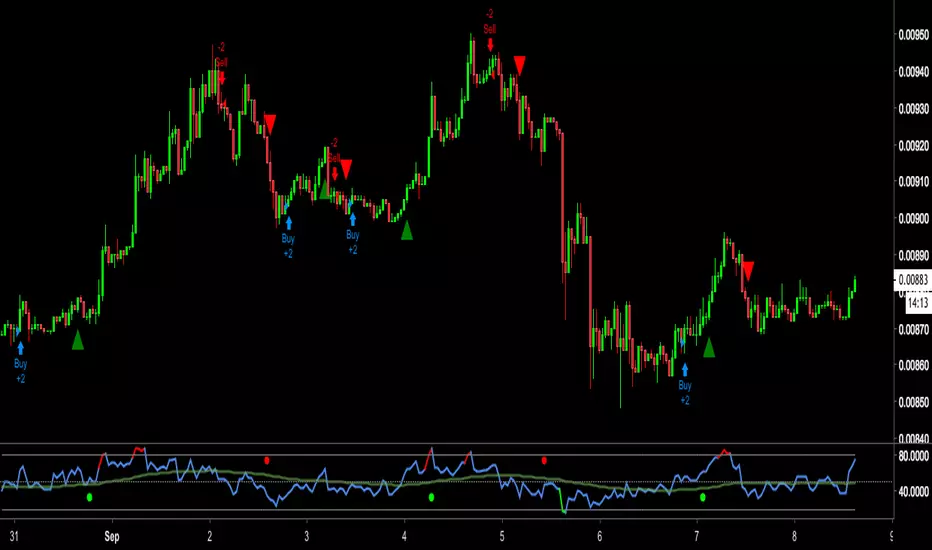
WW buy/sellGreen and Red Triangles tell the overall trend
buy/sell are pretty obvious, what they do
the way i use it is:
long (buy) 50% of your position size when we have buy and then long (buy) another 50% when i get the green triangle
short (sell) 50% of your position size when we have sell and then short (sell) another 50% when i get the red triangle
also, i look at my RSI indicator to confirm the entry and exits
RSI is above green line and indicator says buy, it's a safe long
RSI is below green line and indicator says sell, it's a safe short
won't be able to describe much as the more you use it, more you get used to it
cheers!
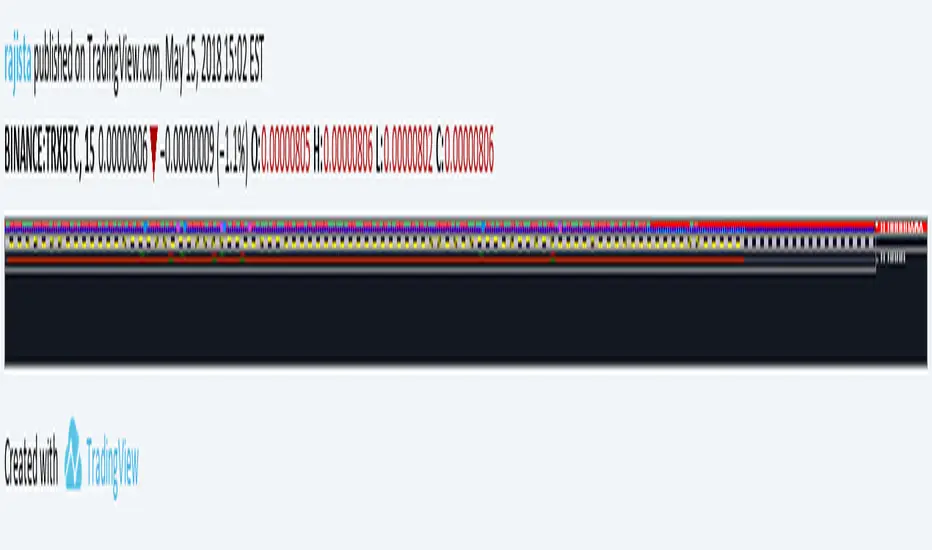
EMAcrossover_RSI Buy/sell signal-TRXBTC_15min by rajista EMAcrossover_RSI Buy/sell signal Strategy
To be used in combination with Alerts script, both can be added to your tradingview charts (Chart time-frame should be set to 15min) like you add any other simple indicator.
Add this script to your favorites and once you have been granted access, you will be notified in your Tradingview notifications section, then you can go ahead and add these two scripts into your charts from your favorite section of Indicator menu in Tradingview.
Benefits of this strategy:
1> Fully automated buy/sell signals 24x7
2>Your trades will always be based on a certain entry and exit plan.
3>No emotions involved with these trading calls, so no chance of FOMO buying/Panic Sell
4>You can fully customize the settings with a simple click(customization details given below)
5>Its completely free of cost!!!
There are two parts of this automated trading call system:
1>Strategy script- Gives the buy/sell signals based on the settings provided.
2>Alert script- Gives Alert notifications in tradingview when a buy/sell call is made.
Principle of working is very simple to understand:
Stragey script makes:
Buy call - When the 9EMA crosses above the 21EMA or RSI level-20 is reached in 15min-Chart.
Sell call -When 9EMA crosses below the 21EMA or RSI level-70 is reached in 15min-Chart.
Above values of EMA's and RSI are default values , which can be changed easily in settings panel of Strategy script.
Alert Script allows you to add Alerts when these buy/sell calls are made.
To create a Buy call alert:
1> Click on the create alert icon in your chart (top-centre)
2>Click on Condition -drop down button and select EMAcross_rsi_Alerts
3>Below that bar you will see another bar titled "Buy"-click on its drop down menu and select "Crossing Down"
4>Below that bar right next to Value change 0 to 0.9.
5>Set expiration date for your alerts as per your wish
6>Ensure "Show Popup" and "Play sound" is checked
7>You can check option of sending the alert to your email also.
Finally click on create.
To create Sell Alert:
Repeat same process, except that, after step 2- Do this- change the "long" option to "short" by clicking on the drop down menu right next to the first bar.
Click on create, Finally both of your automated buy/sell call alerts will be configured.
I know its been 2-3 days since i tweeted about this strategy and now i am making it available, you can understand i had to put in a lot of working hours, towards creating the source code for the strategy script and then for alerts script and even more so towards finding the perfect default settings which can be used straight away by anyone, even if you are new in crypto trading, apart from the time which i dedicate to analyse charts and pass on the knowledge/info to you all.
My next post will be even more helpful to you people as i am currently testing "fully automated trading" yea you heard that right!! - This system will trade 24x7 for you guys/girls no matter wherever you are either you are sleeping or watching a movie, your trades would still be getting executed with a proper entery-exit plan on a crypto exchange.
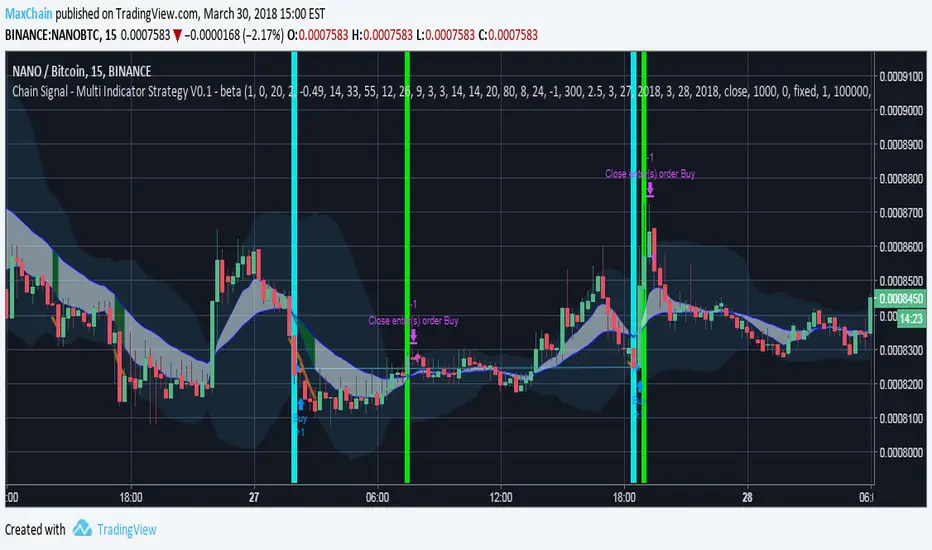
MaxChain Signals - Multi Indicator Strategy V0.1 - betaScript is under Construction:
Multiple Buy Strategies:
- RSI
- Stoch RSI
- MACD
- LOWBB
- EMAGAIN
Multiple Sell Strategies:
- RSI
- HIGHBB
- GAIN
Future Scope:
- Enable Trailing
- Smart DCA Strategies
- Williams Indicators
- Volume Indicators (longtrend / acutal trend)
- Signal Alerts for direct Buy Orders
Noro's PriceChannel Strategy v1.2In v1.2 added
+ Capital, % parameter
+ Counter-trend entry
+ Lines of PriceChannel
The blue line is the middle of the price channel.
If to use trend entry
If there are 2 red candles in a row and a body of the last candle more than a half of an average body of a candle and a candle was closed over the line - to open long-position
If there are 2 green candles in a row and a body of the last candle more than a half of an average body of a candle and a candle was closed under lines - to open short-position
If to use counter-trend entry
If the price of closing is lower than the lower line of the price channel and the candle red - to open long-position
If the price of closing is higher than the top line of the price channel and the candle green - to open short-position
If use RSI strategy
If RSI-2 < 25% and a body of the last candle more than a half of an average body of a candle and a candle was closed over the line - to open long-position
If RSI-2 > 75% and a body of the last candle more than a half of an average body of a candle and a candle was closed under lines - to open short-position
Exit
If the candle green and a body of the last candle more than a half of an average body of a candle - to close long-position
If the candle red and a body of the last candle more than a half of an average body of a candle - to close short-position

Noro's Hundred Strategy v1.0Strategy uses:
1) Fast RSI (period = 7 bars)
2) Color of bars
Strategy
If RSI less than 30 is also 4 red candles in a row - to open long-position
If RSI more than 70 is also 4 green candles in a row - to open short-position
If long-position is open and there is 1 green candle - to close a position
If short-position is open and there is 1 red candle - to close a position
Only profit
Very dangerous thing! Strategy will close a position only if a position profitable. Most likely you will lose all money if you use this function.

Noro's Price Channel Strategy v1.1The blue line is the middle of the price channel .
If to use color strategy
If there are 2 red candles in a row and a body of the last candle more than a half of an average body of a candle and a candle was closed over the line - to open long-position
If there are 2 green candles in a row and a body of the last candle more than a half of an average body of a candle and a candle was closed under lines - to open short-position
If use RSI strategy
If RSI-2 < 25% and a body of the last candle more than a half of an average body of a candle and a candle was closed over the line - to open long-position
If RSI-2 > 75% and a body of the last candle more than a half of an average body of a candle and a candle was closed under lines - to open short-position
Exit
If the candle green and a body of the last candle more than a half of an average body of a candle - to close long-position
If the candle red and a body of the last candle more than a half of an average body of a candle - to close short-position

Aurum15 - http://tvautotrader.comAurum15 - tvautotrader.com
Initial version of strategy, basing on market condition and price movement according to MA's, closing on RSI overbought value.
Exit position are configurable by RSI (default rsi(open,29) > 70), designed for 15 minutes charts
It creates very long trades (above 300 bars per trade) but is very profitable.
Tested at:
USOIL - 66% profitable, 15 trades since 2017-09-04
LTCUSD - 75% profitable, 20 trades since 2017-10-02
XRPUSD - 87.5% profitable, 8 trades since 2017-10-02
IOTUSD - 77% profitable, 9 trades since 2017-10-02
This strat is not for sale yet, I need to make futher tests in more sideways market.

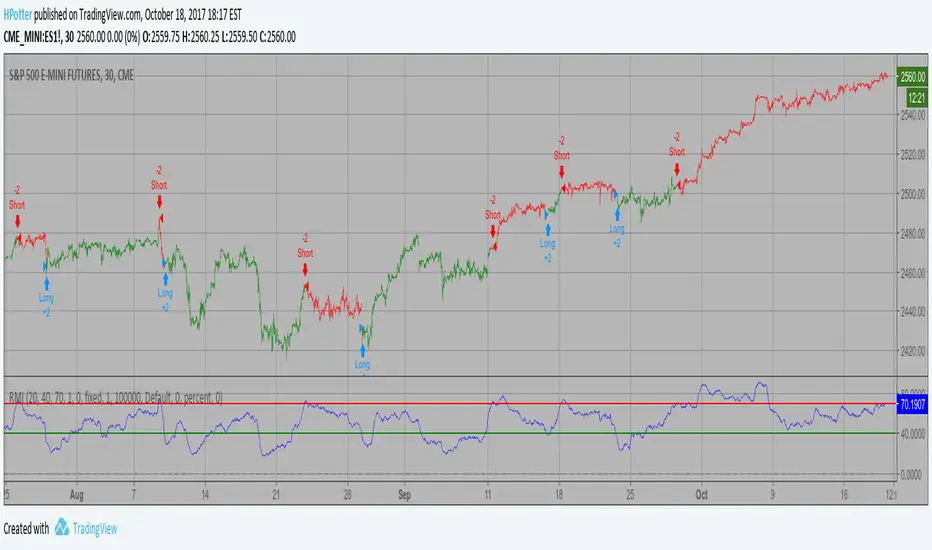
Relative Momentum Index Backtest The Relative Momentum Index (RMI) was developed by Roger Altman. Impressed
with the Relative Strength Index's sensitivity to the number of look-back
periods, yet frustrated with it's inconsistent oscillation between defined
overbought and oversold levels, Mr. Altman added a momentum component to the RSI.
As mentioned, the RMI is a variation of the RSI indicator. Instead of counting
up and down days from close to close as the RSI does, the RMI counts up and down
days from the close relative to the close x-days ago where x is not necessarily
1 as required by the RSI). So as the name of the indicator reflects, "momentum" is
substituted for "strength".
You can change long to short in the Input Settings
WARNING:
- For purpose educate only
- This script to change bars colors.
How to automate this strategy for free using a chrome extension.Hey everyone,
Recently we developed a chrome extension for automating TradingView strategies using the alerts they provide. Initially we were charging a monthly fee for the extension, but we have now decided to make it FREE for everyone. So to display the power of automating strategies via TradingView, we figured we would also provide a profitable strategy along with the custom alert script and commands for the alerts so you can easily cut and paste to begin trading for profit while you sleep.
Step 1:
You are going to need to download the Chrome Extension called AutoView. You can get the extension for free by following this link: bit.ly ( I had to shorten the link as it contains Google and TV automatically converts it to a symbol)
Step 2: Go to your chrome extension page, and under the new extension you'll see a "settings" button. In the setting you will have to connect and give permission to the exchange 1broker allowing the extension to place your orders automatically when triggered by an alert.
Step 3: Setup the strategy and custom script for the alerts in TradingView. The attached script is the strategy, you can play with the settings yourself to try and get better numbers/performance if you please.
This following script is for the custom alerts:
//@version=2
study("4All-Alert", shorttitle="Alerts")
src = close
len = input(4, minval=1, title="Length")
up = rma(max(change(src), 0), len)
down = rma(-min(change(src), 0), len)
rsi = down == 0 ? 100 : up == 0 ? 0 : 100 - (100 / (1 + up / down))
rsin = input(5)
sn = 100 - rsin
ln = 0 + rsin
short = crossover(rsi, sn) ? 1 : 0
long = crossunder(rsi, ln) ? 1 : 0
plot(long, "Long", color=green)
plot(short, "Short", color=red)
Now that you have the extension installed, the custom strategy and alert scripts in place, you simply need to create the alerts.
To get the alerts to communicate with the extension properly, there is a specific syntax that you will need to put in the message of the alert. You can find more details about the syntax here : gist.github.com
For this specific strategy, I use the Alerts script, long/short greater than 0.9 on close.
In the message for a long place this as your message:
Long
c=order b=short
c=position b=short l=200 t=market
b=long q=0.01 l=200 t=market tp=13 sl=25
and for the short...
Short
c=order b=long
c=position b=long l=200 t=market
b=short q=0.01 l=200 t=market tp=13 sl=25
If you'll notice in my above messages, compared to the strategy my tp and sl (take profit and stop loss) vary by a few pips. This is to cover the market opens and spread on 1broker. You can change the tp and sl in the strategy to the above and see that the overall profit will not vary much at all.
I hope this all makes sense and it is enough to not only make some people money, but to show the power of coming up with your own strategy and automating it using TradingView alerts and the free Chrome Extension AutoView.
ps. I highly recommend upgrading your TradingView account so you have access to back testing and multiple alerts.
There is really no reason you won't cover the cost and then some on a monthly basis using the tools provided.
Best of luck and happy trading.
Note: The extension currently allows for automation on 2 exchanges; 1broker and Okcoin. If you do not have accounts there, we'd appreciate you signing up using our referral links.
www.okcoin.com
1broker.com

Recovery Adaptive Strategy [Starbots]🔁 Recovery Adaptive Strategy
Recovery Adaptive Strategy is an advanced, single-position trading strategy designed for professional traders who require adaptive exposure control, dynamic profit targeting, and rule-based recovery mechanics in high-volatility market environments.
The strategy applies a structured loss-streak framework where position sizing and take-profit objectives evolve systematically based on prior trade outcomes, while maintaining strict one-position execution at all times.
🧠 Strategic Framework
This strategy is built around a controlled adaptive execution model:
Only one position is active at any time
Each closed trade directly influences the parameters of the next entry
After a losing trade:
Position size scales according to a defined factor
Take-profit expands proportionally using a configurable multiplier
After a winning trade:
All parameters reset to their base configuration
Scaling progression is capped via a configurable maximum step limit
The methodology is designed to efficiently capitalize on expansion phases, volatility impulses, and directional inefficiencies, making it particularly suitable for high-volatility instruments and regimes.
⚙️ Adaptive Position Management
Position Sizing Modes
Percentage of Equity
Fixed Base Currency Amount (USDT / USD / EUR, etc.)
Each subsequent step applies a configurable size multiplier, enabling precise control over exposure progression across loss streaks.
🎯Dynamic Take-Profit Scaling
Take-profit levels increase automatically with each scaling step
A dedicated TP multiplier allows fine-tuning of profit expansion behavior
All targets are recalculated and updated dynamically while positions are open
Execution Control
Single-position logic (no grid, no concurrent hedging)
Optional forced exit and full reset upon reaching the maximum scaling step
Bar-confirmed execution to avoid signal repainting
📈 Signal Generation & Market Filters
The strategy supports multiple professional-grade entry models, selectable via settings:
MACD (12,26,9)
DMI (14)
RSI (70 / 30)
Stochastic (14,3,3)
Bollinger Bands + RSI
Market Structure (BOS / CHoCH)
Additional execution layers include:
Higher-timeframe signal evaluation
Volatility-based trade filtering
EMA trend alignment
Flat-market detection (optional)
The strategy is optimized for active, volatile markets, where price expansion and follow-through are frequent.
📊 Institutional-Style Analytics & Visualization
Integrated analytics provide full transparency into strategy behavior:
Adaptive Scaling Table
Position size per step
Take-profit expansion per step
Loss-streak hit distribution
On-Chart Execution Labels
Equity Usage Overview
Monthly & Yearly Performance Calendar
Backtest vs. Leverage Projection Dashboard
All dashboards and visual components are optional and configurable.
🧩 Intended Use
This strategy is designed for:
Advanced discretionary traders
Systematic traders
Quantitative research and optimization
High-volatility instruments and environments
It emphasizes structure, adaptability, and execution discipline, rather than static position sizing or fixed targets.

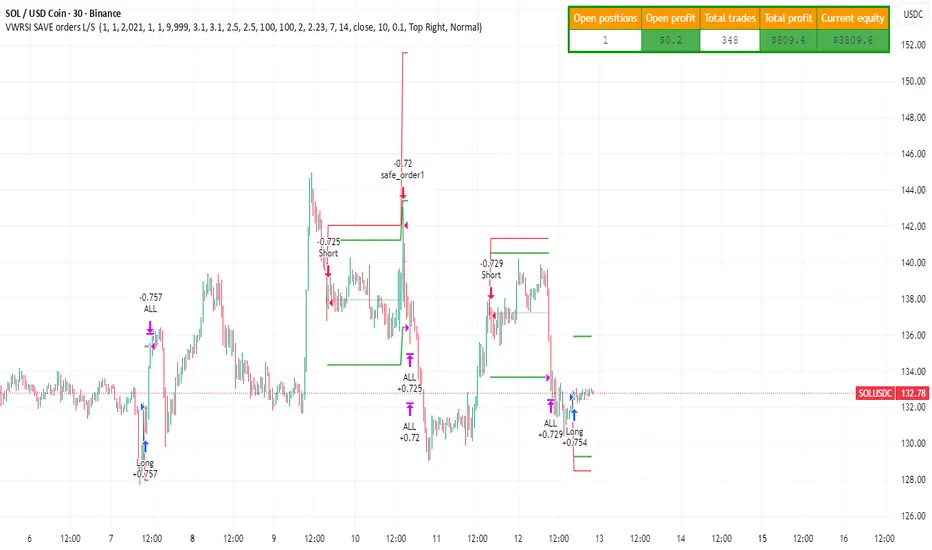
Strategy with VWRSI and SAVE orders Long or Short or BothVWRSI is very powerful indicator coded by Algo Alpha and I Make Strategy of it
But there is no stop loss instate the Strategy is using Save orders to minimize the market manipulation
The best to used is side way market with long and short enable
The Strategy trigger long or short market order -
long - ta.crossover(rsi, 20)
short - ta.crossunder(rsi, 80)
And if is not take profit from the first trade start with the save trades until will do
the sum of the first order - base order and the save order can be adjust from the user
as well the deviation from the first order
IF some user have questions let me know
DAX-30 ATRXVersion 1 of DAX-30 ATRX algo.
Revised versions may be available in future.
To be used on the 45 minute timeframe only.
Algorithm is also profitable on the NAS100 - but use with caution.
Optimized Settings:
Higher-TF for trend bias - 4 hours
HTF EMA length - 5
Min HA body size (pts) - 0.5
RSI length - 14
RSI threshold for longs - 40
Fisher length - 11
Volume MA length - 20
Volume spike multiplier - 1.2
ATR length - 14
ATR-mean length - 80
Min ATR / ATR_mean multiplier - 0.8
Max ATR / ATR_mean multiplier - 2.5
SL = ATR x - 0.9
TP = ATR x - 2.1
NY Session ON
Max trades per day - 1

VWolf - Shadow PulseOVERVIEW
The Trend Momentum Breakout Strategy is a rule-based trading system designed to identify high-probability entries in trending markets using a combination of trend confirmation, momentum filtering, and precise trigger conditions. The strategy is suitable for intermediate to advanced traders who prefer mechanical systems with clear entry/exit logic and configurable risk management options.
At its core, this strategy seeks to enter pullbacks within strong trends, capitalizing on momentum continuation after brief pauses in price movement. By integrating multiple moving averages (MAs) for trend validation, ADX (Average Directional Index) as a strength filter, and Stochastic RSI as an entry trigger, the strategy filters out weak trends and avoids overextended market conditions. Exit logic is based on a customizable fixed stop-loss (SL) and take-profit (TP) framework, with optional dynamic risk-reduction mechanisms powered by the Supertrend indicator.
This strategy is designed to perform best in clearly trending markets and is especially effective in avoiding false breakouts or choppy sideways action thanks to its ADX-based filtering. It can be deployed across a variety of asset classes, including forex, stocks, cryptocurrencies, and indices, and is optimized for intra-day to swing trading timeframes.
RECOMMENDED USE
This strategy is designed to be flexible across multiple markets, but it performs best under certain conditions:
Best Suited For:
Trending markets with clear directional momentum.
High-volume instruments that avoid erratic price action.
Assets with intraday volatility and swing patterns.
Recommended Asset Classes:
Forex pairs (e.g., EUR/USD, GBP/JPY)
Cryptocurrencies (e.g., BTC/USD, ETH/USDT)
Major indices (e.g., S&P 500, NASDAQ, DAX)
Large-cap stocks (especially those with consistent liquidity)
Suggested Timeframes:
15-minute to 1-hour charts for intraday setups.
4-hour and daily charts for swing trading.
Lower timeframes (1–5 min) may generate too much noise unless fine-tuned.
Market Conditions to Avoid:
Ranging or sideways markets with low ADX values.
Assets with irregular price structures or low liquidity.
News-heavy periods with unpredictable price spikes.
CONCLUSION
This strategy stands out for its robust and modular approach to trend-following trading, offering a high level of customization while maintaining clear logic and structural discipline in entries and exits. By combining three distinct layers of confirmation—trend identification (via configurable moving averages), trend strength validation (via the DMI filter), and timing (via the Stochastic RSI trigger)—it aims to reduce noise and increase the probability of entering trades with directional bias and momentum on its side.
Its flexibility is one of its strongest points: users can tailor the strategy to fit various trading styles and market conditions. Whether the trader prefers conservative setups using only the slowest moving average, or more aggressive entries requiring full alignment of fast, medium, and slow MAs, the system adjusts accordingly. Likewise, exit management offers both static and dynamic methods—such as ATR-based stop losses, Supertrend-based adaptive exits, and partial profit-taking mechanisms—allowing risk to be managed with precision.
This makes the strategy particularly suitable for trend-driven markets, such as major currency pairs, indices, or volatile stocks that demonstrate clear directional moves. It is not ideal for sideways or choppy markets, where multiple filters may reduce the number of trades or result in whipsaws.
From a practical standpoint, the strategy also incorporates real-world trading mechanics, like time-based filters and account risk control, which elevate it from a purely theoretical model to a more execution-ready system.
In summary, this is a well-structured, modular trend strategy ideal for intermediate to advanced traders who want to maintain control over their system parameters while still benefiting from layered signal confirmation. With proper calibration, it has the potential to become a reliable tool in any trader’s arsenal—particularly in markets where trends emerge clearly and sustainably.
FOR MORE INFORMATION VISIT vwolftrading.com

VWolf – Hulk StrikeOVERVIEW
VWolf – Hullk Strike is a dynamic trend-following strategy designed to capture pullbacks within established moves. It combines a configurable Moving Average (HULL, EMA, SMA, or DEMA) trend filter with DMI/ADX confirmation and a Stochastic RSI timing trigger. Risk is managed through ATR- or Supertrend-based stops, optional partial profit-taking, and automatic stop adjustments. The strategy aims to rejoin momentum after controlled retracements while maintaining consistent, quantified risk
RECOMMENDED USE
Markets: Liquid indices, major FX pairs, large-cap equities, high-liquidity crypto pairs.
Timeframes: M15 to D1 (stricter filters for lower timeframes, looser for higher).
Profiles: Traders seeking structured trend participation with systematic timing.
Strengths
Highly flexible trend engine adaptable to multiple markets.
Dual confirmation reduces false signals during pullbacks.
Risk-first design with multiple stop models and partial exits.
Precautions
Over-filtering may reduce trade frequency and miss fast continuations.
Under-filtering may increase whipsaw risk in choppy markets.
Backtest vs forward-test differences if date/session filters are inconsistent.
CONCLUSION
VWolf – Hullk Strike is designed to capture the “second leg” of a trend after a controlled retracement. With configurable MA strictness, DMI/ADX strength filters, and precise Stoch RSI timing, it enhances selectivity while keeping responsiveness. Its stop/target framework—anchored stops, proportional targets, partial exits, and dynamic stop moves—offers disciplined risk control and upside preservation.
FOR MORE INFORMATION VISIT vwolftrading.com

CSS_LFU_v0.1Overview:
A multi-factor, market-adaptive swing strategy designed for intraday and short-term crypto trading. It synthesizes momentum, volatility, and trend signals into a unified composite score over a configurable lookback window. The strategy leverages a modular, signal-weighted approach to ensure robust entry timing while remaining compatible with human-in-the-loop validation and algorithmic execution.
Core Modules:
AJFFRSI (RSX-based Momentum): Measures smoothed price momentum with noise-reduction filters to detect crossovers relative to the QQE trailing stop.
QQE (Quantitative Qualitative Easing RSI): A modified RSI with a dynamic trailing stop that adapts to short-term volatility, identifying exhaustion and potential reversal points.
Keltner Channel Zones: Determines overextension relative to trend, providing buy/sell zones based on ATR-banded EMA.
WaveTrend Oscillator: Confirms short-term swings and market direction through smoothed oscillator cross signals.
Rolling Composite Score: Aggregates module signals over a unified lookback (e.g., 144 bars) to normalize noise and capture consistent trends.
Signal Logic:
Each module outputs a discrete score (+1 / 0 / -1).
The rolling composite score sums all module scores over the lookback period.
Long positions trigger when the rolling score meets or exceeds the long threshold.
Short positions trigger when the rolling score meets or falls below the short threshold.
Multi-dimensional signal aggregation reduces false positives from single indicators.
Rolling lookback ensures score normalization across different volatility regimes.
Highly modular: easy to adapt modules or weights to different instruments or timeframes.
Fully compatible with automated execution pipelines, including custom exchange screener bots.
Use Case:
Ideal for quant-driven altcoin or multi-asset strategies where high-frequency validation is critical and sequential module weighting enhances trend flip detection.
