BP Scalper with resistance barsThis Script is used for scalping on the 15 min. It can do the other time frames but i built it for primarily the 15. There is some logic where i use the previous candles and i'm using intervals of 4 to get 1 hour estimates. This also works with the 1 hour, because the 4 hour is what it will compare with.
It uses Buy volume and sell volume to create the indicators.
If the buy volume starts losing traction on the sell volume the indicator triggers.
Поиск скриптов по запросу "scalp"


Godmode 3.1.4 - SNOW_CITY SCALPER EDITION - 7/2017 Updates to xSilas Godmode Oscillator published December 19th, 2014
Thanks to LEGION, LAZYBEAR, Ni6HTH4wK, xSilas
Updates:
Changed default sources to include BITSTAMP and REMOVED BTC-e
Changed default lengths for SCALPING SUPREMACY - See Instructions
Changed "Caution dots" to RED because YELLOW was hard to see.
I mostly Ignore the oscillators and only use the caution dots with this configuration:
MOST EFFECTIVE USE: BITSTAMP:BTCUSD BITSTAMP:BTCUSD
- Use on 1m charts of your BITMEX swap, yes 1m. I know, but it works better this way. 5m and 15m work best when using on an exchange index.
- IF overall 2H trend is DOWN, the 1m godmode on swap CAUTION DOTS appear on the UPPER BOUNDS means good SHORT entry points, and the lower dots suggest a possible reversal and good exit opportunity (not always)
- If overall 2H trend is UP, the 1m godmode on swap CAUTION DOTS appear on the LOWER BOUNDS means good LONG entry points, and upper dots suggest possible oversold if they start to round over, again not always.
This is ultra simple, and very effective.
Default settings for VERY sensitive CAUTION DOT blop: 17,6,4
Use these settings for a slightly less sensitive CAUTION DOT blop: 14,12,9

Dav1zoN ScalpThis script is a 5-minute scalping setup built around SuperTrend.
Entries are taken on SuperTrend flips on the 5-minute chart
Direction is confirmed with the 15-minute SMA200
Above SMA200 → only BUY trades
Below SMA200 → only SELL trades
This helps avoid sideways markets and low-quality signals
SuperTrend adapts to market volatility, while the higher-timeframe SMA200 keeps trades aligned with the main trend.

15min & 5min Scalping RibbonOpen-source replication of Annii's Ribbon:
Not quite 100% pixel perfect but very close, with the same functionality for detecting possible trend changes.
Ribbon Scalp Strategy
TF: 5-15 mins
When to enter long:
Wait for whole ribbon to turn green then enter long
Once in the trade watch the outer 3 lines. If they start to spread away from the others, that’s a sign that a pullback is coming so ether exit or move your stop into profit to protect it
When a pullback happens, watch the yellow band for a bounce. If it bounces off, stay in trade. Cross below, could be reversal sign so get out. When moving stops throughout the trade, use the yellow band as a guide to know where to move stop too, placing it just below the line.
There are two yellow MAs. When you start your session, look left to see which one has been acting as support for the past few hours and go with that one.
As long as it stays above the yellow, you can stay in the trade. Again exit, when outer bands start to widen.
Short - everything above in reverse.
What not to do:
Do not try to pick a reversal early when you start to see one or two bands turn red - this does not mean a reversal is coming! It could just be a pullback before continuing long.

spy scalp cheat codecombines hma directional scalping strategy plus the option to use optional stochastic quad band to confrim entry

ATR ZigZag BreakoutATR ZigZag Breakout
This strategy uses my ATR ZigZag indicator (powered by the ZigZagCore library) to scalp breakouts at volatility-filtered highs and lows.
Everyone knows stops cluster around clear swing highs and lows. Breakout traders often pile in there, too. These levels are predictable areas where aggressive orders hit the tape. The idea here is simple:
→ Let ATR ZigZag define clean, volatility-filtered pivots
→ Arm a stop market order at those pivots
→ Join the breakout when the crowd hits the level
The key to greater success in this simple strategy lies in the ZigZag. Because the pivots are filtered by ATR instead of fixed bar counts or fractals, the levels tend to be more meaningful and less noisy.
This approach is especially suited for intraday trading on volatile instruments (e.g., NQ, GC, liquid crypto pairs).
How It Works
1. Pivot detection
The ATR ZigZag uses an ATR-based threshold to confirm swing highs and lows. Only when price has moved far enough in the opposite direction does a pivot become “official.”
2. Candidate breakout level
When a new swing direction is detected and the most recent high/low has not yet been broken in the current leg, the strategy arms a stop market order at that pivot.
• Long candidate → most recent swing high
• Short candidate → most recent swing low
These “candidate trades” are shown as dotted lines.
3. Entry, SL, and TP
If price breaks through the level, the stop order is filled and a bracket is placed:
• Stop loss = ATR × SL multiplier
• Take profit = SL distance × RR multiplier
Once a level has traded, it is not reused in the same swing leg.
4. Cancel & rotate
If the market reverses and forms a new swing in the opposite direction before the level is hit, the pending order is cancelled and a new candidate is considered in the new direction.
Additional Features
• Optional session filter for backtesting specific trading hours

Trend BG v2Trend BG v2 colors the chart background based on Directional Movement (DM) and DI strength. It provides an easy visual way to identify trending and non-trending conditions on any timeframe.
How It Works
The script calculates:
Upward Directional Movement (DM+)
Downward Directional Movement (DM–)
True Range smoothed with RMA (14-period)
Positive DI and Negative DI values from classic ADX logic
The trend state is determined by comparing +DI vs –DI:
+DI > –DI → Uptrend
–DI > +DI → Downtrend
Otherwise → Neutral / Sideways
The script then applies a background color based on the detected trend.
Color transparency and theme can be adjusted using the input options.
Why This Script Is Useful
Instead of plotting DI lines or ADX curves, this version presents the trend directly on the background, making it ideal for:
Quick trend recognition
Visual filtering of choppy vs trending markets
Enhancing manual or automated setups
Intraday scalping, positional trend following, and multi-timeframe analysis
The background display is subtle, customizable, and does not interfere with other indicators on the chart.
Key Features
Trend-colored chart background (Up / Down / Neutral)
Adjustable color palette and transparency
Built using classic Directional Movement logic
Works on all markets and all timeframes
Lightweight and efficient (no repainting)
How to Use It
Apply the indicator on your chart and use the background colors to:
Align trades with the market trend
Avoid trading during neutral or low-momentum periods
Confirm trend direction before entries
Improve clarity when using your existing indicators
This indicator does not generate buy/sell signals by itself; instead, it helps visualize the underlying trend environment so traders can make more informed decisions.

30M Scalping Strategy with Debug LogsWhat’s changed
Spot‑only: all short logic removed—only long entries and exits are generated.
Logging: uses log.info() to send entry/exit details (timestamp, price, ATR, RSI) to the Pine Logs console.
Clean & concise: core scalp logic (EMAs, RSI, MACD, volume, ATR SL/TP) remains intact.

Chaikin Momentum Scalper🎯 Overview
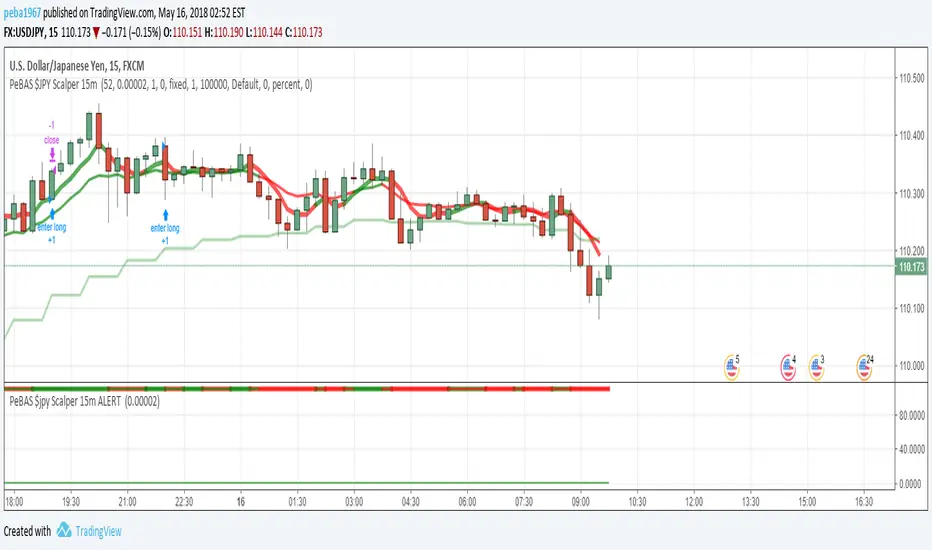
The Chaikin Momentum Scalper is a powerful trading strategy designed to identify momentum shifts in the market and ride the trend for maximum profits. This strategy is ideal for trading the USD/JPY currency pair on a 15-minute chart, making it perfect for high-frequency trading (HFT). Whether you’re starting with a small account of $1,000 or managing a larger portfolio, this strategy can scale to suit your needs.
________________________________________
🔑 How the Strategy Works
Here’s how the Chaikin Momentum Scalper identifies trade opportunities:
1️⃣ Momentum Detection
The core of this strategy is the Chaikin Oscillator, a tool that measures the flow of money into or out of a market. It helps us understand whether buyers (bulls) or sellers (bears) are in control.
• When the indicator crosses above zero, it signals that buying momentum is picking up – a buying opportunity.
• When the indicator crosses below zero, it signals that selling momentum is increasing – a selling opportunity.
2️⃣ Trend Confirmation
We don’t just jump into trades based on momentum alone. We also use a 200-period simple moving average (SMA) to confirm the overall trend.
• If the price is above the SMA, it confirms an uptrend, so we look for buy trades.
• If the price is below the SMA, it confirms a downtrend, so we look for sell trades.
This way, we align our trades with the broader market direction for higher success rates.
3️⃣ Volatility & Risk Management
We use a tool called the Average True Range (ATR) to measure market volatility. This helps us:
• Set a stop-loss (where we’ll exit the trade if the market moves against us) at a safe distance from our entry point.
• Set a take-profit (where we’ll lock in profits) at a target that’s larger than the stop-loss, ensuring a good reward-to-risk ratio.
This approach adapts to the market’s behavior, tightening stops in calmer conditions and widening them when volatility increases.
________________________________________
📈 Why This Strategy Works
✅ It combines momentum and trend-following principles, increasing the chances of trading in the right direction.
✅ It dynamically adjusts risk levels based on market volatility, keeping losses small and profits big.
✅ It’s scalable – perfect for both small accounts (like $1,000) and larger, corporate-sized portfolios.
✅ It has been deep-backtested on USD/JPY 15-minute charts, proving its consistency across different market conditions.
________________________________________
📝 Important Notes
📌 This strategy is best used for USD/JPY on a 15-minute chart, making it great for high-frequency trading while you continue to build and refine your trading system.
📌 It’s designed to work on both small ($1,000+) and large accounts, so it can grow with you as your capital increases.
📌 While it has passed deep backtesting on this pair and timeframe, remember that no strategy is perfect. It’s crucial to test it yourself, start with a demo account, and apply proper risk management before trading real money.
🌟 Final Thoughts
The Chaikin Momentum Scalper is a solid, adaptable trading approach combining momentum, trend direction, and volatility awareness. If you’re looking for a strategy to kick-start your trading journey—or to add to your existing system—it offers a strong foundation.

5 min scalp macd5 min scalp macd, 5 min scalp macd, 5 min scalp macd, 5 min scalp macd, 5 min scalp macd, 5 min scalp macd, 5 min scalp macd, 5 min scalp macd

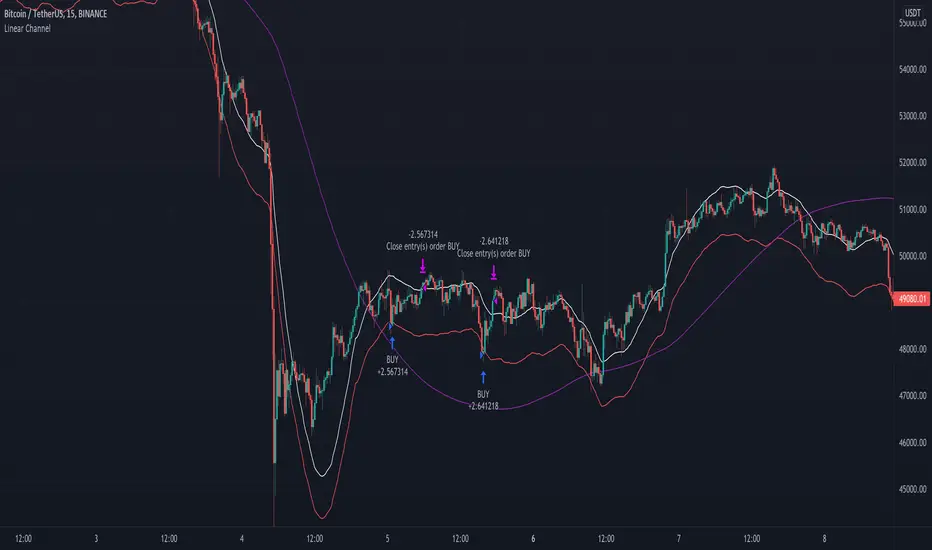
Linear Channel - Scalp Strategy 15MSimple way how to use Linear Regression for trading.
What we use:
• Linear Regression
• HMA as a trend filter
Logic:
Firstly we make simple linear regression moving. It is the white line which appears on the chart.
Then we make second line (named: band2) on the chart by multiplying linreg and value difference.
The third step is to ad HMA as a trend filter.
The trade open when price is below band2, but still upper than Hullma. The trade close when price again upper than linreg.
William %R Scalper for Gold with tortle WPRWilliam %R Scalper with Tortle WPR is small update from WPR Scalper tool. It is used with small time frame : 5 , 3 or 1 minute.
it uses tree different William %R indicators : one for fast move with 9 period WPR9 and one slow with 54 period WPR54 pLus tortle WPR 255.
You can find buy zone when WPR255< -90 WPR9 < -90 and WPR54 < -80 and sell zone when WPR 255 > -20, WPR9 > -10 AND WPR54 > -20. Tortle WPR (255) provide price trend

{INDYAN} RSI + MACDModded RSI and MACD for intraday use. If rsi above 60 and macd is above zero line then go for buy and if rsi is below 40 and macd below zero line then go for sell side. use it in small timeframe i.e. 3 minute or less.
better for scalp trading
Happy Trading
Love INDYAN
#It can be used best with INDYAN Go With Trend

Triangular Moving Average (TMA) bandsWhat in the world is up folks ??!??
Here's the indicator of the day. Sharing a simple one today because I'm busy coding for a few clients (fun life of a top script author on TradingView)
The TMA bands is an indicator that I discovered on FXCM a few years ago FXCM TMA bands
From the screenshot above, we see that when the price hits the lower band, it's a possible reverse BUY signal. When it hits the upper band, it's a possible SELL signal
Methodology
1) The Take Profit 1 is the middle line, Take Profit 2 is the opposite band.
2) Once the TP1 is hit, set your Stop Loss to breakeven
3) Once the TP2 is hit, if you still want to stay in the trade, set your Stop Loss to the TP1
That's what we call a trailing stop loss which I offered in the Trade Manager : Trade-Manager-Open-Source-Version/
It will be a powerful tool in your arsenal for some scalp/intraday trades
After years of coding for traders, I worked with many brokers/API/languages so I'm very used to convert a script from a broker to another one (shameless self-advertising)
PS
Tomorrow I'll share the Signal version of my Algorithm Builder:
You'll be able to connect it in a single click to a very cool Backtest System made by the Pinescripters community
In other words, I'm selling the scripts to allow you to build your own signals in a few clicks AND to connect it easily to a kick-ass backtesting tool. More to come tomorrow
Hope you'll like it, like me, love it, love me, tip me :)
____________________________________________________________
Feel free to hit the thumbs up as it shows me that I'm not doing this for nothing and will motivate to deliver more quality content in the future. (Meaning... a few likes only = no indicators = Dave enjoying the beach)
- I'm an officially approved PineEditor/LUA/MT4 approved mentor on codementor. You can request a coaching with me if you want and I'll teach you how to build kick-ass indicators and strategies
Jump on a 1 to 1 coaching with me
- You can also hire for a custom dev of your indicator/strategy/bot/chrome extension/python

TTM scalper indicator Backtest TTM scalper indicator of John Carter’s Scalper Buys and Sells. The methodology
is a close approximation of the one described in his book Mastering the Trade.
The book is highly recommended. Note the squares are not real-time but will
show up once the third bar has confirmed a reversal.
You can change long to short in the Input Settings
WARNING:
- For purpose educate only
- This script to change bars colors.

M5 EMA Pullback Scalper (Anti-Chop + Dynamic Boxes)M5 EMA Pullback Scalper (Anti-Chop + Dynamic Boxes)

SPY 5m Scalper + Auto Exit 3PM ET5m chart scalper for Spy/QQQ. It uses the 9,21,50 ema and the vwap to time puts and calls while trading options, you can also use it on other stocks.


BTC Pro High-Win Scalper w/ % Risk Hello,
I have been working on this 15min scalper for bitcoin. Its still in progress but is showing some promising results.
Check it out and let me know your thoughts
Thanks

0DTE SPY/QQQ Precision Scalper [3m Enhanced V2 - FIXED LINES]0DTE SPY/QQQ scalper built for the **3-minute chart** with **15m trend bias** and **1m confirmation**.
Targets **1 strike OTM** entries using VWAP/EMA pullbacks, OR breakout, MACD momentum, and RVOL filters.
Uses ATR-based **stop/target**, optional **breakeven + trailing stop**, and **time stop ~30 min** for 0DTE.
Includes strict risk controls: trade limits, cooldown, skip chop windows, and consecutive-loss lockout.
