Gold 3min Trading Pro [XAU/USD]# Gold 3min Trading Pro - User Guide
## Overview
This is a professional scalping indicator specifically designed for Gold (XAU/USD) trading on 3-minute timeframes. It combines multiple technical analysis methods to provide high-probability entry signals for short-term trading.
## Key Features
### 1. Multi-Timeframe Trend Analysis
- **Major Trend**: Analyzes 15min, 1H, and 4H timeframes using moving averages
- **Short-term Trend**: Focuses on 3-minute price action and moving average alignment
- **Trend Strength**: Rated from 1-3 based on timeframe agreement
### 2. Core Indicators
- **RSI (9-period)**: Momentum oscillator for overbought/oversold conditions
- **Stochastic (9-period)**: %K and %D lines for entry timing
- **MACD**: Additional trend confirmation
- **Volume Analysis**: Detects volume spikes for signal validation
- **ATR-based Volatility Filter**: Ensures adequate market movement
### 3. Signal Types
- **Primary Signals**: Green triangles (LONG) and Red triangles (SHORT)
- **Enhanced Signals**: Stronger signals with multiple confirmations
- **Confirmation Signals**: Small circles for stochastic crossovers
## How to Use
### 1. Setup
- **Timeframe**: Use on 3-minute charts for Gold (XAU/USD)
- **Settings**: Default settings are optimized for Gold scalping
- **Session Filter**: Enable for London/New York sessions (recommended)
### 2. Entry Conditions
#### LONG Entry:
- Major trend is bullish (green background)
- Short-term trend is up or neutral
- RSI shows bullish momentum
- Stochastic indicates oversold recovery
- Volume spike confirmation
- Strong price action (bullish candle)
#### SHORT Entry:
- Major trend is bearish (red background)
- Short-term trend is down or neutral
- RSI shows bearish momentum
- Stochastic indicates overbought reversal
- Volume spike confirmation
- Strong price action (bearish candle)
### 3. Trade Management
- **Quick Target**: 50% of ATR-based calculation
- **Main Target**: Full ATR-based target
- **Stop Loss**: 60% of ATR below/above entry
- **Time Limit**: Exit if no progress within 20 bars (60 minutes)
### 4. Risk Management
- **Position Size**: Risk 1-2% of account per trade
- **Maximum Trades**: 3-5 trades per session
- **Avoid**: Low volatility periods and major news events
## Visual Elements
### Background Colors
- **Light Green**: Bullish major trend
- **Light Red**: Bearish major trend
- **Yellow**: Volume spike detected
- **Intense Colors**: Very strong trend alignment
### Chart Indicators
- **RSI Line (Blue)**: Main momentum indicator
- **Stochastic %K (Orange)**: Fast stochastic line
- **Stochastic %D (Yellow)**: Slow stochastic line
- **Horizontal Lines**: 70 (overbought), 30 (oversold), 50 (midline)
### Information Table (Top Right)
- Total signal count and performance statistics
- Current market conditions and trend strength
- RSI levels and volatility status
- Trading session information
- Last signal timing
## Alert System
### Standard Alerts
- **Scalp Long Signal**: Basic long entry signal
- **Scalp Short Signal**: Basic short entry signal
- **Premium Signals**: High-quality signals with strong confirmation
- **Trend Reversal**: Major trend change notifications
### Alert Setup
1. Right-click on chart → "Add Alert"
2. Select desired alert condition
3. Configure notification method (popup, email, webhook)
4. Set alert frequency to "Once Per Bar Close"
## Best Practices
### 1. Trading Sessions
- **Optimal**: London-NY overlap (3:00-5:00 PM EST)
- **Good**: London session (2:00-11:00 AM EST)
- **Avoid**: Asian session and major news releases
### 2. Market Conditions
- **Best**: Trending markets with normal to high volatility
- **Moderate**: Ranging markets during active sessions
- **Avoid**: Extremely low volatility or choppy conditions
### 3. Confirmation Rules
- Wait for signal triangle to appear
- Check that major trend aligns with signal direction
- Verify volume spike (yellow background)
- Ensure volatility is adequate (check info table)
### 4. Entry Timing
- Enter immediately after signal confirmation
- Use market orders for scalping speed
- Set stop loss and take profit levels immediately
## Settings Customization
### Essential Settings
- **MA Type**: EMA (recommended) or SMA
- **RSI Length**: 9 (default, can adjust 5-14)
- **Volume Threshold**: 1.8 (higher = fewer but stronger signals)
- **Volatility Filter**: Keep enabled for better signal quality
### Display Options
- **Show Scalping Signals**: Main entry signals
- **Show Performance Stats**: Information table
- **Show Trend Filter**: Background trend colors
- **Use Time Filter**: Session-based filtering
## Performance Optimization
### 1. Backtesting Tips
- Test on different market conditions
- Analyze win rate and average profit/loss
- Adjust settings based on historical performance
### 2. Signal Quality
- Higher trend strength (2-3) = better signals
- Volume confirmation improves success rate
- Enhanced signals have higher probability
### 3. Risk Control
- Never risk more than 2% per trade
- Use proper position sizing
- Stop trading after 3 consecutive losses
## Troubleshooting
### Common Issues
1. **No Signals**: Check volatility filter and session timing
2. **Too Many Signals**: Increase volume threshold or enable filters
3. **Poor Performance**: Verify timeframe (must be 3-minute) and symbol (XAU/USD)
### Support
- Ensure TradingView Pro+ subscription for multi-timeframe data
- Verify Gold symbol matches your broker's format
- Update to latest TradingView version
This indicator is designed for experienced traders familiar with scalping techniques and risk management. Always practice on demo accounts before live trading.
Поиск скриптов по запросу "scalping"

CoffeeShopCrypto Supertrend Liquidity EngineMost SuperTrend indicators use fixed ATR multipliers that ignore context—forcing traders to constantly tweak settings that rarely adapt well across timeframes or assets.
This Supertrend is a nodd to and a more completion of the work
done by Olivier Seban ( @olivierseban )
This version replaces guesswork with an adaptive factor based on prior session volatility, dynamically adjusting stops to match current conditions. It also introduces liquidity-aware zones, real-time strength histograms, and a visual control panel—making your stoploss smarter, more responsive, and aligned with how the market actually moves.
📏 The Multiplier Problem & Adaptive Factor Solution
Traditional SuperTrend indicators rely on fixed ATR multipliers—often arbitrary numbers like 1.5, 2, or 3. The issue? No logical basis ties these values to actual market conditions. What works on a 5-minute Nasdaq chart fails on a daily EUR/USD chart. Traders spend hours tweaking multipliers per asset, timeframe, or volatility phase—and still end up with stoplosses that are either too tight or too loose. Worse, the market doesn’t care about your setting—it behaves according to underlying volatility, not your parameter.
This version fixes that by automating the multiplier selection entirely. It uses a 4-zone model based on the current ATR relative to the previous session’s ATR, dynamically adjusting the SuperTrend factor to match current volatility. It eliminates guesswork, adapts to the asset and timeframe, and ensures you’re always using a context-aware stoploss—one that evolves with the market instead of fighting it.
ATR EXAMPLE
Let’s say prior session ATR = 2.00
Now suppose current ATR = 0.32
This places us in Zone 1 (Very Low Volatility)
It doesn’t imply "overbought" or "oversold" — it tells you the market is moving very little, which often means:
Lower risk | Smaller stops | Smaller opportunities (and losses)
🔁 Liquidity Zones vs. Arbitrary Pullbacks
The standard SuperTrend stop loss line often looks like price “barely misses it” before continuing its trend. Traders call this "stop hunting," but what’s really happening is liquidity collection—price pulls back into a zone rich in orders before continuing. The problem? The old SuperTrend doesn’t show this zone. It only draws the outer limit, leaving no visual cue for where entries or continuation moves might realistically originate.
This script introduces 2 levels in the Liquidity Zone. One for Support and one for Stophunts, which draw dynamically between the current price and the SuperTrend line. These levels reflect where the market is most likely to revisit before resuming the trend. By visualizing the area just above the Supertrend stop loss, you can anticipate pullbacks, spot ideal re-entries, and avoid premature exits. This bridges the gap between mechanical stoploss logic and real-world liquidity behavior.
⏳ Prior Session ATR vs. Live ATR
Using real-time ATR to determine movement potential is like driving by looking in your rearview mirror. It’s reactive, not predictive. Traders often base decisions on live ATR, unaware that today’s range is still unfolding —creating volatility mismatches between what’s calculated and what actually matters. Since ATR reflects range, calculating it mid-session gives an incomplete and misleading picture of true volatility.
Instead, this system uses the ATR from the previous session , anchoring your volatility assumptions in a fully-formed price structure . It tells you how far price moved in the last full market phase—be it London, New York, or Tokyo—giving you a more reliable gauge of expected range today. This is a smarter way to estimate how far price could move rather than how far it has moved.
The Smoothing function will take the ATR, Support, Resistance, Stophunt Levels, and the Moving Avearage and smooth them by the calculation you choose.
It will also plot a moving average on your chart against closing prices by the smoothing function you choose.
🧭 Scalping vs. Trending Modes
The market moves in at least 4 phases. Trending, Ranging, Consolidation, Distribution.
Every trader has a different style —some scalp low-volatility moves during off-hours, while others ride macro trends across days. The problem with classic SuperTrend? It treats every market condition the same. A fixed system can’t possibly provide proper stoploss spacing for both a fast scalp and a long-term swing. Traders are forced to rebuild their system every time the market changes character or the session shifts.
This version solves that with a simple toggle:
Scalping or Trend Mode . With one switch, it inverts the logic of the adaptive factor to either tighten or loosen your trailing stops. During low-liquidity hours or consolidation phases, Scalping Mode offers snug stoplosses. During expansion or clear directional bias.
Trend Mode lets the trade breathe. This is flexibility built directly into the logic—not something you have to recalibrate manually.
📉 Histogram Oscillator for Move Strength
In legacy indicators, there’s no built-in way to gauge when the move is losing power . Traders rely on price action or momentum indicators to guess if a trend is fading. But this adds clutter, lag, and often contradiction. The classic SuperTrend doesn’t offer insight into how strong or weak the current trend leg is—only whether price has crossed a line.
This version includes a Trending Liquidity Histogram —a histogram that shows whether the liquidity in the SuperTrend zone is expanding or compressing. When the bars weaken or cross toward zero, it signals liquidity exhaustion . This early warning gives you time to prep for reversals or anticipate pullbacks. It even adapts visually depending on your trading mode, showing color-coded signals for scalping vs. trending behavior. It's both a strength gauge and a trade timing tool—built into your stoploss logic.
Histogram in Scalping Mode
Histogram in Trending Mode
📊 Visual Table for Real-Time Clarity
A major issue with custom indicators is opacity —you don’t always know what settings or values are currently being used. Even worse, if your dynamic logic changes mid-trade, you may not notice unless you go digging into the code or logs. This can create confusion, especially for discretionary traders.
This SuperTrend solves it with a clean visual summary table right on your chart. It shows your current ATR value, adaptive multiplier, trailing stop level, and whether a new zone size is active. That means no surprises and no second-guessing—everything important is visible and updated in real-time.

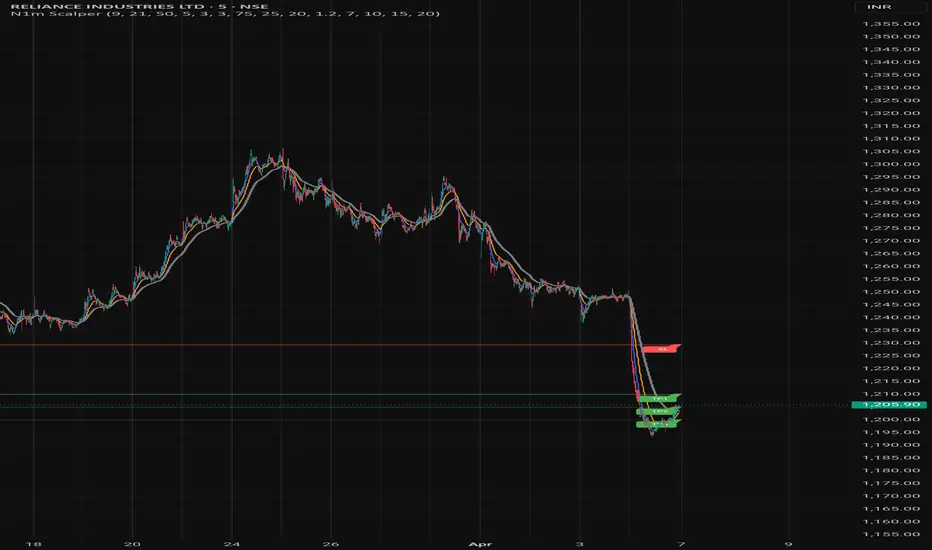
Nifty 1m EMA Pullback Scalper Signals
### **Master the Market with the Sniper Scalping Strategy for Nifty (1-Minute Timeframe)**
Unlock the power of precision trading with this expertly crafted **Sniper Scalping Strategy**, designed specifically for the Nifty index on a lightning-fast 1-minute timeframe. Perfect for traders who thrive on quick decisions and small, consistent profits, this strategy combines multiple indicators to deliver razor-sharp entries and exits—ideal for India’s dynamic market.
#### **Why This Strategy Stands Out**
- **Pinpoint Accuracy**: Harness the synergy of the **5 EMA and 10 EMA crossover** to lock onto the short-term trend, while the **Stochastic Oscillator (14,3,3)** times your entries and exits with surgical precision.
- **Fast and Effective**: Tailored for the 1-minute chart, this strategy capitalizes on Nifty’s volatility, targeting **10-point profits** with a tight **5-point stop-loss**—keeping your risk low and rewards high.
- **Trend + Momentum**: Blend trend-following (EMAs) with momentum signals (Stochastic) for a robust, multi-dimensional approach that cuts through market noise.
#### **How It Works**
- **Buy Signal**: Enter long when the 5 EMA crosses above the 10 EMA and the Stochastic rises above 20—catching the uptrend at its sweet spot.
- **Sell Signal**: Go short when the 5 EMA dips below the 10 EMA and the Stochastic falls below 80—riding the downtrend with confidence.
- **Exit Like a Pro**: Take profits at 10 points or when the Stochastic hits overbought/oversold extremes, ensuring you’re in and out before the market shifts.
#### **Perfect for Nifty Scalpers**
Built for the fast-paced world of Nifty trading, this strategy shines during high-volatility sessions like the market open or global overlaps. Whether you’re a beginner honing your skills or a seasoned trader seeking consistency, the Sniper Scalping Strategy offers a clear, actionable framework to scalp profits with discipline and precision.
#### **Get Started**
Test it in a demo account, refine it to your style, and watch your scalping game soar. Trade smart, stay focused, and let the Sniper Scalping Strategy turn Nifty’s 1-minute moves into your edge!
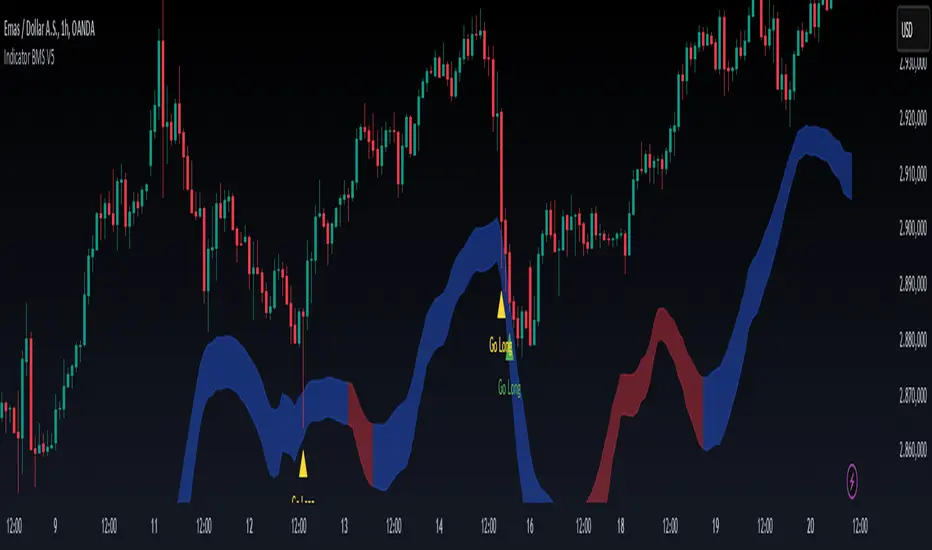
Indicator BMS V5 [Traderhood]Introducing BMS (Base Market Strategy)
Overview
Base Market Strategy (BMS) is a trend-following and oscillator indicator designed to detect market trends with high accuracy while providing clear entry signals. BMS utilizes four Exponential Moving Averages (EMA) to filter trends across multiple timeframes and Bollinger Bands (BB) to identify overbought and oversold zones. This approach makes BMS highly suitable for scalping strategies in lower timeframes with a high win rate potential.
Key Features
📈 Multi-EMA Trend Filtering
Uses 4 EMAs to confirm the dominant trend.
Separates trend detection between lower timeframes and H1 for additional validation.
🎯 Dynamic Overbought & Oversold Detection
Sell signal occurs when the price touches the Bollinger Bands Upper.
Buy signal occurs when the price touches the Bollinger Bands Lower.
🔥 High Win Rate Scalping Strategy
Designed to capture quick price movements in trending markets.
Ideal for traders looking for fast executions with controlled risk.
🎨 Customizable Visual Enhancements
Users can adjust indicator colors to match their personal preferences.
How It Works
1️⃣ EMA-Based Trend Identification
The indicator applies 4 EMAs to determine short-term and medium-term trends.
If the price is above all EMAs → Bullish trend.
If the price is below all EMAs → Bearish trend.
2️⃣ Bollinger Bands Signal Generation
Sell Entry: When the price touches Bollinger Bands Upper, indicating an overbought area.
Buy Entry: When the price touches Bollinger Bands Lower, indicating an oversold area.
3️⃣ Scalping Execution
Entries are executed only on lower timeframes with trend confirmation from H1 EMA.
Profit targets are adjusted based on volatility, while stop loss is placed outside the Bollinger Bands.
4️⃣ Visual Customization
Indicator colors can be modified for better visibility.
Practical Applications
✅ Scalping Strategy – Uses Bollinger Bands and EMA filtering for fast trades.
✅ Trend Confirmation – Multi-timeframe EMA validation ensures precise entries.
✅ Dynamic Support & Resistance – Bollinger Bands help identify potential reversals.
✅ Noise Reduction – EMA filtering removes minor price fluctuations for clearer signals.
🛠 Settings
EMA Periods: 4 EMAs for trend filtering.
Bollinger Bands Length: 20 (default), adjustable.
Bollinger Bands Deviation: 2 (default).
Color Customization: Users can personalize indicator colors as needed.
📌 Conclusion
Base Market Strategy (BMS) is a high win-rate scalping indicator, combining trend-following EMA filtering with momentum reversal detection from Bollinger Bands. With a dynamic and adaptive approach, this indicator provides precise entry signals while reducing noise from insignificant price movements.
Key Takeaways:
✔ High Accuracy – A combination of EMA and Bollinger Bands provides clear signals.
✔ Scalping Optimization – Works best on lower timeframes with H1 validation.
✔ Visual Customization – Users can adjust the indicator colors to their preference.
✔ Simple Yet Powerful – Easy to use but highly effective in capturing market opportunities.
🔹 Disclaimer: Trading carries high risks. Always backtest and optimize settings to align with your risk tolerance before live trading.
Advanced Trend finder by S B PrasadAdvanced Trend finder – by S B Prasad
A Professional Multi-Engine Trend, Breakout & Scalping System
Advanced Trend Navigator is a powerful all-in-one trading indicator that fuses smart EMA trend detection, adaptive multi-filters, ribbon trend analysis, automatic trend channels, divergence detection, and built-in SL/Target projection into a single, visually intuitive system.
It is engineered for both scalpers and swing traders, with special optimization for 1-minute and 5-minute charts, while remaining highly reliable on higher timeframes.
🔹 What Makes This Indicator Unique?
Unlike single-logic indicators, Advanced Trend Navigator uses a dual-engine + structure-based approach:
EMA Smart Signal Engine → detects trend, reversals, and momentum shifts
Ribbon + Trend Channel Engine → confirms structure, breakouts, and continuation
Adaptive Filters + Divergence → remove noise and boost confidence
Risk Engine (SL/TP) → projects structured trade exits
This confluence-based design dramatically reduces false signals.
🔹 Core Features
1️⃣ Smart EMA Trend Engine
Dual EMA crossover system (Fast & Slow)
Automatic optimization for 1-minute timeframe
Detects:
Trend direction
Trend reversals
Momentum shifts
2️⃣ Multi-Layer Signal Filters
Signals are validated using a powerful adaptive filter stack:
Volume Filter (above-average volume confirmation)
RSI Filter with dynamic buy/sell thresholds
Bollinger Bands (overbought / oversold zones)
Momentum Filter (ROC-based strength detection)
Volatility Adaptation (ATR-based regime detection)
These filters dramatically reduce noise and false entries.
3️⃣ RSI Divergence Detection (1-Minute Optimized)
Bullish and bearish divergence detection
Automatic confidence boost when divergence appears
Helps identify early reversals and exhaustion zones
4️⃣ Enhanced Signal Logic
Signals are generated using a confluence of:
EMA crossovers
Candle direction
Volume + RSI + BB + Momentum
Divergence + trend-change logic
Separate logic is used for:
1-minute scalping
Higher-timeframe trend trading
5️⃣ Ribbon Trend System (CoraWave + LazyLine)
Advanced smoothed ribbon using:
CoraWave (fast line)
LazyLine (slow line)
Dynamic color-changing trend visualization
Ribbon fill highlights:
Strong bullish zones
Strong bearish zones
Neutral / transition phases
6️⃣ Automatic Trend Channel
Pivot-based dynamic trend channels
ATR-adjusted channel width
Auto-extended support & resistance structure
Visual map of evolving trend direction
7️⃣ Buy / Sell Breakout Signals (No-Spam Logic)
Signals only when:
Ribbon trend agrees
Price breaks channel boundaries
Built-in cooldown filter to prevent over-trading
Separate engine from EMA signals for dual confirmation
8️⃣ Built-In SL / Target Projection
Automatic Stop-Loss based on channel boundary
Risk-based Target 1 and Target 2 (R-multiples)
Dynamic plotting of:
SL line
Target 1 line
Target 2 line
9️⃣ Smart Time & Profit Projection
ATR-based time-to-move estimation
Dynamic profit potential estimation
Displays:
Expected move duration (minutes)
Approximate profit projection
🔟 Confidence Scoring System
Dynamic confidence % for each signal
Automatically increases when:
Divergence is detected
Bollinger extremes are triggered
🎨 Visual & Usability Features
Color-coded:
EMA lines
Ribbon trend
Trend channels
Background trend bias
Dynamic:
LONG / SHORT arrows
Signal labels with confidence + projection
Current trend status box
🔔 Alerts Included
EMA-based LONG / SHORT alerts
Ribbon fast/slow trend change alerts
Channel breakout BUY / SELL alerts
Alert messages include:
Symbol
Confidence %
Time projection
⚡ Recommended Presets
🟢 1-Minute Scalping
Fast EMA: 3 | Slow EMA: 8
Volume Filter: ON (1.1)
RSI: ON
Bollinger Bands: ON
Momentum: ON
Volatility Adaptation: ON
Ribbon: 10 / 3 / 15
Channel: Pivot 5 | ATR 14 | Width 1.5
Cooldown: 20
Targets: 1R & 2R
🔵 5-Minute Scalping (Author Preset)
Fast EMA: 5 | Slow EMA: 13
Volume Filter: ON (1.2)
RSI: OFF
Bollinger Bands: ON
Momentum: OFF
Volatility Adaptation: OFF
Ribbon: 12 / 3 / 18
Channel: Pivot 7 | ATR 14 | Width 1.7
Cooldown: 25
Targets: 1R & 2.5R
🟣 Swing Trading (15m–1H)
Fast EMA: 9 | Slow EMA: 21
Filters: All OFF
Ribbon: 15 / 5 / 25
Channel: Pivot 10 | ATR 14 | Width 2.0
Cooldown: 40
Targets: 1.5R & 3R
🎯 How to Trade This Indicator
BUY Setup:
Fast EMA > Slow EMA
Ribbon is green and rising
Price breaks above upper channel
Volume filter passes
Buy arrow appears
SELL Setup:
Fast EMA < Slow EMA
Ribbon is red and falling
Price breaks below lower channel
Volume filter passes
Sell arrow appears
❌ Avoid Trades When
Ribbon is flat or mixed colors
Channel is very narrow
Price is inside the channel
Volume filter fails
Market is extremely choppy
⚠️ Disclaimer
This indicator is a technical analysis tool, not financial advice.
Always use proper risk management and confirm signals with market context.
Past performance does not guarantee future results.

chart Pattern & Candle sticks Strategy# **XAUUSD Pattern & Candle Strategy - Complete Description**
## **Overview**
This Pine Script indicator is a comprehensive multi-factor trading system specifically designed for **XAUUSD (Gold) scalping and swing trading**. It combines classical technical analysis methods including candlestick patterns, chart patterns, moving averages, and volume analysis to generate high-probability buy/sell signals with automatic stop-loss and take-profit levels.
***
## **Core Components**
### **1. Moving Average System (Triple MA)**
**Purpose:** Identifies trend direction and momentum
- **Fast MA (20-period)** - Short-term price action
- **Medium MA (50-period)** - Intermediate trend
- **Slow MA (200-period)** - Long-term trend direction
**How it works:**
- **Bullish alignment**: MA20 > MA50 > MA200 (all pointing up)
- **Bearish alignment**: MA20 < MA50 < MA200 (all pointing down)
- **Crossover signals**: When Fast MA crosses Medium MA, it triggers buy/sell signals
- **Choice of SMA or EMA**: Adjustable based on preference
**Visual indicators:**
- Blue line = Fast MA
- Orange line = Medium MA
- Light red line = Slow MA
- Green background tint = Bullish trend
- Red background tint = Bearish trend
---
### **2. Candlestick Pattern Recognition (13 Patterns)**
**Purpose:** Identifies reversal and continuation signals based on price action
#### **Bullish Patterns (Signal potential upward moves):**
1. **Hammer** 🔨
- Long lower wick (2x body size)
- Small body at top
- Indicates rejection of lower prices (buyers stepping in)
- Best at support levels
2. **Inverted Hammer**
- Long upper wick
- Small body at bottom
- Shows buying pressure despite initial selling
3. **Bullish Engulfing** 📈
- Green candle completely engulfs previous red candle
- Strong reversal signal
- Body must be 1.2x larger than previous
4. **Morning Star** ⭐
- 3-candle pattern
- Red candle → Small indecision candle → Large green candle
- Powerful reversal at bottoms
5. **Piercing Line** ⚡
- Green candle closes above 50% of previous red candle
- Indicates strong buying interest
6. **Bullish Marubozu**
- Almost no wicks (95% body)
- Very strong bullish momentum
- Body must be 1.3x average size
#### **Bearish Patterns (Signal potential downward moves):**
7. **Shooting Star** 💫
- Long upper wick
- Small body at bottom
- Indicates rejection of higher prices (sellers in control)
- Best at resistance levels
8. **Hanging Man**
- Similar to hammer but appears at top
- Warning of potential reversal down
9. **Bearish Engulfing** 📉
- Red candle completely engulfs previous green candle
- Strong reversal signal
10. **Evening Star** 🌙
- 3-candle pattern (opposite of Morning Star)
- Green → Small → Large red candle
- Powerful top reversal
11. **Dark Cloud Cover** ☁️
- Red candle closes below 50% of previous green candle
- Indicates strong selling pressure
12. **Bearish Marubozu**
- Almost no wicks, pure red body
- Very strong bearish momentum
#### **Neutral Pattern:**
13. **Doji**
- Open and close nearly equal (tiny body)
- Indicates indecision
- Often precedes major moves
**Detection Logic:**
- Compares body size, wick ratios, and position relative to previous candles
- Uses 14-period average body size as reference
- All patterns validated against volume confirmation
***
### **3. Chart Pattern Recognition**
**Purpose:** Identifies major support/resistance and reversal patterns
#### **Patterns Detected:**
**Double Bottom** 📊 (Bullish)
- Two lows at approximately same level
- Indicates strong support
- Breakout above neckline triggers buy signal
- Most reliable at major support zones
**Double Top** 📊 (Bearish)
- Two highs at approximately same level
- Indicates strong resistance
- Breakdown below neckline triggers sell signal
- Most reliable at major resistance zones
**Support & Resistance Levels**
- Automatically plots recent pivot highs (resistance)
- Automatically plots recent pivot lows (support)
- Uses 3-bar strength for validation
- Levels shown as dashed horizontal lines
**Price Action Patterns**
- **Uptrend detection**: Higher highs + higher lows
- **Downtrend detection**: Lower highs + lower lows
- Confirms overall market structure
***
### **4. Volume Analysis**
**Purpose:** Confirms signal strength and filters false signals
**Metrics tracked:**
- **Volume MA (20-period)**: Baseline average volume
- **High volume threshold**: 1.5x the volume average
- **Volume increase**: Current volume > previous 2 bars
**How it's used:**
- All buy/sell signals **require volume confirmation**
- High volume = institutional participation
- Low volume signals are filtered out
- Prevents whipsaw trades during quiet periods
**Visual indicator:**
- Dashboard shows "High" volume in orange when active
- "Normal" shown in gray during low volume
***
### **5. Signal Generation Logic**
**BUY SIGNALS triggered when ANY of these occur:**
1. **Candlestick + Volume**
- Bullish candle pattern detected
- High volume confirmation
- Price above Fast MA
2. **MA Crossover + Volume**
- Fast MA crosses above Medium MA
- High volume confirmation
3. **Double Bottom Breakout**
- Price breaks above support level
- Volume confirmation present
4. **Trend Continuation**
- Uptrend structure intact (higher highs/lows)
- All MAs in bullish alignment
- Price above Fast MA
- Volume confirmation
**SELL SIGNALS triggered when ANY of these occur:**
1. **Candlestick + Volume**
- Bearish candle pattern detected
- High volume confirmation
- Price below Fast MA
2. **MA Crossunder + Volume**
- Fast MA crosses below Medium MA
- High volume confirmation
3. **Double Top Breakdown**
- Price breaks below resistance level
- Volume confirmation present
4. **Trend Continuation**
- Downtrend structure intact (lower highs/lows)
- All MAs in bearish alignment
- Price below Fast MA
- Volume confirmation
***
### **6. Risk Management System**
**Automatic Stop Loss Calculation:**
- Based on ATR (Average True Range) - 14 periods
- **Formula**: Entry price ± (ATR × SL Multiplier)
- **Default multiplier**: 1.5 (adjustable)
- Adapts to market volatility automatically
**Automatic Take Profit Calculation:**
- **Formula**: Entry price ± (ATR × TP Multiplier)
- **Default multiplier**: 2.5 (adjustable)
- **Default Risk:Reward ratio**: 1:1.67
- Higher TP multiplier = more aggressive targets
**Position Management:**
- Tracks ONE position at a time (no pyramiding)
- Automatically closes position when:
- Stop loss is hit
- Take profit is reached
- Opposite MA crossover occurs
- Prevents revenge trading and over-leveraging
**Visual Representation:**
- **Red horizontal line** = Stop Loss level
- **Green horizontal line** = Take Profit level
- Lines remain on chart while position is active
- Automatically disappear when position closes
***
### **7. Visual Elements**
**On-Chart Displays:**
1. **Moving Average Lines**
- Fast MA (Blue, thick)
- Medium MA (Orange, thick)
- Slow MA (Red, thin)
2. **Support/Resistance**
- Green crosses = Support levels
- Red crosses = Resistance levels
3. **Buy/Sell Arrows**
- Large GREEN "BUY" label below bars
- Large RED "SELL" label above bars
4. **Pattern Labels** (Small markers)
- "Hammer", "Bull Engulf", "Morning Star" (green, below bars)
- "Shooting Star", "Bear Engulf", "Evening Star" (red, above bars)
- "Double Bottom" / "Double Top" (blue/orange)
5. **Signal Detail Labels** (Medium size)
- Shows signal reason (e.g., "Bullish Candle", "MA Cross Up")
- Displays Entry, SL, and TP prices
- Color-coded (green for long, red for short)
6. **Background Coloring**
- Light green tint = Bullish MA alignment
- Light red tint = Bearish MA alignment
***
### **8. Information Dashboard**
**Top-right corner table showing:**
| Metric | Description |
|--------|-------------|
| **Position** | Current trade status (LONG/SHORT/None) |
| **MA Trend** | Overall trend direction (Bullish/Bearish/Neutral) |
| **Volume** | Current volume status (High/Normal) |
| **Pattern** | Last detected candlestick pattern |
| **ATR** | Current volatility measurement |
**Purpose:**
- Quick at-a-glance market assessment
- Real-time position tracking
- No need to check multiple indicators
***
### **9. Alert System**
**Complete alert coverage for:**
✅ **Entry Alerts**
- "Buy Signal" - Triggers when buy conditions met
- "Sell Signal" - Triggers when sell conditions met
✅ **Exit Alerts**
- "Long TP Hit" - Take profit reached on long position
- "Long SL Hit" - Stop loss triggered on long position
- "Short TP Hit" - Take profit reached on short position
- "Short SL Hit" - Stop loss triggered on short position
**How to use:**
1. Click "Create Alert" button
2. Select desired alert from dropdown
3. Set notification method (popup, email, SMS, webhook)
4. Never miss a trade opportunity
***
## **Recommended Settings**
### **For Scalping (Quick trades):**
- **Timeframe**: 5-minute
- **Fast MA**: 9
- **Medium MA**: 21
- **Slow MA**: 50
- **SL Multiplier**: 1.0
- **TP Multiplier**: 2.0
- **Volume Threshold**: 1.5x
### **For Swing Trading (Longer holds):**
- **Timeframe**: 1-hour or 4-hour
- **Fast MA**: 20
- **Medium MA**: 50
- **Slow MA**: 200
- **SL Multiplier**: 2.0
- **TP Multiplier**: 3.0
- **Volume Threshold**: 1.3x
### **Best Trading Hours for XAUUSD:**
- **Asian Session**: 00:00 - 08:00 GMT (lower volatility)
- **London Session**: 08:00 - 16:00 GMT (high volatility) ⭐
- **New York Session**: 13:00 - 21:00 GMT (highest volume) ⭐
- **London-NY Overlap**: 13:00 - 16:00 GMT (BEST for scalping) 🔥
***
## **How to Use This Strategy**
### **Step 1: Setup**
1. Open TradingView
2. Load XAUUSD chart
3. Select timeframe (5m, 15m, 1H, or 4H)
4. Add indicator from Pine Editor
5. Adjust settings based on your trading style
### **Step 2: Wait for Signals**
- Watch for GREEN "BUY" or RED "SELL" labels
- Check the signal reason in the detail label
- Verify dashboard shows favorable conditions
- Confirm volume is "High" (not required but preferred)
### **Step 3: Enter Trade**
- Enter at market or limit order near signal price
- Note the displayed Entry, SL, and TP prices
- Set your broker's SL/TP to match indicator levels
### **Step 4: Manage Position**
- Watch for SL/TP lines on chart
- Monitor dashboard for trend changes
- Exit manually if opposite MA crossover occurs
- Let SL/TP do their job (don't move them!)
### **Step 5: Review & Learn**
- Track win rate over 20+ trades
- Adjust multipliers if needed
- Note which patterns work best for you
- Refine entry timing
***
## **Key Advantages**
✅ **Multi-confirmation approach** - Reduces false signals significantly
✅ **Automatic risk management** - No manual calculation needed
✅ **Adapts to volatility** - ATR-based SL/TP adjusts to market conditions
✅ **Volume filtered** - Ensures institutional participation
✅ **Visual clarity** - Easy to understand at a glance
✅ **Complete alert system** - Never miss opportunities
✅ **Pattern education** - Learn patterns as they appear
✅ **Works on all timeframes** - Scalping to swing trading
***
## **Limitations & Considerations**
⚠️ **Not a holy grail** - No strategy wins 100% of trades
⚠️ **Requires practice** - Demo trade first to understand signals
⚠️ **Market conditions matter** - Works best in trending or volatile markets
⚠️ **News events** - Avoid trading during major economic releases
⚠️ **Slippage on 5m** - Fast markets may have execution delays
⚠️ **Pattern subjectivity** - Some patterns may trigger differently than expected
***
## **Risk Management Rules**
1. **Never risk more than 1-2% per trade**
2. **Maximum 3 positions per day** (avoid overtrading)
3. **Don't trade during major news** (NFP, FOMC, etc.)
4. **Use proper position sizing** (0.01 lot per $100 for micro accounts)
5. **Keep trade journal** (track patterns, win rate, mistakes)
6. **Stop trading after 3 consecutive losses** (psychological reset)
7. **Don't move stop loss further away** (accept losses)
8. **Take partial profits** at 1:1 R:R if desired
***
## **Expected Performance**
**Realistic expectations:**
- **Win rate**: 50-65% (depending on market conditions and timeframe)
- **Risk:Reward**: 1:1.67 default (adjustable to 1:2 or 1:3)
- **Signals per day**: 3-8 on 5m, 1-3 on 1H
- **Best months**: High volatility periods (news events, economic uncertainty)
- **Drawdowns**: Expect 3-5 losing trades in a row occasionally
***
## **Customization Options**
All inputs are adjustable in settings panel:
**Moving Averages:**
- Type (SMA or EMA)
- All three period lengths
**Volume:**
- Volume MA length
- High volume multiplier threshold
**Chart Patterns:**
- Pattern strength (bars for pivot detection)
- Show/hide pattern labels
**Risk Management:**
- ATR period
- Stop loss multiplier
- Take profit multiplier
**Display:**
- Toggle pattern labels
- Customize colors (in code)
***
## **Conclusion**
This is a **professional-grade, multi-factor trading system** that combines the best of classical technical analysis with modern risk management. It's designed to give clear, actionable signals while automatically handling the complex calculations of stop loss and take profit levels.
**Best suited for traders who:**
- Understand basic technical analysis
- Can follow rules consistently
- Prefer systematic approach over gut feeling
- Want visual confirmation before entering trades
- Value proper risk management
**Start with demo trading** for at least 20-30 trades to understand how the signals work in different market conditions. Once comfortable and profitable on demo, transition to live trading with minimal risk per trade.
Happy trading! 📈🎯

Adaptive Trend Breaks Adaptive Trend Breaks
## WHAT IT DOES
This script is a modified and enhanced version of "Trendline Breakouts With Targets" concept by ChartPrime.
Adaptive Trend Breaks (ATB) is a trendline breakout system optimized for scalping liquid futures contracts. The indicator automatically draws dynamic support and resistance trendlines based on pivot points, then generates trade signals when price breaks through these levels with confirmation filters. It includes automated target and stop-loss placement with real-time P&L tracking in dollars.
## HOW IT WORKS
**Trendline Detection Method:**
The indicator uses pivot high/low detection to identify significant price turning points. When a new pivot forms, it calculates the slope between consecutive pivots to draw dynamic trendlines. These lines extend forward based on the established trend angle, creating actionable support and resistance zones.
**Band System:**
Around each trendline, the script creates a "band" using a volatility-adjusted calculation: `ATR(14) * 0.2 * bandwidth multiplier / 2`. This adaptive band accounts for current market conditions - wider during volatile periods, tighter during quiet markets.
**Breakout Logic:**
A breakout signal triggers when:
1. Price closes beyond the trendline + band zone
2. Volume exceeds the 20-period moving average by your set multiplier (default 1.2x)
3. Price is within Regular Trading Hours (9:30-16:00 EST) if session filter enabled
4. Current ATR meets minimum volatility threshold (prevents trading dead markets)
**Target & Stop Calculation:**
Upon breakout confirmation:
- **Entry**: Trendline breach point
- **Target**: Entry ± (bandwidth × target multiplier) - default 8x for quick scalps
- **Stop**: Entry ± (bandwidth × stop multiplier) - default 8x for 1:1 risk/reward
- Multipliers adjust automatically to market volatility through the ATR-based band
**P&L Conversion:**
The script converts point movements to dollars using:
```
Dollar P&L = (Price Points × Contract Point Value × Quantity)
```
For example, a 10-point NQ move with 2 contracts = 10 × $20 × 2 = $400
## HOW TO USE IT
**Setup:**
1. Select your instrument (NQ/ES/YM/RTY) - point values auto-configure
2. Set contract quantity for accurate dollar P&L
3. Choose pivot period (lower = more signals but more noise, default 5 for scalping)
4. Adjust bandwidth multiplier if trendlines are too tight/loose (1-5 range)
**Filters Configuration:**
- **Volume Filter**: Requires breakout volume > moving average × multiplier. Increase multiplier (1.5-2.0) for higher conviction trades
- **Session Filter**: Enable to trade only RTH. Disable for 24-hour trading
- **ATR Filter**: Prevents signals during low volatility. Increase minimum % for more active markets only
**Risk Management:**
- Set target/stop multipliers based on your risk tolerance
- 8x bandwidth = approximately 1:1 risk/reward for most liquid futures
- Enable trailing stops for trend-following approach (moves stop to protect profits)
- Adjust line length to see targets further into the future
**Statistics Table:**
- Choose timeframe to analyze: all-time, today, this week, custom days
- Monitor win rate, profit factor, and net P&L in dollars
- Track long vs short performance separately
- See real-time unrealized P&L on active trades
**Reading Signals:**
- **Green triangle below bar** = Long breakout (resistance broken)
- **Red triangle above bar** = Short breakout (support broken)
- **White dashed line** = Entry price
- **Orange line** = Take profit target with dollar value
- **Red line** = Stop loss with dollar value
- **Green checkmark (✓)** = Target hit, winning trade
- **Red X (✗)** = Stop hit, losing trade
## WHAT IT DOES NOT DO
**Limitations to Understand:**
- Does not predict future trendline formations - it reacts to breakouts after they occur
- Historical trendlines disappear after breakout (not kept on chart for clarity)
- Requires sufficient volatility - may not signal in extremely quiet markets
- Volume filter requires exchange volume data (not available on all symbols)
- Statistics are indicator-based simulations, not actual trading results
- Does not account for slippage, commissions, or order fills
## BEST PRACTICES
**Recommended Settings by Market:**
- **NQ (Nasdaq)**: Default settings work well, consider volume multiplier 1.3-1.5
- **ES (S&P 500)**: Slightly slower, try period 7-8, volume 1.2
- **YM (Dow)**: Lower volatility, reduce bandwidth to 1.5-2
- **RTY (Russell)**: Higher volatility, increase bandwidth to 3-4
**Risk Management:**
- Never risk more than 2-3% of account per trade
- Use contract quantity calculator: Max Risk $ ÷ (Stop Distance × Point Value)
- Start with 1 contract while learning the system
- Backtest your specific timeframe and instrument before live trading
**Optimization Tips:**
- Increase pivot period (7-10) for fewer but higher-quality signals
- Raise volume multiplier (1.5-2.0) in choppy markets
- Lower target/stop multipliers (5-6x) for tighter profit taking
- Use trailing stops in strong trending conditions
- Disable session filter for overnight gaps and Asia session moves
## TECHNICAL DETAILS
**Key Calculations:**
- Pivot Detection: `ta.pivothigh(high, period, period/2)` and `ta.pivotlow(low, period, period/2)`
- Slope Calculation: `(newPivot - oldPivot) / (newTime - oldTime)`
- Adaptive Band: `min(ATR(14) * 0.2, close * 0.002) * multiplier / 2`
- Breakout Confirmation: Price crosses trendline + 10% of band threshold
**Data Requirements:**
- Minimum bars in view: 500 for proper pivot calculation
- Volume data required for volume filter accuracy
- Intraday timeframes recommended (1min - 15min) for scalping
- Works on any timeframe but optimized for fast execution
**Performance Metrics:**
All statistics calculate based on indicator signals:
- Tracks every signal as a trade from entry to TP/SL
- P&L in actual contract dollar values
- Win rate = (Winning trades / Total trades) × 100
- Profit factor = Gross profit / Gross loss
- Separates long/short performance for bias analysis
## IDEAL FOR
- Futures scalpers and day traders
- Traders who prefer visual trendline breakouts
- Those wanting automated TP/SL placement
- Traders tracking performance in dollar terms
- Multiple timeframe analysis (compare 1min vs 5min signals)
## NOT SUITABLE FOR
- Swing trading (targets too close)
- Stocks/forex without modifying point values
- Extremely low timeframes (<30 seconds) - too much noise
- Markets without volume data if using volume filter
- Illiquid contracts (signals may not execute at shown prices)
---
**Settings Summary:**
- Core: Period, bandwidth, extension, trendline style
- Filters: Volume, RTH session, ATR volatility
- Risk: R:R ratio, target/stop multipliers, trailing stop
- Display: Stats table position, size, colors
- Stats: Timeframe selection (all-time to custom days)
**License:** This indicator is published open-source under Mozilla Public License 2.0. You may use and modify the code with proper attribution.
**Disclaimer:** This indicator is for educational purposes. Past performance does not guarantee future results. Always practice proper risk management and test thoroughly before live trading.
---
## CREDITS & ATTRIBUTION
This script builds upon the "Trendline Breakouts With Targets" concept by ChartPrime with significant enhancements:
**Major Improvements Added:**
- **Futures-Specific Calculations**: Automated dollar P&L conversion using actual contract point values (NQ=$20, ES=$50, YM=$5, RTY=$50)
- **Advanced Statistics Engine**: Comprehensive performance tracking with customizable timeframe analysis (today, week, month, custom ranges)
- **Multi-Layer Filtering System**: Volume confirmation, RTH session filter, and ATR volatility filter to reduce false signals
- **Professional Trade Management**: Enhanced visual trade tracking with separate TP/SL lines, dollar value labels, and optional trailing stops
- **Optimized for Scalping**: Faster pivot periods (5 vs 10), tighter bands, and reduced extension bars for quick entries
Original trendline detection methodology by ChartPrime - used with modification under Mozilla Public License 2.0.

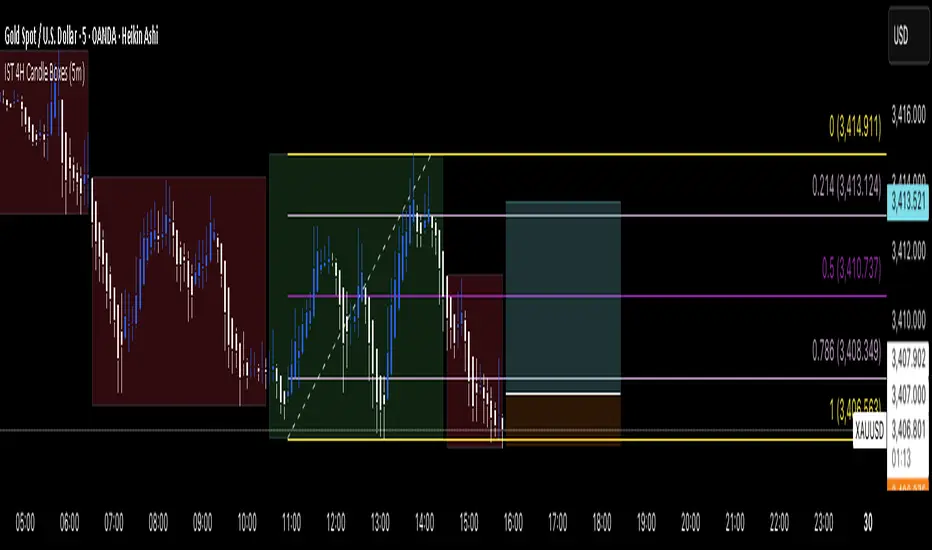
IST 4H Candle Boxes (5m)highlights forex 4h session in IST. Works for scalping with 4h bias.
highlights forex 4h session in IST. Works for scalping with 4h bias.
highlights forex 4h session in IST. Works for scalping with 4h bias.
highlights forex 4h session in IST. Works for scalping with 4h bias.
Market Matrix ViewThis technical indicator is designed to provide traders with a quick and integrated view of market dynamics by combining several popular indicators into a single tool. It's not a magic bullet, but a practical aid for analyzing buying/selling pressure, trends, volume, and divergences, saving you time in the decision-making process. Built for flexibility, the indicator adapts to various trading styles (scalping, swing, or long-term) and offers customizable settings to suit your needs.
🟡 Multi-Timeframe Trends
➤ This section displays the trend direction (bullish, bearish, or neutral) across 15-minute, 1-hour, 4-hour, and Daily timeframes, providing multi-timeframe market context. Timeframes lower than the one currently selected will show "N/A."
➤It utilizes fast and slow Exponential Moving Averages (EMAs) for each timeframe:
15m: Fast EMA 42, Slow EMA 170
1h: Fast EMA 40, Slow EMA 100
4h: Fast EMA 36, Slow EMA 107
Daily: Fast EMA 20, Slow EMA 60
🟡 Smart Flow & RVOL
➤ This section displays "Buying Pressure" or "Selling Pressure" signals based on indicator confluence, alongside volume activity ("High Activity," "Normal Activity," or "Low Activity").
➤ Smart Flow combines Chaikin Money Flow (CMF) and Money Flow Index (MFI) to detect buying/selling pressure. CMF measures money flow based on price position within the high-low range, while MFI analyzes money flow considering typical price and volume. A signal is generated only when both indicators simultaneously increase/decrease beyond an adjustable threshold ("Buy/Sell Sensitivity") and volume exceeds a Simple Moving Average (SMA) scaled by the "Volume Multiplier."
➤ RVOL (Relative Volume) calculates relative volume separately for bullish and bearish candles, comparing recent volume (fast SMA) with a reference volume (slow SMA). Thresholds are adjusted based on the selected mode.
🟡 ADX & RSI
This section displays trend strength ("Strong," "Moderate," or "Weak"), its direction ("Bullish" or "Bearish"), and the RSI momentum status ("Overbought," "Oversold," "Buy/Sell Momentum," or "Neutral").
➤ ADX (Average Directional Index) measures trend strength (above 40 = "Strong," 20–40 = "Moderate," below 20 = "Weak"). Direction is determined by comparing +DI (upward movement) with -DI (downward movement). Additionally, an arrow indicates whether the trend's strength is decreasing or increasing.
➤RSI (Relative Strength Index) evaluates price momentum. Extreme levels (above 80/85 = "Overbought," below 15/20 = "Oversold") and intermediate zones (47–53 = "Neutral," above 53 = "Buy Momentum," below 47 = "Sell Momentum") are adjusted based on the selected mode.
🟡 When these signals are active for a potential trade setup, the table's background lights up green or red, respectively.
🟡 Volume Spikes
➤This feature highlights bars with significantly higher volume than the recent average, coloring them yellow on the chart to draw attention to intense market activity.
➤It uses the Z-Score method to detect volume anomalies. Current volume is compared to a 10-bar Simple Moving Average (SMA) and the standard deviation of volume over the same period. If the Z-Score exceeds a certain threshold, the bar is marked as a volume spike.
🟡 Divergences (Volume Divergence Detection)
➤ This feature marks divergences between price and technical indicators on the chart, using diamond-shaped labels (green for bullish divergences, red for bearish divergences) to signal potential trend reversals.
➤ It compares price deviations from a Simple Moving Average (SMA) with deviations of three indicators: Chaikin Money Flow (CMF), Money Flow Index (MFI), and On-Balance Volume (OBV). A bullish divergence occurs when price falls below its average, but CMF, MFI, and OBV rise above their averages, indicating hidden accumulation. A bearish divergence occurs when price rises above its average, but CMF, MFI, and OBV fall, suggesting distribution. The length of the moving averages is adjustable (default 13/10/5 bars for Scalping/Balanced/Swing), and detection thresholds are scaled by "Divergence Sensitivity" (default 1.0).
🟡 Adaptive Stop-Loss (ATR)
➤Draws dynamic stop-loss lines (red, dashed) on the chart for buy or sell signals, helping traders manage risk.Uses the Average True Range (ATR) to calculate stop-loss levels, set at low/high ± ATR × multiplier
🟡 Alerts for trend direction changes in the Info Panel:
➤ Triggers notifications when the trend shifts to Bullish (when +DI crosses above -DI) or Bearish (when +DI crosses below -DI), helping you stay informed about key market shifts.
How to use: Set alerts in Trading View for “Trend Changed to Bullish” or “Trend Changed to Bearish” with “Once Per Bar Close” for reliable signals.
🟡 Settings (Inputs)
➤ The indicator offers customizable settings to fit your trading style, but it's already optimized for Scalping (1m–15m), Balanced (16m–3h59m), and Swing (4h–Daily) modes, which automatically adjust based on the selected timeframe. The visible inputs allow you to adjust the following parameters:
Show Info Panel: Enables/disables the information panel (default: enabled).
Show Volume Spikes: Turns on/off coloring for volume spike bars (default: enabled).
Spike Sensitivity: Controls the Z-Score threshold for detecting volume spikes (default: 2.0; lower values increase signal frequency).
Show Divergence: Enables/disables the display of divergence labels (default: enabled).
Divergence Sensitivity: Adjusts the thresholds for divergence detection (default: 1.0; higher values reduce sensitivity).
Divergence Lookback Length: Sets the length of the moving averages used for divergences (default: 5, automatically adjusted to 13/10/5 for Scalping/Balanced/Swing).
RVOL Reference Period: Defines the reference period for relative volume (default: 20, automatically adjusted to 7/15/20).
RSI Length: Sets the RSI length (default: 14, automatically adjusted to 5/10/14).
Buy Sensitivity: Controls the increase threshold for Buying Pressure signals (default: 0.007; higher values reduce frequency).
Sell Sensitivity: Controls the decrease threshold for Selling Pressure signals (default: 0.007; higher values reduce frequency).
Volume Multiplier (B/S Pressure): Adjusts the volume threshold for Smart Flow signals (default: 0.6; higher values require greater volume).
🟡 This indicator is created to simplify market analysis, but I am not a professional in Pine Script or technical indicators. This indicator is not a standalone solution. For optimal results, it must be integrated into a well-defined trading strategy that includes risk management and other confirmations.

RSI + Fibonacci HH LL Support Resistance I have integrated my past scripts and brushed them up further.
This tool allows for support/resistance, stop loss, take profit, and trend analysis using RSI and Fibonacci ratios.
For example, the Fibonacci ratio is used as follows
l1 = m - dist * 0.618
l2 = m - dist * 1.618
l3 = m - dist * 2.618
l4 = m - dist * 4.235
l5 = m - dist * 6.857
l6 = m - dist * 11.089
When the Fibonacci ratio reaches 2.618 or higher and the RSI smoothed by the 5-day EMA is oversold/overbought, the bar color is changed by a gradation.
We have tried to make the design as beautiful and good-looking as possible. You can also hide the lines to suit your own preference.
Example usages are here:
BTCUSDT 1Hour Chart
Using Fibonacci numbers
BTCUSDT 15min Chart, for Scalping
Here, to set the highest and lowest prices one hour ago, "4" is substituted as the calculation: 15 minutes x 4 = 60
BTCUSDT 15min Chart, for Scalping
To set the highest and lowest prices 4 hours ago , "4" is substituted as the calculation: 15 minutes x 16 = 240
BTCUSDT 15min Chart, for Scalping
To draw yesterday's high and low as support/resistance lines, I substituted the number "96" as 1440/15=96.
BTCUSDT 1min Chart, for Scalping
Substituted "60" to trail the highest and lowest prices over a 60-minute period on a 1-minute chart, and removed lines to beautify
BTCUSDT 1day Chart, for Long-Term Investers
This is an example of using "90" because it is a 1-day chart and assumes that 3 months = 90 days in order to trail the highest and lowest prices over a 3-month period and no lines.
My past scripts are here:
RSI + FIB HH LL StopLoss Finder/Contrarian Trades
Fibonacci HH LL TRAMA Band

ROC_PA_Strategy (A3Sh)Hi there,
An experiment with rate of price change in combination with price averaging. The strategy is inspired by Price Change Scalping Strategy developed by Prosum Solutions and Scalping Dips On Trend Strategy developed by Coinrule. Both strategies look at the percentage of price change to open orders.
When the price drops beyond a specified percentage, a order entry threshold (yellow line) is setup. The order entry threshold is only active for a specified number of bars and will de-activate when not crossed within the specified number of bars. When the price drops further and crosses the entry threshold with a minimum of a specified percentage, a long position is entered. The same reverse logic (white line) used to close the long position.
I first ran the strategy without stop loss and take profit and that worked very well in a bullish market. I later added stop loss and take profit and that seems to work better in a side ways or bearisch market. There are a lot of tweaking possibilities in the settings.
In the settings you can specify the percentage of portfolio to use for each trade to spread the risk and for each order a trading fee of 0.075% is calculated.

Bulkowski Flag Master ProEnglish: Entry & Exit GuideEntry Signal (BUY): A lime "BUY" triangle appears when the price breaks above a valid flag's resistance line. This is the official breakout signal based on Bulkowski's methodology. Target Price (Lime Dashed Line): Automatically calculated using the formula:$Target = Breakout Price + \frac{(Pattern High - Pattern Low)}{2}$.Bulkowski states this rule is accurate nearly 90% of the time for this pattern. Stop Loss (Red Dashed Line): Positioned at the bottom of the flag (consolidation low). Professional traders exit immediately if the price dips back below this level. KST Sessions:Red Highlight: US Opening 3H (KST 23:30 - 02:30) - Peak volatility for scalping.Indicator Filtering: For the highest probability, only take BUY signals when the price is above the Yellow EMA 200 and Aqua VWAP.

Bulkowski Breakout vPRO (5m) - Runtime FixedHere is the English translation of your strategy guide, tailored for international traders while maintaining your encouraging tone.Strategy Guide: Bulkowski Breakout vPROFor Aspiring "Golden Traders"This strategy is designed for beginners to trade with the "flow of power." In short, it is a momentum-following strategy that enters a trade when a strong price move (Long Body Candle + High Volume) breaks through a key psychological level (200 EMA).1. Core Concept: "The High-Energy Breakout"Based on the principles of Thomas Bulkowski, a legendary master of chart patterns, this strategy prioritizes high-energy moves over simple price touches. A signal (LONG or SHORT) is only generated when these three conditions align:200 EMA Break (The Baseline): The 200-period Exponential Moving Average is the "life-line" of the market. Price breaking above this line indicates a powerful shift from a bearish to a bullish trend.Long Body Candle (Volatility): The candle body must be at least 2x larger than the recent average. This serves as evidence of institutional or "whale" buying/selling.Volume Surge (Reliability): Trading volume at the moment of breakout must be 1.5x higher than the recent average. This confirms the move is genuine and not a "fake-out."2. Session Filter (Optimized for Peak Volatility)To avoid "choppy" sideways markets, this strategy only operates during the first two hours of the major global market opens, when liquidity is at its highest.MarketTime (KST / UTC+9)Market CharacteristicsAsia Session09:00 ~ 11:00Opening of Korean, Japanese, and Chinese markets.Europe Session16:00 ~ 18:00Volatility spikes as the London market opens.US Session22:00 ~ 24:00Peak global liquidity as New York opens.Signals only appear when the chart background is shaded blue. All other times are "resting periods" to protect your capital.3. Execution GuideEntryLONG (Buy): Enter when a large green candle breaks above the yellow 200 EMA with high volume. (Green triangle label appears).SHORT (Sell): Enter when a large red candle breaks below the yellow 200 EMA with high volume. (Red triangle label appears).Take Profit (TP) & Stop Loss (SL)Lines are automatically drawn on your chart once you enter:Orange Line (Stop Loss): Automatically set at the low (or high) of the last 3 candles. If the price touches this, the trade closes to prevent further loss.Green Line (Take Profit): Automatically set at 1.5x your risk. This ensures a healthy 1:1.5 Risk-to-Reward ratio.4. Pro-Tips for BeginnersOptimized for 5m: This strategy works best on the 5-minute (5m) timeframe. 1m is often too noisy, and 15m can be too slow for scalping.Watch Bitcoin: Even if an altcoin gives a LONG signal, be cautious if Bitcoin is currently crashing. BTC dictates the overall market direction.Adjusting Sensitivity: If signals are too rare, go to "Settings" and lower the Long Body Multiplier from 2.0 to 1.5.This indicator is built to help you trade based on statistical advantages, not emotions. We strongly recommend practicing with Paper Trading first to get a feel for the signals.To everyone dreaming of becoming a Golden Trader—Success is a marathon, not a sprint!

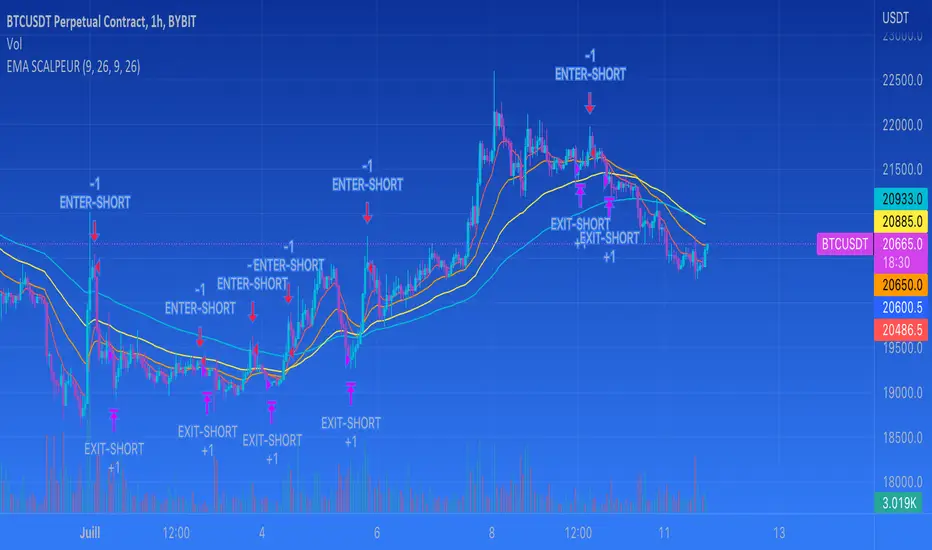
EMA SCALPEUR SHORTI'm trying to find the best EMA's for scalpingm you are able to choose 2 differents EMAs for your enter and 2 differents EMAs for you exit.
It's putting entry and exit on the graph
Capns Bollinger Bands MTF This Simple Script display higher time frame Bollinger Band on current resolution . Etc : On 1 Minutes chart BB Band is 5 Minutes Band. I use this code on my pc for scalping...Hope You like the idea
RSI: Evolved [DAFE]RSI: Evolved : The Ultimate Momentum Intelligence Engine
30+ RSI Engines. 15+ Zero-Lag Smoothers. The Revolutionary Quantum Horizon. This is Not Just an RSI. This is the Evolution of Momentum.
█ PHILOSOPHY: BEYOND THE OSCILLATOR, INTO THE NEXUS
The standard Relative Strength Index is a relic. It is a brilliant, timeless concept trapped in a rigid, one-dimensional formula developed in the 1970s. It assumes all market momentum is uniform, that all volatility is equal, and that a single mathematical lens is sufficient to view the infinitely complex character of modern markets. It is not.
RSI: Evolved was not created to be another RSI. It was engineered to be the definitive evolution of momentum analysis. This is not an indicator; it is a powerful, interactive research environment. It is a laboratory where you, the trader, can move beyond the static "one-size-fits-all" approach and forge a momentum oscillator that is perfectly adapted to the unique physics of your market, timeframe, and trading style.
This suite deconstructs the very DNA of the RSI, rebuilding it with a library of over 30 distinct, mathematically diverse calculation engines . From timeless classics and exotic variations to proprietary DAFE quantum models, this suite provides an unparalleled arsenal for quantifying the unseen forces of market momentum.
█ THE EVOLUTION: WHAT MAKES THIS UNLIKE ANY OTHER RSI?
This is not just a collection of features; it is a seamlessly integrated, multi-layered analytical system. It stands in a class of its own for several key reasons:
The 30+ Algorithm Core: At its heart is a library of over 30 unique RSI calculation engines. You can now choose an engine based on its mathematical properties—whether you need the zero-lag responsiveness of a Hull RSI, the time-warping capability of a Laguerre RSI, or the predictive power of a DAFE Quantum Fusion RSI.
Advanced Post-Processing: After the RSI is calculated, it passes through a multi-stage refinement process. First, choose from over 15+ professional-grade smoothing algorithms to create a crystal-clear signal. Then, activate the intelligent Filter Module to scale the RSI's output based on trend, volatility, or momentum regimes.
The Quantum Horizon & Temporal Wave: This is a revolutionary leap in data visualization. The indicator projects the historical momentum waves from higher timeframes directly onto your main price chart as a futuristic, holographic overlay. You can now see the alignment (or divergence) of macro momentum without ever looking away from price action. This is multi-timeframe analysis evolved into an art form.
Dynamic, Volatility-Adaptive Zones: Static 70/30 levels are obsolete. Evolved's "Quantum Zones" are alive; they "breathe" with market volatility. They automatically widen during powerful trends to keep you in a winning trade and tighten during choppy consolidation to help you catch reversals with greater precision.
Comprehensive Analytical Modules: This is a full suite of institutional-grade tools, including a powerful regular and hidden Divergence Engine , a multi-timeframe Consensus Dashboard , and dynamic RSI Bands (Bollinger, Keltner, etc.) plotted directly on the oscillator.
█ THE QUANTUM HORIZON & TEMPORAL WAVE: SEEING MOMENTUM IN 4D
This groundbreaking feature fundamentally changes how you interact with multi-timeframe momentum data. The Quantum Horizon is a dedicated visualization module that projects up to three "Temporal Waves" directly onto your main price chart. Each wave is a historical representation of a momentum oscillator (RSI, MFI, or Stoch RSI) pulled from a higher timeframe of your choice. Instead of flipping between charts or cluttering your screen with multiple indicators, you get an immediate, intuitive, and aesthetically stunning view of the market's complete momentum structure.
Each Temporal Wave is a self-contained universe, rendered as a glowing, flowing line within its own gridded channel. This channel is not just for show; it represents the 0-100 scale of the oscillator, with key 30, 50, and 70 levels marked for reference. You can see the history of momentum, its peaks, its troughs, and its crossovers with its own signal line. This allows you to visually identify macro divergences, trend alignment, and exhaustion points on your primary trading chart, transforming your analysis from a fragmented process into a single, unified experience. This is no longer just an indicator; it is a true Heads-Up Display for the flow of time and momentum.
█ THE ARSENAL: A DEEP DIVE INTO THE RSI & SMOOTHING ENGINES
This is your library of mathematical DNA. Understanding your tools is the first step to mastery. The 30+ RSI types are grouped into distinct families, each with a unique philosophy.
THE RSI ENGINE FAMILIES
The Classics (Wilder's, Cutler's, EMA, WMA): These are the foundational building blocks of momentum analysis. They provide a reliable, time-tested baseline. Wilder's uses the RMA for a unique smoothing characteristic, while Cutler's uses the SMA for a more direct, arithmetic average of gains and losses. The EMA and WMA versions offer increased responsiveness by weighting recent price action more heavily.
The Low-Lag Warriors (DEMA, TEMA, Hull, ZLEMA): This family is engineered specifically to combat the inherent lag of classical averages. The Double and Triple EMA (DEMA, TEMA) use a composite of multiple EMAs to reduce latency. The Zero-Lag EMA (ZLEMA) attempts to remove lag by adjusting the source price with its own past data. The Hull RSI is a standout, using a weighted moving average calculation to achieve a remarkable balance of extreme smoothness and near-zero lag, making it ideal for scalping.
The Exotics (Laguerre, Connors, Fisher, KAMA): These engines employ advanced mathematical concepts to view momentum through a different lens. The Laguerre RSI , based on John Ehlers' work, uses a time-warping, non-linear filter that can be extremely responsive to changes in trend. The Fisher Transform RSI normalizes the output to a Gaussian distribution, making peaks and troughs sharper and more defined for clearer signals. The KAMA Adaptive RSI is a "smart" algorithm that automatically slows its calculation in choppy markets and speeds it up in strong trends.
The Volume-Based (Volume-Weighted, MFI, VWAP-Weighted): This family infuses price momentum with volume data, providing a measure of conviction. They answer not just "how fast is price moving?" but "how much participation is behind the move?". The Money Flow RSI (MFI) is a classic, while the Volume-Weighted and VWAP-Weighted versions directly incorporate volume into the gain/loss calculation, giving more weight to high-volume bars.
The DAFE Proprietary Engines (The "God Mode" Algos): The crown jewels of the Laboratory, these are custom-built, proprietary algorithms you will not find anywhere else.
DAFE Quantum Fusion: This engine calculates RSI on three harmonic timeframes simultaneously (based on the Golden Ratio) and "superimposes" them using a dynamic weighting system based on volume and momentum confidence. It is the most robust and balanced all-rounder.
DAFE Kinetic Energy: Based on the physics principle that Momentum = Mass × Velocity. Standard RSI only sees Velocity (price change). Kinetic RSI weights every price move by Relative Volume (Mass), measuring the true "force" of the market.
DAFE Spectral: This engine uses concepts from Digital Signal Processing to analyze the frequency of price moves. It automatically differentiates between the "Signal" (the underlying trend) and the "Noise" (the chop), and adapts its calculation speed accordingly.
DAFE Entropy Flow: A unique engine that uses Information Theory to measure market "disorder." In chaotic, high-entropy markets, it automatically dampens its own signal to avoid whipsaws. In orderly, low-entropy trends, it sharpens its signal to be more responsive.
THE POST-SMOOTHING FILTERS
After your primary RSI is calculated, you can pass it through one of over 15 advanced filters for unparalleled clarity.
Low-Lag (Hull, DEMA, TEMA): Ideal for responsive smoothing that tracks the raw RSI closely.
Adaptive (KAMA, VIDYA): Perfect for smart, regime-aware smoothing that is slow in chop and fast in trends.
DSP & Scientific (SuperSmoother, Butterworth, Gaussian, Jurik-Style): The pinnacle of signal processing. These filters provide the absolute cleanest signal with minimal lag, leveraging advanced digital signal processing techniques to surgically remove noise.
█ THE ANALYTICAL MODULES: BEYOND THE LINE
Dynamic Zones: Your overbought/oversold levels (e.g., 70/30) are no longer static lines. They are living, breathing zones that respond to market volatility. They automatically widen during powerful, high-volatility trends to prevent you from selling a strong uptrend too early. Conversely, they tighten during low-volatility consolidation, allowing you to catch smaller, mean-reverting moves with greater precision. This is a crucial evolution for trading in modern, dynamic markets.
Divergence Engine: The automated engine works tirelessly in the background to detect critical disconnects between price and momentum. It automatically identifies and plots both Regular Divergences (which often signal major trend reversals) and Hidden Divergences (which often signal trend continuations after a pullback) with clear on-chart and in-pane markers and lines.
MTF Dashboard: Context is everything. This module provides an instant read on the momentum across three higher timeframes of your choice. The "Consensus" reading tells you if all timeframes are aligned ("ALL BULL" or "ALL BEAR"), providing powerful contextual confirmation for your trades and helping you avoid taking signals that go against the macro flow.
RSI Bands: This module applies a full-fledged band methodology (Bollinger Bands, Keltner Channels, etc.) directly to the RSI line itself. A pierce of the upper or lower band is a powerful sign of a statistical extreme, often preceding a sharp reversion back to the mean. A "squeeze" in the RSI bands often precedes an explosive move in momentum.
Signal Line & Histogram: The fast-moving RSI line is paired with a slower, smoother Signal Line of your choice. Crossovers between these two lines can be used as effective entry/exit triggers that are often more reliable than simple overbought/oversold levels. The histogram visually represents the momentum (the velocity and acceleration) of the RSI itself, turning from light to dark green in a strengthening uptrend, for example.
█ DEVELOPMENT PHILOSOPHY
RSI: Evolved was forged from a single, guiding principle: momentum is not a fixed property; it is a dynamic, multi-faceted force with a unique character in every market. This tool was designed for the trader who is no longer satisfied with a one-size-fits-all indicator. It is for the analyst, the tinkerer, the scientist—the individual who seeks to deconstruct, understand, and master the hidden physics of market momentum. This is a tool for forging your own alpha, not just following a lagging line.
RSI: Evolved is designed to give you that patience and discipline, providing a crystal-clear, multi-dimensional view of momentum so you can act with precision when the perfect setup finally arrives.
█ DISCLAIMER AND BEST PRACTICES
THIS IS AN ADVANCED ANALYTICAL TOOL: This indicator provides intelligence on momentum, not financial advice. It should be used as a core component of a complete trading strategy.
RISK MANAGEMENT IS PARAMOUNT: All trading involves substantial risk. Never risk more capital than you are prepared to lose.
START WITH A ROBUST BASE: The "DAFE Quantum Fusion" engine with the "SuperSmoother" is an exceptionally powerful and well-balanced starting point for most markets.
USE CONFLUENCE: The highest probability signals occur when multiple modules agree. For example: a Regular Bullish Divergence, as the RSI crosses up from an Extreme Oversold Dynamic Zone, while the Quantum Horizon shows the higher timeframes are also starting to turn up.
"The hard part is not making the decision to buy or sell, but having the patience and discipline to wait for the right setup."
— Mark Weinstein
Taking you to school. - Dskyz, Trade with Anticipation. Trade with Strength. Trade with RSI: Evolved

EMA Combo BKEMA Combo – Multi-Timeframe Trend & Momentum Indicator
EMA Combo is a clean and efficient multi-Exponential Moving Average (EMA) indicator designed to help traders quickly identify trend direction, momentum strength, and dynamic support/resistance zones across all timeframes.
This indicator plots a structured set of five EMAs (10, 20, 50, 100, 200) on the price chart, with intelligent default visibility to keep the chart uncluttered while still allowing deeper analysis when needed.
⸻
Default EMA Structure
By default, the indicator displays only the two most actionable EMAs:
• EMA 20 (Blue) – Short-term momentum EMA
• EMA 50 (Red) – Core trend EMA
The following EMAs are hidden by default and can be enabled manually from the indicator settings:
• EMA 10 (Teal) – Ultra-fast EMA for scalping and very short-term momentum
• EMA 100 (Purple) – Medium-term trend filter
• EMA 200 (Orange) – Long-term trend and institutional bias EMA
This default visibility ensures a clean chart for day trading, while still supporting swing and positional analysis when required.
⸻
How to Use the Indicator
1. Trend Identification
• Price above EMA 50 & EMA 200 → Bullish market structure
• Price below EMA 50 & EMA 200 → Bearish market structure
• EMA 20 above EMA 50 → Short-term bullish momentum
• EMA 20 below EMA 50 → Short-term bearish momentum
⸻
2. Momentum & Pullback Trading
• In strong trends, price often pulls back to EMA 20 or EMA 50 before continuing
• EMA 20 acts as a dynamic momentum line
• EMA 50 acts as a trend support / resistance zone
⸻
3. Scalping & Short-Term Trading (EMA 10)
• Enable EMA 10 for:
• High-frequency scalping
• Momentum bursts
• Early trend acceleration
• Best used on lower timeframes (1m–5m)
⸻
4. Swing & Positional Trading (EMA 100 & 200)
• EMA 100 helps filter mid-term trend strength
• EMA 200 defines:
• Institutional bias
• Long-term support & resistance
• Bull vs Bear market zones
A market is considered structurally strong when:
EMA 20 > EMA 50 > EMA 100 > EMA 200

Crypto RSI AdvancedThe Crypto RSI Advanced Indicator: A Multi-Dimensional Market Assessment Tool
This document outlines the unique features, functionality, implementation, and theoretical foundation of the "Crypto RSI Advanced" indicator. It is designed to be far more than a simple oscillator; it is a comprehensive analytical suite that enhances the classic Relative Strength Index (RSI) by incorporating trend-filtered signals, visual context, and real-time market state diagnostics.
Core Originality & Unique Value Proposition
The primary innovation of this script lies in its multi-layered, context-aware approach to momentum analysis. While traditional RSI indicators often generate signals based solely on crossing static levels (like 30/70), leading to false signals in strong trends, this script synthesizes four critical dimensions of information:
Momentum Value: The raw RSI reading.
Momentum Trend: The direction of the RSI itself, determined by its short-term trajectory.
Zone Persistence: Whether the RSI is coming from an overbought/oversold condition, adding conviction to breakouts.
Integrated Signal Confirmation: The use of a smoothed signal line (EMA of RSI) for additional validation.
This synthesis transforms the RSI from a standalone oscillator into a cohesive trading system framework that helps distinguish between potential reversal points and mere pauses within a strong trend.
What It Does & How It Achieves It
The indicator performs several interconnected functions, presented in a single pane below the price chart:
Enhanced RSI & Signal Line Plotting:
It calculates the standard RSI based on a user-defined source and length.
It plots a smoothed Signal Line (an EMA applied to the RSI values), which acts as a dynamic filter. Crosses between the RSI and this signal line can provide earlier or more refined entry clues than static level crosses alone.
Dynamic Visual Context and Alerts:
Colored Background Bands: The plot area is dynamically shaded to visually telegraph the market state at a glance: blue for oversold, orange for overbought, and white for the neutral zone.
Conditional RSI Line Coloring: The RSI line itself changes color based on its zone and position relative to the 50 mid-line, providing instant visual feedback on momentum strength and bias.
Multi-Tiered Signal Detection: The script identifies four distinct signal types:
Buy/Sell Signal: Triggered when the RSI crosses back inside the oversold/overbought band from an extreme. This aims to catch early reversals as momentum exits an extreme state.
Strong Buy/Strong Sell Signal: A higher-conviction signal triggered when the RSI crosses the oversold/overbought level from within the extreme zone. This suggests a more powerful shift in momentum as the market exits a deeply overextended condition.
Integrated Market Intelligence Panel:
A key original feature is the fixed information table in the top-right corner. This panel synthesizes all calculations into a concise, actionable snapshot for the latest bar, including:
Current precise RSI value.
Market State (e.g., Overbought, Bullish Bias, Neutral).
RSI Trend (Rising, Falling, Consolidating), assessing the oscillator's own momentum.
Active Signal Status (e.g., "Strong Buy", "No Signal").
Zone Intensity (e.g., "Extreme Overbought", "Normal").
Clear Level Annotation:
On the final bar, it draws labeled markers at the key levels (Oversold, Mid, Overbought) for a clean and permanent reference on the chart.
How to Use It
Application: This tool is designed for momentum confirmation, divergence spotting, and identifying potential reversal zones within a broader trend context. It is particularly useful for swing traders and position traders looking for higher-probability entry points, rather than for pure, high-frequency scalping.
Usage Guidelines:
Parameter Setup: Adjust the core RSI Length and Signal Length to match the volatility of your asset and trading timeframe. The default (14, 9) offers a balanced approach.
Signal Hierarchy: Prioritize "Strong" signals over regular signals, as they carry the added context of a zone breakout. A "Strong Buy" signal appearing in an overall uptrend on the higher timeframe presents a high-conviction scenario.
Synthesize Information: Do not trade on signals alone. Use the Information Panel for context. For example, a "Buy Signal" occurring while the panel shows "Market State: Oversold" and "RSI Trend: Rising" offers a congruent, multi-factor setup.
Visual Context: Use the colored bands and line colors for quick assessment. A blue (bullish) RSI line forming in the blue (oversold) shaded area provides immediate visual congruence for a potential long setup.
Confirmation: As with any oscillator, use this tool in conjunction with price action analysis (support/resistance, chart patterns) and other non-correlated indicators (e.g., a trend-following indicator like a moving average) to filter trades and avoid whipsaws in ranging markets.
Underlying Computational Philosophy
The script's logic is built upon the principle of "Contextual Momentum Analysis." The core premise is that the absolute value of the RSI is less important than its behavior relative to its recent state and trajectory.
Trend-Filtered Momentum: By analyzing the RSI's own trend (rsi_trend_up/down), the script introduces a crucial filter. A sell signal occurring while the RSI's internal trend is still rising may be less reliable, warning of a potential false signal.
Zone-Based Conviction: The distinction between a regular and a "Strong" signal is philosophically significant. It applies the concept of "impulse from an extreme." A reversal signal that originates from deep inside an extreme zone is considered to have more kinetic energy (conviction) than one that forms near the boundary.
Synthesis Over Isolation: The script deliberately avoids providing a single "answer." Instead, it presents multiple, simultaneous data points (value, trend, zone, signal line interaction, historical state) and presents them together in the information panel. This empowers the trader to make a reasoned decision based on a confluence of factors, mimicking the analytical process of a seasoned chartist.
In essence, this indicator automates and visualizes a sophisticated, multi-step analytical process that a trader would otherwise have to perform manually, thereby enhancing speed, consistency, and depth of market analysis.

Crypto MACD SignalsUnlocking Enhanced Market Insights: A Next-Generation MACD Indicator for Cryptocurrency Trading
Introduction: Beyond Traditional MACD
In the vast landscape of technical analysis tools, the Moving Average Convergence Divergence (MACD) stands as one of the most ubiquitous and trusted momentum indicators. However, its classic formulation often leaves traders sifting through frequent crossovers, struggling to distinguish high-probability signals from market noise, especially in the volatile cryptocurrency markets. This script represents a significant evolution of the classic MACD, transforming it from a standalone oscillator into a comprehensive, multi-layered signal detection system. Its core originality lies not in reinventing the MACD calculation, but in augmenting it with proprietary filtering mechanisms, quantitative signal scoring, and visual prioritization to enhance decision clarity and timing.
Core Functionality: What It Does and How It Achieves It
This indicator, titled "Crypto MACD Signals," is a dedicated, non-overlay oscillator built for clarity and actionability. It performs three primary functions simultaneously:
Enhanced MACD Visualization: It plots the traditional MACD line, Signal line, and Histogram with a refined color scheme. The histogram is dynamically colored (blue for bullish, orange for bearish) but introduces a key innovation: the identification of "Huge" or "Anomalous" Bars. A bar is highlighted in bright white when its size exceeds twice the 20-bar Simple Moving Average of the absolute histogram values. This instantly draws attention to moments of exceptional momentum surge or capitulation, which often precede significant trend accelerations or reversals.
Context-Aware Signal Generation: Instead of marking every MACD line crossover, the script applies a crucial logical filter. It only plots a "BUY" signal (green upward triangle) when a bullish crossover occurs while the histogram is below the zero line. Conversely, a "SELL" signal (red downward triangle) is plotted only when a bearish crossover occurs while the histogram is above the zero line. This filter ensures signals are generated in the context of a potential trend reversal from an oversold or overbought state, rather than during the middle of a strong trend, dramatically increasing the signal's statistical edge. This aligns with a classic "Oscillator Reversal from Extremes" methodology within trend-following systems.
Real-Time Performance Dashboard: A fixed table in the top-right corner serves as a live statistical dashboard. It tracks and displays the total count of:
Generated Buy Signals
Generated Sell Signals
Total "Huge" Histogram Bars (both bullish and bearish)
This provides traders with an at-a-glance understanding of recent market activity—whether it has been signal-rich or quiet, and the frequency of high-momentum events—aiding in assessing the current market regime (e.g., trending vs. consolidating).
Implementation and Practical Usage
The indicator is designed for tactical swing trading and momentum-based intraday positioning in crypto assets. Its primary use case is for identifying "Pullback Entries within a Trend" and "Early Trend Reversal Confirmations."
For Trend-Following: A trader in an established uptrend would wait for a pullback that drives the MACD histogram negative. A subsequent bullish crossover that triggers a "BUY" signal, especially if accompanied by a "Huge" bullish histogram bar, offers a high-confidence entry point to re-join the trend.
For Counter-Trend/Reversal Scenarios (Scalping): The script is highly effective for a specific scalping technique: "Fading Extreme Momentum Exhaustion." A cluster of "Huge" bearish bars followed by a diminishing histogram and a bullish crossover signal can indicate selling exhaustion, presenting a short-term long scalp opportunity. The inverse applies for short scalps. The labels ("🔥") and arrows provide clear visual cues for these setups directly on the chart.
Workflow: Traders are advised to first observe the statistical table to gauge recent activity. Then, they should look for convergence between a filtered arrow signal (BUY/SELL) and the appearance of a "Huge" bar or a cluster of them. This multi-factor confirmation is the cornerstone of the strategy.
Underlying Philosophy and Calculation Logic
The script's intelligence is built on a layered philosophy of "Momentum Quantification and Contextual Validation."
Dynamic Thresholding for Anomalies: The "Huge Bar" detection does not use a fixed threshold. By comparing the current histogram value to a recent average of absolute momentum (ta.sma(math.abs(hist_line), 20)), it creates an adaptive, market-responsive benchmark. A bar that is 200% larger than recent average momentum is statistically anomalous, suggesting institutional-sized order flow or a major shift in sentiment. This is a direct application of statistical volatility band principles to momentum, not price.
Signal Filtering for Phase Alignment: The conditional logic for plotting arrows (bullish_cross and hist_line < 0) ensures the MACD crossover signal is aligned with the correct momentum phase of the market cycle. A buy signal is only valid if momentum (histogram) is coming from a "recharging" or bearish area (below zero), not when it's already extended above zero. This prevents buying at a peak and selling at a trough, which is a common pitfall of the raw indicator. This embodies the trading axiom: "Trade the turn, not the continuation."
Quantitative Self-Awareness: The integrated counter and dashboard represent a meta-analysis layer. It allows the tool to provide feedback on its own performance density. A market generating many signals might be choppy and range-bound, while a market with few signals but several "Huge Bars" might be in a strong, steady trend. This helps the trader select the appropriate strategy (trend riding vs. reversal scalping) for the current environment.
In essence, this script synthesizes several respected trading concepts: the core trend/momentum logic of MACD, the anomaly detection common to volatility-based indicators like Keltner Channels, and the signal-verification philosophy of multi-indicator systems—all packaged into a single, coherent, and visually intuitive tool specifically tuned for the unique amplitude and speed of cryptocurrency markets.

5EMA + Volume Spikes + Ultra Fast Scalp V3Description
This indicator combines 5 EMAs, volume spike detection, and an ultra-fast scalping system designed for short-term trading.
The scalping logic uses a fixed + ATR hybrid price deviation, filtered by RSI and CCI to capture extreme overbought/oversold conditions while avoiding overheated zones.
It also includes previous day levels (high, low, body high/low) extended into the current session for clear intraday reference.
Optimized for fast scalping and momentum fades on lower timeframes.

Ripster EMA Clouds with MTFCredits & Origins:
This script is a modification of the widely popular EMA Clouds system originally created by @Ripster47. Full credit goes to him for the strategy and original concept. This version simply adds a quality-of-life feature for traders who use multi-timeframe analysis.
What is this Indicator?
The Ripster EMA Clouds system uses overlapping Exponential Moving Averages (EMAs) to visualize trends, momentum, and dynamic support/resistance zones. The "clouds" differ in color to indicate bullish or bearish trends, acting as a visual guide for keeping you on the right side of the trade.
What is New in This Version? (MTF Capability)
The standard version of this indicator calculates EMAs based on your current chart timeframe. If you switch from a 10-minute chart to a 1-minute chart, the clouds change completely.
I have added a "Fixed Timeframe" variable/input that allows you to "lock" the clouds to a specific timeframe, regardless of what chart you are viewing.
Why is this useful? This allows for true Multi-Timeframe (MTF) scalping.
Example: You can set the clouds to look at the 10-minute trend (identifying major support levels) but execute your entries on a 1-minute chart.
The clouds will remain locked to the 10-minute data, giving you the "big picture" view while you trade the micro-movements.
How to Use
Open the indicator settings.
Go to the Inputs tab.
Find the "Fixed Timeframe" option at the top.
Leave Empty (Default): The indicator behaves exactly like the original (adjusts to your chart).
Select a Timeframe (e.g., 10 Minutes): The clouds will lock to the 10-minute EMAs, even if you switch your chart to 1-minute or 5-seconds.
Note on Visuals When viewing Higher Timeframe (HTF) clouds on a Lower Timeframe (LTF) chart, the clouds will appear to have a "stepped" or "ladder-like" appearance. This is normal and accurate. It represents the single EMA value holding constant for that entire higher-timeframe period. This helps you see the true support level rather than a smoothed, repainted line.

Penny Stock Short Signal Pro# Penny Stock Short Signal Pro (PSSP) v1.0
## Complete User Guide & Documentation
---
# 📋 TABLE OF CONTENTS
1. (#introduction)
2. (#why-short-penny-stocks)
3. (#the-7-core-detection-systems)
4. (#installation--setup)
5. (#understanding-the-dashboard)
6. (#input-settings-deep-dive)
7. (#visual-elements-explained)
8. (#alert-configuration)
9. (#trading-strategies)
10. (#risk-management)
11. (#best-practices)
12. (#troubleshooting)
13. (#changelog)
---
# Introduction
**Penny Stock Short Signal Pro (PSSP)** is a comprehensive Pine Script v6 indicator specifically engineered for identifying high-probability short-selling opportunities on low-priced, high-volatility stocks. Unlike generic indicators that apply broad technical analysis, PSSP is purpose-built for the unique characteristics of penny stock price action—where parabolic moves, retail FOMO, and violent reversals create predictable patterns for prepared traders.
## Key Features
- **7 Independent Detection Systems** working in concert to identify exhaustion points
- **Composite Signal Engine** that requires multiple confirmations before triggering
- **Real-Time Dashboard** displaying all signal states and market metrics
- **Automatic Risk Management** with dynamic stop-loss and profit target calculations
- **Customizable Sensitivity** for different trading styles (scalping vs. swing)
- **Built-in Alert System** for all major signal types
## Who Is This For?
- **Active Day Traders** looking to capitalize on intraday reversals
- **Short Sellers** who specialize in penny stocks and small caps
- **Momentum Traders** who want to identify when momentum is exhausting
- **Risk-Conscious Traders** who need clear entry/exit levels
---
# Why Short Penny Stocks?
## The Penny Stock Lifecycle
Penny stocks follow a remarkably predictable lifecycle that creates shorting opportunities:
```
PHASE 1: ACCUMULATION
└── Low volume, tight range
└── Smart money quietly building positions
PHASE 2: MARKUP / PROMOTION
└── News catalyst or promotional campaign
└── Volume increases, price begins rising
└── Early momentum traders enter
PHASE 3: DISTRIBUTION (YOUR OPPORTUNITY)
└── Parabolic move attracts retail FOMO buyers
└── Smart money selling into strength
└── Volume climax signals exhaustion
└── ⚠️ PSSP SIGNALS FIRE HERE ⚠️
PHASE 4: DECLINE
└── Support breaks, panic selling
└── Price returns toward origin
└── Short sellers profit
```
## Why Shorts Work on Penny Stocks
1. **No Fundamental Support**: Most penny stocks have no earnings, revenue, or assets to justify elevated prices
2. **Promotional Nature**: Many rallies are driven by promoters who will eventually stop
3. **Retail Exhaustion**: Retail buying power is finite—when it's exhausted, gravity takes over
4. **Float Dynamics**: Low float stocks move fast in both directions
5. **Technical Levels Matter**: VWAP, round numbers, and prior highs become self-fulfilling resistance
---
# The 7 Core Detection Systems
PSSP employs seven independent detection algorithms. Each identifies a specific type of exhaustion or reversal signal. When multiple systems fire simultaneously, the probability of a successful short dramatically increases.
---
## 1. PARABOLIC EXHAUSTION DETECTOR
### What It Detects
Identifies when price has moved too far, too fast and is likely to reverse. This system looks for the classic "blow-off top" pattern common in penny stock runners.
### Technical Logic
```
Parabolic Signal = TRUE when:
├── Consecutive green candles ≥ threshold (default: 3)
├── AND price extension from VWAP ≥ threshold ATRs (default: 1.5)
└── OR shooting star / upper wick rejection pattern forms
```
### Visual Representation
```
╱╲ ← Shooting star / upper wick
╱ ╲ (Parabolic exhaustion)
╱
╱
╱
══════════════ VWAP
╱
╱
```
### Why It Works on Penny Stocks
Penny stocks are notorious for parabolic moves driven by retail FOMO. When everyone who wants to buy has bought, there's no one left to push prices higher. The shooting star pattern shows that sellers are already stepping in at higher prices.
### Key Settings
| Parameter | Default | Range | Description |
|-----------|---------|-------|-------------|
| Lookback Period | 10 | 3-30 | Bars to analyze for pattern |
| Extension Threshold | 1.5 ATR | 0.5-5.0 | How far above VWAP is "parabolic" |
| Consecutive Green Bars | 3 | 2-10 | Minimum green bars for exhaustion |
---
## 2. VWAP REJECTION SYSTEM
### What It Detects
Volume Weighted Average Price (VWAP) is the single most important level for institutional traders. This system identifies when price tests above VWAP and gets rejected back below—a powerful short signal.
### Technical Logic
```
VWAP Rejection = TRUE when:
├── Candle high pierces above VWAP
├── AND candle closes below VWAP
├── AND candle is bearish (close < open)
└── AND rejection distance is within sensitivity threshold
```
### Visual Representation
```
High ──→ ╱╲
╱ ╲
VWAP ════════╱════╲═══════════
Close ←── Rejection
```
### Extended VWAP Signals
The system also tracks VWAP standard deviation bands. Rejection from the upper band (2 standard deviations above VWAP) is an even stronger signal.
### Why It Works on Penny Stocks
- Algorithms and institutions use VWAP as their benchmark
- Failed attempts to reclaim VWAP often lead to waterfall selling
- VWAP acts as a "magnet" that price tends to revert toward
### Key Settings
| Parameter | Default | Range | Description |
|-----------|---------|-------|-------------|
| Rejection Sensitivity | 0.5 ATR | 0.1-2.0 | How close to VWAP for valid rejection |
| Show VWAP Line | True | - | Display VWAP on chart |
| Show VWAP Bands | True | - | Display standard deviation bands |
| Band Multiplier | 2.0 | 0.5-4.0 | Standard deviations for bands |
---
## 3. VOLUME CLIMAX DETECTOR
### What It Detects
Identifies "blow-off tops" where extreme volume accompanies a price spike. This often marks the exact top as it represents maximum retail participation—after which buying power is exhausted.
### Technical Logic
```
Volume Climax = TRUE when:
├── Current volume ≥ (Average volume × Climax Multiple)
├── AND one of:
│ ├── Selling into the high (upper wick > lower wick on green bar)
│ └── OR post-climax weakness (red bar following climax bar)
```
### Visual Representation
```
Price: ╱╲
╱ ╲
╱ ╲
╱ ╲
╱
Volume:
▂▃▅▇██▇▅▃▂▁
↑
Volume Climax (3x+ average)
```
### Why It Works on Penny Stocks
- Retail traders pile in at the top, creating volume spikes
- Market makers and smart money use this liquidity to exit
- Once the volume spike passes, there's no fuel left for higher prices
- The "smart money selling into dumb money buying" creates the top
### Key Settings
| Parameter | Default | Range | Description |
|-----------|---------|-------|-------------|
| Volume MA Length | 20 | 5-50 | Period for average volume calculation |
| Climax Volume Multiple | 3.0x | 1.5-10.0 | Multiple of average for "climax" |
| Show Volume Bars | True | - | Visual volume representation |
---
## 4. RSI DIVERGENCE ANALYZER
### What It Detects
Bearish divergence occurs when price makes higher highs but RSI (momentum) makes lower highs. This indicates that momentum is weakening even as price pushes higher—a warning of imminent reversal.
### Technical Logic
```
Bearish Divergence = TRUE when:
├── RSI is in overbought territory (> threshold)
├── AND RSI is declining (current < previous < prior)
└── Indicates momentum exhaustion before price catches up
```
### Visual Representation
```
Price: /\ /\
/ \ / \ ← Higher high
/ \/
/
/
RSI: /\
/ \ /\
/ \/ \ ← Lower high (DIVERGENCE)
/ \
════════════════════ Overbought (70)
```
### Why It Works on Penny Stocks
- Penny stocks often push to new highs on weaker and weaker momentum
- Divergence signals that fewer buyers are participating at each new high
- Eventually, the lack of buying pressure leads to collapse
### Key Settings
| Parameter | Default | Range | Description |
|-----------|---------|-------|-------------|
| RSI Length | 14 | 5-30 | Standard RSI calculation period |
| Overbought Level | 70 | 60-90 | RSI level considered overbought |
| Divergence Lookback | 14 | 5-30 | Bars to look back for swing highs |
---
## 5. KEY LEVEL REJECTION TRACKER
### What It Detects
Identifies rejections from significant price levels where shorts are likely to be concentrated: High of Day (HOD), premarket highs, and psychological levels (whole and half dollars).
### Technical Logic
```
Level Rejection = TRUE when:
├── Price touches key level (within 0.2% tolerance)
├── AND candle is bearish (close < open)
├── AND close is in lower portion of candle range
│
├── Key Levels Tracked:
│ ├── High of Day (HOD)
│ ├── Premarket High
│ └── Psychological levels ($1.00, $1.50, $2.00, etc.)
```
### Visual Representation
```
HOD ─────────────────────────────────
╱╲ ← Rejection
╱ ╲
╱ ╲
╱
─────────────────────────────────
PM High ─────────────────────────────
```
### Why It Works on Penny Stocks
- **HOD**: The high of day is where the most traders are trapped long. Failure to break HOD often triggers stop-loss cascades
- **Premarket High**: Represents overnight enthusiasm; failure to exceed often means the "news" is priced in
- **Psychological Levels**: Round numbers ($1, $2, $5) attract orders and act as natural resistance
### Key Settings
| Parameter | Default | Range | Description |
|-----------|---------|-------|-------------|
| Track HOD Rejection | True | - | Monitor high of day |
| Track Premarket High | True | - | Monitor premarket resistance |
| Track Psychological Levels | True | - | Monitor round numbers |
---
## 6. FAILED BREAKOUT DETECTOR
### What It Detects
Identifies "bull traps" where price breaks above resistance but immediately fails and closes back below. This traps breakout buyers and often leads to accelerated selling.
### Technical Logic
```
Failed Breakout = TRUE when:
├── Price breaks above recent high (lookback period)
├── AND one of:
│ ├── Same bar closes below the breakout level
│ └── OR following bars show consecutive red candles
```
### Visual Representation
```
╱╲
╱ ╲ ← False breakout
Recent High ══╱════╲════════════════
╱ ╲
╱ ╲
╱ ╲ ← Trapped longs panic sell
```
### Why It Works on Penny Stocks
- Breakout traders enter on the break, providing exit liquidity for smart money
- When the breakout fails, these traders become trapped and must exit
- Their forced selling accelerates the decline
- Penny stocks have thin order books, making failed breakouts especially violent
### Key Settings
| Parameter | Default | Range | Description |
|-----------|---------|-------|-------------|
| Breakout Lookback | 5 | 2-15 | Bars to define "recent high" |
| Confirmation Bars | 2 | 1-5 | Bars to confirm failure |
---
## 7. MOVING AVERAGE BREAKDOWN SYSTEM
### What It Detects
Monitors exponential moving averages (EMAs) for bearish crossovers and price rejections. EMA crosses often signal trend changes, while rejections from EMAs indicate resistance.
### Technical Logic
```
MA Breakdown = TRUE when:
├── Bearish EMA cross (fast crosses below slow)
└── OR EMA rejection (price tests EMA from below and fails)
```
### Visual Representation
```
╱╲ ← Rejection from EMA
╱ ╲
EMA 9 ═══════════╱════╲═══════════
╲
EMA 20 ═══════════════════╲════════
╲
Bearish cross ↓
```
### Why It Works on Penny Stocks
- EMAs smooth out the noise and show underlying trend direction
- When fast EMA crosses below slow EMA, it signals momentum shift
- Rejected attempts to reclaim EMAs show sellers are in control
### Key Settings
| Parameter | Default | Range | Description |
|-----------|---------|-------|-------------|
| Fast EMA | 9 | 3-20 | Short-term trend |
| Slow EMA | 20 | 10-50 | Medium-term trend |
| Show EMAs | True | - | Display on chart |
---
# Installation & Setup
## Step 1: Access Pine Editor
1. Open TradingView (tradingview.com)
2. Open any chart
3. Click "Pine Editor" at the bottom of the screen
## Step 2: Create New Indicator
1. Click "Open" → "New blank indicator"
2. Delete any existing code
3. Paste the entire PSSP code
## Step 3: Save and Add to Chart
1. Click "Save" (give it a name like "PSSP")
2. Click "Add to chart"
3. The indicator will appear with default settings
## Step 4: Configure Settings
1. Click the gear icon (⚙️) on the indicator
2. Adjust settings based on your trading style (see Settings section)
3. Click "OK" to apply
## Recommended Chart Setup
- **Timeframe**: 1-minute or 5-minute for scalping, 15-minute for swing shorts
- **Chart Type**: Candlestick
- **Extended Hours**: Enable if trading premarket/afterhours
- **Volume**: Can disable default volume since PSSP tracks it
---
# Understanding the Dashboard
The real-time dashboard provides at-a-glance status of all systems:
```
┌─────────────────────────────────────────┐
│ 📊 SHORT SIGNAL DASHBOARD │
├─────────────────────────────────────────┤
│ Signal Strength: 5/7 │
├─────────────────────────────────────────┤
│ ─── ACTIVE SIGNALS ─── │
│ │
│ Parabolic Exhaustion 🔴 2.1 ATR │
│ VWAP Rejection 🔴 Above │
│ Volume Climax 🔴 4.2x Avg │
│ RSI Divergence ⚪ RSI: 68 │
│ Level Rejection 🔴 @ HOD │
│ Failed Breakout 🔴 │
│ MA Breakdown ⚪ Bullish │
├─────────────────────────────────────────┤
│ ─── RISK LEVELS ─── │
│ Stop: $2.45 T1: $2.10 T2: $1.85 │
└─────────────────────────────────────────┘
```
## Dashboard Elements Explained
### Signal Strength Indicator
| Rating | Signals | Color | Interpretation |
|--------|---------|-------|----------------|
| STRONG | 5-7 | Red | High-confidence short opportunity |
| MODERATE | 3-4 | Orange | Decent setup, consider other factors |
| WEAK | 1-2 | Gray | Insufficient confirmation |
| NONE | 0 | Gray | No short signals active |
### Signal Status Icons
- 🔴 = Signal is ACTIVE (condition met)
- ⚪ = Signal is INACTIVE (condition not met)
### Contextual Metrics
Each signal row includes relevant metrics:
- **Parabolic**: Shows ATR extension from VWAP
- **VWAP**: Shows if price is Above/Below VWAP
- **Volume**: Shows current volume as multiple of average
- **RSI**: Shows current RSI value
- **Level**: Shows which level was touched (HOD, PM High, etc.)
- **MA**: Shows EMA relationship (Bullish/Bearish)
### Risk Levels
When a composite short signal fires:
- **Stop**: Suggested stop-loss level (high + ATR multiple)
- **T1**: First profit target (1:1 risk/reward)
- **T2**: Second profit target (user-defined R:R)
---
# Input Settings Deep Dive
## Group 1: Parabolic Exhaustion
| Setting | Default | Conservative | Aggressive | Description |
|---------|---------|--------------|------------|-------------|
| Enable | True | True | True | Turn system on/off |
| Lookback Period | 10 | 15 | 5 | Bars analyzed for pattern |
| Extension Threshold | 1.5 | 2.0 | 1.0 | ATRs above VWAP for "parabolic" |
| Consecutive Green Bars | 3 | 4 | 2 | Minimum green bars required |
**Tuning Tips:**
- Lower thresholds = more signals but more false positives
- Higher thresholds = fewer signals but higher quality
- For very volatile penny stocks, consider higher thresholds
## Group 2: VWAP Rejection
| Setting | Default | Conservative | Aggressive | Description |
|---------|---------|--------------|------------|-------------|
| Enable | True | True | True | Turn system on/off |
| Rejection Sensitivity | 0.5 | 0.3 | 0.8 | ATR distance for valid rejection |
| Show VWAP Line | True | True | True | Display VWAP |
| Show VWAP Bands | True | True | True | Display deviation bands |
| Band Multiplier | 2.0 | 2.5 | 1.5 | Standard deviations for bands |
**Tuning Tips:**
- Tighter sensitivity (lower number) = must reject very close to VWAP
- Wider bands = less frequent upper band rejections but more significant
## Group 3: Volume Climax
| Setting | Default | Conservative | Aggressive | Description |
|---------|---------|--------------|------------|-------------|
| Enable | True | True | True | Turn system on/off |
| Volume MA Length | 20 | 30 | 10 | Baseline volume period |
| Climax Volume Multiple | 3.0 | 4.0 | 2.0 | Multiple for "climax" status |
| Show Volume Profile | True | True | True | Visual volume bars |
**Tuning Tips:**
- Higher multiple = only extreme volume spikes trigger
- Shorter MA = more responsive to recent volume changes
- For highly liquid stocks, consider higher multiples
## Group 4: Momentum Divergence
| Setting | Default | Conservative | Aggressive | Description |
|---------|---------|--------------|------------|-------------|
| Enable | True | True | True | Turn system on/off |
| RSI Length | 14 | 21 | 7 | RSI calculation period |
| Overbought Level | 70 | 75 | 65 | Threshold for "overbought" |
| Divergence Lookback | 14 | 20 | 10 | Bars for swing high detection |
**Tuning Tips:**
- Lower overbought threshold = more frequent signals
- Shorter RSI length = more responsive but noisier
## Group 5: Key Level Rejection
| Setting | Default | Description |
|---------|---------|-------------|
| Enable | True | Master toggle for level system |
| Track Premarket High | True | Monitor premarket resistance |
| Track HOD Rejection | True | Monitor high of day |
| Track Psychological Levels | True | Monitor round numbers |
**Tuning Tips:**
- Disable premarket tracking if stock doesn't have significant premarket activity
- Psychological levels work best on stocks under $10
## Group 6: Failed Follow-Through
| Setting | Default | Conservative | Aggressive | Description |
|---------|---------|--------------|------------|-------------|
| Enable | True | True | True | Turn system on/off |
| Breakout Lookback | 5 | 8 | 3 | Bars defining "recent high" |
| Confirmation Bars | 2 | 3 | 1 | Bars to confirm failure |
**Tuning Tips:**
- Shorter lookback = more breakouts detected but smaller significance
- More confirmation bars = higher confidence but later entry
## Group 7: Moving Average Signals
| Setting | Default | Conservative | Aggressive | Description |
|---------|---------|--------------|------------|-------------|
| Enable | True | True | True | Turn system on/off |
| Fast EMA | 9 | 12 | 5 | Short-term trend |
| Slow EMA | 20 | 26 | 13 | Medium-term trend |
| Show EMAs | True | True | True | Display on chart |
**Tuning Tips:**
- Standard 9/20 works well for most penny stocks
- Faster EMAs (5/13) for scalping, slower (12/26) for swing trading
## Group 8: Composite Signal
| Setting | Default | Conservative | Aggressive | Description |
|---------|---------|--------------|------------|-------------|
| Minimum Signals | 3 | 4-5 | 2 | Signals needed for trigger |
| Show Dashboard | True | True | True | Display signal table |
| Dashboard Position | top_right | - | - | Screen location |
**Tuning Tips:**
- **Minimum Signals is the most important setting**
- Higher minimum = fewer trades but higher win rate
- Lower minimum = more trades but more false signals
## Group 9: Risk Management
| Setting | Default | Conservative | Aggressive | Description |
|---------|---------|--------------|------------|-------------|
| Show Stop Levels | True | True | True | Display stop loss |
| Stop ATR Multiple | 1.5 | 2.0 | 1.0 | Stop distance in ATRs |
| Show Targets | True | True | True | Display profit targets |
| Target R:R | 2.0 | 1.5 | 3.0 | Risk:Reward for Target 2 |
**Tuning Tips:**
- Tighter stops (lower ATR multiple) = less risk but more stop-outs
- Higher R:R targets = bigger winners but fewer targets hit
## Group 10: Visual Settings
| Setting | Default | Description |
|---------|---------|-------------|
| Bullish Color | Green | Color for bullish elements |
| Bearish Color | Red | Color for bearish/short signals |
| Warning Color | Orange | Color for caution signals |
| Neutral Color | Gray | Color for inactive elements |
---
# Visual Elements Explained
## Chart Overlays
### VWAP Line (Blue)
- **Solid blue line** = Volume Weighted Average Price
- Price above VWAP = bullish bias
- Price below VWAP = bearish bias
- **Use**: Short when price rejects from above VWAP
### VWAP Bands (Purple circles)
- Upper band = 2 standard deviations above VWAP
- Lower band = 2 standard deviations below VWAP
- **Use**: Extreme extension to upper band signals potential reversal
### EMAs (Orange and Red)
- **Orange line** = Fast EMA (9-period default)
- **Red line** = Slow EMA (20-period default)
- **Use**: Bearish cross or price rejection from EMAs confirms short
### HOD Line (Red, dashed)
- Shows the current day's high
- **Use**: Rejection from HOD is a key short signal
### Premarket High (Orange, dashed)
- Shows premarket session high
- **Use**: Failure to break PM high often signals weakness
## Signal Markers
### Individual Signal Markers (Small)
| Shape | Color | Signal |
|-------|-------|--------|
| ▼ Triangle | Purple | Parabolic Exhaustion |
| ✕ X-Cross | Blue | VWAP Rejection |
| ◆ Diamond | Yellow | Volume Climax |
| ● Circle | Orange | RSI Divergence |
| ■ Square | Red | Failed Breakout |
### Composite Short Signal (Large)
- **Large red triangle** with "SHORT" text
- Only appears when minimum signal threshold is met
- This is your primary trading signal
## Risk Level Lines
### Stop Loss (Red line)
- Calculated as: Entry + (ATR × Stop Multiple)
- Represents maximum acceptable loss
- **RESPECT THIS LEVEL**
### Target 1 (Light green line)
- First profit target at 1:1 risk/reward
- Consider taking partial profits here
### Target 2 (Dark green line)
- Second profit target at user-defined R:R
- Let winners run to this level
## Background Coloring
### Light Red Background
- Appears when composite short signal is active
- Indicates you should be looking for shorts, not longs
### Light Purple Background
- Appears during extreme parabolic extension
- Warning of potential imminent reversal
---
# Alert Configuration
## Available Alerts
### 1. Composite Short Signal
**Best for**: Primary trading signal
```
Condition: Composite short signal fires
Message: "PSSP: Short Signal Triggered - {ticker} at {close}"
```
### 2. Parabolic Exhaustion
**Best for**: Early warning of potential top
```
Condition: Parabolic exhaustion detected
Message: "PSSP: Parabolic exhaustion detected on {ticker}"
```
### 3. Volume Climax
**Best for**: Blow-off top identification
```
Condition: Volume climax occurs
Message: "PSSP: Volume climax / blow-off top on {ticker}"
```
### 4. Strong Short Setup (5+ Signals)
**Best for**: High-confidence opportunities only
```
Condition: 5 or more signals active
Message: "PSSP: STRONG short setup on {ticker}"
```
### 5. Very Strong Short Setup (6+ Signals)
**Best for**: Maximum confidence trades
```
Condition: 6 or more signals active
Message: "PSSP: VERY STRONG short setup on {ticker}"
```
### 6. Failed Breakout
**Best for**: Bull trap identification
```
Condition: Failed breakout detected
Message: "PSSP: Failed breakout detected on {ticker}"
```
### 7. Key Level Rejection
**Best for**: Resistance level plays
```
Condition: Key level rejection occurs
Message: "PSSP: Key level rejection on {ticker}"
```
## Setting Up Alerts in TradingView
1. Right-click on the chart
2. Select "Add Alert"
3. Set Condition to "Penny Stock Short Signal Pro"
4. Choose your desired alert condition
5. Configure notification method (popup, email, webhook, etc.)
6. Set expiration (or "Open-ended" for permanent)
7. Click "Create"
## Alert Strategy Recommendations
### For Active Day Traders
- Enable: Composite Short Signal, Volume Climax
- Set to: Popup + Sound
- Check frequently during market hours
### For Swing Traders
- Enable: Strong Short Setup (5+), Very Strong Short Setup (6+)
- Set to: Email + Mobile Push
- Review at key times (open, lunch, close)
### For Part-Time Traders
- Enable: Very Strong Short Setup (6+) only
- Set to: Email + SMS
- Only trade highest-conviction setups
---
# Trading Strategies
## Strategy 1: The Parabolic Fade
**Setup Requirements:**
- Parabolic Exhaustion signal ACTIVE
- Extension from VWAP ≥ 2.0 ATR
- Volume climax or declining volume on push
**Entry:**
- Short on first red candle after signal
- Or short on break below prior candle's low
**Stop Loss:**
- Above the high of the parabolic move
- Maximum: 1.5 ATR above entry
**Targets:**
- T1: VWAP (take 50% off)
- T2: Lower VWAP band or LOD
**Best Time:** 9:30-10:30 AM (morning runners)
---
## Strategy 2: VWAP Rejection Short
**Setup Requirements:**
- VWAP Rejection signal ACTIVE
- Price came from below VWAP
- Rejection candle has significant upper wick
**Entry:**
- Short on close below VWAP
- Or short on break below rejection candle low
**Stop Loss:**
- Above VWAP + 0.5 ATR
- Or above rejection candle high
**Targets:**
- T1: Lower VWAP band
- T2: Prior support or LOD
**Best Time:** Midday (11:00 AM - 2:00 PM)
---
## Strategy 3: HOD Failure Short
**Setup Requirements:**
- Level Rejection signal ACTIVE (HOD)
- Multiple tests of HOD without breakthrough
- Volume declining on each test
**Entry:**
- Short on confirmed HOD rejection
- Wait for close below the rejection candle
**Stop Loss:**
- Above HOD + 0.25 ATR (tight)
- Clear invalidation if HOD breaks
**Targets:**
- T1: VWAP
- T2: Morning support levels
**Best Time:** 10:30 AM - 12:00 PM
---
## Strategy 4: Volume Climax Fade
**Setup Requirements:**
- Volume Climax signal ACTIVE
- Volume ≥ 3x average on green candle
- Followed by bearish candle or upper wick
**Entry:**
- Short on first red candle after climax
- Or short on break below climax candle low
**Stop Loss:**
- Above climax candle high
- Give room for volatility spike
**Targets:**
- T1: 50% retracement of the run
- T2: VWAP or start of the run
**Best Time:** First hour of trading
---
## Strategy 5: The Full Composite (High Conviction)
**Setup Requirements:**
- Composite Short signal ACTIVE
- Minimum 4-5 individual signals
- Clear visual of signal markers clustering
**Entry:**
- Short immediately on composite signal
- Use market order for fast-moving stocks
**Stop Loss:**
- Use indicator's automatic stop level
- Do not deviate from system
**Targets:**
- T1: Indicator's T1 level (1:1)
- T2: Indicator's T2 level (2:1)
**Best Time:** Any time with sufficient signals
---
# Risk Management
## Position Sizing Formula
```
Position Size = (Account Risk %) / (Stop Loss %)
Example:
- Account: $25,000
- Risk per trade: 1% = $250
- Entry: $2.00
- Stop: $2.20 (10% stop)
- Position Size: $250 / 10% = $2,500 worth
- Shares: $2,500 / $2.00 = 1,250 shares
```
## Risk Rules
### The 1% Rule
Never risk more than 1% of your account on any single trade. For a $25,000 account, max risk = $250.
### The 2x Stop Rule
If your stop gets hit twice on the same stock, stop trading it for the day. The pattern isn't working.
### The Daily Loss Limit
Set a maximum daily loss (e.g., 3% of account). Stop trading if hit.
### The Size-Down Rule
After a losing trade, reduce your next position size by 50%. Rebuild after a winner.
## Short-Specific Risks
### The Short Squeeze
- Penny stocks can squeeze violently
- ALWAYS use stops
- Never "hope" a position comes back
- Size appropriately for volatility
### The Hard-to-Borrow
- Check borrow availability before trading
- High borrow fees eat into profits
- Some stocks become HTB mid-trade
### The Halt Risk
- Penny stocks can halt on volatility
- Position size for worst-case halt against you
- Halts can open significantly higher
---
# Best Practices
## DO's
✅ **Wait for multiple signals** - Single signals have lower accuracy
✅ **Trade with the trend** - Short when daily trend is down
✅ **Use the dashboard** - Check signal count before entering
✅ **Respect stops** - The indicator calculates them for a reason
✅ **Size appropriately** - Penny stocks are volatile; position small
✅ **Trade liquid stocks** - Volume ≥ 500K daily average
✅ **Know the catalyst** - Understand why the stock is moving
✅ **Take partial profits** - Secure gains at T1
✅ **Journal your trades** - Track what works and what doesn't
✅ **Time your entries** - Best shorts often come 10:30-11:30 AM
## DON'Ts
❌ **Don't short strong stocks** - If it won't go down, don't force it
❌ **Don't fight the tape** - A stock going up can keep going up
❌ **Don't average up on losers** - Adding to losing shorts is dangerous
❌ **Don't ignore the dashboard** - It exists to help you
❌ **Don't overtrade** - Quality over quantity
❌ **Don't short into news** - Wait for the reaction first
❌ **Don't trade the first 5 minutes** - Too chaotic for reliable signals
❌ **Don't hold overnight** - Penny stock gaps can destroy accounts
❌ **Don't trade without stops** - Ever.
❌ **Don't trade on tilt** - After losses, take a break
## Optimal Trading Windows
| Time (ET) | Quality | Notes |
|-----------|---------|-------|
| 9:30-9:35 | ⭐ | Too volatile, avoid |
| 9:35-10:30 | ⭐⭐⭐⭐⭐ | Best shorts, morning runners exhaust |
| 10:30-11:30 | ⭐⭐⭐⭐ | Secondary exhaustion, HOD rejections |
| 11:30-2:00 | ⭐⭐ | Midday lull, lower quality |
| 2:00-3:00 | ⭐⭐⭐ | Afternoon setups develop |
| 3:00-3:30 | ⭐⭐⭐⭐ | End of day momentum |
| 3:30-4:00 | ⭐⭐ | Closing volatility, risky |
---
# Troubleshooting
## Common Issues
### "Signals aren't appearing"
- Check that the relevant system is enabled in settings
- Ensure minimum signals threshold isn't too high
- Verify the stock has sufficient volume for calculations
### "Too many false signals"
- Increase minimum signals threshold
- Use more conservative settings (see Settings section)
- Focus on stocks with cleaner price action
### "Dashboard not showing"
- Ensure "Show Signal Dashboard" is enabled
- Check that your chart has enough space
- Try a different dashboard position
### "VWAP line is missing"
- VWAP requires intraday timeframes (1m, 5m, 15m, etc.)
- VWAP resets daily; won't show on daily+ charts
- Ensure "Show VWAP Line" is enabled
### "Stop loss seems too tight/wide"
- Adjust Stop ATR Multiple in Risk Management settings
- Lower multiple = tighter stop
- Higher multiple = wider stop
### "Alerts not triggering"
- Verify alert is set to the correct indicator
- Check that alert hasn't expired
- Ensure notification settings are configured in TradingView
## Performance Optimization
If the indicator is slow:
1. Reduce the number of visual elements shown
2. Disable unused signal systems
3. Use on fewer simultaneous charts
4. Close unused browser tabs
---
# Changelog
## Version 1.0 (Initial Release)
- 7 core detection systems implemented
- Real-time signal dashboard
- Automatic risk management calculations
- 7 alert conditions
- Full visual overlay system
- Comprehensive input settings
## Planned Features (Future Updates)
- Scanner integration for multi-stock screening
- Machine learning signal weighting
- Backtesting statistics panel
- Volume profile analysis
- Level 2 data integration (if available)
- Custom timeframe VWAP options
---
# Support & Feedback
## Reporting Issues
When reporting issues, please include:
1. TradingView username
2. Stock symbol and timeframe
3. Screenshot of the issue
4. Your indicator settings
5. Steps to reproduce
## Feature Requests
We welcome suggestions for improving PSSP. Consider:
- What specific pattern are you trying to catch?
- How would this help your trading?
- Any reference examples?
---
# Disclaimer
**IMPORTANT: This indicator is for educational and informational purposes only.**
- Past performance does not guarantee future results
- Short selling carries unlimited risk potential
- Always use proper position sizing and stop losses
- Paper trade before using real capital
- The creator assumes no liability for trading losses
- Consult a financial advisor before trading
**Trade at your own risk.**
---
*Penny Stock Short Signal Pro v1.0*
*Pine Script v6*
*© 2025*

Apex Wallet - Ultimate Multi-Oscillator (9-in-1) & Market TrendThe Apex Wallet Multi-Oscillator is a powerful "All-in-One" technical analysis tool designed to clean up your charts by combining nine of the most effective momentum and trend indicators into a single workspace. This script is engineered to adapt to different trading styles—Scalping, Day-Trading, or Swing-Trading—with a single click.
+4
Whether you are looking for trend exhaustion, momentum shifts, or volatility breakouts, this indicator provides a clear, visual summary of market dynamics.
+1
Key Features
9 Indicators in 1: Access RSI, Stochastic, StochRSI, MACD, Zero-Lag MACD, Andean Oscillator, and the Traders Dynamic Index (TDI).
+1
Smart Layout Modes:
Raw (Brut): Classic view with original values.
+1
Stacked (Empilé): Organizes indicators into fixed vertical zones to prevent overlapping.
+1
Proportional Stacking: Automatically calculates and adjusts the height of blocks based on active oscillators.
+2
Trading Presets: Switch between Scalping, Day-Trading, and Swing-Trading modes. The script automatically adjusts periods and lengths (e.g., RSI 7 for Scalping vs. 21 for Swing) to match the market speed.
+3
Included Oscillators
Stochastic & RSI: Standard momentum tools with color-coded signals.
Traders Dynamic Index (TDI): A full suite including the RSI Price Line, Signal Line, and Market Base Line with optional Bollinger Bandwidth columns.
+1
MACD & Zero-Lag MACD: Includes histogram fills and trend-colored lines for faster reaction to price movement.
+2
Andean Oscillator: An advanced tool to identify Bull/Bear dominance and market "Range" or "Reversal" states.
Visual Signals & Alerts
Market Trend: Optional visual coloring based on indicator crosses to quickly spot bullish or bearish momentum.
+3
Customizable UI: High-fidelity rendering with dashed levels and proportional fills for a professional, clean interface.
+1
Integrated Alerts: Pre-configured alerts for Andean Oscillator trend changes (Bullish, Bearish, or Reversal).
How to use
Select your Trading Mode in the settings based on your timeframe.
Toggle the indicators you want to see.
Use the Stacked mode if you want to keep your sub-window organized without lines crossing each other.
