Ultimate Volume Custom ScreenerThis indicator will allow you to make your custom volume TradingView screener without coding. Add it to the chart, and select up to 40 symbols and up to five indicators. The screener will do the rest for you. The indicator will form a lovely table with all values and highlighted signals. It allows also to filter symbols based on the values of indicators and sends results as an alert.
The screener is highly customizable, and you can choose its position on the chart, sorting, order of the columns, colors for the tables, and all signals separately. You can easily change parameters for all supported indicators.
Supported indicators
Currently, there are 15 different custom indicators available. Current list of indicators:
Accumulation/Distribution (Acm/Dst)
Chaikin Money Flow (CMF)
Ease of Movement (EOM)
Klinger Oscillator (KO)
Money Flow Index (MFI)
Negative Volume Index (NVI)
On Balance Volume (OBV)
Positive Volume Index (PVI)
Price
Price-Volume Trend (PVT)
Volume
Volume MA (VMA)
Volume Percentile (V-Prct)
Volume RSI (V-RSI)
Volume Weighted Average Price (VWAP)
We're already working on adding a few more supported indicators. If you have any ideas about the indicators you want to see in our screener, contact us, and we'll consider them.
Filters
You can combine up to 5 filters on all selected indicators.
This will split the screen table into two parts. The top one will contain symbols that satisfy all conditions:
Alerts
You can also create an alert and receive a filtered symbol at the end of every bar.
Disclaimer
Please remember that past performance may not be indicative of future results.
Due to various factors, including changing market conditions, the strategy may no longer perform as well as in historical backtesting.
This post and the script don’t provide any financial advice.
Поиск скриптов по запросу "screener"

FSS Multi-Coin Screener 2.0 -- by @FlokicryptoFSS Multi-Coin Screener is built so that the user can scan the target timeframe quickly to see on which coins FSS Buy or Sell signals have shown up in the last closed candle or is currently printing on the real-time candle. As opposed to the FSS Indicator MTF Screener which scans multiple timeframes. This saves both the time and effort of having to browse through multiple coin pairs or stocks. By using this script the user will be able to quickly screen through the table and read what the FSS indicator is telling, without touching switching the ticker. Its uniqueness and originality is tightly related to its tandem work with the FSS Indicator (You can find the description of this indicator below).
Above you can see Bitcoin printed on the chart 3 candles prior, and several FSS buy signals on the table below the chart. *I am using low timeframes for the chart because I could not find any current signals on higher timeframes.
Below you can see Buy signals on multiple coins in the table, and on the chart a 5 min buy signal on APEUSDTPERP (which is not even in the table).
** The format of the table, cells and text can be changed without notice, but it is my plan to make as many things as possible with regards to the table, editable by the user in the long term.
About the FSS Indicator:
This FSS Indicator script (which is included within this screener) is unique not only in that it removes the need for the user to run each of these indicators individually; it provides an ‘at-a-glance’ summary of the aggregate indicator data, while also providing the user a simultaneous recommended stop loss value based on past market behavior for the given asset and the user's tolerance to risk by editing the ATR Multiplier in the inputs.
The basic concept of the script is to apply past data to present market conditions, and through the use of that data, provide an additional confluence/confirmation signal which simultaneously provides a recommended stop loss value based on average true range (ATR).
The FSS Indicator uses a blend of :
RSI: If within a defined RSI range, increments print score.
MACD: trend and crossovers increment print score.
Histogram: increments print score if a trend of X candles is up or down.
21 EMA: Increments print score if price is above/below 21EMA.
Parabolic SAR: Increments print score if price is above/below Parabolic SAR .
These parameters generate a print score, which is then determined to be sufficient or not to print a LONG or a SHORT signal on the candle.
The indicator isn't built to find bottoms or tops, won't trigger 100% of the time, but should see a high success rate when triggered on higher timeframes. After testing on several pairs/tickers ( Bitcoin , Ethereum , XRP, DJI, SPX and others) on multiple timeframes I have seen the best results on 12-hour, Daily, 2-day, 3-day & weekly timeframes. The success criteria are as follows: Stop Loss not hitting before a rise of at least 10% in value for a long, or a loss of at least 10% in value for a short; waiting until the signal-candle closes for confirmation and back testing.
**Disclaimer: The recommendations of the Indicator/Screener are the result of back-tests and past results will never guarantee future performance of this script on any chart.**

Watchlist Screening Hammer & Engulfing Strategies [By MUQWISHI]A trading strategy screener is an idea of a visual alert for those who're trading particular strategies and facing a lack of capability of monitoring many symbols simultaneously, so this kind of tool could be more efficient to keep managing trading plans smoothly and quickly. I developed this screener as an idea more than providing legend strategies.
This screener indicator performs scanning 4 different strategies with customizable 10 symbols inputs, and 5 min is the preferable timeframe.
Strategies
1. Hammer at Low of the day.
2. Shooting Star at High of the day.
3. Bull Engulfing at Low of the day.
4. Bear Engulfing at High of the day.
Screener Overview
Disclaimer
I'm an amateur, and I'm not a qualified licensed investment advisor.
I don't recommend the use of showing signals as a sole means of trading decisions.

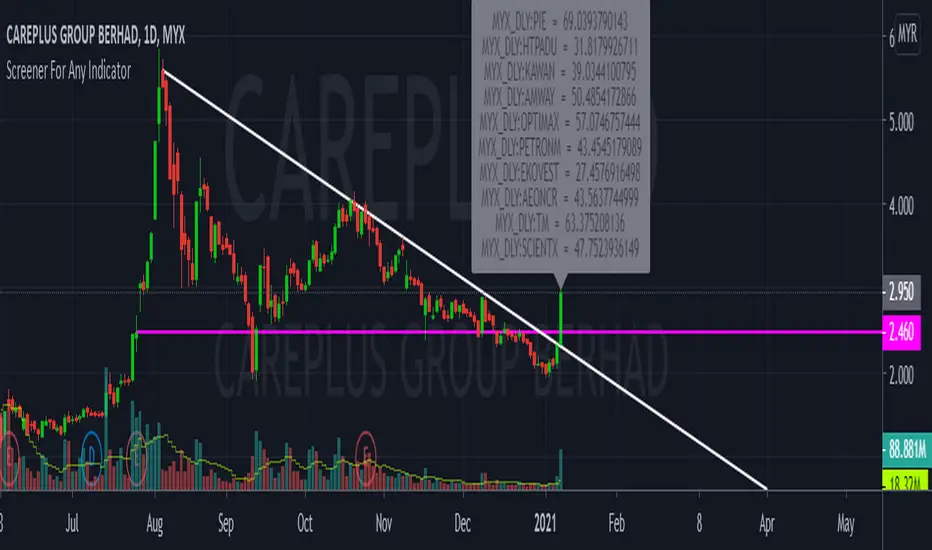
CustomScreenerTo apply your indicator with screener , please modify the section which i mention "Start your indicator pine script" & "End your indicator pine script"
At the pinescript section you will able to change the ticket symbol .
I only able to show screener result with 10 item in 1 times . To view more result, please go to setting and change stock list "1-10">"11,20">"21-30".....
Able to screener 100 items with this indicator.
Kindly change the exchange and stock in the pinescript according your watchlist.
As examples, my indicator is to determine the stock in which trend, i want to find out all stock with aqua color trend
The screener result show only 9 of 10 are in aqua color trend.
Seasonality Screener Best Long & Short Patterns Auto-ScanThe Seasonality Screener automatically scans a market’s history to find the most profitable seasonal patterns in the days ahead.
It searches for both long and short setups and shows you the two best patterns based on historical performance.
For each pattern, the screener looks back over past years and calculates:
Average return
Hit rate (win rate)
Winning years vs. total years
The results are displayed in a compact on-chart table with:
Entry date & exit date (calendar days)
Pattern length
Average return & hit rate
Win/trade count
Optionally, the indicator can also draw highlighted boxes in the chart’s history for the selected long and/or short pattern, so you can visually inspect how the seasonal window performed in each year.
You can:
Define how far ahead the screener should look (e.g. next X days),
Control the minimum and maximum pattern length,
Choose how many years of history to use,
And filter by simple regimes such as US election cycle years.
Internally, all calculations are based on daily data, so the seasonal analysis has to be done on the daily timeframe.
This tool is designed as a research and idea generator for seasonal tendencies and should be used together with your own risk management and trading plan.

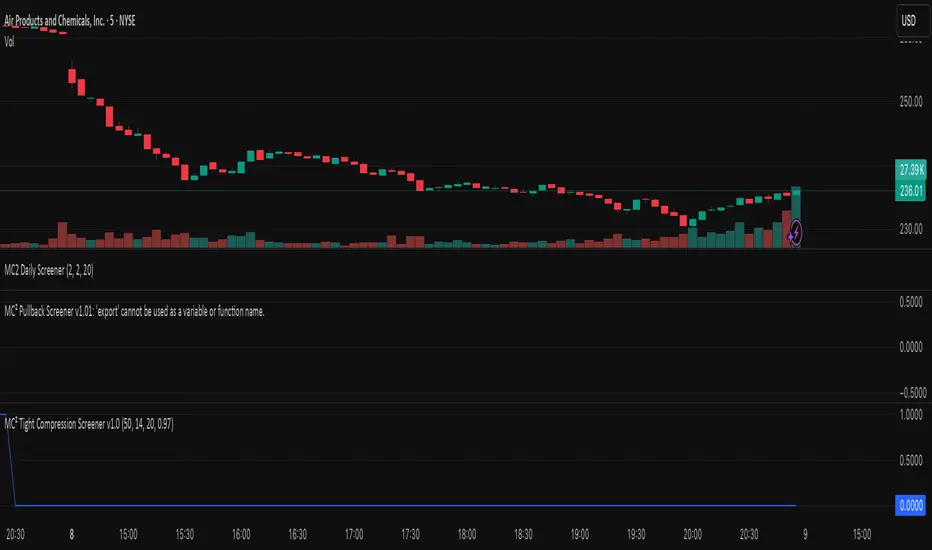
MC² Pullback Screener v1.01//@version=5
indicator("MC² Pullback Screener v1.01", overlay=false)
//----------------------------------------------------
// 🔹 PARAMETERS
//----------------------------------------------------
lenTrend = input.int(20, "SMA Trend Length")
relVolLookback = input.int(10, "Relative Volume Lookback")
minRelVol = input.float(0.7, "Min Relative Volume on Pullback")
maxSpikeVol = input.float(3.5, "Max Spike Vol (Reject News Bars)")
pullbackBars = input.int(3, "Pullback Lookback Bars")
//----------------------------------------------------
// 🔹 DATA
//----------------------------------------------------
// Moving averages for trend direction
sma20 = ta.sma(close, lenTrend)
sma50 = ta.sma(close, 50)
// Relative Volume
volAvg = ta.sma(volume, relVolLookback)
relVol = volume / volAvg
// Trend condition
uptrend = close > sma20 and sma20 > sma50
//----------------------------------------------------
// 🔹 BREAKOUT + PULLBACK LOGIC
//----------------------------------------------------
// Recent breakout reference
recentHigh = ta.highest(close, 10)
isBreakout = close > recentHigh
// Pullback logic
nearSupport = close > recentHigh * 0.98 and close < recentHigh * 1.02
lowVolPullback = relVol < minRelVol
// Reject single-bar news spike
rejectSpike = relVol > maxSpikeVol
//----------------------------------------------------
// 🔹 ENTRY SIGNAL
//----------------------------------------------------
pullbackSignal = uptrend and lowVolPullback and nearSupport and not rejectSpike
//----------------------------------------------------
// 🔹 SCREENER OUTPUT
//----------------------------------------------------
// Pine Screener expects a plot output
plot(pullbackSignal ? 1 : 0, title="MC² Pullback Signal", style=plot.style_columns, color=pullbackSignal ? color.green : color.black)

MC2 Daily Screener//@version=5
indicator("MC2 Daily Screener", overlay = false)
// 🔹 Inputs
relVolThresh = input.float(2.0, "RelVol Threshold")
rangeMult = input.float(2.0, "Range Multiplier")
lookback = input.int(20, "Lookback Bars")
// 🔹 Calculations
relVol = volume / ta.sma(volume, lookback)
rangeNow = high - low
rangeAvg = ta.sma(rangeNow, lookback)
// 🔥 MC² condition
mc2 = relVol > relVolThresh and rangeNow > rangeAvg * rangeMult
// 🔹 Convert to numeric (1 = signal, 0 = none)
mc2Value = mc2 ? 1.0 : 0.0
// This plot is what Pine Screener will use as a column/filter
plot(mc2Value, title = "MC2", style = plot.style_columns)
// Optional: alert so you can also use alertconditions in the Screener
alertcondition(mc2, title = "MC2 Signal", message = "MC2 signal on {{ticker}} ({{interval}})")

Donchian 20/10 Screener + Alerts Donchian 20/10 Screener + Alerts identifies stocks breaking their 20-day high.
Includes ADX trend filter to confirm strong momentum.
Plots Donchian high/low lines and marks BUY/SELL signals on chart.
Screener output shows “PASS” for stocks meeting entry criteria.
Supports alerts for entry, exit, and screener signals for easy monitoring.

VWAP and IVP Volatility Screener AlertVWAP and IVP Volatility Screener Alert is a multi-asset, institutional-grade market scanner that combines Auto-Anchored VWAP, Implied Volatility Percentile (IVP), Choppiness Index, Strike Price Structure, and Volume Profile (POC / Value Area) to generate high-probability trade signals across multiple symbols.
Designed for traders who rely on volatility regimes, VWAP interactions, trend confirmation, and strike-based price behavior, this tool automatically evaluates up to 10 assets simultaneously and displays actionable BUY/SELL conditions in a unified dashboard and screener panel.
Key Features
1. Multi-Asset Screener (10 Symbols)
Scans FX, indices, commodities, and metals. Displays RSI, ADX, trend, score, volatility regime, VWAP/POC/Value Area position, IVP, and Choppiness. Custom strike increments per asset.
2. Auto-Anchored VWAP System
Auto anchors by Session, Day, Week, Month, or Auto. Includes VWAP bands and bounce detection to show when price is Above, Below, or interacting with VWAP.
3. Volume Profile + POC / Value Area
Generates intraday/session POC, VAH, and VAL. Detects breaks, retests, and bounce signals.
4. IV Percentile (IVP) Engine
Converts realized volatility into IVP and classifies regimes (EXT.HI → EXT.LO). Supports Favorable, Extreme, and High-Volatility modes for different trading styles.
5. Choppiness Index (CHOP)
Identifies trending vs ranging conditions and feeds directly into scoring and alerts.
6. 11-Criteria Alert System
Alert logic includes RSI, ADX, trend, volume, VWAP, POC/VA, strike proximity, std-dev breaks, IVP, CHOP, and score thresholds. Supports Score-Based or Multi-Criteria modes.
7. Price-to-Strike Mapping
Rounds price to the correct strike ladder, detecting reversals, continuation, breakout levels, and helping frame stop-loss/TP zones.
8. Session-Aware Filtering
Filters signals for Asian, London, and NY sessions with custom timezone support.

Top 20 Screener📘 Indicator Description: I Top 20 Screener
Name:
Top 20 Screener
✅ 1. Features
This screener is designed to monitor and evaluate up to 20 selected IDX (Indonesia Stock Exchange) stocks using technical indicators. It offers a compact and visual table on your chart.
🔧 2. How to Use
Apply the Indicator
Add the indicator to your TradingView chart.
Make sure the timeframe and chart symbol are set correctly (usually apply it to any chart, as it requests data from the 20 symbols independently).
Choose Stocks to Screen
Under the “Symbols” section, check the stocks you want to include (default includes all 20).
Use the Filter Panel (Optional)
Turn on "Filter Enabled".
Choose a Filter Column (e.g., MACD > 0).
Set the "From" and "To" values to filter conditions (e.g., From = 1, To = 1 to show only MACD-positive stocks).
Interpret the Table
Each row shows one stock and its current technical status based on the selected indicators.
Green backgrounds mean bullish signals.
Red or gray indicate bearish or neutral.
📝 3. Remarks
This script uses request.security() to fetch external symbol data — it may lag slightly or be restricted in real-time depending on your plan.
Customizable Symbol List: You can edit the list to monitor any other stocks (IDX or non-IDX).

FVGC — MTF ScreenerFVGC — MTF Screener (by Capital Complex)
Part of the FVGC Suite.
A compact, real-time dashboard that scans the 30s, 1m, 2m, and 3m timeframes for FVGC-compliant conditions—showing a green/red dot when a bullish/bearish setup is arming, and a green/red square when the setup confirms. Built to sit beside FVGC — Signals and FVGC — Visual Overlay so you can monitor multiple timeframes at once without clutter.
---
## What it does
Multi-TF heads-up display : Tracks 30s, 1m, 2m, 3m for valid FVGC criteria.
Clear state encoding:
* Dot = conditions are aligning (setup arming).
* Square = entry model confirmed (go/no-go).
Rule-true logic: Mirrors your FVGC rule set (tap/engulf/inversion and guardrails) so the screener matches what your Signals indicator would accept on each timeframe.
Noise control: Honors your Trading Windows to keep the screen focused on the session you actually trade.
---
## Why traders use it
Time compression: See four lower timeframes progress from “almost” to “confirmed” at a glance.
Discipline aid: Use the dot phase as a heads-up, and the square as the only moment you consider action—no more chart hopping.
Suite cohesion: Screener tells you when, Visual Overlay shows where, Signals defines how.
---
## Key features & options
Timeframes: 30s, 1m, 2m, 3m (fixed for clarity and speed).
FVGC-aligned filters: Honors your suite’s guardrails (e.g., IFVG/BOS logic, midpoint FTC checks, opposing-FVG 50% behavior, opening-range distance caps by TF).
Trading Windows aware: Optional pre-window arming visibility for early heads-up.
Readable UI: On-chart table/HUD with per-state colors (dot/square), custom text color control, and minimal footprint.
Timezone aware: Defaults to America/New_York to align with RTH and your other FVGC tools.
---
## Notes
Designed for index futures, indices, and liquid FX.
This is a visual scanner; it does not place orders. Pair with FVGC — Signals for your actual entry/management logic.
---
## Credits & suite
Capital Complex — FVGC Suite
© TheHiddenMarkets (code components)
---
## Disclaimer
This tool is for educational purposes only and does not constitute financial advice. Trading involves risk; do your own research and manage risk appropriately.

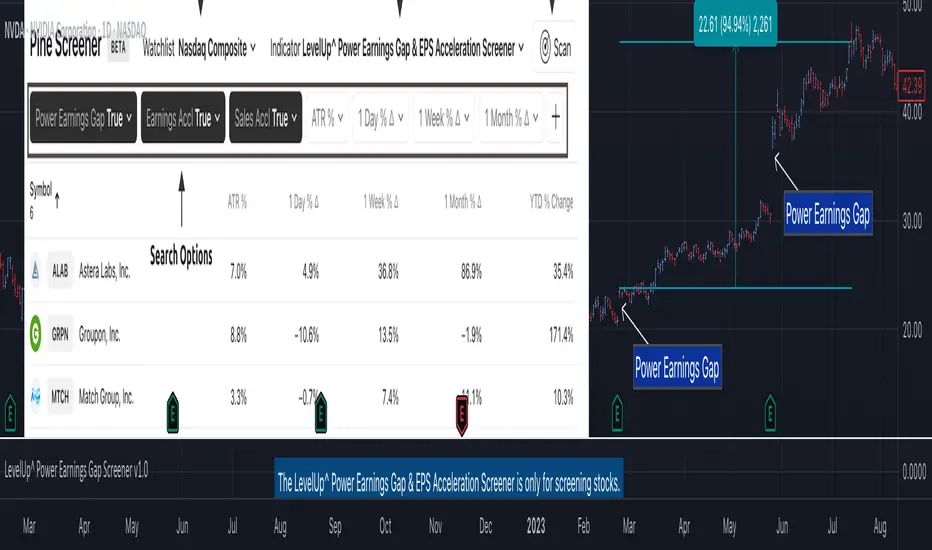
Power Earnings Gap Screener Pro [LevelUp]Customizable Pine Screener to scan for stocks with a Power Earnings Gap as well as accelerating earnings and sales. Historical analysis shows that strong earnings often trigger institutional buying, pushing prices higher and increasing the likelihood of sustained price gains.
🔹 Power Earnings Gap (PEG)
A power earnings gap refers to a significant price gap up after an earnings report, reflecting a rapid shift in investor sentiment and perceived value. It’s called "power" because the move is often sharp, sustained, and accompanied by high trading volume, signaling a potential trend continuation or reversal.
A gap is the difference between the closing price of a stock on the day before an earnings report and the opening price the next trading day. A power earnings gap typically exceeds a certain threshold (e.g., 8-10% or more) and is driven by earnings surprises, guidance changes, or other significant news.
Strong earnings beats, misses, or forward-looking guidance can trigger these gaps. For example, a company reporting higher-than-expected profits or raising guidance might gap up, while a miss or weak outlook could cause a gap down.
The gap is often accompanied by above-average trading volume, confirming the move's strength. Power gaps often lead to sustained price movement in the direction of the gap (continuation) or signal a reversal if the gap fills quickly.
How Power Earnings Gap Be Helpful
▪ Power earnings gaps often indicate strong momentum. Traders can capitalize on this by entering trades in the direction of the gap (e.g., buying on a gap-up if the trend continues).
Example: If a stock gaps up 10% after a stellar earnings report and shows high volume, traders might buy, expecting further upside as momentum builds.
▪ Breakout Opportunities: A gap through key technical levels (e.g., resistance or support) can signal a breakout. Traders use these gaps to identify potential long-term trends.
Example: A stock breaking above a resistance level on a power earnings gap may continue to rally, offering a setup for swing or position traders.
▪ Volatility for Short-Term Trades: Earnings gaps create heightened volatility, ideal for day traders or scalpers. The large price swings allow for quick profits if timed correctly.
Example: A trader might use options (e.g., calls for a gap-up, puts for a gap-down) to leverage the volatility around earnings.
▪ Confirmation of Fundamental Strength/Weakness: A power earning gap often reflects a fundamental shift, e.g., strong earnings growth or a major business development. Traders can use this to align technical setups with fundamental catalysts.
Example: A gap-up after a company raises its full-year guidance might signal a long-term buying opportunity.
▪ Risk Management and Stop Losses: Gaps provide clear levels for setting stop-loss orders. For instance, traders might place stops at or below the gap up bar low to protect against a potential reversal.
Example: If a stock gaps up from $100 to $110 and intraday hits a low of $105, a trader might set a stop at $105 or lower to limit downside risk.
▪ Gap Fill Strategies:Some traders bet on gaps filling, i.e., the stock returning to its pre-gap price. If a power earnings gap seems overextended (e.g., due to market overreaction), contrarian traders might short a gap-up or buy a gap-down, anticipating a pullback.
Example: A stock gaps up 15% but lacks volume or follow-through; a trader might short it, expecting the price to retreat.
🔹 Earnings and Sales Acceleration
Earnings and sales acceleration refers to the rate of growth in a company's earnings over consecutive quarters. It highlights companies that are not only growing but doing so at an accelerating pace, signaling improving financial health and operational momentum. This metric is derived from earnings reports, which detail a company’s financial performance.
Key Concepts
▪ Earnings Acceleration: When a company’s earnings per share (EPS) growth rate increases over time (e.g., EPS growth of 10% in Q1, 15% in Q2, 20% in Q3). It indicates improving profitability, often due to cost efficiencies, margin expansion and strong demand.
▪ Sales Acceleration: When revenue growth rates increase over time (e.g., revenue growth of 5% in Q1, 8% in Q2, 12% in Q3). This reflects rising demand for products/services and operational efficiency.
▪ Relation to Earnings Reports: Acceleration is calculated by comparing sequential quarter-over-year growth rates in earnings and sales, often highlighted in earnings reports or analyst commentary. It’s a sign of fundamental strength when both metrics accelerate together.
How It’s Helpful to Traders
▪ Identify High-Potential Stocks: Stocks with accelerating earnings and sales often attract investor attention, as they signal a company is outperforming expectations and gaining market share. This can lead to sustained price appreciation.
Example: A tech company reporting 20% EPS growth and 15% sales growth quarter-over-quarter may see bullish price action as investors bet on continued momentum.
▪ Momentum Trading Opportunities: Acceleration often fuels stock price momentum, especially post-earnings. Traders can ride these trends using technical setups like breakouts or pullbacks.
Example: A stock breaking above a key resistance level after reporting accelerating growth may be a buy signal for swing traders.
▪ Early Indicator of Breakouts: Companies with accelerating fundamentals are more likely to experience price breakouts, as institutional investors (e.g., hedge funds, mutual funds) pile in. Traders can use this to position early.
Example: A retailer with accelerating sales due to strong holiday demand might gap up post-earnings, offering a breakout trade.
▪ Confirmation of Fundamental Strength: Acceleration validates a company’s growth story, reducing the risk of investing in stocks with inconsistent performance. Traders can align technical trades with strong fundamentals.
Example: A biotech with accelerating sales from a new drug launch may sustain a rally, giving traders confidence in long positions.
▪ Volatility for Short-Term Trades: Earnings reports showing acceleration often lead to significant price gaps or volatility, creating opportunities for day traders or options traders.
Example: A trader might buy call options on a stock expected to report accelerating earnings, anticipating a sharp post-earnings move.
🔹 Power Earnings Gaps - Examples
🔹 Screening Features - Setting Your Search Criteria
Power Earnings Gap
▪ Search Range
How many bars back to search for Power Earnings Gaps, anywhere between 1 and 90 bars.
▪ Last Bar Only
Look only at the last bar for Power Earnings Gaps. This is useful when looking for PEGs when screening at the end of a trading day. Choosing this option, the Search Range will be ignored.
▪ Minimum Price % Gap Up From Prior Close
This is the minimum gap up percent change to be considered a Power Earnings Gap.
▪ Minimum Volume % Change Over Average
This is the minimum volume percent change, over the 50-day average volume, to be considered a Power Earnings Gap.
▪ Require Positive Surprise
Require a positive earnings surprise and the minimum percent change.
▪ Require Closing Range
To ensure the price action closed strong on the day, specify a preferred closing range as a percentage of the bar's daily range.
▪ Gap Up Bar
The gap up bar can be configured to require one of the following:
- Open Above Prior High - Ensures there is visible gap up from the prior bar.
- Low Above Prior High - Allows for intraday price action to go below the prior bar high.
- No Requirement
Earnings And Sales Acceleration
▪ Quarters of Acceleration
You can specify between 1 and 4 quarters of earnings and/or sales acceleration.
🔹 Installation And Usage
▪ Mark this indicator as a Favorite.
▪ Use the Pine Screener to search for stocks.
▪ Save the search results to a watchlist.
▪ View the watchlist in TradingView.
🔹 Note
▪ Risk of Reversals: Not all gaps sustain their direction. Over reactions can lead to gap fills.
▪ High Volatility: Earnings gaps can be unpredictable, requiring quick decision-making & discipline.
Платный скрипт
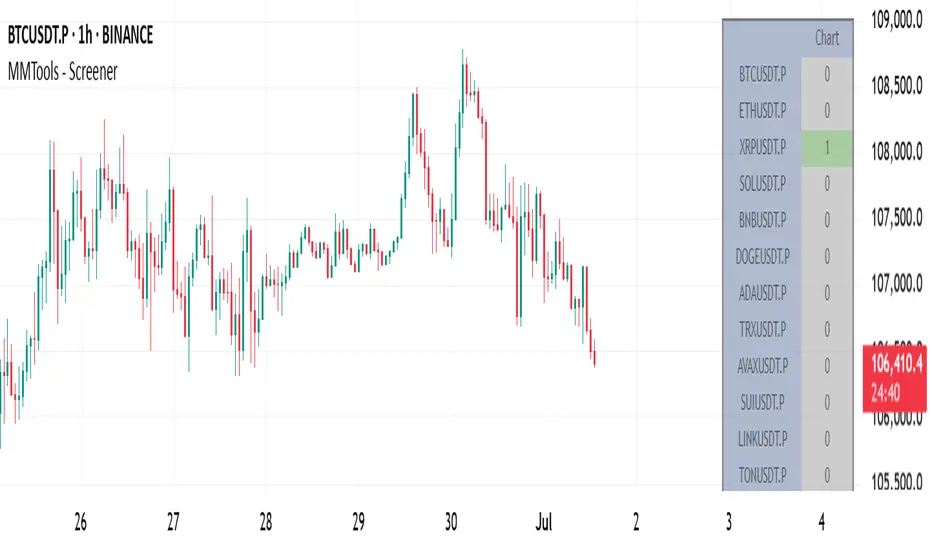
MMTools - Screener❖ Overview
Screener expands your market insights and provides an efficient way to monitor real-time signals from Catcher across hundreds of charts on a single screen.
Each cell in the table displays the number of indicator signals. For instance, a value of "1" in the row labeled ‘BTCUSDT.P’ and column ‘30’ indicates one long signal on the 30-minute Bitcoin chart within the selected lookback period. “0” means no signal in the lookback.
❖ Multi-Table Construction
Screener supports flexible layouts and overlays. To build a multi-table interface, simply add multiple instances of the script to your chart. For optimal usability, it is recommended to allocate a dedicated panel or tab.
⚙️ Key Parameters to Customize Initially
Indicator Lookback: Defines how far back Screener checks for signals.
Symbols: Choose up to 20 symbols. Use additional tables to expand coverage.
Size: Adjusts the overall dimensions of the table.
Display Settings: Customize colors, opacity, and symbol visibility. For dark theme charts, set color opacity to 100% and transparency to 0%.
⚙️ Per-Table Adjustable Parameters
Timeframe: This defines the interval for signal collection across all symbols displayed in the top row of the table. It must be equal to or greater than the chart’s timeframe, otherwise the script will deliberately trigger an error. For multiple tables, use a lower chart timeframe (e.g., 1 minute) to meet this requirement.
Table Positioning: Use either the “Position” (predefined screen locations) or “Block” (stacked layout) parameters. The “Block” method enables a greater number of tables by aligning them side-by-side efficiently.
-- Multi-table example demonstrating the use of the ’Position’ parameter --
-- Multi-table example demonstrating the use of the ’Block’ parameter --
❖ Access
Please refer to the Author's Instructions field to request access to the script.
-----------------------------------------------------------
Disclaimer
The information provided by my scripts is for informational purposes only and does not constitute financial advice. Past performance is not indicative of future results. Always do your own research before making financial decisions.
IPO Date ScreenerThis script, the IPO Date Screener, allows traders to visually identify stocks that are relatively new, based on the number of bars (days) since their IPO. The user can set a custom threshold for the number of days (bars) after the IPO, and the script will highlight new stocks that fall below that threshold.
Key Features:
Customizable IPO Days Threshold: Set the threshold for considering a stock as "new." Since Pine screener limits number bars to 500, it will work for stocks having trading days below 500 since IPO which almost 2 years.
Column Days since IPO: Sort this column from low to high to see newest to oldest STOCK with 500 days of trading.
Since a watchlist is limited to 1000 stocks, use this pines script to screen stocks within the watch list having trading days below 500 or user can select lower number of days from settings.
This is not helpful to add on chart, this is to use on pine screener as utility.
Upside Reversal Screener [LevelUp]The Upside Reversal Screener can be helpful to find strength when stocks have been showing weakness or the overall market is down. An upside reversal in a stock occurs when its price, after declining, changes direction and begins to trend upward. This pattern can signify a shift in market sentiment from bearish to bullish.
🔹 Upside Reversal Characteristics
✓ Price goes below prior day/week low then rallies to close with a gain or a minimal loss.
✓ Closing range in the upper half of the day/week.
✓ Ideally, volume shows an increase over the average daily/weekly volume.
🔹 Configurable Settings
✓ Specify the number of lower lows.
✓ Require the price low to be above a configurable moving average.
✓ Require the moving average to be trending up.
✓ Specify price % change.
✓ Specify closing range.
✓ Limit search to specific symbol types, for example, only stocks and no ETFs.
🔹 Pros of an Upside Reversal
An upside reversal can provide an early entry point into a potential new uptrend. The reversal may attract buyers, resulting in sustained upward price momentum. Reversals that follow a prolonged downtrend suggest the end of bearish dominance, which may give way to a longer-term bullish trend.
🔹 Cons of an Upside Reversal
Not all reversals continue their upward trend; some may turn out to be "dead cat bounces" or a short-term retracement before the downtrend resumes. It can also be challenging to know when to enter a trade on a reversal as entering too early might lead to losses if price reverses and the downtrend continues.
🔹 Risk Management
One common approach to risk management is to use a recent low as a stop. Another potential stop would be an area of prior support or consolidation. It often feels counterintuitive to enter a trade when the trend has been downward. Which speaks to why risk management must always be part of your game plan.
🔹 Installation And Usage
▪ Mark this indicator as a Favorite.
▪ Use the Pine Screener to search for stocks.
▪ Save the search results to a watchlist.
▪ View the watchlist in TradingView.

Breakout Scanner (Screener)Breakout Scanner (Screener style — single indicator to drop in Screener tab)

MC² Tight Compression Screener v1.0//@version=5
indicator("MC² Tight Compression Screener v1.0", overlay=false)
// ————————————————
// Inputs
// ————————————————
lookbackHigh = input.int(50, "Near High Lookback")
atrLength = input.int(14, "ATR Length")
volLength = input.int(20, "Volume SMA Length")
thresholdNear = input.float(0.97, "Near Break % (0.97 = within 3%)")
// ————————————————
// Conditions
// ————————————————
// ATR Compression: shrinking 3 days in a row
atr = ta.atr(atrLength)
atrCompression = atr < atr and atr < atr and atr < atr
// Price is near recent highs
recentHigh = ta.highest(high, lookbackHigh)
nearBreak = close > recentHigh * thresholdNear
// Volume not dead (preferably building)
volAvg = ta.sma(volume, volLength)
volOK = volume > volAvg
// Final signal (binary)
signal = atrCompression and nearBreak and volOK
// ————————————————
// Plot (for Pine Screener)
// ————————————————
plot(signal ? 1 : 0, title="MC2 Compression Signal")
Gap-Up Momentum Screener (S.S)
ENGLISH-VERSION
1) TradingView Gap Screener (for US stocks)
➤ Conditions
Gap-Up ≥ +3% (large gaps indicate institutional pressure)
Pre-market volume ≥ 150% of the 20-day average
RS line > 50
Price > 50 SMA
Market cap ≥ 1 billion USD
No penny stocks
2) Minervini Gap-Entry Strategy (Swing Trading)
This is a variant specifically optimized for gaps + momentum.
A) Setup Criteria
The stock must meet the following conditions:
Gap-Up ≥ +3%
First retracement ≤ 30% of the gap
High relative strength (RS line rising)
Volume on the gap day > 2× average
Price above 20 EMA, 50 SMA, 150 SMA, 200 SMA
No immediate resistance within 2–5%
B) Entry Setups
Entry 1: First Pullback Entry (FPE)
Wait for the first 1–3 day consolidation.
Entry → Breakout of the small range.
Stop → Below the low of the pullback.
Rule: No entry on the gap day itself.
Entry 2: High Tight Flag above the Gap
Stock rises > 10% after the gap
Then forms a 3–8 day sideways phase
Entry → Break above the flag’s high
Stop → Below the flag base
Entry 3: ORB Entry (Opening Range Breakout, 30 minutes)
Very effective for strong gaps.
Wait 30 minutes after the market opens
Entry → Break above the high of these first 30 minutes
Stop → Below the 30-minute low
C) Stop Levels
For FPE: 4–8%
For ORB: 1–2 × ATR(14)
For flags: 3–5%
D) Add Rules
Only if the stock continues showing strong volume:
Add on every new 3–5 day high
Add only above half-range levels
Maximum 3 adds
3) Early-Warning Module (Setup forming but not ready for entry)
This module marks stocks that are forming a setup but are not yet buyable.
➤ Criteria
Gap-Up ≥ 3%
Strong volume
Stock pulls back and consolidates (1–5 bars)
BUT no breakout yet
4) Exact Entry Checklist (Minervini-style, optimized for gaps)
Checklist before entry:
Gap ≥ +3%
20 EMA rising
Volume > 2× average
RS line rising
Price > 50 SMA
Pullback not deeper than 30% of the gap
3+ green signals from the Early-Warning diamonds
If all 7 are fulfilled → green light.
5) How to apply the strategy in daily practice
Morning (08:00–09:00)
Check the screener
Build your watchlist
Identify gaps
US Market Open (15:30)
Monitor the Early-Warning module
Sort gap momentum opportunities
16:00–17:00
Enter: First Pullback / ORB / Flag
Set stops
Determine position size based on risk
After 20:00
Check volume strength
If momentum fades → no more adds

Multi Condition Stock Screener & Alert SystemMulti Condition Stock Screener & Strategy Builder
This script is a comprehensive Stock Screener and Strategy Builder designed to scan predefined groups of stocks (specifically focused on BIST/Istanbul Stock Exchange symbols) or a custom list of symbols based on user-defined technical conditions.
It allows users to combine multiple technical indicators to create complex entry or exit conditions without writing code. The script iterates through a list of symbols and triggers alerts when the conditions are met.
Key Features
• Custom Strategy Building: Users can define up to 6 separate conditions. • Logical Operators: Conditions can be linked using logical operators (AND / OR) to create flexible strategies. • Predefined Groups: Includes 14 groups of stocks (covering BIST symbols) for quick scanning. • Custom Scanner: Users can select the "SPECIAL" group to manually input up to 40 custom symbols to scan. • Directional Scanning: Capable of scanning for both Buy/Long and Sell/Short signals. • Alert Integration: Generates JSON-formatted alert messages suitable for webhook integrations (e.g., sending notifications to Telegram bots).
Supported Indicators for Conditions
The script utilizes built-in ta.* functions to calculate the following indicators:
• MA (Moving Average): Supports EMA, SMA, RMA, and WMA. • RSI (Relative Strength Index) • CCI (Commodity Channel Index) • ATR (Average True Range) • BBW (Bollinger Bands Width) • ADX (Average Directional Index) • MFI (Money Flow Index) • MOM (Momentum)
How it Works
The script uses request.security() to fetch data for the selected group of symbols based on the current timeframe. It evaluates the user-defined logic (Condition 1 to 6) for each symbol.
• Comparison Logic: You can compare an indicator against a value (e.g., RSI > 50 ) or against another indicator (e.g., MA1 CrossOver MA2 ). • Signal Generation: If the logical result is TRUE based on the "AND/OR" settings, a visual label is plotted on the chart, and an alert condition is triggered.
Alert Configuration
The script produces a JSON output containing the Ticker, Signal Type, Period, and Price. This is optimized for users who want to parse alerts programmatically or send them to external messaging apps via webhooks.
Disclaimer This tool is for informational purposes only and does not constitute financial advice. Since it uses request.security across multiple symbols, please allow time for the script to load data on the chart.

FOX ScreenerFOX Screener is a multi-indicator market scanner designed to analyze up to 10 symbols simultaneously and display their technical conditions in a clean, real-time table. It helps traders quickly identify bullish, bearish, and neutral setups based on a combined signal system.
The screener evaluates each symbol using:
RSI (Overbought/Oversold levels)
MACD (Momentum direction)
EMA Difference (Short–Long trend bias)
Bollinger Bands (Volatility-based reversal zones)
Price, High, Low (For quick reference)
Each indicator generates its own BUY/SELL/NEUTRAL reading, and the script consolidates them into a Total Signal with color-coded highlighting:
BUY when bullish signals dominate
SELL when bearish signals dominate
NEUTRAL when signals are mixed
Disclaimer:
The information provided is for educational and informational purposes only. It does not constitute financial or investment advice. Trading and investing in stocks involves risk, including the possible loss of capital. Any decisions to buy, sell, or hold securities are the sole responsibility of the reader. Past performance is not indicative of future results. Always do your own research and, if necessary, consult with a licensed financial advisor before making investment decisions.

MCF-TotalTrader-Fib ScreenerThis is an unique screener that scans fib levels among stocks and any asset to find high probability setups. You can choose and filter any fib levels of your likings. this is an cool screener and one of my personal favorites. This is the first of the Total Trader Indicator Series.

NSE Pairs Screener-20 pair This advanced Pine Script screener is designed for pairs trading on the National Stock Exchange (NSE) of India. It simultaneously monitors up to 20 stock pairs, calculates key statistical metrics, and provides real-time trading signals based on mean reversion strategies.
Key Features
1. Multi-Pair Analysis
Monitor up to 20 stock pairs simultaneously
Customizable number of pairs to display (1-20)
Pre-configured with popular NSE stock pairs across various sectors
2. Statistical Calculations
Correlation Analysis: Measures the strength of relationship between paired stocks
Z-Score Calculation: Identifies extreme deviations from the mean spread
Cointegration Score: Validates long-term equilibrium relationships
Dynamic Hedge Ratio: Calculates optimal position sizing between pairs
3. Trading Signals
Long Signal: When spread is oversold (Z-score ≤ -2.0)
Short Signal: When spread is overbought (Z-score ≥ 2.0)
Exit Signal: When spread returns to mean (Z-score ≤ 0.5)
Watch Status: Pairs requiring monitoring
4. Automated Alert System
Single comprehensive alert for all qualifying pairs
Customizable alert thresholds for correlation, Z-score, and cointegration
On-chart visual alerts with detailed information
Notification support via TradingView's alert system
5. Visual Display
Clean, color-coded table interface
Adjustable table position (9 positions available)
Highlighted trading opportunities
Real-time metric updates
Configuration Parameters
Screener Settings
Number of Pairs to Display: 1-20 pairs (default: 20)
Calculation Parameters
Parameter Default Range Description Correlation Lookback Period25220-500Historical period for correlation calculation Z-Score SMA Length205-100Moving average length for spread calculation Hedge Ratio Length205-100Period for hedge ratio smoothing Minimum Correlation0.70.5-1.0Threshold for pair validation
Alert Settings
Parameter Default Range Description Alert Correlation Threshold0.70.5-1.0Minimum correlation for alerts Alert Z-Score Threshold2.01.0-3.0Z-score trigger level Alert Cointegration Threshold90%80-99%Minimum cointegration percentage
Display Settings
Table Position: 9 position options (default: middle_center)
Table Background Color: Customizable
Highlight Opportunities: Toggle visual highlighting of trading signals
Pre-Configured Stock Pairs
The script includes 20 carefully selected NSE pairs across various sectors:
Financial Services
RELIANCE / ONGC
HDFCBANK / ICICIBANK
SBIN / PNB
KOTAKBANK / AXISBANK
BAJFINANCE / BAJAJFINSV
Information Technology
TCS / INFY
WIPRO / HCLTECH
TECHM / LTIM
Consumer Goods
ITC / HINDUNILVR
TITAN / TANLA
ASIANPAINT / BERGEPAINT
Telecommunications
BHARTIARTL / IDEA
Automotive
MARUTI / TATAMOTORS
Infrastructure & Industrials
LT / UBL
POWERGRID / NTPC
Pharmaceuticals
SUNPHARMA / CIPLA
DIVISLAB / DRREDDY
Materials
ULTRACEMCO / ACC
UPL / JSWSTEEL
Energy
ADANIENT / ADANIPOWER
🎨 Color-Coded Metrics
Correlation
🟢 Green: ≥ Minimum threshold (strong relationship)
🔴 Red: < Minimum threshold (weak relationship)
Z-Score
🔴 Red: |Z| ≥ 2.0 (extreme deviation - trading opportunity)
🟡 Yellow: 0.5 < |Z| < 2.0 (normal range - watch)
🟢 Green: |Z| ≤ 0.5 (mean reversion - exit signal)
Cointegration
🟢 Green: ≥ 70% (strong cointegration)
🟡 Yellow: 50-70% (moderate cointegration)
🔴 Red: < 50% (weak cointegration)
Status
🟢 Green: Long (buy spread)
🔴 Red: Short (sell spread)
🔵 Blue: Exit (close positions)
⚪ Gray: Watch (monitor)
Validation
🟢 Green: Pass (meets all criteria)
🔴 Red: Fail (doesn't meet criteria)
How It Works
1. Data Collection
The script fetches real-time closing prices for all 20 stock pairs from NSE.
2. Statistical Analysis
For each pair, the script calculates:
Log Returns: Natural logarithm of price changes
Correlation: Pearson correlation coefficient between returns
Hedge Ratio: Price ratio smoothed over specified period
Spread: Price difference adjusted by hedge ratio
Z-Score: Standardized spread deviation
3. Signal Generation
Based on Z-score thresholds:
Z ≥ 2.0: Short spread (short overvalued, long undervalued)
Z ≤ -2.0: Long spread (long overvalued, short undervalued)
|Z| ≤ 0.5: Exit positions (spread reverted to mean)
4. Validation
Pairs must meet criteria:
Correlation ≥ minimum threshold
Valid trading signal (entry or exit)
5. Alert Triggering
Alerts fire when pairs simultaneously meet:
Correlation ≥ alert threshold
|Z-score| ≥ alert threshold
Cointegration ≥ alert threshold
Alert System
The script features a single comprehensive alert that monitors all pairs:
Consolidated Notifications: One alert for all qualifying pairs
Detailed Information: Includes pair names, signal type, and key metrics
Visual Indicators: Red label on chart with complete details
Customizable Thresholds: Adjust sensitivity based on trading style
Alert Message Format
PAIR TRADING OPPORTUNITIES
Pair X: STOCK1/STOCK2
Signal: LONG/SHORT Spread
Z-Score: X.XX
Correlation: X.XXX
Cointegration: XX.X%
Trading Strategy Guide
Entry Rules
Long Spread (Z-score ≤ -2.0):
Buy Stock Y
Sell Stock X (in ratio of hedge ratio)
Short Spread (Z-score ≥ 2.0):
Sell Stock Y
Buy Stock X (in ratio of hedge ratio)
Exit Rules
Close positions when Z-score returns to ±0.5
Set stop-loss at Z-score ±3.0 (extreme deviations)
Risk Management
Only trade pairs with correlation ≥ 0.7
Prefer cointegration scores ≥ 90%
Monitor hedge ratio changes
Diversify across multiple pairs
Customization Options
Adding New Pairs
Simply modify the stock symbol inputs in the respective pair groups (Pair 1 through Pair 20).
Adjusting Sensitivity
Conservative: Increase Z-score threshold to 2.5-3.0
Aggressive: Decrease Z-score threshold to 1.5-2.0
Long-term: Increase lookback period to 500
Short-term: Decrease lookback period to 50-100
Visual Preferences
Change table position to suit your layout
Adjust background colors for better contrast
Toggle opportunity highlighting on/off
Technical Notes
Calculation Method
Uses logarithmic returns for correlation (better statistical properties)
Z-score normalized by standard deviation
Cointegration approximated using correlation strength
Hedge ratio smoothed using simple moving average
Performance Considerations
Calculations update on every bar close
Table displays only on the last bar
Alert checks occur at bar close
Maximum 500 labels supported (more than sufficient)
Limitations
Does not account for transaction costs
Assumes linear relationships between pairs
Historical correlation doesn't guarantee future behaviour
Requires sufficient liquidity in both stocks
Best Practices
Back test Thoroughly: Test parameters on historical data before live trading
Monitor Regularly: Check pairs daily for validation changes
Diversify: Trade multiple pairs to reduce risk
Stay Informed: Be aware of corporate actions, news affecting pairs
Adjust Parameters: Optimize for current market conditions
Use Stop-Losses: Protect against extreme divergences
Track Performance: Maintain trading journal for continuous improvement
Indicator Information
Version: Pine Script v5
Overlay: False (separate pane)
Max Labels: 500
Update Frequency: Every bar close
Compatible Timeframes: All (works best on daily or higher)
Getting Started
Add to Chart: Apply indicator to any NSE stock
Configure Pairs: Adjust stock symbols as needed
Set Parameters: Customize calculation and alert settings
Create Alert: Set up Trading View alert for notifications
Monitor: Watch the table for trading opportunities
Execute: Trade based on validated signals
📞Support & Updates
This script is designed for educational and research purposes. Always:
Conduct thorough back testing
Use proper risk management
Consider transaction costs
Consult with financial advisors
Trade responsibly
Disclaimer: This indicator is for educational purposes only. Past performance does not guarantee future results. Always conduct your own research and risk assessment before trading.

EMA Trend ScreenerThe EMA Trend Screener is a multi-symbol dashboard that quickly shows the trend direction of up to 40 cryptocurrencies (or any selected assets) based on their relationship to a chosen Exponential Moving Average (EMA).
For each symbol, the script checks whether the current price is above or below the specified EMA (default 75).
• Green = Uptrend (price above EMA)
• Red = Downtrend (price below EMA)
All results are displayed in a compact on-chart table, updating in real time for your selected timeframe.
Main benefits:
• Instantly monitor trend direction across multiple coins or markets
• Fully customizable symbol list (up to 40 assets)
• Adjustable EMA length for different trading styles
• Works on any timeframe
• Lightweight and efficient visual summary
In short:
EMA Trend Screener gives traders a fast, clean overview of which markets are trending up or down — ideal for trend following, momentum filtering, or trade selection.
Сreated with vibecoding using ChatGPT and Claude.