Session Open Lines [iFarsheed]Overview:
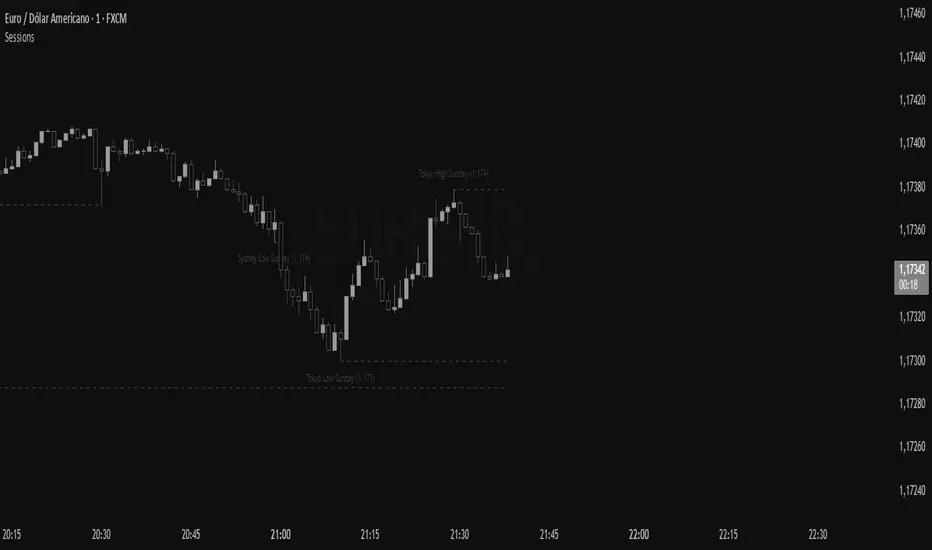
The "Session Open Lines " indicator is mainly designed for Al Brooks Price Action traders using 5-minute charts, particularly during the NYSE session. It marks Tokyo, London, and NYSE session open/close times with dashed lines and optional labels to help you analyze session-based price movements.
Features:
Session Marking:
Draws dashed lines to indicate the open and close times of Tokyo, London, and NYSE sessions.
NYSE session can be split into two or three parts for detailed analysis (e.g., Morning/Afternoon or Open/Middle/Close).
Optional Labels:
Displays labels (e.g., "Tokyo Open", "NYSE Close") below the chart to clearly identify session boundaries.
Labels can be toggled on or off for a cleaner chart view.
Customizable Display:
Choose which sessions to display and customize line colors to match your chart setup
How to Use:
Customize Settings:
Enable or disable specific sessions (Tokyo, London, NYSE) based on your trading focus.
Adjust line colors to ensure visibility against your chart background.
Toggle session labels on or off depending on your chart type (e.g., disable for RTH charts)
Analyze Session Boundaries:
Use the dashed lines to identify session open/close times and analyze price action around these key moments.
For NYSE session, split into two or three parts to break down the session into manageable segments for deeper analysis.
Informed Decision Making:
Leverage session boundaries to spot potential price action setups, such as breakouts or reversals, especially during the NYSE session
Important Note:
Due to Pine Script limitations (max 500 lines), if all sessions are enabled, lines are drawn for the past 5 days. Selecting fewer sessions allows more days to be displayed.
Lines are drawn only up to the current time; future session lines (e.g., NYSE Close) won't appear until the session ends.
For RTH charts, use only the NYSE session. It’s recommended to disable labels in RTH mode, as NYSE Open and Close lines are close together and labels may overlap.
Future Updates:
This indicator is just the beginning! Exciting new features are on the way to make your price action analysis even more powerful—stay tuned for updates!
If you have any suggestions or feedback, please share them in the comments section.
Happy Price Action Trading!
-iFarsheed-
Поиск скриптов по запросу "session"

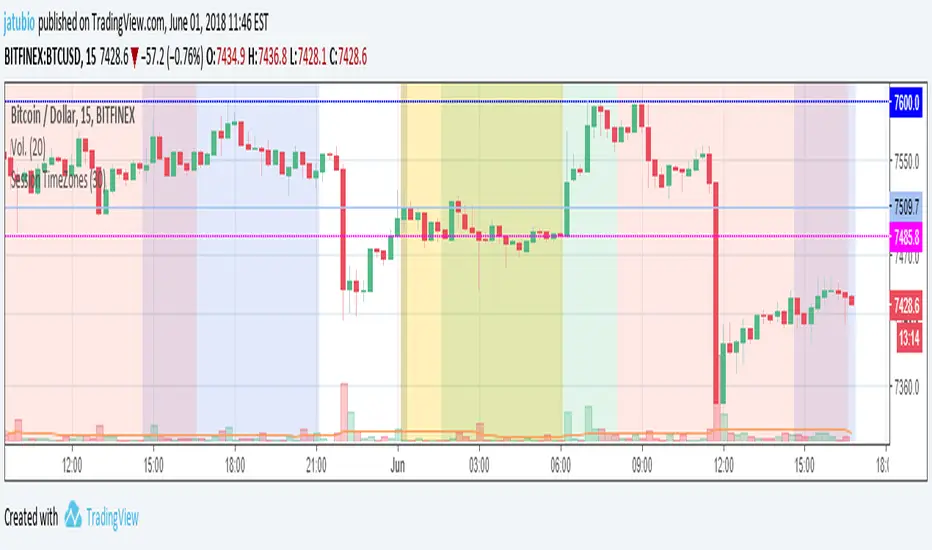
Session TimeZonesThis indicators show background colours to identify world timezones
New York, London, Tokio, China and Sydney sessions
You can also setup timeframe intervals to show or hide.
Time Values based on UTC: ** YOU HAVE TO SETUP YOUR CHARTS TO 0-UTC TIMEZONE **
Values from: en.wikipedia.org
New York: UTC-5
Market Session: 09:30 - 16:00 (Local Time)
Market Session: 14:30 - 21:00 (UTC Based Time)
London: UTC
Market Session: 08:00 - 16:30 (Local Time)
Market Session: 08:00 - 16:30 (UTC Based Time)
Tokyo: UTC+9
Market Session: 09:00 - 15:00 (Local Time)
Market Session: 00:00 - 06:00 (UTC Based Time)
China: UTC+8
Market Session: 09:30 - 16:00 (Local Time)
Market Session: 01:30 - 08:00 (UTC Based Time)
Sydney: UTC+10
Market Session: 10:00 - 16:00 (Local Time)
Market Session: 00:00 - 06:00 (UTC Based Time)
Can be used to know from what time of the world they are traders awake or
to search correlations between big moves and timezones hours.
Thanks to:
www.tradingcode.net
01/06/2018
Session Indicator by FlipPointThe indicator is designed to display trading sessions on a TradingView chart. It highlights the time ranges of major sessions such as Frankfurt, London, New York, and Asia, providing the ability to analyze price behavior during different periods of the trading day.
Functional settings
1. Show history
Enables or disables the display of sessions on historical parts of the chart. If disabled, only today's sessions are shown.
2. Show Frankfurt / London / New York / Asia
Each parameter is responsible for displaying the corresponding trading session. When enabled, a highlighted zone appears on the chart, representing the time boundaries of that session.
3. Show titles
Displays text labels with the name of each session.
4. Color settings
Determines the fill color of the highlighted zones for the respective sessions.
5. Label text color
Defines the color of the session title labels.
PDH / PDL parameters
Show PDH — displays the previous day’s high (Previous Day High).
Show PDL — displays the previous day’s low (Previous Day Low).
PDH/PDL lines color — sets the color of the lines representing these levels.
Time zone alignment
The indicator is automatically aligned with the time zone set in the TradingView chart settings. The time boundaries of the sessions adjust to the selected time zone without requiring manual adjustments. This ensures accurate session display regardless of the user’s local time.

Session-Conditioned Regime ATRWhy this exists
Classic ATR is great—until the open. The first few bars often inherit overnight gaps and 24-hour noise that have nothing to do with the intraday regime you actually trade. That inflates early ATR, scrambles thresholds, and invites hyper-recency bias (“today is crazy!”) when it’s just the open being the open.
This tool was built to:
Separate session reality from 24h noise. Measure volatility only inside your defined session (e.g., NYSE 09:30–16:00 ET).
Judge candles against the current regime, not the last 2–3 bars. A rolling statistic from the last N completed sessions defines what “typical” means right now.
Label “large” and “small” objectively. Bars are colored only when True Range meaningfully departs from the session regime—no gut feel, no open-bar distortion (gap inclusion optional).
Overview
Purpose: objectively identify unusually big or small candles within the active trading session, compared to the recent session regime.
Use cases: volatility filters, entry/exit confirmation, session bias detection, adaptive sizing.
This indicator replaces generic ATR with a session-conditioned, regime-aware measure. It colors candles only when their True Range (TR) is abnormally large/small versus the last N completed sessions of the same session window.
How it works
Session gating: Only bars inside the selected session are evaluated (presets for NYSE, CME RTH, FX NY; custom supported).
Per-bar TR: TR = max(high, prevRef) − min(low, prevRef).
prevRef is the prior close for in-session bars.
First bar of the session can include the overnight gap (optional; default off).
Regime statistic: For any bar in session k, aggregate all in-session TRs from the previous N completed sessions (k−N … k−1), then compute Median (default) or Mean.
Today’s anchor: Running statistic from today’s session start → current bar (for context and the on-chart ratio).
Color logic:
Big if TR ≥ bigMult × RegimeStat
Small if TR ≤ smallMult × RegimeStat
Colored states: big bull, big bear, small bull, small bear.
Non-triggering bars retain the chart’s native colors.
Panel (top-right by default)
Regime ATR (Nd): session-conditioned statistic over the past N completed sessions.
Today ATR (anchored): running statistic for the current session.
Ratio (Today/Regime): intraday volatility vs regime.
Sample size n: number of bars used in the regime calculation.
Inputs
Session Preset: NYSE (09:30–16:00 ET), CME RTH (08:30–15:00 CT), FX NY (08:00–17:00 ET), Custom (session + IANA timezone).
Regime Window: number of completed sessions (default 5).
Statistic: Median (robust) or Mean.
Include Open Gap: include overnight gap in the first in-session bar’s TR (default off).
Big/Small thresholds: multipliers relative to RegimeStat (defaults: Big=1.5×, Small=0.67×).
Colors: four independent colors for big/small × bull/bear.
Panel position & text size.
Hidden outputs: expose RegimeStat, TodayStat, Ratio, and Z-score to other scripts.
Alerts
RegimeATR: BIG bar — triggers when a bar meets the “Big” condition.
RegimeATR: SMALL bar — triggers when a bar meets the “Small” condition.
Hidden outputs (for strategies/screeners)
RegimeATR_stat, TodayATR_stat, Today_vs_Regime_Ratio, BarTR_Zscore.
Notes & limitations
No look-ahead: calculations only use information available up to that bar. Historical colors reflect what would have been known then.
Warm-up: colors begin once there are at least N completed sessions; before that, regime is undefined by design.
Changing inputs (session window, multipliers, median/mean, gap toggle) recomputes the full series using the same rolling regime logic per bar.
Designed for standard candles. Styling respects existing chart colors when no condition triggers.
Practical tips
For a broader or tighter notion of “unusual,” adjust Big/Small multipliers.
Prefer Median in markets prone to outliers; use Mean if you want Z-score alignment with the panel’s regime mean/std.
Use the Ratio readout to spot compression/expansion days quickly (e.g., <0.7× = compressed session, >1.3× = expanded).
Roadmap
More session presets:
24h continuous (crypto, index CFDs).
23h/Globex futures (CME ETH with a 60-minute maintenance break).
Regional equities (LSE, Xetra, TSE), Asia/Europe/NY overlaps for FX.
Half-day/holiday templates and dynamic calendars.
Multi-regime comparison: track multiple overlapping regimes (e.g., RTH vs ETH for futures) and show separate stats/ratios.
Robust stats options: trimmed mean, MAD/Huber alternatives; optional percentile thresholds instead of fixed multipliers.
Subpanel visuals: rolling TodayATR and Ratio plots; optional Z-score ribbon.
Screener/strategy hooks: export boolean series for BIG/SMALL, plus a lightweight strategy template for backtesting entries/exits conditioned on regime volatility.
Performance/QOL: per-symbol presets, smarter warm-up, and finer control over sample caps for ultra-low TF charts.
Changelog
v0.9b (Beta)
Session presets (NYSE/CME RTH/FX NY/Custom) with timezone handling.
Panel enhancements: ratio + sample size n.
Four-state bar coloring (big/small × bull/bear).
Alerts for BIG/SMALL bars.
Hidden Z-score stream for downstream use.
Gap-in-TR toggle for the first in-session bar.
Disclaimer
For educational purposes only. Not investment advice. Validate thresholds and session settings across symbols/timeframes before live use.

Session Range (Pips/Points) Marcos Trader## English Description
Title: Session Range Indicator (Pips/Points)
Summary:
This indicator calculates and displays the price range (high - low) for the Asian, London, and New York trading sessions directly on your chart. It helps you quickly visualize the volatility of each recent session, showing the result in whole Pips for Forex or in Points for other instruments.
Key Features:
Calculates the High-Low range for the Asia, London, & NY sessions.
Displays the range in whole Pips for Forex (automatically detects JPY pairs for correct calculation).
Displays the range in Points (based on syminfo.mintick) for Indices, Crypto, Commodities, Stocks, etc.
100% Configurable Session Times: Define the exact start time, end time, and most importantly, the Time Zone for each session (Asia, London, NY) in the indicator settings. This ensures accuracy regardless of Daylight Saving Time or your chart's timezone!
Shows clear labels with the range near the end of each calculated session.
Options to individually show or hide the labels for each session.
Allows configuration of label transparency.
Allows defining how many past session labels to display on the chart (default is 5).
Developed in Pine Script v6.
How to Use:
Add the indicator to your chart.
Open the indicator Settings (gear icon).
Go to the "Session Times" section.
For each session (Asia, London, NY), enter the schedule in HHMM-HHMM format and ensure you add the correct Time Zone using a colon followed by the standard name (e.g., :Europe/London, :America/New_York, :Asia/Tokyo, :UTC+2, :UTC-5). This step is crucial.
Adjust the display options under "Show Sessions" and "Appearance" according to your preferences.
Click "OK".
Notes:
The accuracy of the indicator critically depends on the correct configuration of the times and time zones in the settings. The range label appears near the last bar belonging to the defined session.
Session RangeThis Pine Script™ code is subject to the terms of the Mozilla Public License 2.0 at mozilla.org
This script plots the high and low price ranges for up to four customizable trading sessions directly on your chart. It is designed to help traders visualize price activity during specific trading hours.
Features
Customizable Sessions: Define up to four distinct trading sessions using the input.session parameter.
Visual Highlights: Each session range is highlighted with customizable colors for top and bottom lines as well as a fill between them.
Historical Ranges: Option to show historical session ranges with adjustable opacity.
Toggle Sessions: Enable or disable the display of specific trading sessions to tailor your analysis.
Overlay on Chart: The script works as an overlay, ensuring your analysis stays on the main chart.
How It Works:
Session Setup: Input the start and end times for each session in the Session 1, Session 2, Session 3, and Session 4 fields.
Dynamic Range Calculation: The script automatically calculates the high and low during active sessions, updating the range as new data comes in.
Customizable Colors: Adjust the colors for lines, fills, and historical ranges to match your charting style.
Clean Presentation: The script is designed to avoid clutter by limiting overlays to active and relevant sessions only.
Identify price action trends during key trading hours.
Compare ranges between multiple sessions for market behavior analysis.
Highlight significant session overlaps or range extensions.
Disclaimer :
This script is intended for educational purposes and should not be considered financial advice. Trading involves risks, and past performance does not guarantee future results.

Sessions ny vizScript Purpose
This indicator draws a colored background during the New York trading session. It's useful for traders who want to have a visual overview of when the American (NY) trading session is active.
Main Features
NY Session Visualization - draws a gray bar in the background of the chart during NY trading hours (15:00-19:00 CET)
Customization - allows users to:
Set custom session time range
Adjust background color and transparency
Limit display to only the last 24 hours
Input Parameters
sessionRange - session time range (default 15:00-19:00 CET)
sessionColour - background color (default gray with 90% transparency)
onlyLast24Hours - toggle for showing only the last 24 hours (default false)
Technical Details
Script is written in Pine Script version 5
Uses UNIX timestamp for time period calculations
Runs as an overlay indicator (overlay=true), meaning it displays directly on the price chart
Uses the bgcolor() function for background rendering
Contains logic to check if current time is within defined session
Usage
This indicator is useful for:
Monitoring active NY trading session hours
Planning trades during the most liquid hours of the US market
Visual orientation in the chart during different trading sessions

Session Filter [Trendoscope]🎲 Session Filter: A Customisable Trading Indicator for Defining Preferred Trade Sessions
Session Filter is a simple trading indicator that enables traders to define their preferred trading sessions and optimise their approach based on individual preferences. By providing a range of flexible customisation options, Session Filter can help traders reduce risk, increase accuracy, by helping them to adhere to their trading sessions. Features include
🎯 Customisable Trading Sessions
One of the key features of Session Filter is the ability to select from four different trading sessions. These sessions are designed to be flexible, making it easy to tailor your approach to specific markets, assets, and trading styles. By selecting the sessions that are most relevant to your strategy, you can reduce the risk of making trades during less favourable market conditions.
For example, if you prefer to trade during the Asian session, you can set the session times to "Asian Session" in input settings. This will highlight the specific times when the Asian markets are open, allowing you to focus your trading activity during these periods. By doing so, you can avoid trading during times when the market is less active or more volatile.
🎯 Customisable Timezone and Days of the Week:
In addition to customisable trading sessions, Session Filter also allows users to select a timezone and specific days of the week. This ensures that the displayed trading zones and signals are aligned with your local time, and that you can tailor your approach to your preferred schedule. This is particularly useful for traders who have other commitments, or who prefer to focus on specific markets or assets on certain days.
For example, if you are based in New York and prefer to trade during the European session, you can select the "European Session" option in Session Filter and adjust the timezone to reflect your local time. You can also select specific days of the week when you prefer to trade during the European session, such as Tuesday through Thursday. This allows you to optimize your approach based on your personal preferences and schedule.
🎯 Easy Visual Interpretation:
Session Filter uses green and red overlays on the chart to indicate the trading zones, making it easy for users to visually identify their trading sessions
For example, when a green overlay is displayed on the chart, this indicates that the market is within the selected trading session and that it may be a good time to start trade. Conversely, when a red overlay is displayed, this indicates that the market is outside of the selected trading session and that it may be a good time close all trading. By providing this visual feedback, Session Filter helps traders stay focused and disciplined, and avoid making impulsive trading decisions.
🎯Force Exit Signal for Risk Management:
Session Filter also offers the ability to generate a force exit signal when not in any of the selected sessions. This can be used in conjunction with alerts to exit all trades outsize session zone.
For example, if you are using Session Filter to trade during the European session, but the market is particularly volatile during a specific day, the force exit signal will be generated to indicate that it may be a good time to exit your trade. This helps you avoid potential losses and stay disciplined during periods of market turbulence.
🎯External Signal Plots:
In addition to the chart overlays, Session Filter also plots signals on the data window that can be used as external inputs in other indicators and strategies. This feature allows traders to incorporate the signals generated by Session Filter into their existing trading systems and this can be used as additional filters on an existing strategy or methodology.
🎯Alerts using Alert Conditions
Alerts are provided for start and end of session so that users can make use of it to set auto turn on or off their bots.
Settings are pretty simple and are explained here.

Session Trader - Optimal Hours📊 Overview
Never miss the best trading hours again! This indicator provides a comprehensive, real-time session tracker that shows you EXACTLY when to trade crypto and when to stay out of the market. Automatically converts all times to your local timezone, highlights the current active session, and shows what's coming next.
Perfect for crypto traders who want to maximize profits by trading during high-liquidity, high-volume sessions while avoiding choppy, low-liquidity periods that lead to losses.
✨ Key Features
🎯 Real-Time Session Tracking
LIVE indicator shows which session is currently active with bright highlighting
NEXT UP feature highlights the upcoming session when between trading periods
Smart header displays current status at a glance
Real-time countdown timers for every session (opens/closes)
📍 6 Critical Trading Sessions Covered
✅ BEST TRADING SESSIONS (Green):
London Open (07:00-09:00 UTC) - High volatility kickoff, institutional orders
London-NY Overlap (13:30-15:30 UTC) - THE BEST period! Maximum liquidity & volume
NY Momentum (15:30-18:00 UTC) - Strong trending moves, continuation plays
❌ AVOID TRADING SESSIONS (Red):
4. Pre-Asia Quiet (21:00-00:00 UTC) - Low liquidity, erratic moves, wide spreads
5. Asia Lunch (03:30-05:00 UTC) - Choppy markets, whipsaws, unreliable patterns
6. Post-US Drift (20:00-21:00 UTC) - Market slows, unpredictable behavior
🌍 Automatic Timezone Conversion
Times display in YOUR chart timezone - no manual conversion needed!
Works in Berlin, New York, Tokyo, Sydney, or anywhere in the world
Switch between 12-hour and 24-hour formats
🎨 Visual Clarity
Active TRADE sessions = Bright green background, impossible to miss
Active AVOID sessions = Bright red background, clear warning
NEXT UP session = Orange highlight when between sessions
Inactive sessions = Faded gray, stays out of your way
Color-coded status column with clear ✓ TRADE or ✗ AVOID indicators
⚙️ Fully Customizable
9 table positions (top-left, top-right, bottom-center, etc.)
6 text sizes (tiny to huge) for any screen size
Toggle individual sessions on/off
Show/hide descriptions for cleaner view
Custom colors for each session type
Countdown timer toggle
🔔 Built-In Alerts
Automatic alerts when TRADE sessions start
Alerts when AVOID sessions begin (so you don't enter bad conditions)
Customizable per session
📖 How To Use
Basic Setup:
Add indicator to any crypto chart (BTC, ETH, etc.)
Times automatically convert to your chart's timezone
Watch the header - shows current session or next upcoming
Look for bright colors:
🟢 Bright green = TRADE NOW
🔴 Bright red = AVOID NOW
🟠 Orange = NEXT UP (coming soon)
Trading Strategy:
Focus on GREEN sessions (London Open, London-NY Overlap, NY Momentum)
Avoid RED sessions (Pre-Asia Quiet, Asia Lunch, Post-US Drift)
Prepare for ORANGE sessions (next up - get ready!)
Use countdown timers to plan entries/exits perfectly
Pro Tips:
London-NY Overlap is the BEST - highest volume, tightest spreads, cleanest trends
First 30 minutes of London can have quick reversals - use caution
NY Momentum is perfect for riding trends with trailing stops
NEVER trade during Asia Lunch - choppy, unpredictable, costs you money
Post-US Drift looks tempting but often leads to whipsaws
🔧 Indicator Settings
Display Options:
Table Position: Choose from 9 positions on your chart
Text Size: Auto, Tiny, Small, Normal, Large, Huge
Time Format: 12-hour (AM/PM) or 24-hour format
Show Countdown: Toggle real-time countdown timers
Show Description: Toggle detailed session descriptions
Highlight Next Session: Orange highlight for upcoming session
Session Toggles:
Enable/disable any of the 6 sessions individually:
London Open
London-NY Overlap
NY Momentum
Pre-Asia Quiet
Asia Lunch
Post-US Drift
Color Customization:
Active TRADE session color (default: bright green)
Active AVOID session color (default: bright red)
NEXT UP session color (default: orange)
Inactive session color (default: faded gray)
Alerts:
Individual alert toggles for each session
Alerts fire when sessions start (not every bar)
Includes context in alert message
📊 Session Details
🟢 London Open (07:00-09:00 UTC)
Status: TRADE ✓
Characteristics:
London opens with high volatility as European traders enter
Major institutional orders create significant price movements
Perfect for breakout and trend-following strategies
Watch for quick reversals in first 30 minutes
Good liquidity and volume
🟢 London-NY Overlap (13:30-15:30 UTC)
Status: TRADE ✓
THE BEST TRADING PERIOD!
Maximum liquidity as London & NY markets overlap
Institutional volume peaks, creating clean trends
Reliable technical setups, tightest spreads
Best execution quality
Focus on momentum and breakout trades
🟢 NY Momentum (15:30-18:00 UTC)
Status: TRADE ✓
Characteristics:
Strong directional moves as US market dominates
Trending behavior ideal for position trades
Continuation patterns highly reliable
Major news impact is highest during this period
Use trailing stops to ride trends effectively
🔴 Pre-Asia Quiet (21:00-00:00 UTC)
Status: AVOID ✗
WARNING:
Pre-Asian session with minimal liquidity
Thin order books cause erratic price action
Fake breakouts and stop-hunting common
Wide spreads increase trading costs
High risk, low reward - wait for better conditions
🔴 Asia Lunch (03:30-05:00 UTC)
Status: AVOID ✗
WARNING:
Asian lunch break creates choppy, directionless markets
Low volume leads to whipsaws and false signals
Market makers widen spreads significantly
Technical patterns unreliable
Not worth the risk - take a break!
🔴 Post-US Drift (20:00-21:00 UTC)
Status: AVOID ✗
WARNING:
Post-US session as major markets close
Liquidity dries up, causing unpredictable moves
High slippage risk
Market enters consolidation before Asian open
Better to wait for next quality session
🎯 Who Is This For?
Perfect for:
✅ Crypto day traders who want to maximize profits by timing the markets
✅ Scalpers who need high liquidity and tight spreads
✅ Swing traders who want to enter during optimal conditions
✅ Beginners who need clear guidance on when to trade
✅ Anyone tired of choppy sessions that eat away profits
Ideal Markets:
Bitcoin (BTC/USD, BTC/USDT)
Ethereum (ETH/USD, ETH/USDT)
Major altcoins (SOL, XRP, ADA, etc.)
Any 24/7 crypto market
💡 Why Session Timing Matters
Trading crypto during low-liquidity sessions is one of the biggest mistakes traders make:
❌ Trading during bad sessions causes:
Wider spreads (higher costs per trade)
Choppy, unpredictable price action
Fake breakouts and stop-hunting
Poor trade execution and slippage
Emotional frustration and overtrading
✅ Trading during optimal sessions gives you:
Tight spreads (lower costs)
Clean, trending price action
Reliable technical patterns
Better execution quality
Higher win rates and confidence
The difference between a profitable trader and a losing trader is often WHEN they trade, not HOW they trade.
🚀 Technical Details
Version: Pine Script v6
Type: Overlay indicator (table display)
Repainting: Non-repainting (all times are fixed to session schedules)
Updates: Real-time on every bar
Performance: Lightweight, no lag
Compatibility: Works on any timeframe (1m to 1D+)
📈 Best Practices
Plan your trading schedule around GREEN sessions
Set alerts for session starts so you never miss opportunities
Use the countdown to prepare entries/exits in advance
Combine with your strategy - this indicator tells you WHEN, your strategy tells you WHAT
Respect the RED sessions - discipline is profit
Keep descriptions ON when learning, turn OFF for cleaner charts later
🔄 Updates & Support
This indicator is actively maintained. Future updates may include:
Session volume statistics
Historical session performance tracking
Additional regional sessions
More customization options

Session First 5-Min High/LowHere's a professional description for your indicator:
Session First 5-Min High/Low Marker
This indicator automatically identifies and marks the high and low price levels established during the first 5 minutes of major trading sessions, helping traders identify key intraday support and resistance zones.
Key Features:
Tracks three major trading sessions in IST (Indian Standard Time):
Asian Session: 5:30 AM - 5:35 AM
London Session: 12:30 PM - 12:35 PM
New York Session: 5:30 PM - 5:35 PM
Draws horizontal lines at the highest and lowest prices reached during each session's opening 5-minute window
Color-coded for easy identification (Yellow for Asian, Blue for London, Red for New York)
Lines extend across the chart to help track price reactions throughout the day
Clean, minimal design with optional labels
Best Used For:
Identifying key intraday support and resistance levels
Session breakout trading strategies
Understanding institutional order flow at market opens
Works on 1-minute timeframe for precise tracking
Customizable Settings:
Toggle line extensions on/off
Adjust line width (1-5)
Change colors for each session
Show/hide session labels
Perfect for day traders and scalpers who trade around major session openings and want to identify high-probability support/resistance zones established during peak liquidity periods.
This description explains what the indicator does, its practical applications, and its key features in a way that's clear for TradingView users.RetryClaude can make mistakes. Please double-check responses.

Session Liquidity LevelsDescription:
Overview This indicator is designed for the precision trader who values a clean, professional chart aesthetic. It automatically tracks and plots the Highs and Lows of the three major trading sessions: New York, London, and Tokyo (Asia).
Unlike standard indicators that clutter the screen, this script focuses on "Visual Silence." The lines and labels extend dynamically to the current price action, keeping your historical chart clean while ensuring key liquidity levels are always visible on the hard right edge of your screen.
Key Features
🎯 Precision Anchoring: The lines originate exactly from the specific candle wick that formed the High or Low. No floating lines; exact price reference only.
✨ Smart Floating Labels: Labels are positioned to the right of the current price (using an "Extender" offset). They do not obscure the candles and feature a transparent background for a modern, minimal look.
🛠️ Fully Customizable Names: You have total control over the text. Rename "NY High" to "NY H", "Liquidity", or anything that fits your strategy.
🎨 Styling Freedom: Customize line styles (Solid, Dotted, Dashed), colors, and thickness for each session independently.
⚡ Independent Logic: Each session operates on its own "State Machine." Changing the time for New York will never break or displace the levels for London or Asia.
How it Works
Time Detection: The indicator detects the start of a user-defined session.
Real-Time Tracking: As the session progresses, it updates the High/Low in real-time.
State Freezing: Once the session ends, the High and Low levels are "frozen" and extended to the right, serving as key Support/Resistance or Liquidity targets for the rest of the trading day.
Settings & Inputs
New York (NY): Hardcoded to America/New_York timezone for accuracy. Customize Time, Color, Style, and Labels.
Asia / London: Customizable Time, Color, Style, and Labels.
Visual General:
Extender: Controls how far the labels float from the current price bar.
Show Names: Toggle text labels on/off.
Use Case Ideal for ICT concepts, Smart Money Concepts (SMC), Breakout strategies, or any system that relies on previous session liquidity sweeps.

Session Highs and LowsThis indicator highlights the New York, London, and Asian trading sessions — plotting each session’s highs and lows directly on your chart to help visualize intraday ranges and liquidity levels.
⸻
✨ Features
• Session Range Visualization
Automatically marks the high and low of each trading session with colored lines.
This makes it easy to identify where price expanded, consolidated, or built liquidity during each market phase.
• Session Background Zones (Optional)
Toggle background fills to highlight active sessions for clearer visual separation of NY, London, and Asian trading hours.
• Customizable Settings
• Enable or disable each session independently
• Adjust session times and colors
• Choose whether to fill session backgrounds
• Timezone Aware
All sessions are aligned to New York time by default, ensuring consistent mapping across instruments.
⸻
🎯 Use Case
A perfect tool for traders who track session-based liquidity, breaks of structure, or session-to-session continuity.
Quickly spot the Asian range, London expansion, and New York reversal windows — key components in intraday strategy development.
⸻
⚙️ Inputs
• Toggle sessions: NY / London / Asian
• Background fill on/off
• Label color customization
• Adjustable session times
⸻
📈 Why Use It
Understanding where each session establishes its range high and low provides critical context for liquidity grabs, session overlaps, and structural shifts throughout the day.
This simple yet powerful visual map enhances precision for ICT-style, smart money, or price action-based trading models.

Sessions RangeThis script clearly displays the price ranges (High–Low) of the main sessions—Sydney, Tokyo, London, and New York—with boxes on the chart and marked levels. Level labels can display price and date (or day of the week) in the time zone of your choice (GMT).
Main Features
Boxes by session: Visually highlight the range for each session.
High/Low levels: Lines at the session extremes, with configurable length.
Smart labels: If you choose to show "on the right," only active (unmitigated) levels track the price; when mitigated, they return to their starting point, keeping the chart clean.
Flexible date: Choose between day of the month (with time) or day of the week.
Alerts (optional): Notification when a level is broken.
Notes
The time zone displayed on the labels follows the chosen GMT, regardless of the chart time zone.
You can choose to extend levels until they are mitigated or beyond, depending on your reading.
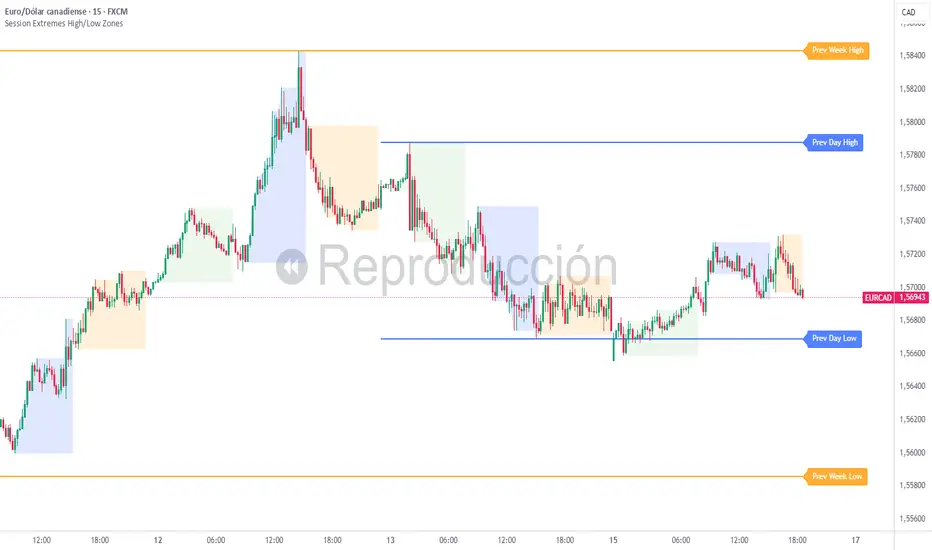
Session Extremes High/Low ZonesThis indicator highlights the High and Low of the three main trading sessions: Asia, London, and New York, based on configurable time ranges and UTC offset.
It also displays the previous day's and previous week's High and Low as dynamic lines with labels for reference.
🛠️ Features:
Customizable session times (HHMM-HHMM format)
Adjustable UTC offset for correct timezone alignment
Styling options for line colors, widths, styles and transparency
Optional session range shading
🔎 Ideal for traders who use intraday support/resistance levels or want to visualize volatility zones during different sessions.
Built with Pine Script v5. No alerts or trading signals included.
This script is intended for educational and informational purposes only.
Session Markers - JDK AnalysisSession Markers is a tool designed to study how markets behave during specific, recurring time windows. Many traders know that price behaves differently depending on the day of the week, the time of the day, or particular market sessions such as the weekly open, the London session, or the New York open. This indicator makes those recurring windows visible on the chart and then analyzes what price typically does inside them. The result is a clear statistical understanding of how a chosen session behaves, both in direction and in strength.
The script works by allowing the trader to define any time window using a start day and time and an end day and time. Every time this window occurs on the chart, the indicator highlights it with a full-height vertical band. These visual markers reveal patterns that are otherwise difficult to detect manually, such as whether certain sessions tend to trend, reverse, consolidate, or create large imbalances. They also help the trader quickly scan through historical price action to see how the market has behaved under similar conditions.
For every completed session window, the indicator measures how much price changed from the moment the window began to the moment it ended. Instead of using raw price differences, it converts these changes into percentage moves. This makes the measurement consistent across different price ranges and market regimes. A one-percent move always has the same meaning, whether the asset is trading at 100 or 50,000. These percentage moves are collected for a user-selected number of past sessions, creating a dataset of how the market has behaved in the chosen time window.
Based on this dataset, the indicator generates several statistics. It counts how many past sessions closed higher and how many closed lower, producing a directional tendency. It also computes the probability of an upward session by dividing the number of positive sessions by the total. More importantly, it calculates the average percentage movement for all sessions in the lookback period. This average move reflects not just the direction but also the magnitude of price changes. A session with frequent small upward moves but occasional large downward moves will show a negative average movement, even if more sessions ended positive. This creates a more realistic representation of true market behavior.
Using this average movement, the script determines a “Bias” for the session. If the average percentage move is positive, the bias is considered bullish. If it is negative, the bias is bearish. If the values are very close to zero, the bias is neutral. This way, the indicator takes both frequency and impact into account, producing a magnitude-aware assessment instead of one that only counts wins and losses. A sequence such as +5%, –1% results in a bullish bias because the overall impact is strongly positive. On the other hand, a series of small gains followed by a large drop produces a bearish bias even if more sessions ended positive, because the large move dominates the average. This provides a far more truthful picture of what the market tends to do during the chosen window.
All relevant statistics are displayed neatly in a small panel in the top-right corner of the chart. The panel updates in real time as new sessions complete and older ones fall out of the lookback range. It shows how many sessions were analyzed, how many ended up or down, the probability of an upward move, the average percentage change, and the final bias. The background color of the panel instantly reflects that bias, making it easy to interpret at a glance.
To use the tool effectively, the trader simply needs to define a time window of interest. This could be something like the weekly opening window from Sunday to Monday, the London open each day, or even a unique custom window. After selecting how many past sessions to analyze, the indicator takes care of the rest. The vertical session markers reveal the structure visually. The statistics summarize the historical behavior objectively. The magnitude-weighted bias provides a realistic indication of whether the window tends to produce upward or downward movement on average.
Session Markers is helpful because it translates repeated market timing behavior into measurable data. It exposes hidden tendencies that are easy to feel intuitively but hard to quantify manually. By analyzing both direction and magnitude, it prevents misleading interpretations that can arise from looking only at win rates. It helps traders understand whether a session typically produces meaningful moves or just small noise, whether it tends to trend or reverse, and whether its behavior has recently changed. Whether used for bias building, session filtering, or deeper market research, it offers a structured framework for understanding the market through time-based patterns.

Session Range Boxes GR v2.1This indicator draws intraday range boxes for the main Forex sessions based on Europe/Budapest time (CET/CEST).
Tracked sessions (Budapest time):
Asia: 01:00 – 08:00
Frankfurt (pre-London): 08:00 – 09:00
London: 09:00 – 18:00
New York: 14:30 – 23:00
For each session, the script:
Detects the session start and session end using the current chart timeframe and the Europe/Budapest time zone.
Tracks the high and low of price during the session.
Draws a colored box from session open to session close, covering the full price range between the session high and low.
Draws a white midline inside every box at the midpoint between the session high and low (and keeps it visible for all past sessions).
Optionally plots a small label (“Asia”, “Fra”, “London”, “NY”) above the first bar of each session.
Color scheme:
Asia: soft orange box
Frankfurt: light aqua box
London: darker blue box
New York: light lime box
Use this tool to:
Quickly see which session created the high or low of the day,
Highlight important liquidity zones and prior session ranges that price may revisit,
Visually separate Asia, Frankfurt, London and New York volatility profiles on intraday charts.
Optimized for intraday trading (Forex / indices), but it works on any symbol where session behavior and time-of-day structure matter.

Session ParmezanForex Session Range Boxes (Asia, Europe, US) — visual intraday session tracker for Forex and metals.
This indicator automatically marks the three major Forex trading sessions — Asian (Tokyo), European (London), and American (New York) — directly on your chart using dynamic colored boxes.
Each box represents the full price range (High–Low) formed during that session, helping traders visualize how volatility and liquidity evolve across the global trading day.
The script is built for intraday traders and session-based strategies, especially those who monitor breakouts from the Asian range or reactions during London–New York overlaps.
⚙️ Features
• Accurate session timing (UTC+3 / Moscow Time) — Asia: 03:00–12:00, Europe: 11:00–20:00, US: 16:00–01:00.
• Dynamic range boxes: each box expands in real time as new highs and lows are set during the session.
• Clear visual separation: each session is shown in its own color (blue for Asia, orange for Europe, green for US).
• Automatic daily reset — new boxes start every new session.
• Intraday focus only — visible up to the 1-hour timeframe (M1–H1) for clarity.
• Transparent design — semi-transparent fills keep candles readable even when sessions overlap.
• Lightweight performance — optimized use of box.new() and var variables avoids lag on lower timeframes.
🧭 Typical Use-Cases
• Identify Asian session ranges and watch for London breakouts or New York reversals.
• Visually align your intraday strategy with session volatility cycles.
• Combine with VWAP, liquidity zones, or market profile indicators for deeper confluence.
• Spot overlapping sessions — often the most active periods of the day.

Session Range Control [PointAlgo]Session Range Control (SRC)
The Session Range Control (SRC) indicator provides a structured view of intraday price behavior by tracking where the current price sits within the session’s high–low range and how today’s volatility compares to the Average Daily Range (ADR). It combines range analytics, momentum context, volatility interpretation, and visual cues to help traders understand session strength and shifts in intraday conditions.
Core Concept
Every trading session forms a unique high and low. SRC continuously reads these values and calculates the Position in Range, expressed on a scale from 0% to 100%:
0% → Price at Day Low
100% → Price at Day High
50% → Mid-range equilibrium
By normalizing price into a percentage, traders can quickly interpret where market pressure is concentrated during the session.
Trend Zones and Market State
SRC divides the range into logical zones to show the likely sentiment of the session:
1. Strong Uptrend Zone (Above Threshold)
When price consistently holds above the user-defined upper threshold (e.g., 60%), the indicator marks a Strong Uptrend.
This typically reflects:
Persistent intraday buying pressure
Price acceptance near the upper part of the range
Reduced likelihood of deep pullbacks
2. Strong Downtrend Zone (Below Threshold)
When price remains below the lower threshold (e.g., 40%), SRC signals a Strong Downtrend, indicating:
Dominant intraday selling
Consistent pressure keeping price near session lows
3. Bullish / Bearish Zones
Between the midline and strong thresholds, SRC displays softer trend zones:
Above 50% = Bullish Zone
Below 50% = Bearish Zone
These zones help classify whether price is trending, balanced, or drifting.
4. Neutral Territory
When price hovers around the mid-level without conviction, the indicator treats it as a neutral or undecided phase.
Signal Logic :
SRC includes built-in momentum shift signals based on range transitions:
Long Signal
Triggered when price crosses upward through 50%, often showing:
A shift from intraday weakness to strength
Buyers gaining control of the session
Short Signal
Triggered when price crosses downward through 50%, suggesting:
Loss of intraday strength
Sellers taking control
These signals help highlight potential turning points inside the session.
Extreme Levels :
SRC highlights the top and bottom 10% of the range:
> 90% = Extreme High (Overbought intraday condition)
< 10% = Extreme Low (Oversold intraday condition)
These conditions can be useful for identifying overextended movements or potential reaction zones.
ADR Comparison and Volatility Context :
The indicator also measures how today’s price range compares to the Average Daily Range (ADR):
Range Expanding: Today’s range is significantly larger than the ADR
Indicates heightened volatility
Often associated with trending or breakout environments
Range Compressing: Today’s range is much smaller
Suggests low volatility
Common before breakout phases
Characteristic of consolidation or balanced markets
This volatility context helps traders assess whether the session is behaving within normal boundaries or deviating significantly.
Dashboard Overview :
When enabled, the dashboard summarizes key intraday metrics in a structured table:
Trend status (Strong Uptrend, Strong Downtrend, Bullish, Bearish, Neutral)
Range position (%)
Signal status (Long Cross, Short Cross, Extreme High/Low, or None)
Day range calculation
Range vs ADR (%)
Day High / Day Low
Current price level
Simplified action label based on current conditions
This provides a quick reference system to interpret both trend and volatility at a glance without analyzing the full chart visually.
Visual Elements
SRC includes:
Colored dynamic plot for easy trend recognition
Horizontal reference lines at key levels (0%, 50%, 100%, strong-trend thresholds)
Background shading during extreme zone conditions
A separate ADR comparison plot
These visuals ensure the indicator remains intuitive regardless of chart style or timeframe.
Alerts
The script includes alert conditions for:
Long cross
Short cross
Strong trend detection
Extreme high / extreme low
These allow users to automate notifications during key market events without manually monitoring the chart.
Customization Options
Users can configure:
ADR length
Strong trend thresholds
Dashboard visibility
Dashboard position on chart
This makes SRC adaptable to different trading instruments and intraday styles.
Usage Notes
Works best on intraday timeframes where session boundaries are clearly defined.
Designed for analytical interpretation—trend bias, volatility phase, and range structure.
Can complement other tools such as moving averages, volume, or market structure analysis.
Disclaimer :
This indicator is intended for chart analysis and educational purposes only.
It does not generate financial, investment, or trading advice.
Users should validate signals with additional research and apply proper risk management.

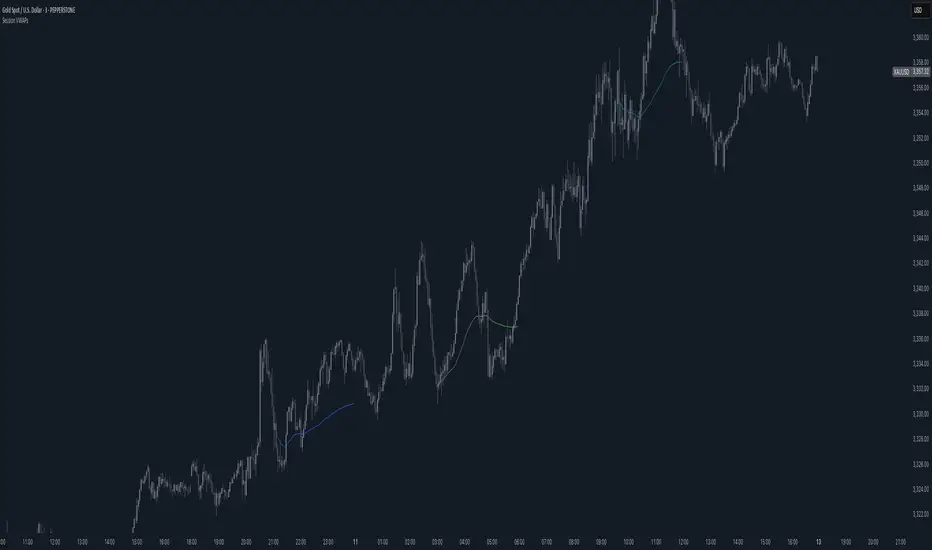
Session VWAPsThis indicator plots volume-weighted average price (VWAP) lines for three major trading sessions: Tokyo, London, and New York. Each VWAP resets at the start of its session and tracks the average price weighted by volume during that window. You can choose the exact session times, turn individual sessions on or off, and optionally extend each VWAP line until the end of the trading day.
It’s designed to give you a clear view of how price is behaving relative to session-specific value areas. This can help in identifying session overlaps, shifts in price control, or whether price is holding above or below a particular session’s average. The indicator supports futures-style day rollovers and works across markets.
Sessions [LuxAlgo & TrendRiderIO]Visualize and track trading sessions with customizable ranges, VWAP bands, and high/low levels. Enhanced version of LuxAlgo's Sessions indicator.
Track up to 3 customizable trading sessions (NY, London, Tokyo) with session range boxes, session-specific anchored VWAP with standard deviation bands, and high/low extension lines for the last 3 completed sessions. Includes peak hours visualization, session overlap highlighting, and breach alerts with direction indication.
Perfect for identifying key support/resistance levels, analyzing session strength, finding entry/exit points, and breakout trading.
License: CC BY-NC-SA 4.0 | Based on work by @LuxAlgo, enhanced by TrendRiderIO.

Session Relative VolumeSession Relative Volume is an advanced intraday futures volume indicator that analyzes volume separately for Asia, London, and New York sessions - something standard relative volume tools can’t do.
Instead of aggregating the entire day’s volume, the indicator compares current volume to historical averages for the same session and time of day, allowing you to spot true volume strength and meaningful spikes, especially around session opens.
Background
Relative volume helps traders spot unusual activity: high volume often signals institutional participation and trending days, while low volume suggests weak commitment and possible mean reversion. In futures markets, sessions ( Asia, London, New York ) must be analyzed separately, but TradingView’s Relative Volume in Time aggregates the entire day, masking session-specific behavior - especially during the New York open. Since volume can vary by more than 20× between sessions, standard averages struggle to identify meaningful volume spikes when trader conviction matters most.
Indicator Description
The “Session Relative Volume” indicator solves these problems by calculating historical average volume specific to each session and time of day, and comparing current volume against those benchmarks. It offers four display modes and fully customizable session times
Altogether, it provides traders with a powerful tool for analyzing intraday futures volume, helping to better assess market participation, trader conviction, and overall market conditions - ultimately supporting improved trading decisions.
Parameters
Mode – display mode:
R-VOL: Relative cumulative session-specific volume at time
VOL CUM: Cumulative session volume at time compared to historical average cumulative session-specific volume
VOL AVG: Average session intrabar volume at time compared to historical average session-specific intrabar volume
VOL: Individual bars volume, highlighting (solid color) unusual spikes
Lookback period – number of days used for calculating historical average session volume at time
MA Len – length of the moving average, representing average bar volume within a session based on previous periods (different from historical cumulative volume!). Used only in VOL and VOL AVG modes
MA Thresh – deviation from moving average, used to detect bar volume spikes (bar volume > K × moving average)
Start Time – End Time and Time Zone parameters for each session. The time zone must be set using TradingView’s format (e.g., GMT+1).

Session Highs & Lows Title:
Session Highs & Lows — Asia, London, New York + NY Open Line
Description:
This indicator automatically plots the session highs and lows for the three major trading sessions:
Asia (5 PM – 2 AM PT) – red rays
London (12 AM – 9 AM PT) – blue rays
Previous New York Session (6:30 AM – 1 PM PT) – brown rays
It also draws a thin dashed red line at 6:30 AM PT, marking the New York open.
The script dynamically updates each session’s range as price action unfolds, then locks it in when the session closes.
Lines extend to the right only (“rays”) so traders can easily identify liquidity zones, previous highs/lows, and intraday reaction points without cluttering the left side of the chart.
The logic uses TradingView’s session-time functions (time() windows) and resets automatically after each New York session ends, ensuring that only the current day’s structure is visible.
Unique features:
Works on any timeframe and any symbol (optimized for ES & NQ futures).
Separate colors for each session for clear visual distinction.
Session lines are “live” during the session and freeze once it closes.
Lightweight code with automatic cleanup — avoids line-count overflow.
Non-repainting and fully timezone-aware.
How to use:
Add the indicator to your chart and select your preferred timezone.
Watch how Asia and London session highs/lows guide liquidity during the New York session open (marked by the red dashed line).
Session Gap Fill [LuxAlgo]The Session Gap Fill tool detects and highlights filled and unfilled price gaps between regular sessions. It features a dashboard with key statistics about the detected gaps.
The tool is highly customizable, allowing users to filter by different types of gaps and customize how they are displayed on the chart.
🔶 USAGE
By default, the tool detects all price gaps between sessions. A price gap is defined as a difference between the opening price of one session and the closing price of the previous session. In this case, the tool uses the opening price of the first bar of the session against the closing price of the previous bar.
A bullish gap is detected when the session open price is higher than the last close, and a bearish gap is detected when the session open price is lower than the last close.
Gaps represent a change in market sentiment, a difference in what market participants think between the close of one trading session and the open of the next.
What is useful to traders is not the gap itself, but how the market reacts to it.
Unfilled gaps occur when prices do not return to the previous session's closing price.
Filled gaps occur when prices come back to the previous session's close price.
By analyzing how markets react to gaps, traders can understand market sentiment, whether different prices are accepted or rejected, and take advantage of this information to position themselves in favor of bullish or bearish market sentiment.
Next, we will cover the Gap Type Filter and Statistics Dashboard.
🔹 Gap Type Filter
Traders can choose from three options: display all gaps, display only overlapping gaps, or display only non-overlapping gaps. All gaps are displayed by default.
An overlapping gap is defined when the first bar of the session has any price in common with the previous bar. No overlapping gap is defined when the two bars do not share any price levels.
As we will see in the next section, there are clear differences in market behavior around these types of gaps.
🔹 Statistics Dashboard
The Statistics Dashboard displays key metrics that help traders understand market behavior around each type of gap.
Gaps: The percentage of bullish and bearish gaps.
Filled: The percentage of filled bullish and bearish gaps.
Reversed: The percentage of filled gaps that move in favor of the gap
Bars Avg.: The average number of bars for a gap to be filled.
Now, let's analyze the chart on the left of the image to understand those stats. These are the stats for all gaps, both overlapping and non-overlapping.
Of the total, bullish gaps represent 55%, and bearish ones represent 44%. The gap bias is pretty balanced in this market.
The second statistic, Filled, shows that 63% of gaps are filled, both bullish and bearish. Therefore, there is a higher probability that a gap will be filled than not.
The third statistic is reversed. This is the percentage of filled gaps where prices move in favor of the gap. This applies to filled bullish gaps when the close of the session is above the open, and to filled bearish gaps when the close of the session is below the open. In other words, first there is a gap, then it fills, and finally it reverses. As we can see in the chart, this only happens 35% of the time for bullish gaps and 29% of the time for bearish gaps.
The last statistic is Bars Avg., which is the average number of bars for a gap to be filled. On average, it takes between one and two bars for both bullish and bearish gaps. On average, gaps fill quickly.
As we can see on the chart, selecting different types of gaps yields different statistics and market behavior. For example, overlapping gaps have a greater than 90% chance of being filled, whereas non-overlapping gaps have a less than 40% chance.
🔶 SETTINGS
Gap Type: Select the type of gap to display.
🔹 Dashboard
Dashboard: Enable or disable the dashboard.
Position: Select the location of the dashboard.
Size: Select the dashboard size.
🔹 Style
Filled Bullish Gap: Enable or disable this gap and choose the color.
Filled Bearish Gap: Enable or disable this gap and choose the color.
Unfilled Gap: Enable or disable this gap and choose the color.
Max Deviation Level: Enable or disable this level and choose the color.
Open Price Level: Enable or disable this level and choose the color.
