Momentum-Based Buy/Sell SignalsBuy Signal:
Triggered when ROC > threshold and the MACD line crosses above the Signal line.
Sell Signal:
Triggered when ROC < threshold and the MACD line crosses below the Signal line.
Visual Elements:
Green labels with "Buy" are displayed below the bars for buy signals.
Red labels with "Sell" are displayed above the bars for sell signals.
The background turns green during a buy signal and red during a sell signal for better visual clarity.
Поиск скриптов по запросу "signal"

Bearish signal using Point of Control (POC) with PAC by guruThis indicator code helps traders identify potential sell opportunities using several important technical indicators:
Point of Control (POC) – This is the price level where the most volume was traded over the past several days.
Previous Day's Low – This shows the lowest price reached during the previous day.
PAC (Price Action Channel) EMA – These are two moving averages (one based on the low price and one based on the close price) that help determine if the price is trending within a certain range.
Volume SMA – This is a 3-day simple moving average (SMA) of volume, which helps filter out signals based on market activity.
What the Script Does:
Point of Control (POC):
The script looks at the last 50 days (configurable) and calculates which price level had the highest trading volume.
It then plots a red line on the chart at the POC level. This is important because it helps identify areas where there was strong market interest in the past.
Volume Moving Average:
The script calculates a 3-day SMA of volume, but it excludes the current day to avoid premature signals based on today’s trading.
The volume SMA is used to ensure there’s enough market activity (with a threshold set to 25 units) before triggering a sell signal.
Price Action Channel (PAC) EMA:
The PAC consists of two exponential moving averages (EMAs):
The PAC Low EMA: This is based on the low prices over the last 34 periods (configurable).
The PAC Close EMA: This is based on the closing prices over the last 34 periods.
These EMAs help determine if the price is trending above or below certain price levels.
Sell Signal Logic: The script checks three conditions before displaying a "Sell" signal:
Price Below POC and Previous Day’s Low:
The close price must be below both the Point of Control (POC) and the previous day's low.
Volume SMA Above 25:
The 3-day volume SMA must be greater than 25. This ensures the signal only triggers when there’s enough trading volume in the market.
Today’s Low is Above PAC EMAs:
Today's low price must be above both the PAC low EMA and the PAC close EMA. This prevents sell signals when prices are already significantly below the PAC, indicating possible exhaustion in the downtrend.
If all three conditions are met, the script will display a red "Sell" label on the chart, signaling a potential selling opportunity.
No Sell Signal if Price Reverses:
If the price crosses back above the POC or the previous day's low, the script will remove the sell signal and reset for a new opportunity.
Summary of Conditions:
For the script to display a "Sell" label:
The close price must be below the Point of Control (POC) and the previous day’s low.
The 3-day volume SMA (excluding today) must be greater than 25 units.
The low price of the current day must be above both the PAC low EMA and the PAC close EMA.
If these conditions are met, a red sell label appears on the chart as a potential signal for a short (sell) trade.

Demand and Supply Conditions with SignalsIntroduction:
This document outlines a trading strategy that utilizes price action analysis and color signals to make informed trading decisions. The strategy focuses on identifying demand and supply conditions, curve patterns, and generating signals based on historical price data. The colors associated with each condition and signal serve as visual indicators to assist in decision-making.
I. Strategy Overview:
Objective:
The objective of this trading strategy is to identify potential trading opportunities based on price action analysis and color signals.
Key Components:
Demand Condition: A green upward-facing triangle indicates a potential demand condition.
Supply Condition: A red downward-facing triangle indicates a potential supply condition.
Curve Pattern Condition: A blue upward-facing triangle indicates a potential curve pattern condition.
Signal Condition: A yellow upward-facing triangle indicates a potential buy signal.
II. Understanding the Colors:
* Green: Represents the demand condition, which suggests potential buying pressure in the market. A green upward-facing triangle is plotted on the chart when the demand condition is met at a specific candle or bar.
* Red: Represents the supply condition, which suggests potential selling pressure in the market. A red downward-facing triangle is plotted on the chart when the supply condition is met at a specific candle or bar.
* Blue: Represents the curve pattern condition, which suggests the presence of a specific pattern based on price action analysis. A blue upward-facing triangle is plotted on the chart when the curve pattern condition is met at a specific candle or bar.
* Yellow: Represents the signal condition, which is a combination of the demand condition and the curve pattern condition. A yellow upward-facing triangle is plotted on the chart when the signal condition is met at a specific candle or bar, indicating a potential buy signal.
III. Decision-Making Process:
* Demand and Supply Conditions: Identify potential buying opportunities when a green demand condition is present. Consider potential selling opportunities when a red supply condition is present. Use these conditions to assess the overall market sentiment and potential price reversals.
* Curve Patterns: Analyze the presence of blue curve pattern conditions to identify specific price patterns. These patterns can provide additional confirmation for potential trading decisions.
* Signal Condition: Pay attention to the yellow signal condition, which indicates a potential buy signal. Evaluate the overall market context and consider entering a buy position when the signal condition is met.
* Risk Management: Implement proper risk management techniques such as setting stop-loss orders and position sizing to protect against potential losses.
IV. Conclusion:
This trading strategy leverages price action analysis and color signals to identify potential trading opportunities. The colors associated with each condition and signal serve as visual aids to highlight specific points on the chart. It's important to thoroughly backtest and validate the strategy before applying it to real-world trading scenarios. Additionally, always consider market conditions, risk management, and individual trading preferences when making trading decisions.
Disclaimer: Trading involves risks, and this document does not guarantee profitable outcomes. Traders should exercise caution and perform their own due diligence before engaging in any trading activity.
Remember to continually review and adapt your trading strategy based on market conditions and personal experiences to enhance its effectiveness.

Austin's Range Filter with Trade SignalsAustin’s Range Filter with Trade Signals
Description:
Austin’s Range Filter with Trade Signals is a versatile indicator that combines a custom range filter with dynamic buy and sell signals based on EMA crossovers. This indicator is designed to help traders easily identify trend reversals and optimal trade entry/exit points.
Key Features:
• Range Filter Calculation: The indicator calculates the highest and lowest price over a user-defined period, then multiplies the difference by a customizable multiplier to establish a dynamic range. A combined middle band (average of the upper and lower bounds) is plotted for a clearer visual representation of the price trend.
• Exponential Moving Average (EMA): A user-configurable EMA is added, which acts as the primary signal line. You can adjust the length of the EMA to suit your trading style.
• Buy and Sell Signals:
• Buy Signal: Triggered when the price crosses above the EMA, indicating a potential upward trend.
• Sell Signal: Triggered when the price crosses below the EMA, indicating a potential downward trend.
• Alerts: Custom alert conditions for buy and sell signals allow you to set up real-time notifications when the signal changes, so you never miss an opportunity.
• Customizable Display: You can toggle the visibility of the combined band (purple) and the EMA (blue) for a cleaner chart.
How It Works:
• Buy when the price crosses above the EMA.
• Sell when the price crosses below the EMA.
• Background colors indicate whether the current price is above or below the calculated range, helping you visually identify bullish and bearish conditions.
Customization Options:
• Range Filter Length: The lookback period for the highest/lowest price calculation.
• Range Multiplier: Adjusts the size of the range.
• EMA Length: Set the length of the EMA to fine-tune the signal sensitivity.
• Toggle Lines: Show or hide the combined band and EMA for more flexibility.
This indicator is suitable for a variety of markets including stocks, forex, and crypto, and can be applied to any timeframe. Use it as part of your technical analysis to spot market trends and improve your decision-making process.
How to Use:
1. Apply the indicator to your chart and adjust the settings to suit your strategy.
2. Set up alerts for buy and sell signals to receive real-time notifications.
3. Monitor the price relative to the range and EMA to better time your trades.
This indicator is perfect for traders looking for an intuitive yet powerful tool to enhance their trading strategies with automatic signals and alerts.

Uptrick: Volume-Weighted EMA Signal### **Uptrick: Volume-Weighted EMA Signal (UVES) Indicator - Comprehensive Description**
#### **Overview**
The **Uptrick: Volume-Weighted EMA Signal (UVES)** is an advanced, multifaceted trading indicator meticulously designed to provide traders with a holistic view of market trends by integrating Exponential Moving Averages (EMA) with volume analysis. This indicator not only identifies the direction of market trends through dynamic EMAs but also evaluates the underlying strength of these trends using real-time volume data. UVES is a versatile tool suitable for various trading styles and markets, offering a high degree of customization to meet the specific needs of individual traders.
#### **Purpose**
The UVES indicator aims to enhance traditional trend-following strategies by incorporating a critical yet often overlooked component: volume. Volume is a powerful indicator of market strength, providing insights into the conviction behind price movements. By merging EMA-based trend signals with detailed volume analysis, UVES offers a more nuanced and reliable approach to identifying trading opportunities. This dual-layer analysis allows traders to differentiate between strong trends supported by significant volume and weaker trends that may be prone to reversals.
#### **Key Features and Functions**
1. **Dynamic Exponential Moving Average (EMA):**
- The core of the UVES indicator is its dynamic EMA, calculated over a customizable period. The EMA is a widely used technical indicator that smooths price data to identify the underlying trend. In UVES, the EMA is dynamically colored—green when the current EMA value is above the previous value, indicating an uptrend, and red when below, signaling a downtrend. This visual cue helps traders quickly assess the trend direction without manually calculating or interpreting raw data.
2. **Comprehensive Moving Average Customization:**
- While the EMA is the default moving average in UVES, traders can select from various other moving average types, including Simple Moving Average (SMA), Smoothed Moving Average (SMMA), Weighted Moving Average (WMA), and Volume-Weighted Moving Average (VWMA). Each type offers unique characteristics:
- **SMA:** Provides a simple average of prices over a specified period, suitable for identifying long-term trends.
- **EMA:** Gives more weight to recent prices, making it more responsive to recent market movements.
- **SMMA (RMA):** A slower-moving average that reduces noise, ideal for capturing smoother trends.
- **WMA:** Weighs prices based on their order in the dataset, making recent prices more influential.
- **VWMA:** Integrates volume data, emphasizing price movements that occur with higher volume, making it particularly useful in volume-sensitive markets.
3. **Signal Line for Trend Confirmation:**
- UVES includes an optional signal line, which applies a secondary moving average to the primary EMA. This signal line can be used to smooth out the EMA and confirm trend changes. The signal line’s color changes based on its slope—green for an upward slope and red for a downward slope—providing a clear visual confirmation of trend direction. Traders can adjust the length and type of this signal line, allowing them to tailor the indicator’s responsiveness to their trading strategy.
4. **Buy and Sell Signal Generation:**
- UVES generates explicit buy and sell signals based on the interaction between the EMA and the signal line. A **buy signal** is triggered when the EMA transitions from a red (downtrend) to a green (uptrend), indicating a potential entry point. Conversely, a **sell signal** is triggered when the EMA shifts from green to red, suggesting an exit or shorting opportunity. These signals are displayed directly on the chart as upward or downward arrows, making them easily identifiable even during fast market conditions.
5. **Volume Analysis with Real-Time Buy/Sell Volume Table:**
- One of the standout features of UVES is its integration of volume analysis, which calculates and displays the volume attributed to buying and selling activities. This analysis includes:
- **Buy Volume:** The portion of the total volume associated with price increases (close higher than open).
- **Sell Volume:** The portion of the total volume associated with price decreases (close lower than open).
- **Buy/Sell Ratio:** A ratio of buy volume to sell volume, providing a quick snapshot of market sentiment.
- These metrics are presented in a real-time table positioned in the top-right corner of the chart, with customizable colors and formatting. The table updates with each new bar, offering continuous feedback on the strength and direction of the market trend based on volume data.
6. **Customizable Settings and User Control:**
- **EMA Length and Source:** Traders can specify the lookback period for the EMA, adjusting its sensitivity to price changes. The source for EMA calculations can also be customized, with options such as close, open, high, low, or other custom price series.
- **Signal Line Customization:** The signal line’s length, type, and width can be adjusted to suit different trading strategies, allowing traders to optimize the balance between trend detection and noise reduction.
- **Offset Adjustment:** The offset feature allows users to shift the EMA and signal line forward or backward on the chart. This can help align the indicator with specific price action or adjust for latency in decision-making processes.
- **Volume Table Positioning and Formatting:** The position, size, and color scheme of the volume table are fully customizable, enabling traders to integrate the table seamlessly into their chart setup without cluttering the visual workspace.
7. **Versatility Across Markets and Trading Styles:**
- UVES is designed to be effective across a wide range of financial markets, including Forex, stocks, cryptocurrencies, commodities, and indices. Its adaptability to different markets is supported by its comprehensive customization options and the inclusion of volume analysis, which is particularly valuable in markets where volume plays a crucial role in price movement.
#### **How Different Traders Can Benefit from UVES**
1. **Trend Followers:**
- Trend-following traders will find UVES particularly beneficial for identifying and riding trends. The dynamic EMA and signal line provide clear visual cues for trend direction, while the volume analysis helps confirm the strength of these trends. This combination allows trend followers to stay in profitable trades longer and exit when the trend shows signs of weakening.
2. **Volume-Based Traders:**
- Traders who focus on volume as a key indicator of market strength can leverage the UVES volume table to gain insights into the buying and selling pressure behind price movements. By monitoring the buy/sell ratio, these traders can identify periods of strong conviction (high buy volume) or potential reversals (high sell volume) with greater accuracy.
3. **Scalpers and Day Traders:**
- For traders operating on shorter time frames, UVES provides quick and reliable signals that are essential for making rapid trading decisions. The ability to customize the EMA length and type allows scalpers to fine-tune the indicator for responsiveness, while the volume analysis offers an additional layer of confirmation to avoid false signals.
4. **Swing Traders:**
- Swing traders, who typically hold positions for several days to weeks, can use UVES to identify medium-term trends and potential entry and exit points. The indicator’s ability to filter out market noise through the signal line and volume analysis makes it ideal for capturing significant price movements without being misled by short-term volatility.
5. **Position Traders and Long-Term Investors:**
- Even long-term investors can benefit from UVES by using it to identify major trend reversals or confirm the strength of long-term trends. The flexibility to adjust the EMA and signal line to longer periods ensures that the indicator remains relevant for detecting shifts in market sentiment over extended time frames.
#### **Optimal Settings for Different Markets**
- **Forex Markets:**
- **EMA Length:** 9 to 14 periods.
- **Signal Line:** Use VWMA or WMA for the signal line to incorporate volume data, which is crucial in the highly liquid Forex markets.
- **Best Use:** Short-term trend following, with an emphasis on identifying rapid changes in market sentiment.
- **Stock Markets:**
- **EMA Length:** 20 to 50 periods.
- **Signal Line:** SMA or EMA with a slightly longer length (e.g., 50 periods) to capture broader market trends.
- **Best Use:** Medium to long-term trend identification, with volume analysis confirming the strength of institutional buying or selling.
- **Cryptocurrency Markets:**
- **EMA Length:** 9 to 12 periods, due to the high volatility in crypto markets.
- **Signal Line:** SMMA or EMA for smoothing out extreme price fluctuations.
- **Best Use:** Identifying entry and exit points in volatile markets, with the volume table providing insights into market manipulation or sudden shifts in trader sentiment.
- **Commodity Markets:**
- **EMA Length:** 14 to 21 periods.
- **Signal Line:** WMA or VWMA, considering the impact of trading volume on commodity prices.
- **Best Use:** Capturing medium-term price movements and confirming trend strength with volume data.
#### **Customization for Advanced Users**
- **Advanced Offset Usage:** Traders can experiment with different offset values to see how shifting the EMA and signal line impacts the timing of buy/sell signals. This can be particularly useful in markets with known latency or for strategies that require a delayed confirmation of trend changes.
- **Volume Table Integration:** The position, size, and colors of the volume table can be adjusted to fit seamlessly into any trading setup. For example, a trader might choose to position the table in the bottom-right corner and use a smaller size to keep the focus on price action while still having access to volume data.
- **Signal Filtering:** By combining the signal line with the primary EMA, traders can filter out false signals during periods of low volatility or when the market is range-bound. Adjusting the length of the signal line allows for greater control over the sensitivity of the trend detection.
#### **Conclusion**
The **Uptrick: Volume-Weighted EMA Signal (UVES)** is a powerful and adaptable indicator designed for traders who demand more from their technical analysis tools. By integrating dynamic EMA trend signals with real-time volume analysis, UVES offers a comprehensive view of market conditions, making it an invaluable resource for identifying trends, confirming signals, and understanding market sentiment. Whether you are a day trader, swing trader, or long-term investor, UVES provides the versatility, precision, and customization needed to make more informed and profitable trading decisions. With its ability to adapt to various markets and trading styles, UVES is not just an indicator but a complete trend analysis solution.

Enhanced Alligator Trend Indicator By Er. Parvez HaleemPurpose: The Enhanced Alligator Trend Indicator aims to identify strong and reliable buy and sell signals on the price chart by combining the Alligator Indicator with trend strength and volume filters. It is specifically designed for use on a 1-minute chart to enhance precision in short-term trading decisions.
Components:
Alligator Indicator:
Jaw Line (Blue): Calculated as a simple moving average (SMA) of the closing price over a specified period (default: 13 bars). Represents the long-term trend.
Teeth Line (Red): Calculated as a simple moving average (SMA) of the closing price over a shorter period (default: 8 bars). Represents the medium-term trend.
Lips Line (Green): Calculated as a simple moving average (SMA) of the closing price over an even shorter period (default: 5 bars). Represents the short-term trend.
Trend Strength Indicator:
Relative Strength Index (RSI): Measures the strength of the current trend, using a default period of 14 bars. RSI values above 50 suggest a bullish trend, while values below 50 suggest a bearish trend.
Volume Filter:
Volume Threshold: Filters signals based on trading volume to ensure they only appear when volume exceeds a specified threshold (default: 100,000). This helps to avoid low-volume noise and enhance signal reliability.
Additional Trend Filters:
Short-Term SMA: A simple moving average with a default period of 20 bars, used to assess short-term trend direction.
Long-Term SMA: A simple moving average with a default period of 50 bars, used to assess long-term trend direction.
SMA Crossover: A bullish crossover occurs when the short-term SMA is above the long-term SMA, and a bearish crossover occurs when the short-term SMA is below the long-term SMA.
Signal Generation:
Buy Signal: Generated when:
The Lips line is above the Teeth line, and the Teeth line is above the Jaw line (indicating a bullish alignment in the Alligator Indicator).
The RSI is above 50 (indicating strong bullish trend strength).
The trading volume exceeds the specified volume threshold (indicating sufficient trading activity).
The short-term SMA is above the long-term SMA (confirming a bullish trend).
Sell Signal: Generated when:
The Lips line is below the Teeth line, and the Teeth line is below the Jaw line (indicating a bearish alignment in the Alligator Indicator).
The RSI is below 50 (indicating strong bearish trend strength).
The trading volume exceeds the specified volume threshold (indicating sufficient trading activity).
The short-term SMA is below the long-term SMA (confirming a bearish trend).
Plotting on Chart:
Alligator Lines: The Jaw, Teeth, and Lips lines are plotted directly on the price chart in blue, red, and green, respectively, to indicate the long-term, medium-term, and short-term trends.
Buy/Sell Signals: Buy signals are plotted below the price bars in green, and sell signals are plotted above the price bars in red. These signals are marked with labels ("BUY" and "SELL") to clearly indicate trading opportunities.
Debugging: RSI and SMA lines are plotted but hidden by default. They can be revealed for verification purposes to ensure the correctness of the indicator’s calculations.
Alerts:
Buy Alert: Triggers when a buy signal condition is met, sending a notification that a buy opportunity has been identified.
Sell Alert: Triggers when a sell signal condition is met, sending a notification that a sell opportunity has been identified.

Uptrick: MACD Slope Buy/Sell SignalsThe "Uptrick: MACD Slope Buy/Sell Signals" indicator is an advanced technical analysis tool meticulously crafted to provide traders with precise buy and sell signals derived from the slope changes of the Moving Average Convergence Divergence (MACD) signal line. This indicator integrates user-defined parameters for the MACD calculation, including the fast length, slow length, and signal smoothing period. These parameters allow traders to customize the indicator according to their specific trading strategies and timeframes, ensuring adaptability across various market conditions.
The primary function of this indicator is to monitor the slope of the MACD signal line and detect significant shifts that indicate potential changes in market momentum. The indicator calculates the slope by comparing the current value of the signal line to its previous value, and further determines the change in slope to identify acceleration or deceleration in the trend. A buy signal is generated when the slope of the signal line transitions from negative to positive, signaling an upward momentum, while a sell signal is triggered when the slope moves from positive to negative, indicating a downward trend. To enhance signal accuracy, the indicator distinguishes between regular and strong signals. A strong buy signal requires the slope change to be greater than the simple moving average (SMA) of recent slope changes, whereas a strong sell signal necessitates the slope change to be less than the negative SMA of recent slope changes.
A unique feature of this indicator is its dynamic and intuitive visualization. When a strong buy or sell signal is identified, it plots labels ('B' for buy and 'S' for sell) directly on the price chart. These labels are strategically positioned below or above the respective bars to ensure clear visibility and reduce chart clutter. The indicator also includes an option to connect consecutive signals with lines, which enhances the visual tracking of signal sequences and provides a coherent view of the trend's progression. The color intensity of the plotted signals varies based on the absolute value of the slope, offering an immediate visual cue on the strength of the detected trend changes. A steeper slope results in a darker color, signaling a stronger trend.
To facilitate comprehensive analysis, the indicator also plots the MACD and signal lines on the chart, providing traders with a reference to the underlying data that drives the buy and sell signals. These lines are color-coded for easy differentiation: the MACD line is typically blue, and the signal line is orange. This visual aid ensures that traders have a clear understanding of the indicator's basis and can cross-reference the generated signals with the MACD behavior.
The calculation of this indicator is grounded in well-established technical analysis principles. It employs the MACD function to derive the MACD line and signal line based on the user-defined parameters. The slope of the signal line is then computed, followed by the calculation of the slope change. The buy and sell signals are determined by comparing the current and previous slopes, and the strong signals are filtered through an additional layer of slope change analysis relative to its moving average.
The accuracy and reliability of the "Uptrick: MACD Slope Buy/Sell Signals" indicator stem from its thorough and methodical approach to signal generation. By combining user customization, detailed slope analysis, and robust visual elements, this indicator serves as a powerful tool for traders seeking precise entry and exit points in the market. Its ability to adapt to different trading styles and market conditions, coupled with its clear visual cues, makes it a valuable addition to any trader's toolkit, enhancing decision-making and improving trading outcomes.

Keltner Channel+EMA with Buy/Sell SignalsIndicator Name: Double Keltner Channel with EMA (Buy/Sell Signals)
Description:
This indicator is designed to help traders identify potential trend reversals and generate buy/sell signals in volatile markets. It combines two Keltner Channels with different sensitivities (multipliers of 2.6 and 3.8) to visualize dynamic support and resistance levels. The addition of a 20-period EMA helps confirm trend direction and filter out potential false signals.
How the Indicator Works:
• Keltner Channels: These bands dynamically adjust to changing market volatility, offering a visual representation of potential price ranges. The 2.6 multiplier Keltner Channel (KC) is more sensitive to price changes, potentially highlighting short-term reversals, while the 3.8 multiplier KC focuses on broader trend shifts.
• 20-period EMA: This widely used trend indicator helps smooth out price fluctuations and identify the underlying direction of the market.
• Buy Signals: Generated when a candle's low touches or crosses below either Keltner Channel's lower band, and within the next 6 candles, that same candle closes above the 20 EMA. This combination suggests a potential rejection of lower prices (support) and a possible resumption of the uptrend.
• Sell Signals: Mirror the buy signal logic but are triggered when the candle's high touches or crosses above either Keltner Channel's upper band and then closes below the 20 EMA within the next 6 candles. This indicates a potential rejection of higher prices (resistance) and a possible shift to a downtrend.
How to Use the Indicator:
1. Identify the Trend: Use the 20 EMA to determine the overall trend direction. Look for buy signals primarily in uptrends and sell signals in downtrends.
2. Confirm with RSI : While not included in this indicator, consider using a separate Relative Strength Index (RSI) with a length of 10, SMA type, MA length of 14, and standard deviation of 2. Look for oversold conditions (RSI below 20) to confirm buy signals and overbought conditions (RSI above 80) to confirm sell signals.
3.Apply Risk Management: Always use appropriate risk management techniques, such as stop-loss orders, to protect your capital.
Key Points:
• This indicator is most effective in trending markets.
• It is not a standalone trading system and should be used in conjunction with other analysis tools and confirmation.
• The Keltner Channel multiplier values can be adjusted to suit your trading style and risk tolerance.
Important Disclaimer:
This indicator is a modification of the original Keltner Channel code and is intended for educational and informational purposes only.
It does not constitute financial advice. Always conduct your own research and consult with a qualified financial advisor before making any investment decisions.

Linear Regression Oscillator [ChartPrime]Linear Regression Oscillator Indicator
Overview:
The Linear Regression Oscillator is a custom TradingView indicator designed to provide insights into potential mean reversion and trend conditions. By calculating a linear regression on the closing prices over a user-defined period, this oscillator helps identify overbought and oversold levels and highlights trend changes. The indicator also offers visual cues and color-coded price bars to aid in quick decision-making.
Key Features:
◆ Customizable Look-Back Period:
Input: Length
Default: 20
Description: Determines the period over which the linear regression is calculated. A longer period smooths the oscillator but may lag, while a shorter period is more responsive but may be noisier.
◆ Overbought and Oversold Thresholds:
Inputs: Upper Threshold and Lower Threshold
Default: 1.5 and -1.5 respectively
Description: Define the upper and lower bounds for identifying overbought and oversold conditions. Values outside these thresholds suggest potential reversals.
◆ Candlestick Color Plotting:
Input: Plot Bar Color
Default: false
Description: Option to color the price bars based on the oscillator's value, providing a visual representation of market conditions. Bars turn cyan for positive oscillator values and blue for negative.
◆ Mean Reversion and Trend Signals:
Visual markers and labels indicate when the oscillator suggests mean reversion or trend changes, aiding in identifying key market turning points.
◆ Invalidation Levels:
Tracks the highest and lowest prices over a recent period to set levels where the current trend signal would be considered invalidated.
◆ Gradient Color Coding:
Utilizes gradient color coding to enhance the visualization of oscillator values, making it easier to interpret overbought and oversold conditions.
◆ Usage Notes:
Setting the Look-Back Period:
Adjust the "Length" input based on the timeframe and the type of trading you are conducting. Shorter periods are more suited for intraday trading, while longer periods can be used for swing trading.
Interpreting Thresholds:
Use the upper and lower threshold inputs to fine-tune the sensitivity of the overbought and oversold signals. Higher absolute values reduce the number of signals but increase their reliability.
Candlestick Coloring:
Enabling the "Plot Bar Color" option can help quickly identify the current state of the oscillator in relation to the zero line. This visual aid can be particularly useful in fast-moving markets.
Mean Reversion and Trend Signals:
Pay attention to the symbols and labels on the chart indicating mean reversion and trend changes. These signals are designed to highlight potential entry and exit points.
Invalidation Levels:
Use the plotted invalidation levels as stop-loss or signal invalidation points. If the price moves beyond these levels, the current trend signal is likely invalid.
This indicator helps traders identify overbought and oversold conditions, potential mean reversions, and trend changes based on the linear regression of the closing prices over a specified look-back period.

Enhanced Reversal DetectionScript Description:
The "Enhanced Reversal Detection" indicator is a powerful tool designed to identify potential market reversals across various financial instruments. It incorporates a sophisticated algorithm that analyzes price action along with key technical indicators such as the Relative Strength Index (RSI), Bollinger Bands, and Moving Average (MA).
How to Use:
Adjustable Parameters: The indicator offers a range of adjustable parameters to cater to different trading preferences and market conditions.
RSI Length: Adjusts the length of the RSI calculation to fine-tune sensitivity.
Overbought Level: Sets the threshold for identifying overbought conditions on the RSI scale.
Oversold Level: Sets the threshold for identifying oversold conditions on the RSI scale.
Bollinger Bands Length: Determines the length of the Bollinger Bands calculation.
Bollinger Bands Multiplier: Adjusts the standard deviation multiplier for the Bollinger Bands, influencing band width.
Moving Average Length: Defines the length of the Moving Average calculation to capture trend direction.
Min Bars Between Signals: Sets the minimum number of bars required between consecutive reversal signals.
ADX Length: Adjusts the length of the Average Directional Index (ADX) calculation.
ADX Threshold: Defines the threshold value for ADX, serving as a filter for reversal signals.
Signal Generation: The indicator generates signals for both bullish and bearish reversals based on predefined criteria. A bullish reversal signal is triggered when the closing price exceeds the lower Bollinger Band and RSI falls below the oversold threshold. Conversely, a bearish reversal signal occurs when the closing price falls below the upper Bollinger Band and RSI surpasses the overbought threshold.
Alerts: Traders can opt to receive alerts for bullish and bearish reversal signals, enabling them to stay informed of potential trading opportunities even when away from the platform.
Publication Readiness:
To ensure readiness for publication in the TradingView public library, the script has been meticulously crafted and documented:
The code is extensively commented to provide clear explanations of parameters, calculations, and signal generation logic.
Best coding practices have been followed to enhance readability and maintainability.
Rigorous testing has been conducted to validate the accuracy and reliability of signal generation across various market conditions.
The script adheres to TradingView's guidelines and policies for script publication, ensuring compliance with platform standards and user expectations.
With its comprehensive features and user-friendly design, the "Enhanced Reversal Detection" indicator is poised to become a valuable asset for traders seeking to identify high-probability reversal opportunities in the financial markets.

Bayesian Trend Indicator [ChartPrime]Bayesian Trend Indicator
Overview:
In probability theory and statistics, Bayes' theorem (alternatively Bayes' law or Bayes' rule), named after Thomas Bayes, describes the probability of an event, based on prior knowledge of conditions that might be related to the event.
The "Bayesian Trend Indicator" is a sophisticated technical analysis tool designed to assess the direction of price trends in financial markets. It combines the principles of Bayesian probability theory with moving average analysis to provide traders with a comprehensive understanding of market sentiment and potential trend reversals.
At its core, the indicator utilizes multiple moving averages, including the Exponential Moving Average (EMA), Simple Moving Average (SMA), Double Exponential Moving Average (DEMA), and Volume Weighted Moving Average (VWMA) . These moving averages are calculated based on user-defined parameters such as length and gap length, allowing traders to customize the indicator to suit their trading strategies and preferences.
The indicator begins by calculating the trend for both fast and slow moving averages using a Smoothed Gradient Signal Function. This function assigns a numerical value to each data point based on its relationship with historical data, indicating the strength and direction of the trend.
// Smoothed Gradient Signal Function
sig(float src, gap)=>
ta.ema(source >= src ? 1 :
source >= src ? 0.9 :
source >= src ? 0.8 :
source >= src ? 0.7 :
source >= src ? 0.6 :
source >= src ? 0.5 :
source >= src ? 0.4 :
source >= src ? 0.3 :
source >= src ? 0.2 :
source >= src ? 0.1 :
0, 4)
Next, the indicator calculates prior probabilities using the trend information from the slow moving averages and likelihood probabilities using the trend information from the fast moving averages . These probabilities represent the likelihood of an uptrend or downtrend based on historical data.
// Define prior probabilities using moving averages
prior_up = (ema_trend + sma_trend + dema_trend + vwma_trend) / 4
prior_down = 1 - prior_up
// Define likelihoods using faster moving averages
likelihood_up = (ema_trend_fast + sma_trend_fast + dema_trend_fast + vwma_trend_fast) / 4
likelihood_down = 1 - likelihood_up
Using Bayes' theorem , the indicator then combines the prior and likelihood probabilities to calculate posterior probabilities, which reflect the updated probability of an uptrend or downtrend given the current market conditions. These posterior probabilities serve as a key signal for traders, informing them about the prevailing market sentiment and potential trend reversals.
// Calculate posterior probabilities using Bayes' theorem
posterior_up = prior_up * likelihood_up
/
(prior_up * likelihood_up + prior_down * likelihood_down)
Key Features:
◆ The trend direction:
To visually represent the trend direction , the indicator colors the bars on the chart based on the posterior probabilities. Bars are colored green to indicate an uptrend when the posterior probability is greater than 0.5 (>50%), while bars are colored red to indicate a downtrend when the posterior probability is less than 0.5 (<50%).
◆ Dashboard on the chart
Additionally, the indicator displays a dashboard on the chart , providing traders with detailed information about the probability of an uptrend , as well as the trends for each type of moving average. This dashboard serves as a valuable reference for traders to monitor trend strength and make informed trading decisions.
◆ Probability labels and signals:
Furthermore, the indicator includes probability labels and signals , which are displayed near the corresponding bars on the chart. These labels indicate the posterior probability of a trend, while small diamonds above or below bars indicate crossover or crossunder events when the posterior probability crosses the 0.5 threshold (50%).
The posterior probability of a trend
Crossover or Crossunder events
◆ User Inputs
Source:
Description: Defines the price source for the indicator's calculations. Users can select between different price values like close, open, high, low, etc.
MA's Length:
Description: Sets the length for the moving averages used in the trend calculations. A larger length will smooth out the moving averages, making the indicator less sensitive to short-term fluctuations.
Gap Length Between Fast and Slow MA's:
Description: Determines the difference in lengths between the slow and fast moving averages. A higher gap length will increase the difference, potentially identifying stronger trend signals.
Gap Signals:
Description: Defines the gap used for the smoothed gradient signal function. This parameter affects the sensitivity of the trend signals by setting the number of bars used in the signal calculations.
In summary, the "Bayesian Trend Indicator" is a powerful tool that leverages Bayesian probability theory and moving average analysis to help traders identify trend direction, assess market sentiment, and make informed trading decisions in various financial markets.

Moving Average Momentum SignalsBest for trade execution in lower timeframe (1m,5m,15m) with momentum confirmation in higher timeframes (2h,4h,1d)
This indicator relies on three key conditions to determine buy and sell signals: the price's deviation from a short-term moving average, the change in the moving average over time (past 10 candles), and the price's deviation from a historical price (40 candles). The strategy aims to target moments where the asset's price is likely to experience a reversal or momentum shift.
Conditions
Price deviation from short-term Moving Average (MA): Current candle close minus the 10-period MA (price action past 10 candles)
Change in Moving Average over time: Current 10-period MA minus the 10-period MA from 10 candles ago (price action past 20 candles)
Price deviation from historical price: Current close minus the close from 40 candles ago (price action past 40 candles)
Signal Generation Logic
Buy Signal: Triggered when all three conditions are positive. Confirmed if the previous signal was a sell or if there were no previous signals
Sell Signal: Triggered when all three conditions are negative. Confirmed if the previous signal was a buy or if there were no previous signals
Usage and Strategy
After back testing, I observed the higher timeframes were a good indication of momentum/sentiment that you can take note of while trading intraday on the lower time frames (time intervals stated above). Background highlights are also displayed for easier visualization of bullish/bearish skew in terms of the volume of signals generated.

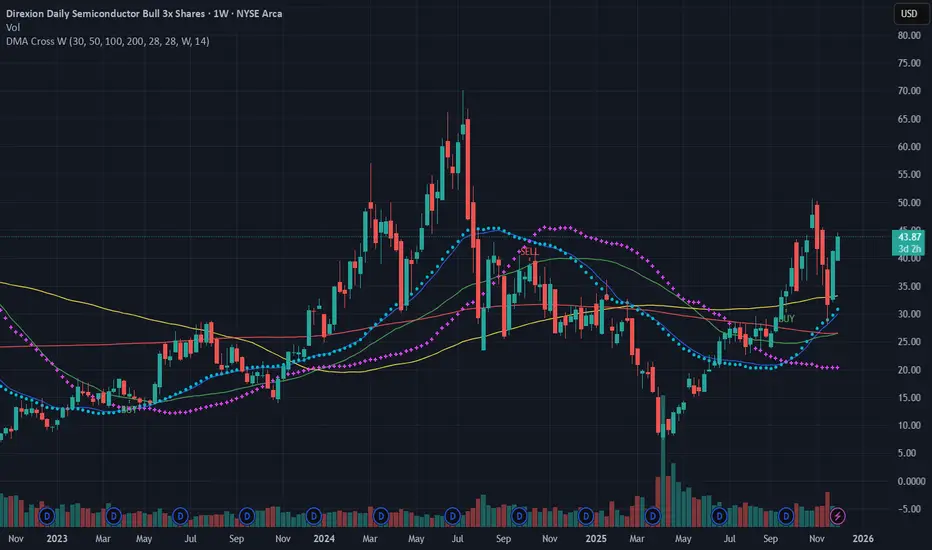
SMA DMA Crossing SignalSMA and DMA Crossing Buy Sell Signals
This script implements a Double Moving Average (DMA) strategy, a popular technical analysis technique used by traders to identify trends and potential buy/sell signals in financial markets.
**Description:**
The Double Moving Average strategy involves the calculation of two moving averages – a short-term moving average and a long-term moving average. In this script, we calculate these moving averages as follows:
1. **Short-term DMA (`dmaShort`):**
- Calculated using a 28-bar Simple Moving Average (SMA).
- Represents the shorter-term trend in the price movement.
2. **Long-term DMA (`dmaLong`):**
- Also calculated using a 28-bar SMA.
- Displaced backward by 14 bars (`dmaLong := request.security(syminfo.tickerid, "D", dmaLong )`), effectively creating a 28-bar SMA with a -14 bar displacement.
- Represents the longer-term trend in the price movement.
**Signals:**
Buy and sell signals are generated based on the crossing of the short-term DMA over or under the long-term DMA:
- **Buy Signal (`DMA BUY`):** Occurs when the short-term DMA crosses above the long-term DMA (`dmaBuySignal`).
- **Sell Signal (`DMA SELL`):** Occurs when the short-term DMA crosses below the long-term DMA (`dmaSellSignal`).
**How to Use:**
- **Buy Signal:** Consider entering a long position when the short-term DMA crosses above the long-term DMA, indicating a potential uptrend.
- **Sell Signal:** Consider exiting a long position or entering a short position when the short-term DMA crosses below the long-term DMA, indicating a potential downtrend.
This script provides a visual representation of the DMA crossover signals on the chart, helping traders identify potential entry and exit points in the market.
**Note:** It's important to combine DMA signals with other technical analysis tools and risk management strategies for informed trading decisions.
All comments are welcome..
Hull AMA SignalsThis script is a comprehensive trading indicator named "Hull AMA Signals", which combines AMA and HSO by LuxAlgo and ther video based strategy techniques to provide buy (long) and sell (short) signals. It overlays directly on the price chart, offering a dynamic and visually intuitive trading aid. The core components of this indicator are Adaptive Moving Averages (AMA), Hull Moving Average (HMA), and a unique Hull squeeze oscillator (HSO), each configured with customizable parameters for flexibility and adaptability to various market conditions.
Features and Components
Adaptive Moving Averages (AMA): This indicator employs two sets of AMAs, each with distinct lengths, multipliers, lags, and overshoot parameters. The AMAs are designed to adapt their sensitivity based on the market's volatility, making them more responsive during significant price movements and less prone to false signals during periods of consolidation.
Hull Moving Average (HMA): The HMA is calculated using a sophisticated algorithm that aims to reduce the lag commonly associated with traditional moving averages. It provides a smoother and more responsive moving average line, which helps in identifying the prevailing market trend more accurately.
Hull Squeeze Oscillator (HSO): A novel component of this indicator, the HSO, is designed to identify potential market breakouts. It does so by comparing the Hull Moving Average's direction and momentum against a dynamically calculated mean, generating bullish or bearish signals based on the crossover and divergence from this mean.
Buy (Long) and Sell (Short) Signals: The script intelligently combines signals from the AMA crossovers and the Hull squeeze oscillator to pinpoint potential buy and sell opportunities. Bullish signals are generated when there's a positive crossover in the AMAs accompanied by a bullish dot from the HSO, whereas bearish signals are indicated by a negative crossover in the AMAs along with a bearish dot from the HSO.
Customization and Style Options: Users have the ability to adjust various parameters such as the length of the moving averages, multipliers, and source data, enabling customization for different trading strategies and asset classes. Additionally, color-coded visual elements like gradients and shapes enhance the readability and instant recognition of trading signals.
Use Cases
Trend Identification: By analyzing the direction and position of the AMAs and HMA, traders can easily discern the prevailing market trend, helping them to align their trades with the market momentum.
Signal Confirmation: The combination of AMA crossovers and HSO signals provides a robust framework for confirming trade entries and exits, potentially increasing the reliability of the trading signals.
Volatility Adaptation: The adaptive nature of the AMAs and the dynamic calculation of the HSO mean allow this indicator to adjust to changing market volatility, making it suitable for a wide range of market environments.
This indicator is suitable for traders looking for a comprehensive and dynamic technical analysis tool that combines trend analysis with signal generation, offering both visual appeal and practical trading utility.

ASFX SignalsDescription:
The ASFX Signals Indicator, created by OmegaTools, is an open-source Pine Script™ code designed to provide traders with valuable signals for potential entry and exit points in the market. This script incorporates a combination of Exponential Moving Average (EMA) signals and Volume Weighted Average Price (VWAP) confluence, enhancing the precision of trading decisions.
Key Features:
Threshold Configuration: Users can customize the threshold parameter (thres) to fine-tune signal sensitivity, adapting the indicator to different market conditions.
EMA Length Customization: The script allows traders to adjust the length of the Exponential Moving Average (EMA) with the "EMA Length" input, providing flexibility in capturing various trends.
Show/Hide Options: Users have the flexibility to choose whether to display the EMA line, VWAP confluence, and VWAP upper and lower bands, tailoring the visual representation based on individual preferences.
VWAP Confluence: The indicator integrates VWAP confluence, offering additional confirmation for trading signals. Traders can choose the VWAP resolution and set the deviation parameter for enhanced accuracy.
Signal Filtering: The script intelligently filters signals based on the percentage of the candle that crosses the EMA. Long signals are filtered out if the closing price is above the VWAP or the specified threshold, and short signals are filtered out if the closing price is below the VWAP or the threshold.
Visual Signals: The indicator provides clear visual signals for long and short entries, making it easy for traders to identify potential opportunities. The signals are accompanied by arrows and labels for quick interpretation.
How to Use:
Adjust the threshold, EMA length, and VWAP parameters based on your trading preferences.
Choose whether to display the EMA line, VWAP confluence, and upper/lower bands.
Interpret long and short signals for potential entry and exit points, considering the percentage of the candle that crosses the EMA.
Consider additional confirmation provided by VWAP confluence.
Concepts and Methodology:
The ASFX Signals Indicator combines EMA signals and VWAP confluence to generate actionable trading signals. The script intelligently considers the percentage of the candle that crosses the EMA, providing a nuanced approach to signal confirmation. The EMA offers trend insights, while VWAP confluence enhances signal reliability.

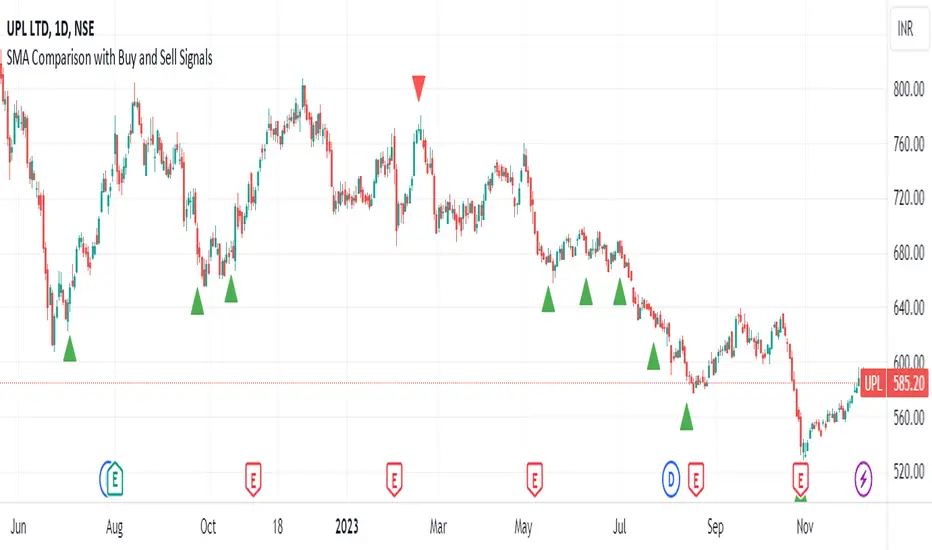
SMA Comparison with Buy and Sell Signals ShrutIndicator Name: SMA Comparison with Buy and Sell Signals
Overlay: Enabled (Indicator is displayed on the main price chart)
Description:
The "SMA Comparison with Buy and Sell Signals" indicator is designed to identify potential buying and selling opportunities in a financial instrument by comparing three Simple Moving Averages (SMAs) – the 20-day SMA, 50-day SMA, and 200-day SMA.
Features:
Simple Moving Averages (SMAs):
Calculates and displays three SMAs based on the closing price: SMA-20, SMA-50, and SMA-200.
Buy and Sell Conditions:
Buy Condition : Triggered when the 200-day SMA is greater than the 50-day SMA, the 50-day SMA is greater than the 20-day SMA, and the current closing price is lower than the 20-day SMA.
Sell Condition: Triggered when the 200-day SMA is less than the 50-day SMA, the 50-day SMA is less than the 20-day SMA, and the current closing price is higher than the 20-day SMA.
Signal Generation:
Generates buy and sell signals on the chart based on the identified conditions.
Implements a 15-day cooldown period between consecutive buy or sell signals to prevent frequent signals in volatile market conditions.
Signal Display:
Displays buy signals as green triangle shapes below the price bars.
Displays sell signals as red triangle shapes above the price bars.
Usage:
Buy Signals: Considered when the green triangle shapes (buy signals) appear below the price bars, indicating a potential buying opportunity based on the defined SMA conditions.
Sell Signals: Considered when the red triangle shapes (sell signals) appear above the price bars, indicating a potential selling opportunity based on the defined SMA conditions.
Notes:
This indicator is customizable and can be adjusted by modifying the conditions based on specific trading strategies and preferences.
Traders should consider additional analysis and risk management strategies before making trading decisions based solely on the indicator signals.
Breakout/Breakdown Indicator (30 Min Range) by InvestYourAsset👉The indicator provided here is a technical analysis indicator for TradingView users that identifies potential breakout and breakdown opportunities on the initial 30-minute range in every trading session.
👉The indicator high and low of the initial 30-minute period and plotting them as horizontal lines on the chart. The high is marked in green line and the low is marked in red line.
📈The indicator then generates buy and sell signals based on whether the current close price crosses above or below the previous 30-minute high and low, respectively.
📢The indicator also has two inputs:
👉 sessionStartHour : The hour at which the trading session begins. The default value is 9, However users can change the time according to their own trading style.
👉 sessionStartMinute : The minute at which the trading session begins. The default value is 0.
These inputs can be used to adjust the indicator to the specific trading session that you are interested in.
✅How to use the Indicator:
👉To use the 30 Minute Breakout/Breakdown Indicator, simply add it to your chart and configure the inputs to your liking. Once the indicator is added to the chart, it will plot the 30-minute high and low as horizontal lines, as well as generate buy and sell signals based on the current close price.
✅Here is a step-by-step guide:
📈Open TradingView and select the chart that you want to add the indicator to.
📈Click on the "Indicators" tab and search for "30 Minute Breakout/Breakdown Indicator by InvestYourAsset".
📈Click on the indicator to add it to your chart.
📈Configure the inputs to your liking. The default values are typically fine, but you can experiment with different values to see what works best for you.
📈Once you are satisfied with the settings, click on the "Apply" button.
📈The indicator will now be displayed on your chart. You will see two horizontal lines representing the previous 30-minute high and low, as well as triangles representing buy and sell signals.
✅How to interpret the signals:
📈Buy signal : A buy signal is generated when the current close price crosses above the previous 30-minute high. This suggests that the price is likely to continue moving higher in the short term.
📈Sell signal : A sell signal is generated when the current close price crosses below the previous 30-minute low. This suggests that the price is likely to continue moving lower in the short term.
👉Traders should remember that the present indicator is just one tool that can be used to identify potential trading opportunities. It is important to use other technical analysis tools and risk management techniques to confirm your trading signals before entering any trades.
✅Things to consider while using the indicator:
📈Look for buy signals in an uptrend and sell signals in a downtrend. This will increase the likelihood of your trades being successful.
📈Place your stop losses below the previous 30-minute low for buy signals and above the previous 30-minute high for sell signals. This will help to limit your losses if the trade goes against you.
📈Consider taking profits at key resistance and support levels. This will help you to lock in your profits and avoid giving them back to the market.
Follow us for timely updates regarding indicators that we may publish in future and give it a like if you appreciate the indicator.

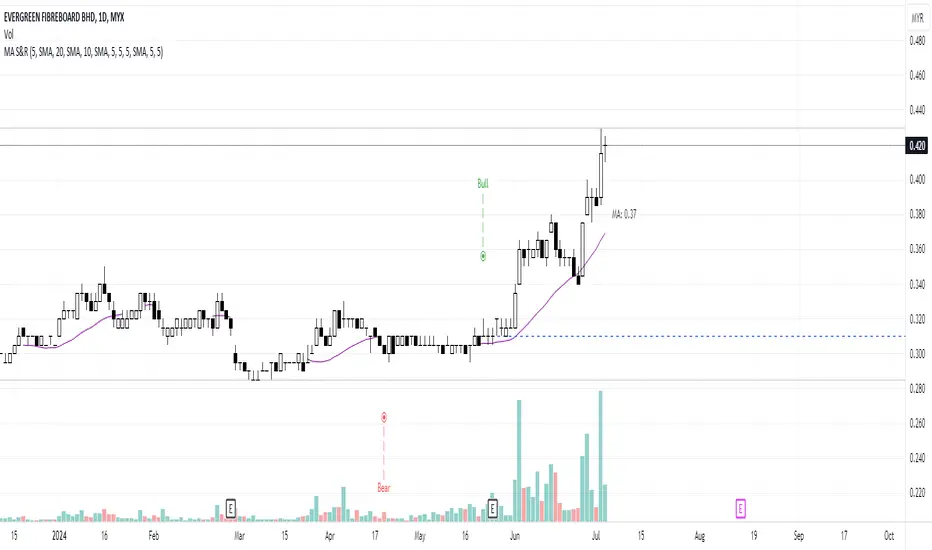
MA Support & Resistance SignalThis indicator is to show MA Support/Resistance and trend of a stock.
It contains three (3) Moving Averages that can be set to SMA or EMA:
1. Upper Line : SMA 5 (default)
2. Lower Line : SMA 20 (default)
3. Support/Resistance Line : SMA 10 (default)
Other signals:
1. Bull and Blue Dotted Line signal: Upper Line (SMA 5) crossover with Lower Line (SMA 20).
2. Bear and Red Dotted Line signal: Lower Line (SMA 20) crossover with Upper Line (SMA 5).
3. Red Triangle signal: Price closes below Support/Resistance Line (SMA 10).
4. Green Bar signal: Price breaks Support/Resistance Line (SMA 10).
The way how I use it:
- Since I don't like my chart to be crowded with a lot of moving averages, I will disable SMA 5 and SMA 10 and will only leave SMA 20 as my final support line.
- Entry when only:
1. Bull signal appeared.
2. Green bar appeared, or;
3. Price rebound on SMA 20.
I let the script open so that you guys can custom it based on your own preferences. Hope you guys enjoy it.
Enhanced Strategy (Buy/Sell Signals)The provided script is an enhanced strategy that combines multiple indicators to generate buy and sell signals. Here's a breakdown of its features and usage:
Indicators used:
1. Moving Averages (MA): It uses two moving averages, fast and slow, to identify trend direction.
2. Relative Strength Index (RSI): It measures the momentum and overbought/oversold conditions of the asset.
3. Moving Average Convergence Divergence (MACD): It indicates trend direction and potential trend reversals.
4. Stochastic Momentum Index (Stch Mtm): It identifies overbought and oversold conditions and potential reversals.
5. Awesome Oscillator: It helps to gauge the market momentum and potential trend changes.
How to use:
1. The strategy is designed to be used as a study on the TradingView platform.
2. Apply the script to your preferred chart and adjust the input parameters as desired.
3. The buy and sell signals will be plotted as green "Buy" and red "Sell" labels on the chart.
4. You can also observe the plotted indicators to gain insights into the market conditions.
Combination of indicators:
1. Buy Signal: The strategy generates a buy signal when the following conditions are met:
- The fast moving average crosses over the slow moving average (bullish crossover).
- RSI value is above the specified threshold (30 by default), indicating potential oversold conditions.
- MACD line is above the signal line, suggesting a bullish trend.
- Stch Mtm is above 50, indicating bullish momentum.
- The Awesome Oscillator is positive, implying bullish market sentiment.
2. Sell Signal: The strategy generates a sell signal when the following conditions are met:
- The fast moving average crosses under the slow moving average (bearish crossover).
- RSI value is below the specified threshold (100 - RSI threshold), indicating potential overbought conditions.
- MACD line is below the signal line, suggesting a bearish trend.
- Stch Mtm is below 50, indicating bearish momentum.
- The Awesome Oscillator is negative, implying bearish market sentiment.
Market conditions:
- The strategy aims to identify potential entry and exit points based on the combination of indicators.
- It can be used in various market conditions, but it's important to consider the overall market context, news events, and risk management principles.
- It's recommended to use this strategy as a tool for analysis and decision-making, and validate the signals with additional analysis before executing trades.
Please note that the effectiveness and profitability of any trading strategy can vary depending on various factors, including market conditions and individual trading preferences. It's always advisable to conduct thorough backtesting and consider risk management techniques before applying any strategy to live trading.

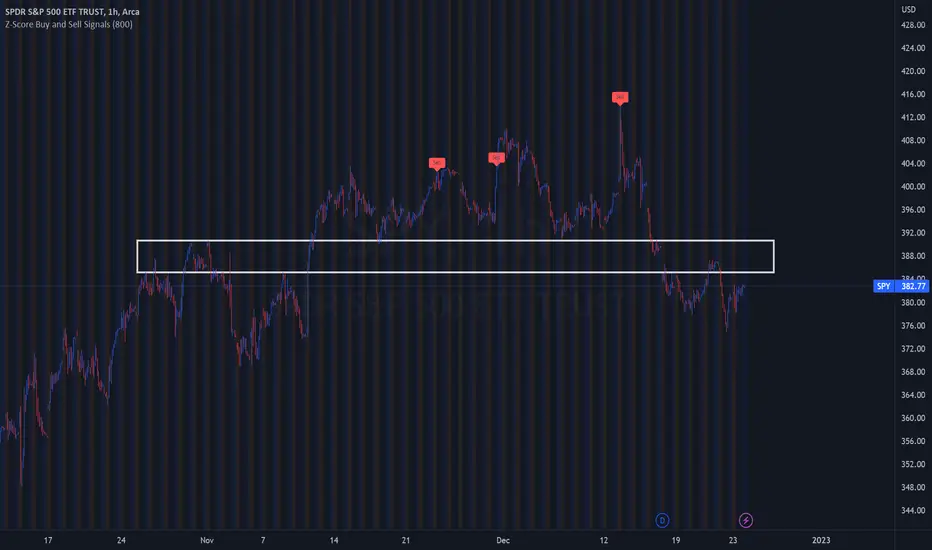
Z-Score Buy and Sell SignalsHello everyone!
Happy Holidays, Merry/Happy Christmas!
Here is my Christmas gift to you to show my appreciation of your support and engagement over the past year!
This is the Z-Score Buy and Sell Signal indicator!
How it works:
It works by looking at the Z-Score of an equities close price and looking for previous areas over reversals over the defined period of time.
It also looks at areas that are overbought or oversold (manifested by Z-Scores greater than or less than 2 Standard Deviations away) and displays them as bar colour changes.
Historic reversals are signaled with buy and/or sell signals.
Oversold is signaled with a green bar colour change (colour can be customaized).
Overbought is signaled with an orange bar colour change.
How to use it:
You can use it with support resistance or other indicators. You can use this on both the larger and small timeframes, depending on the style of trader you are.
You can modify the input length to look back on shorter or longer periods.
As a general rule from my experience using it, if you are using the shorter timeframes (i.e. 1 minute tfs), its best to look back between 50 and 75 candles for most equities.
If you are looking at the larger timeframes (i.e. Daily, 1 to 2 hour, etc.) its best to set the input value to between 500 to 800.
But, as always, you should check to ensure the indicator is providing correct signals by reviewing the previous signals to ensure that they adequate identified reversals.
It is also best not to use this alone as your sole indicator. It is meant to be supplementary to other indicators/support resistance/chart patterns you are using to guide your trades. This will not replace good TA and a good understand of the stock and its likely trajectory.
As always, please feel free to share your comments/feedback/questions and recommendations below.
As always, I do customary tutorial videos for my indicators, so please see below for an in-depth video tutorial should you want to see it in action:
Otherwise, happy holidays everyone! And all of the best over this Christmas weekend to you and your loved ones!
INSTITUTIONAL VOLUME PROFILE + FIBONACCI + ENHANCED SIGNALS🎯 INSTITUTIONAL VOLUME PROFILE + FIBONACCI + ENHANCED SIGNALS
A professional-grade indicator combining Volume Profile analysis, Fibonacci retracements, Anchored VWAP, and intelligent signal filtering to identify high-probability institutional positioning and trade setups.
📊 CORE FEATURES
▸ Volume Profile with POC (Point of Control)
- Visualizes where institutional volume accumulated
- Identifies High Volume Nodes (HVN) as key support/resistance
- Shows Value Area (70% volume zone) for market equilibrium
▸ Dynamic Fibonacci Levels
- Auto-detects swing high/low for retracement levels
- Golden Pocket (0.618-0.65) highlight zone
- Bull/bear direction recognition
▸ Anchored VWAP
- Anchored to swing range start
- Institutional mean reversion baseline
- Real-time trend bias indicator
▸ Graded Signal System (A+/B/C)
- A+ Signals: High probability setups (VWAP cross + POC alignment)
- B Signals: Above-average quality (VWAP cross above POC)
- C Signals: Lower probability (counter-trend setups)
🎮 DISPLAY MODES
⚡ TRADING LIVE MODE
- Clean chart showing only A+ signals
- Minimal visual noise for active trading
- Perfect for intraday execution
📈 FULL OVERVIEW MODE
- Complete analysis with all zones visible
- Volume Profile + Fibonacci + Value Area
- All signal grades displayed
- Statistics dashboard
🔬 ADVANCED SIGNAL FILTERS
✓ Volume Confirmation
- Requires above-average volume on signals
- Filters out weak institutional participation
- Configurable volume multiple (default 1.2x)
✓ Momentum Filter
- Ensures price momentum aligns with signal direction
- Prevents counter-trend entries
- Configurable lookback period
✓ SR Proximity Upgrade ⭐ GAME CHANGER
- Automatically upgrades B/C signals to A+ when near key levels
- Detects proximity to POC and HVN zones
- Combines technical confluence for best setups
🔔 SMART ALERTS
▸ Configurable alerts for A+, B, or C signals
▸ Real-time notifications to your device
▸ No need to watch charts constantly
▸ "Once per bar close" prevents repainting
💡 HOW TO USE
FOR DAY TRADING:
1. Switch to "Trading Live" mode
2. Enable only A+ alerts
3. Set filters: Volume 1.5x, Momentum ON, Proximity 0.3%
4. Trade only A+ signals at key levels
FOR SWING TRADING:
1. Use "Full Overview" mode
2. Analyze Value Area and Fibonacci confluence
3. Set filters: Volume 1.2x, Momentum ON, Proximity 0.8%
4. Enter on A+ signals with multi-timeframe confirmation
FOR ANALYSIS:
1. Full Overview mode with all visuals enabled
2. Disable filters to see all raw signals
3. Study how institutions positioned at key zones
4. Plan trades around POC and Value Area
⚙️ RECOMMENDED SETTINGS
5-15 MIN CHARTS (Scalping):
- Lookback: 200-300 bars
- Volume: 1.5x, Momentum: 5 bars, Proximity: 0.3%
- Trading Live mode + A+ alerts only
1 HOUR CHARTS (Intraday):
- Lookback: 300 bars
- Volume: 1.3x, Momentum: 3 bars, Proximity: 0.5%
- Full Overview or Trading Live
4 HOUR CHARTS (Swing):
- Lookback: 300-500 bars
- Volume: 1.2x, Momentum: 3 bars, Proximity: 0.8%
- Full Overview mode
DAILY CHARTS (Position):
- Lookback: 300-500 bars
- Volume: 1.1x, Momentum: 2 bars, Proximity: 1.0%
- Full Overview mode
📈 KEY CONCEPTS
POC (Point of Control): Price level with highest volume - acts as magnet
Value Area: Zone containing 70% of volume - equilibrium range
HVN: High Volume Nodes - institutional accumulation zones
AVWAP: Anchored VWAP - institutional average entry price
Golden Pocket: 0.618-0.65 Fib zone - highest probability reversal area
🎯 TRADING STRATEGY TIPS
1. Wait for A+ signals - quality over quantity
2. Best setups occur at POC or Value Area boundaries
3. Use multiple timeframes for confirmation
4. Combine with your own risk management rules
5. Signals are high probability, not guaranteed - always use stops

Filtered TEMA CrossoverFiltered Dual TEMA Crossover
This indicator is a trend-following tool based on the classic Dual Triple Exponential Moving Average (TEMA) Crossover strategy, enhanced with two robust filters: the Chop Index and the Average Directional Index (ADX).
The TEMA is known for its low lag and high responsiveness, making the crossover an effective signal for trend reversals. However, trading TEMA crossovers during sideways, choppy markets often leads to false signals. This is where the filters come in.
Key Features
▪️Dual TEMA Crossover: Plots two customizable TEMA lines (Fast and Slow) for clear visualization of the primary trend direction.
▪️Intelligent Signal Filtering: Buy and Sell signals are generated only when the market confirms it is in a trending state, thanks to two integrated filters:
➖Chop Index Filter: Blocks signals when the market is detected as sideways or consolidating (Chop Index reading above a user-defined threshold).
➖ADX Filter: Ensures signals are only taken when the trend strength is sufficient (ADX reading above a user-defined minimum threshold).
▪️Customizable Signals: Full control over the signal shapes (Arrows, Triangles, etc.), colors, text, and size.
How to Use It
Use the Filtered Dual TEMA Crossover to enter positions on trend continuation or reversal while dramatically reducing exposure to low-quality, whipsawing signals common in non-trending environments.
Before the filters:
After the filters:
Minimize Noise. Maximize Clarity. Trade the Trend.

Setup Keltner BandS MMS + RSI SIGNALS
📊 Keltner Bands with RSI Confirmation – TradingView Script
Introduction
This script combines Keltner Channel logic with Relative Strength Index (RSI) confirmation to provide traders with visual signals and alerts for potential reversals. It is designed for scalping and short-term trading strategies, where precision and quick decision-making are essential.
🔧 How It Works
• Keltner Bands (ATR-based):
• Two sets of bands are plotted around a moving average:
• Band 3 (ATR × 3) – more sensitive, suitable for aggressive entries.
• Band 5 (ATR × 5) – wider, used as a filter or confirmation zone.
• Signals are generated when the price crosses back inside the bands from outside.
• RSI Confirmation:
• RSI is calculated with a customizable period (default: 14).
• Overbought and oversold levels (default: 70/30) are used to filter signals.
• A bearish reversal is confirmed only if RSI is above the overbought level.
• A bullish reversal is confirmed only if RSI is below the oversold level.
📌 Functions and Features
• Visual Signals:
• Triangles plotted above/below candles for Keltner-only signals.
• Additional colored triangles for Keltner + RSI confirmed signals.
• Alerts:
• Configurable alerts for both Keltner-only and RSI-confirmed conditions.
• Messages include the type of reversal and the band level.
• Customizable Parameters:
• Moving average length.
• ATR multipliers (3 and 5).
• RSI length and thresholds.
• Colors for band fills and signals.
🎯 Usage
1. Apply the script to your chart in TradingView.
2. Adjust parameters to fit your trading style (scalping, intraday, swing).
3. Watch for signals:
• Red/green/orange/teal triangles → Keltner-only reversals.
• Maroon/lime/purple/blue triangles → RSI-confirmed reversals.
4. Set alerts to receive notifications when conditions are met.
5. Use RSI confirmation to filter out false signals and increase accuracy.
✅ Benefits
• Clear visualization of reversal zones.
• Dual-layer confirmation (Keltner + RSI).
• Flexible for different timeframes and trading styles.
• Ready-to-use alerts for automation or manual trading.
