Logical Trading Indicator V.1Features of the Logical Trading Indicator V.1
ATR-Based Trailing Stop Loss
The Logical Trading Indicator V.1 utilizes the Average True Range (ATR) to implement a dynamic trailing stop loss. You can customize the sensitivity of your alerts by adjusting the ATR Multiple and ATR Period settings.
Higher ATR Multiple values create wider stops, while lower values result in tighter stops. This feature ensures that your trades are protected against adverse price movements. For best practice, use higher values on higher timeframes and lower values on lower term timeframes.
Bollinger Bands
The Logical Trading Indicator V.1 includes Bollinger Bands, which can be customized to use either a Simple Moving Average (SMA) or an Exponential Moving Average (EMA) as the basis.
You can adjust the length and standard deviation multiplier of the Bollinger Bands to fine-tune your strategy. The color of the basis line changes to green when price is above and red when price is below the line to represent the trend.
The bands show a range vs a single band that also represents when the price is in overbought and oversold ranges similar to an RSI. These bands also control the take profit signals.
You also have the ability to change the band colors as well as toggle them off, which only affects the view, they are still active which will still fire the take profit signals.
Momentum Indicator
Our indicator offers a momentum filter option that highlights market momentum directly on the candlesticks, identifying periods of bullish, bearish, or consolidation phases. You can enable or disable this filter as needed, providing valuable insights into market conditions.
By default, you will see the candlestick colors represent the momentum direction as green or red, and consolidation periods as white, but the filter on the BUY and SELL signals is not active. The view options and filter can be toggled on and off in the settings.
Buy and Sell Signals
The Logical Trading Indicator V.1 generates buy and sell signals based on a combination of ATR-based filtering, Bollinger Band basis crossover, and optional momentum conditions if selected in the settings. These signals help you make informed decisions about when to enter or exit a trade. You can also enable a consolidation filter to stay out of trades during tight ranges.
Basically a BUY signal fires when the price closes above the basis line, and the price meets or exceeds the ATR multiple from the previous candle length, which is also editable in the settings.
If the momentum filter is engaged, it will not fire BUY signals when in consolidation periods. It works just the opposite for SELL signals.
Take Profit Signals
We've integrated a Take Profit feature that helps you identify points to exit your trades with profits. The indicator marks Long Take Profit when prices close below the upper zone line of the Bollinger Bands after the previous candle closes inside the band, suggesting an optimal point to exit a long trade or consider a short position.
Conversely, Short Take Profit signals appear when prices close above the lower zone after the previous candle closes inside of it, indicating the right time to exit a short trade or contemplate a long position.
Alerts for Informed Trading
The Logical Trading Indicator V.1 comes equipped with alert conditions for buy signals, sell signals, take profit points, and more. Receive real-time notifications to your preferred devices or platforms to stay updated on market movements and trading opportunities.
Поиск скриптов по запросу "stop loss"

OTT CollectionIf you are not yet familiar with OTT, this script could provide an introduction to help you get started.
"Optimized Trend Tracker" (OTT) is an effective trend-following indicator created by Anıl Özekşi . It aims to detect the current trend direction based on an elegant mathematical construct. The key defining characteristic of OTT is its reliance on a trailing-stop mechanism. This enables OTT to identify price movements and follow the price until a reversal occurs. The widespread adoption of OTT in various algo-trading platforms has fostered the development of diverse applications of the indicator over time. Examining its history, eight distinct applications emerge.
1) OTT - Optimized Trend Tracker
2) TOTT - Twin Ott
3) OTT Channel - Half Channel & Fibonacci Channel
4) RISOTTO - Rsi Ott
5) SOTT - Stochastic Ott
6) HOTT & LOTT - Highest-Lowest Ott + Sum Option
7) ROTT - Relative Ott
8) FT - "Fırsatçı" Trend
BONUS: RTR - Relative True Range
Each system functions as an independent indicator and the "OTT Collection" is intended to present all of them in a single script.
ORIGINALITY
Primarily, this script introduces previously unreleased OTT applications on Tradingview (RISOTTO, ROTT, FT). In contrast to previously published examples that treat OTT as a variable, this script portrays OTT as a function, rendering it adaptable for more intricate computations. Consequently, OTT has evolved into a versatile tool capable of facilitating complex analyses. Furthermore, this script offers an innovative feature that permits the blocking of consecutive signals in the same direction, catering to user preferences. (This feature is crucial for all indicators utilizing band structures such as TOTT and HOTT-LOTT).
USAGE
It is simple to use. The settings section of the indicator groups the parameters. In first group, the System parameter allows you to select the OTT system you want to display on the chart. Activating the Pyramiding parameter enables the display of consecutive signals in the same direction (for TOTT and HOTT-LOTT). In the second group you can change the display options with the Barcolor, Signal and Bars parameters. The OTT system you select is configured with the parameters in the group with the corresponding system heading. (For example, suppose you select OTT CHANNEL in the system parameter. The parameters defining the channels are grouped under the heading "OTT CHANNELS" in the settings section.) Also the parameters you chose are displayed in table form on the chart screen. The table also presents the total number of bars on the chart and the number of signals generated by the selected system.
MECHANICS
Let's take a look at how the indicator works. This indicator incorporates eight distinct OTT systems, each characterized by unique parameters, lines, and signals. (Exception: OTT Channel does not include any referenced signals.)
1) WHAT IS "OTT"?
OTT comprises two lines: Support and Target. There's an up-trending market when the Support is superior to the Target, and a down-trending market when the Support is inferior to the Target. It is governed by two parameters. The Support (moving average) is determined by the Length parameter, while the Multiplier parameter is employed for percentage calculations. Lower values are adept at capturing short-term fluctuations, whereas higher values are more adept at identifying long-term trends. These principles apply to all parameters within the indicator.
DETAILED INFO : The OTT function in the script automatically performs the calculation process described in this section. So, if you know how OTT works you can skip the details. To comprehend its functioning, it's essential to grasp the "MOST" indicator, also devised by Anıl Özekşi. The fundamental principle of MOST involves creating bands that function akin to a trailing stop-loss. Initially, a moving average, referred to as the 'Support,' is established. (Anıl Özekşi employs VAR/VIDYA as the moving average type in all his systems.) Subsequently, the Support line is adjusted both upward and downward by a percentage multiplier to establish a band system. In the context of the trailing stop-loss concept, when the Support line approaches either the lower or upper band, the respective band ceases to move in parallel with the Support line and becomes horizontal. Consequently, the Support always intersects the band at some point. The values of the upper or lower bands, determined by this intersection, are referred to as the MOST line. OTT is generated by consolidating the values of MOST shifted upwards and downwards by half the coefficient percentage into a single line using the same method as above, and calculating the value of this line from two bars ago. Support is the data series of OTT and it serves as a source in OTT function. The OTT line is named as "Target" in this scipt. Support and Target will automatically vary according to the OTT application selected in the "System" parameter.
2) WHAT IS "TOTT"?
Twin OTT , also known as the "OTT Band," involves three parameters: Length, Multiplier, and Band Multiplier. It consists of three lines: Support, Upper Line, and Lower Line. OTT is determined by the Length and Multiplier parameters, while TOTT is calculated by adjusting OTT upwards and downwards as per the Band Multiplier parameter. The indicator generates signals based on the intersections of the Support and these two new OTT levels.
3) WHAT IS "OTT CHANNEL"?
Similar to TOTT, the OTT CHANNEL is also based on shifted OTT levels, employing a similar calculation method. The primary distinction lies in the fact that TOTT has a single Band Multiplier, whereas OTT CHANNEL incorporates two line multipliers for the band. It encompasses four parameters: Length, Multiplier, Upper Line Multiplier, and Lower Line Multiplier. OTT is defined by the Length and Multiplier parameters. The Upper Line Multiplier and Lower Line Multiplier parameters establish the channel boundaries by shifting the OTT line. Subsequently, levels are drawn between the upper and lower lines. The additional Channel Type parameter determines which levels are displayed on the chart. The "Half Channel" option draws channels shifted by half the coefficient. The "Fibonacci Channel" option draws channels shifted by 0.382 and 0.618 coefficients. The "Both" option plots all levels.
4) WHAT IS "RISOTTO"?
OTT also has application examples in momentum oscillators. RISOTTO utilizes the RSI indicator and operates with three parameters. The RSI is defined by the Length 1 parameter, while the Support is determined by the Length 2 parameter. The Multiplier parameter is utilized for percentage calculations. RISOTTO comprises two lines: Support and Target. To ensure more stable calculations, a constant (+1000) is added to the oscillator average when applying OTT to momentum oscillators. This approach eradicates nonsensical results stemming from percentage calculations when the oscillator reaches a value of 0. The indicator generates signals based on the intersection of these two lines.
5) WHAT IS "SOTT"?
Stochastic OTT is an another example of application on oscillator. Its working principle is akin to that of RISOTTO. It operates with three parameters. The Stochastic %k is defined by the Length 1 parameter, while the Stochastic %d is determined by the Length 2 parameter. The Multiplier parameter is utilized for percentage calculations. SOTT comprises two lines: Support and Target. The indicator generates signals based on the intersection of these two lines.
6) WHAT IS "HOTT-LOTT"?
OTT can be applied to the highest and lowest series as well. HOTT-LOTT operates with three parameters: Length, Multiplier, and Sum N Bars. The highest and lowest series are defined by the Length parameter. The Multiplier parameter is utilized for percentage calculations. It encompasses two lines: Upper Line and Lower Line, where HOTT employs the highest series and LOTT uses the lowest series. If the 'High' price surpasses HOTT, the indicator generates Long signals. Similarly, if the 'Low' price falls below LOTT, the indicator generates Short signals. When the Sum N Bars option is activated, signals are generated based on the confirmation concept for N bars.
7) WHAT IS "ROTT"?
Relative OTT serves as a valuable tool for long-period filters. ROTT operates with two parameters. The Support is determined by the length parameter and equals twice the moving average. The Multiplier parameter is utilized for percentage calculations. The indicator generates signals based on the intersection of these two lines.
8) WHAT IS "FT"?
"Fırsatçı" (opportunistic) Trend is a system that revolves around two levels, namely major and minor OTT. It operates with three parameters: Length, Major Multiplier, and Minor Multiplier. FT comprises two lines, Support and Target. The indicator generates signals based on the intersection of these two lines.
9) WHAT IS "RTR"?
Relative True Range is not an OTT system; however, it serves as a complementary feature. It does not have any referenced signals. RTR is devised to obtain a normalized result of the current market volatility. It operates with two parameters: ATR, which is determined by the Length 1 parameter, and RTR, defined by the Length 2 parameter.
A TIP
If any indicator is defined in function form instead of the OTT function, the applications can also be adapted for different indicators. E.g. Supertrend, PMAX, AlphaTrend, etc.
UPDATE
Anıl Özekşi is a competent algotrader who shares his work with open sources. I will update the indicator as new applications are released.
DISCLEIMER
This is just an indicator, nothing more. The script is for informational and educational purposes only. The use of the script does not constitute professional and/or financial advice. The responsibility for risks associated with the use of the script is solely owned by the user. Do not forget to manage your risk. And trade as safely as possible. Good luck!

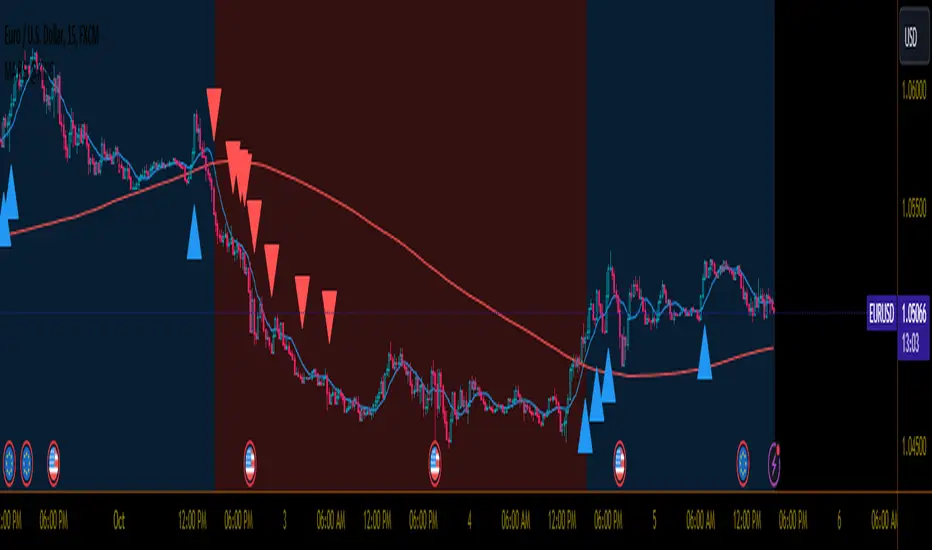
MA RSI @KINGThis Pine Script is designed to create a trading indicator with moving averages (MA) and relative strength index (RSI), along with arrow signals and background color changes based on those signals. Here's a description of its functions:
1. Moving Averages and RSI Calculation:
- Two moving averages (`fastMA` and `slowMA`) are calculated based on user-input lengths.
- The Relative Strength Index (`rsi`) is calculated based on a user-defined length.
2. Crossover Conditions:
- `crossoverUp` is true when the fastMA crosses above the slowMA and RSI is above an overbought level.
- `crossoverDown` is true when the fastMA crosses below the slowMA and RSI is below an oversold level.
3. Arrow Signals:
- Triangle-shaped arrows (`arrowUp` and `arrowDown`) are plotted below and above bars, indicating buy (green) and sell (red) signals, respectively.
4. Background Color Changes:
- The background color (`bgColor`) changes based on buy and sell signals.
- If there's a buy signal (`crossoverUp`), the background color is set to a light blue with 40% transparency.
- If there's a sell signal (`crossoverDown`), the background color is set to a light red with 40% transparency.
- On the next opposite signal, the background color is scaled up (transparency set to 80%) to indicate a stronger signal.
In summary, this script provides visual cues through arrows and background color changes to assist traders in identifying potential buy and sell signals based on moving average crossovers and RSI conditions. The background color variations aim to highlight the strength of the signal, with scaling based on consecutive signals in the same direction.
********************************************************************************
1. Buy Signal:
- Condition: The arrow points up (green) with a background color indicating a buy signal.
- Confirmation: Ensure that there is a strong upward crossover (fastMA above slowMA) and RSI is above the overbought level.
2. Sell Signal:
- Condition: The arrow points down (red) with a background color indicating a sell signal.
- Confirmation: Ensure that there is a strong downward crossover (fastMA below slowMA) and RSI is below the oversold level.
3. Exit Signal:
- Condition: No arrow is present, and the background color is reset.
- Confirmation: Confirm that there is no active buy or sell signal.
Example Trading Rules:
Opening a Long Position (Buy):
- Enter a long (buy) position when:
- The green arrow appears with a light blue background.
- Confirm that the fastMA is above the slowMA.
- Confirm that RSI is above the overbought level.
Opening a Short Position (Sell):
- Enter a short (sell) position when:
- The red arrow appears with a light red background.
- Confirm that the fastMA is below the slowMA.
- Confirm that RSI is below the oversold level.
Exiting a Position:
- Close the position when:
- There is no arrow present (neither green nor red).
- The background color is reset, indicating no active signal.
Risk Management:
Position Sizing: Determine the size of your positions based on your risk tolerance and the size of your trading account.
Stop-Loss and Take-Profit: Set stop-loss orders to limit potential losses and take-profit orders to secure profits.
Risk-Reward Ratio: Consider maintaining a favorable risk-reward ratio in your trades.
Notes:
Backtesting: Before applying this strategy in a live market, it's crucial to backtest it using historical data to assess its performance.
Market Conditions: Adapt the strategy to different market conditions, and be aware that no strategy is guaranteed to be profitable.
Continuous Monitoring: Regularly monitor the performance of the strategy and make adjustments as needed.
Educational Purpose: This strategy is for educational purposes only. Always consult with financial professionals and use your judgment when making trading decisions.
Remember that trading involves risk, and past performance is not indicative of future results. It's recommended to paper trade or use a demo account to test the strategy before risking real capital.
Best wishes on your trading journey! May your strategies be profitable, your risks well-managed, and your decisions guided by wisdom and success. Happy trading!
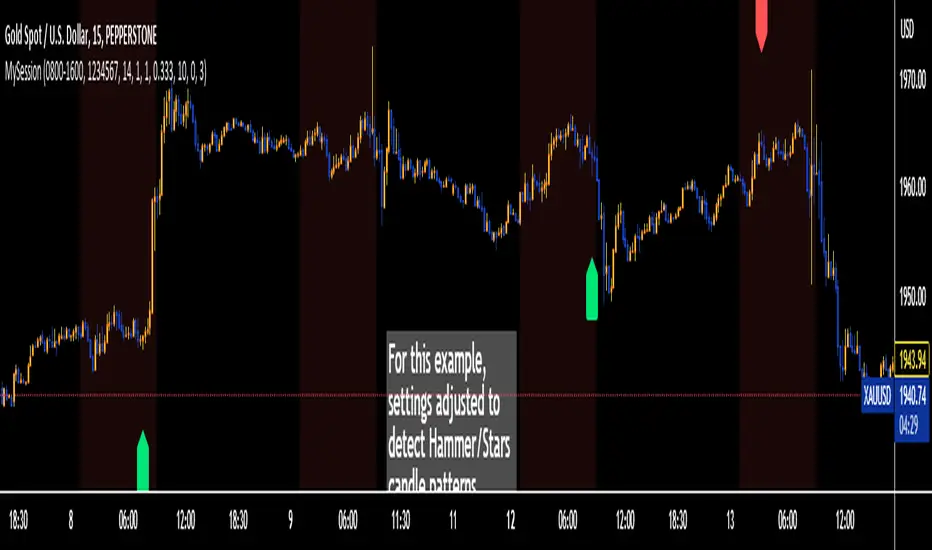
Trading Session TemplateDescription:
The Trading Session Template Indicator is a powerful script that allows traders to customize their own trading session time range on a chart. With this indicator, you have the flexibility to define specific hours during which you prefer to focus your trading activities. The example chart showcases the New York session hours, but you can easily adapt it to any desired time range based on your trading strategy and preferences.
Key Features:
Customizable Trading Session: The indicator empowers you to define your own trading session time range, tailored to your preferred market sessions or specific trading hours. This flexibility ensures that the indicator aligns with your unique trading strategy.
Highlighted Trading Session: When a new trading day begins, the script automatically scans for the specified time range. Once the first candle within the range begins printing, the background color of the chart is highlighted, indicating the beginning of the trading session. When the last candle within the range is closed, the background color returns to normal.
Focus on Specific Market Sessions: This indicator is particularly useful for traders who prefer to trade certain market sessions or specific hours during the day. By customizing the trading session, you can better align your trading activities with specific market conditions and trading opportunities.
Candle Pattern Detection: The indicator includes the ability to detect candle patterns such as Doji, Engulfing, Hammer, and Shooting Star. You can activate the desired candle patterns and set up alerts for them. When an alert is triggered, indicating the formation of a specific candle pattern, you can further analyze the market and make informed trading decisions.
ATR Filter: The indicator offers an ATR (Average True Range) filter to limit noise and focus on candle patterns with a size comparable to the ATR. You can set a minimum and maximum size for a candle compared to the ATR. This helps you filter out smaller or larger candles that may not align with your trading preferences.
Stop Loss (SL) and Take Profit (TP) Levels: When a candle pattern is detected, based on the ATR, the indicator can display suggested Stop Loss and Take Profit levels. This feature provides additional guidance for risk management and potential profit targets.
User-Friendly Interface: The indicator provides a user-friendly interface with adjustable settings and switches for customization. Tooltips are available to guide you through the various options and configurations, making it easy to adapt the indicator to your trading style and preferences.
Note:
The Trading Session Template Indicator is designed for timeframes lower than 1D. It does not plot any information on timeframes of 1D and higher.
Disclaimer:
The Trading Session Template Indicator is provided for informational and educational purposes only. Trading in the financial markets involves risk, and you should only trade with funds that you can afford to lose. The indicator's past performance is not indicative of future results. Always conduct your own research and due diligence before making any investment decisions. The creator of this indicator shall not be held responsible for any losses or damages incurred from the use of this indicator.
AIR Supertrend (Average Interpercentile Range)Supertrend (ST) is a popular stop loss and trend identification script. The simplicity of seeing a clean trend on a chart makes it attractive, yet it is restricted by only allowing the source, length and multiplier to be adjusted, & these tend to have a limited effect on the properties of the identified trend.
There is a wide variety of interesting ST scripts on TradingView that give the user more control, but none to my knowledge, based on measuring the statistical dispersion of Average Interpercentile Range (AIR).
Two more levels of control:
Normally, ATR Average True Range is used to calculate the range in ST. ATR is initially calculated using RMA to smooth out True Range. This script gives the user the option of changing the MA to some more interesting varieties & modifying their parameters.
The default range setting when you load the indicator on a chart will be AIR.
The real strength of the indicator, however, and the reason I am publishing it, is to release AIR. Play round with the percentile range setting. Lowering it will allow you to stay longer in a trade in a volatile market. Raising it will make it tighter.
For comparison, you can switch back the range setting to ATR and load up RMA to see how the original, classic ST plots.
Alerts are included in this version. Alway use a stop loss.
DISCLAIMER: None of this is financial advice.
Credits to these authors, whose hard work inspired parts of this script:
@ KivancOzbilgic - SuperTrend
@ KioseffTrading - Tillson T3 MA
@ cheatcountry - Hann Window Smoothing
@ mutantdog - Interquartile Range function in his 'Blaze' script

Quantitative Backtesting Panel + ROI Table - ShortsThis script is an aggregate of a backtesting panel with quantitative metrics, ROI table and open ROI reader. It also contains a mechanism for having a fixed percentage stop loss, similar to native TV backtester. For shorts only.
Backtesting Panel:
- Certain metrics are color coded, with green being good performance, orange being neutral, red being undesirable.
• ROI : return with the system, in %
• ROI(COMP=1): return if money is compounded at a rate of 100%
• Hit rate: accuracy of the system, as a %
• Profit factor: gross profit/gross loss
• Maximum drawdown: the maximum value from a peak to a successive trough of the system's equity curve
• MAE: Maximum Adverse Excursion. The biggest loss of a trade suffered while the position is still open
• Total trades: total number of closed trades
• Max gain/max loss: shows the biggest win over the biggest loss suffered
• Sharpe ratio: measures the performance of the system with adjusted risk (no comparison to risk-free asset)
• CAGR: Compound Annual Growth Rate. The mean annual rate of growth of the system of n years (provided n>1)
• Kurtosis: measures how heavily the tails of the distribution differ from that of a normal distribution (symmetric on both sides of mean where mean=0, standard deviation=1). A normal distribution has a kurtosis of 3, and skewness of 0. The kurtosis indicates whether or not the tails of the returns contain extreme values
• Skewness: measures the symmetry of the distribution of returns
- Leptokurtic: K > 0. Having more kurtosis than a normal distribution. It's stretched up and to the side too (2nd pic down). High kurtosis (leptokurtic) is bad as the wider tails (called heavy tails) suggest there is relatively high probability of extreme events
- Mesokurtic: K =0. Having the same kurtosis as a normal distribution
- Platykurtic: K < 0. Having less kurtosis than a normal distribution. This suggests there are light tails and fewer extreme events in the distribution
- Skewness is good: +/- 0.5 (fairly symmetrical)
- Skewness is average: -1 to -0.5 or 0.5 to 1 (moderately skewed)
- Skewness is bad: > +/- 1 (highly skewed)
Evolving ROI table:
- The table of ROI values evolve with the year and month. The sum of each year is given. Please avoid using it on non-cryptocurrencies or any market whose trading session is not 24/7
Open ROI reader:
- At the top center is the open ROI of a trade

Quantitative Backtesting Panel + ROI Table - LongsThis script is an aggregate of a backtesting panel with quantitative metrics, ROI table and open ROI reader. It also contains a mechanism for having a fixed percentage stop loss, similar to native TV backtester. For longs only.
Backtesting Panel:
- Certain metrics are color coded, with green being good performance, orange being neutral, red being undesirable.
• ROI : return with the system, in %
• ROI(COMP=1): return if money is compounded at a rate of 100%
• Hit rate: accuracy of the system, as a %
• Profit factor: gross profit/gross loss
• Maximum drawdown: the maximum value from a peak to a successive trough of the system's equity curve
• MAE: Maximum Adverse Excursion. The biggest loss of a trade suffered while the position is still open
• Total trades: total number of closed trades
• Max gain/max loss: shows the biggest win over the biggest loss suffered
• Sharpe ratio: measures the performance of the system with adjusted risk (no comparison to risk-free asset)
• CAGR: Compound Annual Growth Rate. The mean annual rate of growth of the system of n years (provided n>1)
• Kurtosis: measures how heavily the tails of the distribution differ from that of a normal distribution (symmetric on both sides of mean where mean=0, standard deviation=1). A normal distribution has a kurtosis of 3, and skewness of 0. The kurtosis indicates whether or not the tails of the returns contain extreme values
• Skewness: measures the symmetry of the distribution of returns
- Leptokurtic: K > 0. Having more kurtosis than a normal distribution. It's stretched up and to the side too (2nd pic down). High kurtosis (leptokurtic) is bad as the wider tails (called heavy tails) suggest there is relatively high probability of extreme events
- Mesokurtic: K =0. Having the same kurtosis as a normal distribution
- Platykurtic: K < 0. Having less kurtosis than a normal distribution. This suggests there are light tails and fewer extreme events in the distribution
- Skewness is good: +/- 0.5 (fairly symmetrical)
- Skewness is average: -1 to -0.5 or 0.5 to 1 (moderately skewed)
- Skewness is bad: > +/- 1 (highly skewed)
Evolving ROI table:
- The table of ROI values evolve with the year and month. The sum of each year is given. Please avoid using it on non-cryptocurrencies or any market whose trading session is not 24/7
Open ROI reader:
- At the top center is the open ROI of a trade

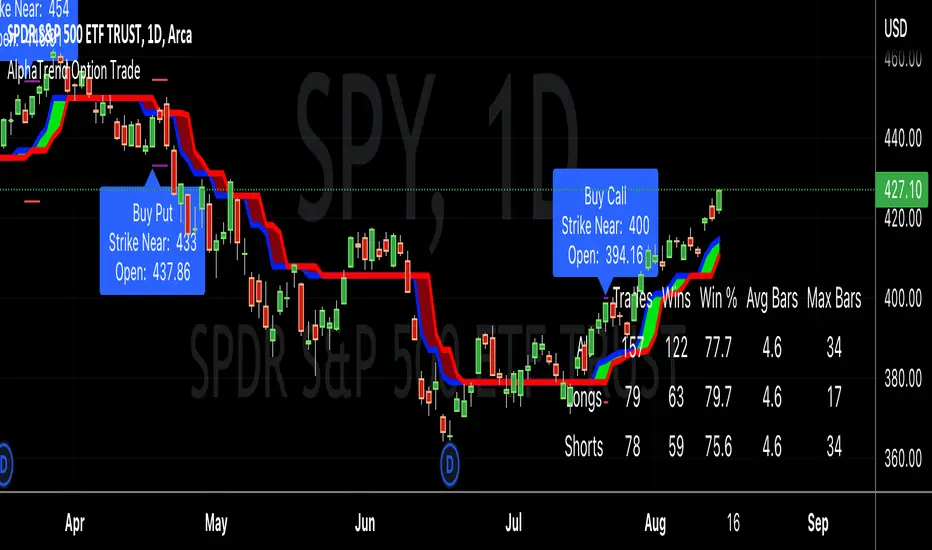
AlphaTrend Option TradeHello good people,
Several have asked for an option buying "system" similar to the CPR selling system I previously coded. This is a work in progress, but thought I would share in order to get some feedback.
I have been working through different setups and believe I have landed on a decent system, using the AlphaTrend indicator created byKivancOzbilgic.
I've tested with 4 real trades, so obviously needs a lot more testing, but the results have been favorable. The key for me, on option buying, is to get in and out quickly, or to be riding "neutral" with no loss possible as quickly as possible. I accomplish this by buying 4 options OTM around 30 days out in relation to expiry dates, and selling out 3 once it makes up for the full cost of the 4 options, letting the 1 ride, or at least ride until it is hefty profit.
In any case, here are the details of the modifications to the AT indicator:
"Buy" and "Sell" signals are now charted as "Call" and "Put" signals,
When the AT indicator finishes a bar with a "Call" or "Put" signal, a label will appear when the next bar opens, showing the strike price to buy. A purple line will represent that strike price target, and a red line will represent a possible price indicating to cut losses (stop loss).
The results table will show the historical win/loss percentage, and most importantly for me, the average number of bars in those trades. As I stated, I want to get in and out, as quickly as possible. When a trade goes much longer than a "short" average, i.e < 5 days, then a buy will become unprofitable due to time decay.
As stated, I'm early in this for real trades, so I'm not sure if it is a truly workable system, and maybe, am just getting lucky.
Good luck, and happy trading,
Deuce
Zero Lag Detrended Price Oscillator (ZL DPO)This indicator attempts to create a zero lag Detrended price oscillator using 2 different scripts. I actually really like the results so far. I hope you all find it useful too.
Green>Red = long
Red>Green = short
The lines on the example chart are some of the signals that the indicator gave on default settings.
The greens are wins, reds are outright losses, and blues are "scratch" trades(signal for other side before hitting stop loss).
All of the signals tested were using NNFX money management to see if they are wins or losses(1.5x atr for SL and 1 Atr for TP).

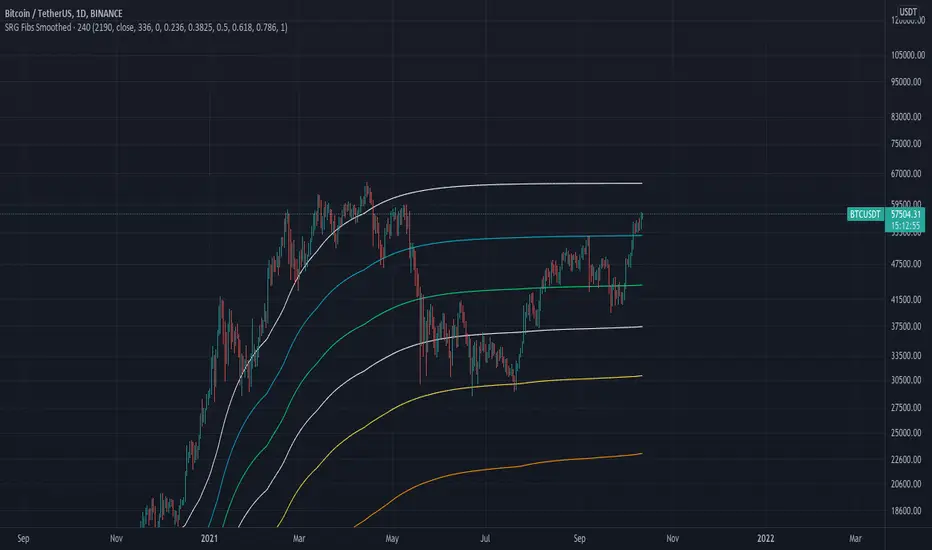
SRG Fibs SmoothedPLEASE READ: HOW TO UNDERSTAND HOW THIS INDICATOR WORKS FOR ME!
Why did I code this?
I never know where is the best place to buy
Sometimes I get greedy and just don't want to sell...
I want to protect myself from losses and still be able to make some trades
What does this do?
This script plots Fibonacci levels dynamically according to a specified length
It also has a smooting value so it looks a bit more clean (and allows for dynamic trailing stop loss)
Internal Fib levels allow to plot fibonacci levels between each main level (scalpers and day traders should be happy with this)
Fib Projection toggle so we can have "the same behaviour" during aggressive Bull Runs.
How to test this thing?
BTC USD Daily chart
For starters, use the following settings:
- Length: 365 (lookback of a full year)
- Smooth: 56 (8 week period)
- Inter Fib levels: OFF
- Fib projection: OFF
Have a look into the chart and check some support/resistance zones. Also check the behaviour of the indicator during the 2021 Jan -> Mar bull run (we will need it later)
If you like to check different time frames. Use these settings:
- Indicator Timeframe: 4 hours
- Length: 2190 (1 year)
- Smooth: 336 (8 weeks)
- Inter Fib Levels: ON
- Fib Projection: OFF
You can now test the chart using the 2H timeframe to see the movement, and how the Internal Fib levels work
Now as we're getting bullish:
- Indicator Timeframe: 4 hours
- Length: 2190 (1 year)
- Smooth: 336 (8 weeks)
- Inter Fib Levels: OFF
- Fib Projection: ON
You can now check the behaviour of the indicator during the 2021 Jan - Mar Bullrun in the 2H or 4H chart, to see some stop loss magic.
Ticker SummaryTicker Summary provides at-a-glance summary information about a ticker near the current bar on the chart:
P/E ratio
Fwd P/E ratio
PEG ratio
Floating shares vs. total shares outstanding
% of trading volume that was short over the last 3 days
Average True Range (ATR) over last 14 days
There are a few less common items of information:
How many ATR multiples the ATR is extended over the last 10 bars. This gives an idea of how far the stock is currently extended.
"R-frequency", explained below.
An optional "ATR Reticule" is shown near the price. This is useful for traders that use ATR as a guideline for price targets and stop losses. On the left is the # of ATRs the stock is currently above the session open. On the right is the # of ATRs the stock is extended above the 10-bar moving average.
R-frequency: a measure of liquidity relevant to your own trading size. It is the frequency at which 1-R of your trading account is traded for a stock. Formula:
(1-R worth of shares) / (average dollar value traded per second), where:
"1-R worth of shares" is how many shares you would buy for a stop loss of -1 ATR, with max risk dollar value based on the Balance and Max Risk % indicator options.
"Average dollar value traded per second" is the 14-day average of (avg(high, low and close) * daily volume)
R-frequency of a second or less is very liquid. If the value is higher (for example, over 60 seconds) the stock is less liquid and you may have some trouble filling limit orders quickly.

TradePro Parabolic SAR BackgroundTradePro Parabolic SAR Background
This indicator is a small tribute to youtuber TradePro
The operation is simple. It is the same Parabolic SAR indicator with its default configuration, but in background format. It is a new way to visualize the same information, more understandably. It is in itself a complete trading system, it can be used in conjunction with the traditional Parabolic SAR to locate the stop loss.
Parabolic SAR
In stock and securities market technical analysis, parabolic SAR (parabolic stop and reverse) is a method devised by J. Welles Wilder, Jr., to find potential reversals in the market price direction of traded goods such as securities or currency exchanges such as forex. It is a trend-following (lagging) indicator and may be used to set a trailing stop loss or determine entry or exit points based on prices tending to stay within a parabolic curve during a strong trend.
Similar to option theory's concept of time decay, the concept draws on the idea that "time is the enemy". Thus, unless a security can continue to generate more profits over time, it should be liquidated. The indicator generally works only in trending markets, and creates "whipsaws" during ranging or, sideways phases. Therefore, Wilder recommends first establishing the direction or change in direction of the trend through the use of parabolic SAR, and then using a different indicator such as the Average Directional Index to determine the strength of the trend.
A parabola below the price is generally bullish, while a parabola above is generally bearish. A parabola below the price may be used as support, whereas a parabola above the price may represent resistance.

Tipsy EMA Tipsy EMA
v0.2a
Coded by vaidab.
A simple strategy to buy dips in an uptrend.
How to use:
- buy on trend when price retraces to the orange "buy" line and compound orders
- sell when price reaches red line (stop loss) or at 💰 (take profit)
Note that you can reverse trade on the 💰 sign for a short scalp / day trade.
Uptrend: green/red background. Danger zone: orange bg. No go zone: no bg.
Potential buys (in a clear trend): 55, 100, 200 EMA touches and
fibo retracements to .382 and .618.
Potential stop loss: when price breaks the 200 EMA (marked by a red line).
Exit signs: opposite trend divergences (RSI).
Take profit: EMA 55 crossing down EMA 100.
Use it in confluence with market structure. E.g. If 200 EMA ligns up with
past market structure, if there are whole numbers or if there's a monthly level.
Tested BTCUSDT D, 4H

Relative VolumeVolume can be a very useful tool if used correctly. Relative volume is designed to filter out the noise and highlight anomalies assisting traders in tracking institutional movements. This tool can be used to identify stop loss hunters and organized dumps. It uses a variety of moving averages to hide usual activity and features an LSMA line to show trend. Trend columns are shown to highlight activity and can be seen at bottom of the volume columns, this is done using ZLSMA and LSMA.
The above chart shows an example of 2 indicators being used on the 15 min chart. The bottom indicator is set to the 1 min chart. Traders can see a large dump on the 1 min chart as institutions wipe out any tight stop losses. Next they buy back in scooping up all those long positions.
This is an example layout using a split screen setup and multiple timeframes ranging from 1 min to 30 mins. This gives a clear indication of trends and make it easy to pickup on institutional behaviour. Tip: Double clicking indicator background will maximize RVOL to the split screen window.

Forex Scalp Triggersthe triggers only work to tell you go back 5 candles on 5 min, take either lowest or highest plus 3 pips and make entry and go 3 pip over under trigger for stop loss. can take half profit at 1x and move stop to break even and go 1x more for take rest profit, or create a trailing stop loss on Take Profit level 2 and ride the trend.
1 Hour chart has to be over under the emas that are faned out nicely to move to 5 min chart to look for the signals if 1hr chart isnt over under the emas nicely then NO TRADE
ForexSignalTV helped create this strategy, just my first script so learning, want to take it to next level but kind of stuck for now. More knowledge coming...
Trend Stress Quant [MarkitTick]💡This indicator combines a liquidity-based stress model with a dynamic linear regression channel to identify potential market exhaustion points and assess trend quality. By merging volume impact analysis with statistical deviation, this tool aims to highlight moments where price action may be overextended relative to the underlying liquidity conditions.
● Originality and Utility
Standard volatility indicators often rely solely on price range (like Bollinger Bands). This script introduces a Stress Engine that normalizes the relationship between Price Range (True Range) and Volume. This helps distinguish between healthy price movements and liquidity-stress events (illiquidity). Furthermore, instead of using a fixed-length channel, this tool offers a Dynamic Mode that anchors the regression channel to recent pivot points, ensuring the statistical analysis aligns with the current market structure rather than an arbitrary timeframe.
● Methodology
The script operates on two distinct mathematical models:
• Illiquidity Stress Engine
The core formula calculates a raw illiquidity metric based on the log-normal distribution of the ratio between True Range and Volume. A Z-Score (standard score) is then derived from this data over a specific lookback period. High Z-Scores indicate that price is moving disproportionately fast relative to the available volume, often a signature of panic selling or euphoric buying (exhaustion).
• Linear Regression Channel
The script calculates an Ordinary Least Squares (OLS) regression line (the line of best fit) to determine the mean price trend.
Standard Deviation Bands are plotted parallel to this mean.
Pearson Correlation Coefficient (R) is calculated to quantify the strength of the linear trend. Values closer to 1 or -1 indicate a strong trend, while values near 0 indicate a chaotic or ranging market.
📑 How to Use
Traders can utilize the visual outputs for mean reversion or trend continuation context:
• Exhaustion Signals (SE / BE Labels)
SE (Seller Exhaustion): Appears when the market is in a downtrend, but the Stress Engine detects a statistical anomaly (High Z-Score) on a down candle. This suggests panic selling may be peaking.
BE (Buyer Exhaustion): Appears when the market is in an uptrend, but the Stress Engine detects high stress on an up candle, suggesting a potential blow-off top.
• Regression Channel
The dashed middle line represents the fair value (mean) of the current trend.
The outer bands represent statistical extremes. Price interacting with the outer bands (default 2 Standard Deviations) while coincident with an Exhaustion Signal provides a high-confluence area of interest.
• Metrics Dashboard
A dashboard displays the current Trend Regime, Exhaustion Status, and Channel Width (volatility percentage).
● Settings
• Exhaustion Model
Trend Filter Length: Sets the baseline EMA to determine if the market is bullish or bearish.
Stress Threshold (Sigma): The Z-Score required to trigger an exhaustion signal (default is 2.0).
• Channel Configuration
Dynamic Pivot Mode: If enabled, automatically calculates the channel length based on recent pivots. If disabled, uses the Fixed Length.
Standard Deviations: Controls the width of the inner and outer channel bands.
📖This guide explains how to interpret and utilize signals for trading:
The script is designed primarily for Mean Reversion and Exhaustion trading strategies.
● The Core Strategy: Volatility Exhaustion
The script uses a "Stress Engine" to identify when price movement is statistically overextended relative to the available liquidity (Volume).
• Setup A: The "Seller Exhaustion" (Bullish Bounce)
Look for this setup during a downtrend to catch a temporary bottom or a reversal.
Trend Condition: The dashboard shows Bearish (Price is below the trend filter).
Trigger: The label SE (Seller Exhaustion) appears below a candle.
Why? This indicates that selling pressure was intense but likely panic-driven (High Z-Score/Stress) and may be drying up.
Confluence: Ideally, this signal appears when the price is touching or piercing the Lower Channel Band (dotted or solid lines).
Action: Traders often use this as a signal to close Short positions or enter a speculative Long (counter-trend) targeting the middle line.
• Setup B: The "Buyer Exhaustion" (Bearish Pullback)
Look for this setup during an uptrend to catch a local top.
Trend Condition: The dashboard shows Bullish .
Trigger: The label BE (Buyer Exhaustion) appears above a candle.
Why? This indicates euphoric buying on low liquidity or extreme volatility that is statistically unsustainable.
Confluence: Look for price rejection at the Upper Channel Band.
Action: Traders often use this to close Long positions or enter a Short targeting the mean.
● The Filter: Trend & Correlation
The script includes a Linear Regression Channel that quantifies the quality of the trend.
• Channel Slope
If the channel is angling steeply up or down, the trend is strong.
• Pearson R (Correlation)
The script calculates the Pearson R coefficient.
Weak Correlation: If the channel turns Gray/Neutral (or the fill becomes weak), it means the correlation is below the threshold (default 0.5).
Trading Rule: Avoid trading exhaustion signals when the channel is Gray/Neutral, as the market is likely chopping sideways with no clear direction.
● Risk Management & Targets
• Stop Loss
Since this is a volatility tool, a common technique is to place stops just outside the Outer Deviation Band (the widest line). If price expands beyond the outer band with no exhaustion signal, the trend may be entering a "runaway" phase.
• Take Profit
Target 1: The Middle Regression Line (The dashed center line). Prices tend to revert to this mean after an exhaustion event.
Target 2: The opposite channel band (e.g., if you bought at the bottom, hold until the top).
● Summary of Dashboard Metrics
The table on your chart provides a quick snapshot:
Trend Regime: Tells you if you should fundamentally look for Shorts (Bearish) or Longs (Bullish).
Seller/Buyer Status: Alerts you if the current bar is EXHAUSTED or Normal .
Channel Width %: Indicates volatility. If the width is very low (percentage is small), a breakout might be imminent (squeezing). If high, be careful of chop.
⚙️ Indicator settings
• Signal Parameters
Exhaustion & Stress Model: Controls signal sensitivity.
Trend Filter: Decides if the market is Bullish or Bearish.
Stress Threshold (Sigma): Higher values (e.g., 2.5) make the script stricter, showing fewer but potentially stronger signals.
• Channel Configuration
Dynamic Pivot Mode: If ON, the channel length auto-adjusts to recent market pivots. If OFF, it uses the Fixed Length you set.
Channel Bands: Adjusts the channel width.
Outer Deviation: The boundary for "extreme" moves. Price hitting this often signals a reversal.
• Quality Filter
Filter Weak Correlations: If enabled, the channel turns gray during choppy/sideways markets to warn you not to trust trend signals.
• Visuals
Display Options: Toggles the "Stats" dashboard and adjusts volatility coloring.
● Disclaimer
All provided scripts and indicators are strictly for educational exploration and must not be interpreted as financial advice or a recommendation to execute trades. I expressly disclaim all liability for any financial losses or damages that may result, directly or indirectly, from the reliance on or application of these tools. Market participation carries inherent risk where past performance never guarantees future returns, leaving all investment decisions and due diligence solely at your own discretion.

Advanced Multi-Level S/R ZonesAdvanced Multi-Level S/R Zones: The Comprehensive Guide
1. Introduction: The Evolution of Support & Resistance:
Support and Resistance (S/R) is the backbone of technical analysis. However, traditional methods of drawing these levels are often plagued by subjectivity. Two traders looking at the same chart will often draw two different lines. Furthermore, standard indicators often treat every price point equally, ignoring the critical context of Volume and Time.
The Advanced Multi-Level S/R Zones script represents a paradigm shift. It moves away from subjective line drawing and toward Quantitative Zoning. By utilizing statistical measures of variability (Standard Deviation, MAD, IQR) combined with Volume-Weighting and Time-Decay algorithms, this tool identifies where price is mathematically most likely to react. It treats S/R not as thin lines, but as dynamic zones of probability.
2. Core Logic and Mathematical Foundation:
To understand how to use this tool optimally, one must understand the "engine" under the hood. The script operates on four distinct pillars of logic:
A. Session-Based Data Collection:
The script does not look at every single tick. Instead, it aggregates data into "Sessions" (daily bars by default logic). It extracts the High, Low, and Total Volume for every session within the user-defined lookback period. This filters out intraday noise and focuses on the macro structure of the market.
B. Adaptive Statistical Variability:
Most Bollinger Band-style indicators use Standard Deviation (StdDev) to measure width. However, StdDev is heavily influenced by outliers (extreme wicks). This script offers a sophisticated Adaptive Method-Skewness Detection: The script calculates the skewness of the price distribution. Adaptive Selection: If the data is highly skewed (lots of outliers, typical in Crypto), it switches to MAD (Median Absolute Deviation). MAD is robust and ignores outliers. If the data is moderately skewed, it uses IQR (Interquartile Range). If the data is normal (Gaussian), it uses StdDev.
Benefit: This ensures the zone widths are accurate regardless of whether you are trading a stable Forex pair or a volatile Altcoin.
C. The Weighting Engine (Volume + Time)
Not all price history is equal. This script assigns a "Weight Score" to every session based on two factors:
Volume Weighting: Sessions with massive volume (institutional activity) are given higher importance. A high formed on low volume is less significant than a high formed on peak volume.
Time Decay: Recent price action is more relevant than price action from 50 bars ago. The script applies a decay factor (default 0.85). This means a session from yesterday has 100% impact, while a session from 10 days ago has significantly less influence on the zone calculation.
D. Clustering Algorithm
Once the data is weighted, the script runs a clustering algorithm. It looks for price levels where multiple session Highs (for Resistance) or Lows (for Support) congregate.
It requires a minimum number of points to form a zone (User Input: minPoints).
It merges nearby levels based on the Cluster Separation Factor.
This results in "Primary," "Secondary," and "Tertiary" zones based on the strength and quantity of data points in that cluster.
3. Detailed Features and Inputs Breakdown:
Group 1: Main Settings
Lookback Sessions (Default: 10): Defines how far back the script looks for pivots. A higher number (e.g., 50) creates long-term structural zones. A lower number (e.g., 5) creates short-term scalping zones.
Variability Method (Adaptive): As described above, leave this on "Adaptive" for the best results across different assets.
Zone Width Multiplier (Default: 0.75): Controls the vertical thickness of the zones. Increase this to 1.0 or 1.5 for highly volatile assets to ensure you catch the wicks.
Minimum Points per Zone: The strictness filter. If set to 3, a price level must be hit 3 times within the lookback to generate a zone. Higher numbers = fewer, but stronger zones.
Group 2: Weighting
Volume-Weighted Zones: Crucial for identifying "Smart Money" levels. Keep this TRUE.
Time Decay: Ensures the zones update dynamically. If price moves away from a level for a long time, the zone will fade in significance.
ATR-Normalized Zone Width: This is a dynamic volatility filter. If TRUE, the zone width expands and contracts based on the Average True Range. This is vital for maintaining accuracy during market breakouts or crashes.
Group 3: Zone Strength & Scoring
The script calculates a "Score" (0-100%) for every zone based on:
-Point Count: More hits = higher score.
-Touches: How many times price wicked into the zone recently.
-Intact Status: Has the zone been broken?
-Weight: Volume/Time weight of the constituent points.
-Track Zone Touches: Looks back n bars to see how often price respected this level.
-Touch Threshold: The sensitivity for counting a "touch."
Group 4: Visuals & Display
Extend Bars: How far to the right the boxes are drawn.
Show Labels: Displays the Score, Tier (Primary/Secondary), and Status (Retesting).
Detect Pivot Zones (Overlap): This is a killer feature. It detects where a Support Zone overlaps with a Resistance Zone.
Significance: These are "Flip Zones" (Old Resistance becomes New Support). They are colored differently (Orange by default) and represent high-probability entry areas.
Group 5: Signals & Alerts
Entry Signals: Plots Buy/Sell labels when price rejects a zone.
Detect Break & Retest: specifically looks for the "Break -> Pullback -> Bounce" pattern, labeled as "RETEST BUY/SELL".
Proximity Alert: Triggers when price gets within x% of a zone.
4. Understanding the Visuals (Interpreting the Chart)
When you load the script, you will see several visual elements. Here is how to read them:
The Boxes (Zones)
Red Shades: Resistance Zones.
Dark Red (Solid Border): Primary Resistance. The strongest wall.
Lighter Red (Dashed Border): Secondary/Tertiary. Weaker, but still relevant.
Green Shades: Support Zones.
Dark Green (Solid Border): Primary Support. The strongest floor.
Orange Boxes: Pivot Zones. These are areas where price has historically reacted as both support and resistance. These are the "Line in the Sand" for trend direction.
The Labels & Emojis
The script assigns emojis to zone strength:
🔥 (Fire): Score > 80%. A massive level. Expect a strong reaction.
⭐ (Star): Score > 60%. A solid structural level.
✓ (Check): Score > 40%. A standard level.
"⟳ RETESTING": Appears when a zone was broken, and price is currently pulling back to test it from the other side.
The Dashboard (Top Right)
A statistics table provides a "Head-Up Display" for the asset:
High/Low σ (Sigma): The variability of the highs and lows. If High σ is much larger than Low σ, it implies the tops are erratic (wicks) while bottoms are clean (flat).
Method: Shows which statistical method the Adaptive engine selected (e.g., "MAD (auto)").
ATR: Current volatility value used for normalization.
5. Strategies for Optimum Output
To get the most out of this script, you should not just blindly follow the lines. Use these specific strategies:
Strategy A: The "Zone Fade" (Range Trading)
This works best in sideways markets.
Identify a Primary Support (Green) and Primary Resistance (Red).
Wait for price to enter the zone.
Look for the "SUPPORT BOUNCE" or "RESISTANCE REJECTION" signal label.
Entry: Enter against the zone (Buy at support, Sell at resistance).
Stop Loss: Place just outside the zone width. Because the zones are calculated using volatility stats, a break of the zone usually means the trade is invalid.
Strategy B: The "Pivot Flip" (Trend Following)
This is the highest probability setup in trending markets.
Look for an Orange Pivot Zone.
Wait for price to break through a Resistance Zone cleanly.
Wait for the price to return to that zone (which may now turn Orange or act as Support).
Look for the "RETEST BUY" label.
Logic: Old resistance becoming new support is a classic sign of trend continuation. The script automates the detection of this exact geometric phenomenon.
Strategy C: The Volatility Squeeze
Look at the Dashboard. Compare High σ and Low σ.
If the values are dropping rapidly or becoming very small, the zones will contract (become narrow).
Narrow zones indicate a "Squeeze" or compression in price.
Prepare for a violent breakout. Do not fade (trade against) narrow zones; look to trade the breakout.
6. Optimization & Customization Guide
Different markets require different settings. Here is how to tune the script:
For Crypto & Volatile Stocks (Tesla, Nvidia)
Method: Set to Adaptive (Mandatory, as these assets have "Fat Tails").
Multiplier: Increase to 1.0 - 1.25. Crypto wicks are deep; you need wider zones to avoid getting stopped out prematurely.
Lookback: 20-30 sessions. Crypto has a long memory; short lookbacks generate too much noise.
For Forex (EURUSD, GBPJPY)
Method: You can force StdDev or IQR. Forex is more mean-reverting and Gaussian.
Multiplier: Decrease to 0.5 - 0.75. Forex levels are often very precise to the pip.
Volume Weighting: You may turn this OFF for Forex if your broker's volume data is unreliable (since Forex has no centralized volume), though tick volume often works fine.
For Scalping (1m - 15m Timeframes)
Lookback: Decrease to 5-10. You only care about the immediate session history.
Decay Factor: Decrease to 0.5. You want the script to forget about yesterday's price action very quickly.
Touch Lookback: Decrease to 20 bars.
For Swing Trading (4H - Daily Timeframes)
Lookback: Increase to 50.
Decay Factor: Increase to 0.95. Structural levels from weeks ago are still highly relevant.
Min Points: Increase to 3 or 4. Only show levels that have been tested multiple times.
7. Advantages Over Standard Tools:
Feature Standard S/R Indicator, Advanced Multi-Level S/R Calculation, Uses simple Pivots or Fractals, Uses Statistical Distributions (MAD/IQR). Zone Width Arbitrary or Fixed Adaptive based on Volatility & ATR.
Context Ignores Volume Volume Weighted (Smart Money tracking).
Time Relevance Old levels = New levels Time Decay (Recency bias applied).
Overlaps Usually ignores overlaps Detects Pivot Zones (Res/Sup Flip).
Scoring None 0-100% Strength Score per zone.
8. Conclusion:
The Advanced Multi-Level S/R Zones script is not just a drawing tool; it is a statistical analysis engine. By accounting for the skewness of data, the volume behind the moves, and the decay of time, it provides a strictly objective roadmap of the market structure.
For the optimum output, combine the Pivot Zone identification with the Retest Signals. This aligns you with the underlying flow of order blocks and prevents trading against the statistical probabilities of the market.

Entry / TP / SL Alert Bands (Simple & Stable)
Get an alert before you reach your take profit or stop loss. Set as a percentage over the distance to your stop loss and take profit and improve your Money Management

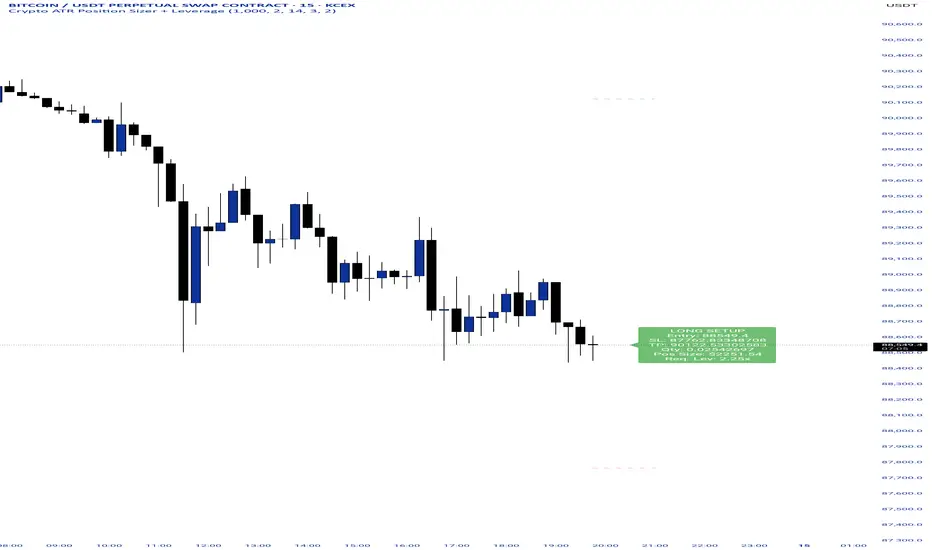
Crypto ATR Position Sizer + LeverageThis indicator is a "heads-up display" for crypto traders who need real time risk management without manually calculating position sizes. It uses Average True Range (ATR) to dynamically place Stop Losses based on current market volatility and automatically calculates the exact position size needed to respect your risk percentage.
Key Features:
Dynamic Risk Management: Stop Loss and Take Profit levels adjust automatically based on market volatility (ATR).
Auto-Position Sizing: Calculates the exact Quantity (in coins) and Position Value (in $) to ensure you never risk more than your defined percentage (e.g., 1% or 2%).
Leverage Calculator: Instantly sees the "Required Leverage" needed to execute the trade size relative to your account balance.
Crypto Precision: Displays up to 8 decimal places, making it compatible with both Bitcoin and low-sat altcoins.
Toggable Direction: Switch between Long and Short biases instantly via the settings menu.
How to Use:
Add the indicator to your chart.
Open Settings and input your Account Balance and Risk %.
Choose your direction (Long or Short) using the checkboxes.
The label will display your Entry, SL, TP, Coin Quantity, and Required Leverage in real-time.
Liquidity Sentiment Profile | LUPENIndicator Guide: Liquidity Sentiment Profile (LSP).
What is the LSP?
The Liquidity Sentiment Profile (LSP) is a "Next-Generation" oscillator designed to look beyond simple price action. While standard indicators (like RSI or MACD) primarily focus on where a candle closes, the LSP analyzes the micro-structure of the entire candle—specifically the relationship between the candle's Body, its Wicks (Shadows), and the Volume.
The Core Philosophy:
Wicks tell the truth: A long lower wick indicates that sellers pushed the price down, but buyers aggressively absorbed that liquidity and pushed it back up.
That is hidden bullish strength.
Volume validates intent: A price move with low volume is noise. A price move (or wick rejection) with high volume is a commitment by institutional players.
The LSP calculates a "Sentiment Score" between -100 and +100 based on these factors.
How to Read the Visuals
The Colors (Intensity)
color: Light Green - Bullish Acceleration. Buyers are in control, and momentum is increasing. This is the ideal time to be in a Long trade.
color: Dark Green - Bullish Deceleration. Buyers are still in control (price is likely rising), but the momentum is fading. This is a warning sign to tighten stop-losses or take profits.
color: Light Red - Bearish Acceleration. Sellers are dominating, and panic is increasing. This is the ideal time to be Short.
color: Dark Red - Bearish Deceleration. Sellers are still in control, but the downward pressure is exhausted. Be careful with new short positions.
The Lines & Fills
The Main Line: The actual LSP sentiment value.
The Yellow Signal Line: A smoothed average of the sentiment.
The Core Fill: The colored area between the Main Line and the Signal Line. When this area "glows", the trend is strong. When it dims (Dark), the trend is weak. Bearish Deceleration. Sellers are still in control, but the downward pressure is exhausted. Be careful with new short positions.
The Lines & Fills
The Main Line: The actual LSP sentiment value.
The Yellow Signal Line: A smoothed average of the sentiment.
The Core Fill: The colored area between the Main Line and the Signal Line. When this area "glows" (Neon), the trend is strong. When it dims (Dark), the trend is weak.
How to Use It (Trading Strategies)
Strategy A: The "Power Cross" (Trend Entry)
Use this for entering trends when the market wakes up.
Long Entry: Wait for the LSP line to cross ABOVE the Yellow Signal Line.
Confirmation: The fill color must turn Neon Green.
Short Entry: Wait for the LSP line to cross BELOW the Yellow Signal Line.
Confirmation: The fill color must turn Neon Red.
Strategy B: The "Absorption" Play (Reversals)
This is where the LSP shines. It detects when liquidity is being absorbed before price turns.
Bullish Absorption: The Price makes a Lower Low, but the LSP makes a Higher Low. This happens because the LSP detects the Volume on the Lower Wicks (buyers absorbing selling pressure). This is a high-probability reversal signal.
Bearish Absorption: The Price makes a Higher High, but the LSP makes a Lower High. The volume on the Upper Wicks suggests sellers are absorbing the buy orders.
Strategy C: The "Dimming" Exit (Risk Management)
Don't wait for the price to crash to exit a trade.
If you are in a Long trade (Neon Green) and the color instantly shifts to Dark Green, it means the "fuel" is running out. Consider taking partial profits or moving your Stop Loss to break even.
Standard oscillators (like RSI) often give false signals during strong trends (showing "Overbought" while price keeps going up). The LSP avoids this because it weights Volume and Wicks. If price goes up and volume increases, the LSP stays Neon Green, telling you the move is genuine, not just overextended.

Ahmed Gold Signals - 5M LIVE (Frequent)📈 Gold (XAUUSD) Trading Signals – Precision-Based Strategy
Our Gold signals are built on pure price action, not random indicators or guesswork.
🔍 How our signals are generated
We focus on:
🧲 Liquidity Sweeps
Identifying when price grabs stop-losses above highs or below lows and then reverses
📊 Clear trend direction using EMA 50 & EMA 200
✅ Strong confirmation candles after the sweep
🎯 Entries only in the direction of the trend to increase accuracy
🔵 BUY Signals
Bullish market structure
Price sweeps liquidity below recent lows
Strong bullish confirmation candle closes
➡️ High-probability BUY setup
🔴 SELL Signals
Bearish market structure
Price sweeps liquidity above recent highs
Strong bearish confirmation candle closes
➡️ High-probability SELL setup
⏱️ Timeframe
5-minute chart (5M)
Fast, precise signals ideal for scalping Gold
🛡️ Risk Management
Stop loss placed beyond the liquidity sweep
Clear take-profit targets
Risk-to-reward typically 1:2 or better
⚠️ Important Notes
We do not trade every move
We wait for confirmation
Quality over quantity — always

Smart Money Alpha Signals (Performance Dashboard) Smart Money Alpha Signals: Identifying Market Leaders & Generating Alpha
GMP Alpha Signals (Global Market Performance Alpha) is a specialized analysis tool designed not merely to find stocks that are rising, but to identify "Alpha" assets—Market Leaders that defend their price or rise even under adverse conditions where the market index falls or consolidates.
This indicator visualizes the concept of Comparative Relative Strength (RS) and Smart Money accumulation patterns, helping traders capture profit opportunities even during bearish market phases.
Key Objectives (Purpose)
Alpha Capture: Identifying assets generating 'excess returns' that outperform the market Beta.
Smart Money Tracking: Detecting traces of 'institutional buying' and 'accumulation' that defend prices during index plunges.
Decoupling Identification: Spotting assets moving on independent catalysts or momentum, regardless of the broader market direction.
Stop Hunt Filtering: Distinguishing 'fake drops' where price dips temporarily, but Relative Strength remains intact.
Dashboard Guide
Interpretation of the information panel (Table) displayed on the chart.
Rel. Performance: Shows the excess return compared to the index over the set period. (Positive/Green = Stronger than the market).
Decoupling Strength: The correlation coefficient with the index. Lower values (0 or negative) indicate movement independent of market risk.
Bullish: The count/rate of rising or limiting losses when the index drops sharply (e.g., < -0.5%). (Gold = Market Crash Leader).
Defended: The count/rate of holding support levels when the index shows mild weakness (e.g., < -0.05%). (Gold = Strong Accumulation).
Bench. Defense: The defense rate of the comparison benchmark (e.g., TSLA, ETH). Your target asset must be higher to be considered the sector leader.
Input Options & Settings Guide
You can optimize settings according to your trading style and asset class (Stocks/Crypto).
(1) Main Settings
Major Index: The baseline market index for comparison.
(US Stocks: NASDAQ:NDX or TVC:SPX / Crypto: BINANCE:BTCUSDT)
Benchmark Symbol: A competitor within the sector.
(e.g., Set NVDA when analyzing Semiconductor stocks).
Correlation Lookback: The lookback period for judging decoupling. (Default: 30)
Performance Lookback: The number of bars to calculate cumulative returns and defense rates. (Default: 60)
(2) Dashboard Thresholds
These settings define the criteria for what qualifies as "Defended" or "Bullish".
Performance (Max %): Used to find assets that haven't pumped yet. Signals trigger only when Alpha is below this value.
Defended Logic:
Index Drop Condition: The index must drop by at least this amount to start checking. (e.g., -0.05%)
Asset Buffer: How much the asset must outperform the index drop.
(Example: If Index drops -1.0% and Buffer is 0.2%, the asset must be at least -0.8% to count as 'Defended').
Bullish Logic: Measures resilience during steeper market dumps (e.g., -0.5% drop) compared to the Defended Logic.
Volume Settings: Decides whether to count Defended/Bullish instances only when accompanied by volume above the SMA.
(3) Signal Logic Settings (Crucial)
Customize conditions to trigger alerts. The choice between AND / OR is crucial.
AND: Condition must be met SIMULTANEOUSLY with other active conditions (Conservative/High Certainty).
OR: Condition triggers the signal INDEPENDENTLY (Aggressive/Opportunity Capture).
Performance: Is the relative performance within the threshold? (Basic Filter).
Decoupling: Has the correlation dropped? (Start of independent move).
Bullish Rate: Is the Bullish rate high during market dumps?
Defended Rate (High): (Recommended) Is there continuous price defense occurring? (Accumulation detection).
Defended Rate (Low): (Warning) Has the defense rate broken down? (For Stop Loss).
Defended > Benchmark: Is it stronger than the Benchmark (2nd tier)?
Volume Spike: Has volume surged compared to the average? (Institutional involvement).
RSI Oversold: Is it in oversold territory? (Counter-trend trading).
Decoupling Move: Does the current bar show the "Index Down / Asset Up" pattern?
Min USD Volume: Transaction value filter (To exclude low liquidity assets).

On Balance Volume [BrightSideTrading]
# On Balance Volume - Complete User Guide
## Overview
This enhanced OBV indicator provides clean, actionable volume analysis with intelligent signal filtering. It combines On-Balance Volume (OBV) with a smoothed signal line to identify shifts in buying and selling pressure without chart clutter.
**Key Features:**
- Real-time OBV and signal line visualization
- Smart crossover detection with confirmation filtering
- Z-Score momentum analysis
- Customizable signal alerts with V-shaped markers
- Window-normalized option for detrended analysis
---
## What is On-Balance Volume (OBV)?
OBV is a volume-based momentum indicator that accumulates volume on up days and subtracts volume on down days. It answers a fundamental question: **Is volume flowing in (buying) or out (selling)?**
**Formula:**
- If Close > Previous Close: OBV = Previous OBV + Volume
- If Close < Previous Close: OBV = Previous OBV - Volume
- If Close = Previous Close: OBV = Previous OBV (unchanged)
**What it tells you:**
- **Rising OBV** = Accumulation (smart money buying)
- **Falling OBV** = Distribution (smart money selling)
- **OBV above zero line** = Net positive buying pressure
- **OBV below zero line** = Net negative selling pressure
---
## Interface & Settings
### **MAIN VISUALIZATION**
**OBV Line (Green/Red Ribbon)**
- Green when OBV is above the signal line (bullish trend)
- Red when OBV is below the signal line (bearish trend)
- Toggles between window-normalized (detrended) and raw values
**Signal Line (Orange)**
- Smoothed average of OBV
- Crossovers with OBV generate buy/sell signals
- Default: 21-period SMA
**V-Shaped Markers**
- Green upward V = Bullish crossover (buy signal)
- Red downward V = Bearish crossover (sell signal)
- Appears at the OBV value when signal is triggered
**Zero Line (Yellow)**
- Center equilibrium point for volume balance
- Acts as support/resistance for OBV
- Separates buying pressure (above) from selling pressure (below)
---
### **SOURCE GROUP**
**Source**
- **Default:** Close
- **Options:** Open, High, Low, or any custom value
- Controls which price value triggers OBV direction changes
- Most traders use Close for standard OBV calculation
---
### **SIGNAL SMOOTHING GROUP**
**Show Signal?**
- **Default:** ON
- Toggle visibility of the signal line
- Disable if you prefer to see raw OBV only
**Smoothing Type**
- **SMA (Simple Moving Average)** - Default, standard smoothing
- **EMA (Exponential Moving Average)** - Faster response, weights recent bars more heavily
- **Choose SMA** for consistent, traditional OBV signals
- **Choose EMA** for faster trend identification (more whipsaws possible)
**Smoothing Length**
- **Default:** 21 bars
- **Range:** 1-200 bars
- **Lower values** (5-14): Faster signals, more noise
- **Higher values** (30-50): Slower signals, fewer false alarms
- **Recommendation:** Use 21-25 for most timeframes
---
### **SIGNAL FILTERING GROUP**
This is your primary control for signal quality and frequency.
**Show Signal Markers?**
- **Default:** ON
- Toggle the V-shaped buy/sell markers on/off
- Disable if markers distract from your analysis
**Signal Filter Type**
- **None** - Shows every single crossover (noisy, best for skilled traders)
- **Confirmation Bars** - Waits N bars before confirming signal (recommended)
- **Strength-Based** - Only signals during strong momentum (filters weakest moves)
#### **CONFIRMATION BARS MODE** (Recommended)
Best for reducing false signals while staying responsive to real moves.
**Confirmation Bars**
- **Default:** 2 bars
- **Range:** 1-10 bars
- Waits for the signal to hold for N consecutive bars after crossover
- **Setting 1:** Every crossover (same as "None")
- **Setting 2:** Wait 1 bar confirmation (good balance)
- **Setting 3:** Wait 2 bars confirmation (filters 50% of noise)
- **Setting 4+:** Very selective, misses quick reversals
**How it works:**
1. OBV crosses signal line → Confirmation counter starts
2. If OBV stays on correct side for 2 bars → V-marker appears
3. If OBV crosses back → Counter resets, no signal
#### **STRENGTH-BASED MODE**
Only signals when momentum is statistically significant.
**Min Z-Score Strength**
- **Default:** 0.3
- **Range:** 0.0-3.0
- Requires OBV deviation from its mean to reach this threshold
- **Setting 0.1-0.3:** More signals, lower quality
- **Setting 0.5-0.8:** Moderate signals, good quality
- **Setting 1.0+:** Only the strongest momentum shifts
**How it works:**
- Calculates how far OBV is from its 50-bar average (Z-score)
- Only shows signals when this distance is meaningful
- Automatically avoids weak, choppy market conditions
---
### **VISUALS & COLORS GROUP**
**Highlight Crossovers?**
- **Default:** ON
- Master toggle for all signal markers
- Turn OFF to see only the OBV/signal lines
**Apply Ribbon Filling?**
- **Default:** ON
- Colors the space between OBV and signal line
- Green fill = OBV above signal (bullish)
- Red fill = OBV below signal (bearish)
- Provides clear visual trend confirmation
- Turn OFF for minimal chart clutter
---
### **STATS & ZONES GROUP**
**Use Window-Normalized OBV (visual only)?**
- **Default:** ON
- Removes long-term trend from OBV for clearer short-term signals
- Detrends the indicator to highlight recent momentum changes
- **ON:** Better for swing trading and identifying reversals
- **OFF:** Better for trend-following strategies
- Note: Z-Score always uses raw OBV for statistical accuracy
**OBV Normalize Window**
- **Default:** 200 bars
- Lookback period for detrending calculation
- Larger values = more aggressive detrending
- Adjust if you want OBV to oscillate more/less around zero
**Show Z-Score (OBV)?**
- **Default:** ON
- Displays statistical momentum indicator below main chart
- Ranges from -3 to +3 (most data within -2 to +2)
- High Z-Score = Strong buying momentum
- Low Z-Score = Strong selling momentum
**Z-Score Lookback**
- **Default:** 50 bars
- Period for calculating Z-Score mean and standard deviation
- Larger = smoother Z-Score, slower response
- Smaller = noisier Z-Score, faster response
**Show ROC (OBV Momentum)?**
- **Default:** OFF
- Rate of Change indicator for OBV velocity
- Useful for identifying momentum turning points
- Enable if you want to see speed of volume changes
**ROC Lookback**
- **Default:** 14 bars
- Period for ROC calculation
**Show Z-Score StdDev Zones?**
- **Default:** ON
- Shaded regions around zero line showing statistical boundaries
- Inner Zone (±1 Z) = Normal variation
- Outer Zone (±2 Z) = Extreme moves, potential reversals
- Helps identify overbought/oversold volume conditions
**Inner Zone (±Z)**
- **Default:** 1.0
- First boundary for standard deviation zones
- Most normal trading occurs within ±1
**Outer Zone (±Z)**
- **Default:** 2.0
- Second boundary for extreme conditions
- Crossing these zones indicates significant momentum shift
---
## Trading Strategy Examples
### **Strategy 1: Signal Line Crossovers (Beginner)**
**Setup:**
- Signal Filter Type: **Confirmation Bars**
- Confirmation Bars: **2-3**
- Show Signal Markers: **ON**
**Rules:**
1. **BUY signal** (green V): When OBV crosses above signal line and holds for 2-3 bars
- Confirms buying pressure is building
- Look for price to follow within 1-3 bars
2. **SELL signal** (red V): When OBV crosses below signal line and holds for 2-3 bars
- Confirms selling pressure is increasing
- Expect price decline
3. **Exit:** Take profits at next signal or use price support/resistance
**Best For:** Swing trading, intraday reversals, timeframes 5m-1h
---
### **Strategy 2: Zero Line Bounce (Intermediate)**
**Setup:**
- Signal Filter Type: **Strength-Based**
- Min Z-Score Strength: **0.5**
- Show Z-Score StdDev Zones: **ON**
**Rules:**
1. **Watch OBV approach zero line** during established trends
- OBV bouncing repeatedly off zero = trend is healthy
- OBV breaking through zero = trend reversal imminent
2. **Enter on bounce:** Buy when OBV bounces from zero line in uptrend
3. **Exit on break:** Close position when OBV breaks below zero line
4. **Confirm with Z-Score:** Only take trades when Z-Score shows momentum (|Z| > 0.5)
**Best For:** Trend traders, identifying trend strength, medium timeframes 15m-4h
---
### **Strategy 3: Momentum Extremes (Advanced)**
**Setup:**
- Signal Filter Type: **None**
- Show Z-Score StdDev Zones: **ON**
- Outer Zone: **2.0**
**Rules:**
1. **Identify extremes:** When Z-Score breaks outer zone (±2.0)
- Indicator is in extreme territory
- Likely overextended
2. **Fade extremes:** Take opposite position when Z-Score hits extreme
- High Z (>2.0) = OBV overbought, expect pullback
- Low Z (<-2.0) = OBV oversold, expect bounce
3. **Confirm:** Wait for crossover signal to enter
4. **Target:** Outer zone of opposite side or zero line
**Best For:** Range trading, mean reversion, experienced traders only
---
## Reading the Indicator in Different Markets
### **Strong Uptrend**
- OBV consistently above signal line (green)
- OBV well above zero line, rising higher lows
- Z-Score positive, trending upward
- **Action:** Buy dips to signal line, sell at resistance
### **Strong Downtrend**
- OBV consistently below signal line (red)
- OBV well below zero line, making lower highs
- Z-Score negative, trending downward
- **Action:** Sell rallies to signal line, cover at support
### **Consolidation/Choppy Market**
- OBV whipsaws around signal line frequently
- Crossovers occur every few bars
- Z-Score oscillating between -1 and +1
- **Action:** Increase confirmation bars to 3-4, or switch to strength-based filter
### **Accumulation (Bottom Formation)**
- OBV rising while price is flat or falling
- Volume flowing in despite downtrend (bullish divergence)
- Z-Score climbing while price lows hold
- **Action:** Expect breakout up; prepare buy near support
### **Distribution (Top Formation)**
- OBV falling while price is flat or rising
- Volume flowing out despite uptrend (bearish divergence)
- Z-Score falling while price continues higher
- **Action:** Expect breakdown down; prepare short near resistance
---
## Parameter Tuning Guide
### **Aggressive Settings (More Signals)**
- Smoothing Length: 14
- Signal Filter: None or Confirmation Bars: 1
- Min Z-Score: 0.1
- Best for: Day trading, high volatility stocks
- Risk: More false signals
### **Balanced Settings (Recommended)**
- Smoothing Length: 21
- Signal Filter: Confirmation Bars: 2
- Min Z-Score: 0.3
- Best for: Swing trading, most market conditions
- Risk/Reward: Moderate
### **Conservative Settings (Fewer Signals)**
- Smoothing Length: 30-40
- Signal Filter: Confirmation Bars: 3-4 or Strength-Based: 0.7+
- Min Z-Score: 0.8
- Best for: Position trading, high-conviction trades only
- Risk: May miss some moves
---
## Common Questions & Troubleshooting
**Q: Why are there more sell signals than buy signals?**
A: This reflects the actual market action. Markets often decline faster than they rise (fear > greed). Confirm signals with price action and support/resistance.
**Q: The indicator keeps whipsawing, should I hide it?**
A: Increase Confirmation Bars to 3-4 or switch to Strength-Based filter. Market conditions matter—choppy markets require stricter filters.
**Q: What's the difference between normalized and raw OBV?**
A: Normalized (detrended) shows shorter-term momentum by removing long-term trends. Raw OBV shows absolute accumulation/distribution over the full period. Use normalized for swing signals, raw for trend confirmation.
**Q: My signals come too late. How do I get faster entry?**
A: Reduce Smoothing Length (try 14 instead of 21), use EMA instead of SMA, or set Confirmation Bars to 1. Trade-off: More false signals.
**Q: Can I use this for day trading?**
A: Yes, on 1m-5m charts with aggressive settings. Use Confirmation Bars: 1 and focus on Z-Score > 0.5 entries only.
**Q: Should I trade every signal?**
A: No. Filter signals using: price near support/resistance, multiple indicators confirming, and Z-Score showing momentum. Best signals occur at key levels.
---
## Best Practices
1. **Always confirm with price action:** OBV signals work best when price is near support, resistance, or moving average. Don't trade signals in a vacuum.
2. **Use volume context:** Check if volume is increasing or decreasing on the signal. Strong signals have volume confirmation (increasing volume on OBV spikes).
3. **Adjust settings per timeframe:**
- 1m-5m: Smoothing 12, Confirmation 1, Z-Score 0.2
- 15m-1h: Smoothing 20, Confirmation 2, Z-Score 0.3
- 4h-1d: Smoothing 25, Confirmation 3, Z-Score 0.5
4. **Watch the zero line:** It's your friend. OBV behavior at the zero line reveals trend strength. Bounces = healthy trend. Breaks = reversal.
5. **Risk management:** No indicator is perfect. Use proper position sizing and stop losses. OBV should confirm your thesis, not be the only reason to trade.
6. **Combine with other indicators:**
- Price moving averages for trend confirmation
- RSI or Stochastic for overbought/oversold levels
- Support/resistance for entry/exit zones
- MACD for momentum divergences
---
## Disclaimer
This indicator is for educational and informational purposes only. It is not financial advice. Past performance does not guarantee future results. Always conduct your own research and consult with a financial advisor before making trading decisions. Trading carries risk, including potential loss of principal.
---
## Version History
**Version 1.0** - Initial release with enhanced signal filtering, Z-Score analysis, and customizable parameters.
