Supertrend with Extreme SignalsOriginality and Usefulness
The "Supertrend with Extreme Signals" indicator is an innovative tool I've developed to combine the strengths of the Supertrend indicator with the RSI (Relative Strength Index). This combination enhances the accuracy of entry and exit signals, making it more useful for traders looking to gain a comprehensive understanding of market conditions.
Justification for Mashup:
Supertrend: This is a trend-following indicator that identifies the current market trend and potential reversal points by adjusting dynamically based on market volatility.
RSI: A momentum oscillator that measures the speed and change of price movements. It helps pinpoint overbought and oversold conditions, adding an extra layer of confirmation to trend signals.
By merging these two indicators, the script filters out false signals and improves the precision of trade entries and exits. The Supertrend identifies the trend direction, while the RSI confirms the strength and potential reversals within that trend.
Description
Overview
The "Supertrend with Extreme Signals" indicator is a powerful hybrid tool that brings together the trend-following capability of the Supertrend and the momentum analysis of RSI. This integration provides clear buy and sell signals, helping traders make more informed decisions.
What It Does
Trend Identification: Utilizes the Supertrend to determine the prevailing market trend.
Signal Confirmation: Uses RSI to confirm signals by identifying overbought and oversold conditions.
Buy and Sell Signals: Generates buy signals when the price crosses above the Supertrend line and RSI indicates oversold conditions. Generates sell signals when the price crosses below the Supertrend line and RSI indicates overbought conditions.
How It Works
Supertrend Calculation:
Calculates the Average True Range (ATR) to assess market volatility.
Computes upper and lower levels based on the mid-price and ATR.
Determines trend direction by smoothing these levels over a specified period.
Dynamically adjusts the Supertrend value based on market conditions.
RSI Calculation:
Calculates the RSI over a defined period to measure price momentum.
Uses RSI levels to identify overbought (above 70) and oversold (below 30) conditions.
Signal Generation:
Buy Signal: Triggered when the price crosses above the Supertrend line and RSI is below the oversold threshold.
Sell Signal: Triggered when the price crosses below the Supertrend line and RSI is above the overbought threshold.
How to Use It
Trend Following: Use the Supertrend color to identify the current trend (green for uptrend, red for downtrend).
Entry Signals: Look for buy signals (green label) when the price crosses above the Supertrend line and RSI is in the oversold zone.
Exit Signals: Look for sell signals (red label) when the price crosses below the Supertrend line and RSI is in the overbought zone.
Visual Confirmation: The background color changes based on the trend direction, providing a quick visual cue for the current market state.
This script is especially useful for traders who combine trend-following strategies with momentum indicators. It helps filter out false signals and provides a robust framework for identifying profitable trading opportunities.
Concepts Underlying Calculations
ATR (Average True Range): Measures market volatility by calculating the average range of price movements over a specified period.
Supertrend: A trend-following indicator that adjusts dynamically based on market volatility.
RSI (Relative Strength Index): A momentum oscillator that measures the speed and change of price movements, helping to identify overbought and oversold conditions.
By combining these concepts, the "Supertrend with Extreme Signals" indicator offers a balanced approach to trading. It considers both trend direction and market momentum, making it a powerful tool for improving trading performance through informed market analysis.
Поиск скриптов по запросу "supertrend"

Supertrend Channel Histogram OscillatorThis histogram is based on the script "Supertrend Channels "
The idea of the indicator is to visually represent the interaction of price with several different supertrend channels of various lengths in an oscillator in order to make it much more clear to the trader how the longer trends are interacting with shorter trends of the price movement of an asset. I got this idea from the "Kurutoga Cloud" and "Kurutoga Histogram" by D7R which is based on the centerlines of 3 Donchian Channels, however after I started using the Supertrend Channel by LuxAlgo I found that it was a more reliable price range channel than a standard Donchian Channel and I made this indicator to accompany it.
This indicator plots a positive value above 0 when the price is above the centerline of the supertrend channel and a negative value below 0 when the price is below the centerline.
The first supertrend's length and multiple can be adjusted in the settings.
The given supertrend input is then doubled and quadrupled in both length and multiplication so that a supertrend histogram with the values of 3, 3 will be accompanied by 2 additional supertrend histograms with the values of 6, 6 and 12, 12.
The larger price trend histograms are clearly visible behind the short term supertrend channel's histogram, giving traders a balanced view of short and long term trends interacting. The less visible columns of the larger trend remain above or below the 0 line behind the more visible short term channel trend, helping to spot pullbacks within a larger trend.
Additionally, when the 3 separate histograms are all positive or all negative but the histogram columns are separating from each other this can indicate a potential trend exhaustion leading to reversal or pullback about to happen.
The overbought and oversold lines at 50 and -50 are representative primarily of the short term trend with above 50 or below -50 indicating that the price is pushing the boundary and potentially beginning a new short term supertrend in the opposite direction. If values do not noticably exceed these levels, then the current short term trend movement can be viewed as a pullback within a larger trend, with continuation potentially to follow.
I have had troubles converting the original code to v6 so this will be published here in v5 of pinescript to be used in conjunction with the original. I was intending to create a companion indicator for this oscillator that represents 3 supertrends with corresponding 2x and 4x calculations based on LuxAlgo's script, but I can't seem to get it to work correctly in v5.
For best visualization of the trends 3 LuxAlgo Supertrend channels with 2x and 4x values should be used in conjunction with each other to fully visualize the histogram.
Used in conjunction with other indicators this can be a very effective strategy to capture larger trend moves and pullbacks within trends, as well as warn of potential price trend exhaustion.
Supertrend Filtered SniperSupertrend + QQE MOD + DEMA + VWAP Multi-Confluence Strategy
A professional-grade indicator combining multiple technical confluences for high-probability trade signals
━━━━━━━━━━━━━━━━━━━━━━━━━━━━━━━━━━━━━━━━━━━
📊 OVERVIEW
This indicator combines 4 powerful technical systems into one comprehensive trading tool. It only generates signals when ALL confluences agree, resulting in fewer but higher-quality trade opportunities. Perfect for day traders, scalpers, and prop firm challenges.
✅ Signals only fire when ALL conditions align:
- Both Supertrends bullish/bearish
- Price on correct side of DEMA 200
- QQE MOD confirmation
- Optional: VWAP filter, ADX filter, RSI filter, Session filter
━━━━━━━━━━━━━━━━━━━━━━━━━━━━━━━━━━━━━━━━━━━
🔧 CORE COMPONENTS
1. Dual Supertrend System
- Supertrend #1: Primary trend identification (default: 10 period, 2.0 multiplier)
- Supertrend #2: Fast trend + exit signal (default: 1 period, 2.0 multiplier)
- Both must agree for entry signals
- ST2 flip triggers automatic exit signals
2. DEMA 200 Filter
- Double Exponential Moving Average for major trend direction
- Longs only: Price above DEMA
- Shorts only: Price below DEMA
- Gradient visualization shows trend strength
3. QQE MOD (Quantitative Qualitative Estimation)
- Advanced momentum oscillator with Bollinger Bands
- Identifies strong directional moves
- Filters out weak/choppy conditions
- Based on dual RSI calculations with dynamic thresholds
4. VWAP Filter (Optional)
- Volume Weighted Average Price for institutional flow
- Longs only: Above VWAP
- Shorts only: Below VWAP
- Ensures you trade with institutional momentum
━━━━━━━━━━━━━━━━━━━━━━━━━━━━━━━━━━━━━━━━━━━
⚙️ ADDITIONAL FILTERS
Session Filter
Choose which trading sessions to allow signals:
- Asian: 6PM - 3AM EST (Tokyo hours)
- London: 3AM - 8AM EST (London open)
- New York: 8AM - 4PM EST (US market hours)
- After Hours: 4PM - 6PM EST
- Enable multiple sessions or just one - your choice!
ADX Filter (Optional)
- Only take signals when ADX > threshold (default 18)
- Ensures strong trending conditions
- Filters out ranging/choppy markets
RSI Filter (Optional)
- Avoid overbought longs (>80 RSI)
- Avoid oversold shorts (<20 RSI)
- Prevents counter-trend entries at extremes
━━━━━━━━━━━━━━━━━━━━━━━━━━━━━━━━━━━━━━━━━━━
📈 HOW TO USE
Entry Signals:
- BUY: Green "BUY" label appears when all bullish confluences align
- SELL: Red "SELL" label appears when all bearish confluences align
- Signals only fire once per setup (no repetitive alerts)
Exit Signals:
- EXIT: Orange "X" appears when Supertrend #2 flips direction
- Automatic exit logic built-in
- Can also exit at predetermined R:R targets
Status Table:
- Real-time confluence dashboard
- Shows each indicator's current state
- Green checkmarks = conditions met
- Easy visual confirmation before entering
━━━━━━━━━━━━━━━━━━━━━━━━━━━━━━━━━━━━━━━━━━━
🎨 VISUAL FEATURES
- Gradient Supertrend lines with transparency
- Color-coded candles based on DEMA position
- Automatic highlighting of trend zones
- Clear BUY/SELL/EXIT labels
- Yellow VWAP line (toggleable)
- Professional status table with checkmarks
- Small circles mark Supertrend direction changes
━━━━━━━━━━━━━━━━━━━━━━━━━━━━━━━━━━━━━━━━━━━
🔔 ALERT SYSTEM
Pre-configured alerts for:
- BUY Signal Confirmed
- SELL Signal Confirmed
- EXIT Long Position
- EXIT Short Position
- Any Entry Signal (combined)
- Any Exit Signal (combined)
Set once-per-bar-close alerts for automated trading
━━━━━━━━━━━━━━━━━━━━━━━━━━━━━━━━━━━━━━━━━━━
⚠️ RISK DISCLAIMER
This indicator is a tool for analysis and should not be used as the sole basis for trading decisions. Always:
- Backtest thoroughly before live trading
- Use proper risk management (1% rule)
- Consider market conditions and fundamentals
- Practice on demo accounts first
- Never risk more than you can afford to lose
Past performance does not guarantee future results.
━━━━━━━━━━━━━━━━━━━━━━━━━━━━━━━━━━━━━━━━━━━
📝 CREDITS
Original concept inspired by UNITED's confluence strategy
Enhanced and coded by jaredskii with assistance from ChatGPT
QQE MOD calculations based on standard QQE indicator methodology

SuperTrend (5,1,5) By satish SWhy 3 Supertrends?
Short-term Supertrend (7, 1, 3) → reacts quickly, catches early trend changes but can give more false signals.
Medium-term Supertrend (14, 1, 2) → smoother, filters out noise.
Long-term Supertrend (21, 1, 3) → confirms major trend direction, fewer whipsaws.
How it Works
Trend Reversal Detection
If all three flip in the same direction → strong confirmation of trend change.
If only the short-term flips but others don’t → possible false signal, wait for confirmation.
Entry Signal Example
Buy when all three turn green (Supertrend below price).
Sell/short when all three turn red (Supertrend above price).
Exit / Partial Profit
Exit when the shortest one (7, 1, 3) flips against your position — protects profits in choppy markets.
TradingView Setup
You can do this by:
Adding Supertrend three times.
Setting their (Period, Multiplier, ATR Type) to:
ST1: 7, 1, 3
ST2: 14, 1, 2
ST3: 21, 1, 3
Use different colors or line styles for each so you can spot alignment quickly.
SuperTrend (5,1,5) BY Satish SWhy 3 Supertrends?
Short-term Supertrend (7, 1, 3) → reacts quickly, catches early trend changes but can give more false signals.
Medium-term Supertrend (14, 1, 2) → smoother, filters out noise.
Long-term Supertrend (21, 1, 3) → confirms major trend direction, fewer whipsaws.
How it Works
Trend Reversal Detection
If all three flip in the same direction → strong confirmation of trend change.
If only the short-term flips but others don’t → possible false signal, wait for confirmation.
Entry Signal Example
Buy when all three turn green (Supertrend below price).
Sell/short when all three turn red (Supertrend above price).
Exit / Partial Profit
Exit when the shortest one (7, 1, 3) flips against your position — protects profits in choppy markets.
TradingView Setup
You can do this by:
Adding Supertrend three times.
Setting their (Period, Multiplier, ATR Type) to:
ST1: 7, 1, 3
ST2: 14, 1, 2
ST3: 21, 1, 3
Use different colors or line styles for each so you can spot alignment quickly.

SuperTrend with 3 Inputs SatishWhy 3 Supertrends?
Short-term Supertrend (7, 1, 3) → reacts quickly, catches early trend changes but can give more false signals.
Medium-term Supertrend (14, 1, 2) → smoother, filters out noise.
Long-term Supertrend (21, 1, 3) → confirms major trend direction, fewer whipsaws.
How it Works
Trend Reversal Detection
If all three flip in the same direction → strong confirmation of trend change.
If only the short-term flips but others don’t → possible false signal, wait for confirmation.
Entry Signal Example
Buy when all three turn green (Supertrend below price).
Sell/short when all three turn red (Supertrend above price).
Exit / Partial Profit
Exit when the shortest one (7, 1, 3) flips against your position — protects profits in choppy markets.
TradingView Setup
You can do this by:
Adding Supertrend three times.
Setting their (Period, Multiplier, ATR Type) to:
ST1: 7, 1, 3
ST2: 14, 1, 2
ST3: 21, 1, 3
Use different colors or line styles for each so you can spot alignment quickly.

Supertrend + MACD Trend Change with AlertsDetailed Guide
1. Indicator Overview
Purpose:
This script combines the Supertrend and MACD indicators to help you detect potential trend changes. It plots a Supertrend line (green for bullish, red for bearish) and marks the chart with shapes when a trend reversal is signaled by both indicators. In addition, it includes alert conditions so that you can be notified when a potential trend change occurs.
How It Works:
Supertrend: Uses the Average True Range (ATR) to determine dynamic support and resistance levels. When the price crosses these levels, it signals a possible change in trend.
MACD: Focuses on the crossover between the MACD line and the signal line. A bullish crossover (MACD line crossing above the signal line) suggests upward momentum, while a bearish crossover (MACD line crossing below the signal line) suggests downward momentum.
2. Supertrend Component
Key Parameters:
Factor:
Function: Multiplies the ATR to create an offset from the mid-price (hl2).
Adjustment Impact: Lower values make the indicator more sensitive (producing more frequent signals), while higher values result in fewer, more confirmed signals.
ATR Period:
Function: Sets the number of bars over which the ATR is calculated.
Adjustment Impact: A shorter period makes the ATR react more quickly to recent price changes (but can be noisy), whereas a longer period provides a smoother volatility measurement.
Trend Calculation:
The script compares the previous close with the dynamically calculated upper and lower bands. If the previous close is above the upper band, the trend is set to bullish (1); if it’s below the lower band, the trend is bearish (-1). The Supertrend line is then plotted in green for bullish trends and red for bearish trends.
3. MACD Component
Key Parameters:
Fast MA (Fast Moving Average):
Function: Represents a shorter-term average, making the MACD line more sensitive to recent price movements.
Slow MA (Slow Moving Average):
Function: Represents a longer-term average to smooth out the MACD line.
Signal Smoothing:
Function: Defines the period for the signal line, which is a smoothed version of the MACD line.
Crossover Logic:
The script uses the crossover() function to detect when the MACD line crosses above the signal line (bullish crossover) and crossunder() to detect when it crosses below (bearish crossover).
4. Combined Signal Logic
How Signals Are Combined:
Bullish Scenario:
When the MACD shows a bullish crossover (MACD line crosses above the signal line) and the Supertrend indicates a bullish trend (green line), a green upward triangle is plotted below the bar.
Bearish Scenario:
When the MACD shows a bearish crossover (MACD line crosses below the signal line) and the Supertrend indicates a bearish trend (red line), a red downward triangle is plotted above the bar.
Rationale:
By combining the signals from both indicators, you increase the likelihood that the detected trend change is reliable, filtering out some false signals.
5. Alert Functionality
Alert Setup in the Code:
The alertcondition() function is used to define conditions under which TradingView can trigger alerts.
There are two alert conditions:
Bullish Alert: Activated when there is a bullish MACD crossover and the Supertrend confirms an uptrend.
Bearish Alert: Activated when there is a bearish MACD crossover and the Supertrend confirms a downtrend.
What Happens When an Alert Triggers:
When one of these conditions is met, TradingView registers the alert condition. You can then create an alert in TradingView (using the alert dialog) and choose one of these alert conditions. Once set up, you’ll receive notifications (via pop-ups, email, or SMS, depending on your settings) whenever a trend change is signaled.
6. User Adjustments and Their Effects
Factor (Supertrend):
Adjustment: Lowering the factor increases sensitivity, resulting in more frequent signals; raising it will filter out some signals, making them potentially more reliable.
ATR Period (Supertrend):
Adjustment: A shorter ATR period makes the indicator more responsive to recent price movements (but can introduce noise), while a longer period smooths out the response.
MACD Parameters (Fast MA, Slow MA, and Signal Smoothing):
Adjustment:
Shortening the Fast MA increases sensitivity, generating earlier signals that might be less reliable.
Lengthening the Slow MA produces a smoother MACD line, reducing noise.
Adjusting the Signal Smoothing changes how quickly the signal line responds to changes in the MACD line.
7. Best Practices and Considerations
Multiple Confirmation:
Even if both indicators signal a trend change, consider confirming with additional analysis such as volume, price action, or other indicators.
Market Conditions:
These indicators tend to perform best in trending markets. In sideways or choppy conditions, you may experience more false alerts.
Backtesting:
Before applying the indicator in live trading, backtest your settings to ensure they suit your trading style and the market conditions.
Risk Management:
Always use proper risk management, including stop-loss orders and appropriate position sizing, as alerts may occasionally produce late or false signals.
Happy trading!

SuperTrend Momentum TableMy goal creating this indicator : Provide a way to see the Past and Current Momentum of multiple different timeframes without using multiple charts.
The Underlying Concept / What is Momentum?
The Momentum shown is derived from a Mathematical Formula, SUPERTREND. When price closes above Supertrend Its bullish Momentum when its below Supertrend its Bearish Momentum.This indicator scans for bullish & bearish Momentum on the Timeframes selected by the user and when there is a shift in momentum on any of those time frames (price closes below or above SUPERTREND ) it notifies the trader with a color change on the Momentum Table.
Back Testing: This indicator will be key for back testing with the since the SuperTrend Momentum Table shows you the visual shift in momentum. Giving the Trader a Clear visual on how Each Support and Resistance Level was made .
Technical Inputs
- If you want to optimize the rate of signals to better fit your trading plan you would change the Factor input and ATR Length input. Increase factor and ATR Length to decrease the frequency of signals and decrease the Factor and ATR Length to increase the frequency of signals.
Quick TIP! : You can Sync all VFX SuperTrend Indicators together! All VFX SuperTrend indicators display unique information but its all derived from that same Momentum Formula. Keep the Factor input and ATR Length the same on other VFX SuperTrend indicators to have them operating on the same data.
Timeframe Inputs
- The indicator has 7 Time frame Displays where you can choose which Time Frames you would like to monitor.
- You can limit the amount of time frames being displayed by changing the Time Frame Amount
Display Inputs
- The trader can specify the bullish and bearish color of all 7 Timeframes
- You can toggle (on or off) the Momentum Switch if you want to highlight the exact candle where momentum switched from bullish to bearish and from bearish to bullish .
How it can be Used ? Check the momentum of other Timeframes and use that information as a variable to structure your trading plan.
- Use Momentum information to track the trend
- Plan and limit trades based on the current Momentum of multiple timeframes
- See if you have higher momentum to fuel your trades
- See breakouts on Multiple Time Frames
Supertrend Targets [ChartPrime]The Supertrend Targets indicator combines the concepts of trend-following with dynamic volatility-based target levels. It takes core simple and classical concepts and provides actionable insights. The core of this indicator revolves around the "Supertrend" algorithm, which essentially uses the Average True Range (ATR) and a multiplier to determine if the price of a financial instrument is in an uptrend or downtrend. The indicator generates various plot points on the trading chart, which traders can use to make informed trading decisions.
Users can set several input parameters such as the source price, custom levels, multiplier scale, length of the average true range, and the window length. Traders can also opt to enable a table that shows numeric target data by percentiles, risk ratio, take profit and stop loss points.
The generated plots and fills on the chart represent various levels of potential gains and drawdowns, acting as potential targets for taking profit or stopping losses. These include the 25th, 50th, 75th, 90th, and 100th percentiles, which are adjustable by scale. There are also plots for average gain and drawdown levels, enhanced by standard deviation curves if enabled.
The Supertrend line indicators are color-coded for ease of understanding: blue for bullish performance and orange for bearish performance. The "Center Line" represents the point at which traders might consider entering a position.
Lastly, the script presents a summary table (when enabled) at the right side of the chart displaying numeric data of the plotted targets. This data provides additional insights on the risk-reward balance for each percentile, helping traders to execute their strategies more effectively.
Here's a comprehensive breakdown of its functionalities and features:
Inputs:
Source: Determines the price series type (e.g., Close, Open, High, Low, etc.).
Show Trailing Stop: Option to display the trailing stop on the chart.
Levels: Sets the number of target levels you want to display. Can range from -5 to 5.
Scale: A scaling factor for adjusting targets, can be between 1 to 100.
Window Length: Length for the target computation, determines how many bars will be considered.
Unique: Ensures every data point used in calculations is unique.
Multiplier: Multiplier for the ATR (Average True Range) to compute the SuperTrend.
ATR Length: Period for the ATR computation.
Custom Level: Allows users to set their own levels using various statistics like Average, Average + STDEV, Percentile, or can be disabled.
Percent Rank: Determines the percentile rank for targeting.
Enable Table: Enables or disables a table display.
Methods:
Flag: Identifies bullish and bearish trend reversals.
Target Percent: Determines the expected price movement (both gains and drawdowns) based on historical trend reversals.
Value Percent: Computes the percentage difference between the current price and the entry price during trend reversals.
Plots:
Multiple target lines are plotted on the chart to visualize potential gain and drawdown levels. These levels are adjusted based on user settings. Additionally, the main Supertrend line is plotted to indicate the prevailing trend direction.
Gain Levels: Target levels which show potential upside from the current price.
Drawdown Levels: Target levels which represent potential downside from the current price.
SuperTrend Line: A line that adjusts based on price volatility and trend direction, acting as a dynamic support or resistance.
In conclusion, the "Supertrend Targets " indicator is a powerful tool that combines the principle of trend-following with dynamic targets, providing traders with insights into potential future price movements. The range of customization options allows traders to adapt the indicator to different trading strategies and market conditions.

SuperTrend Entry(My goal creating this indicator) : Provide a way to enter the market systematically, automatically create Stop Loss Levels and Take Profit Levels, and provide the position size of each entry based on a fix Percentage of the traders account.
The Underlying Concept :
What is Momentum?
The Momentum shown is derived from a Mathematical Formula, SUPERTREND. When price closes above Supertrend Its bullish Momentum when its below Supertrend its Bearish Momentum. This indicator scans for candle closes on the current chart and when there is a shift in momentum (price closes below or above SUPERTREND) it notifies the trader with a Bar Color change.
Technical Inputs
- If you want to optimize the rate of signals to better fit your trading plan you would change the Factor input and ATR Length input. Increase factor and ATR Length to decrease the frequency of signals and decrease the Factor and ATR Length to increase the frequency of signals.
Quick TIP! : You can Sync all VFX SuperTrend Indicators together! All VFX SuperTrend indicators display unique information but its all derived from that same Momentum Formula. Keep the Factor input and ATR Length the same on other VFX SuperTrend indicators to have them operating on the same data.
Display Inputs
- The indicator has a candle overlay option you can toggle ON or OFF. If toggled ON the candles color will represent the momentum of your current chart ( bullish or bearish Momentum)
your able to change the colors that represent bullish or bearish to your preference
- You can toggle on which shows the exact candle momentum switched sides
your able to change the colors that represent a bullish switch or bearish switch to your preference
- The trader can specify which point you would like your stop loss to reference. (Low and High) Which uses the Low of the Momentum signal as the reference for your Stop Loss during buy signals and the High as the reference during sell signals. Or (Lowest Close and Highest Close) which uses the Lowest Close of the Momentum signal as the reference for your Stop Loss during buys and the Highest Close as the reference during sells.
- The colors that represent your Stop Loses and Take Profits can also be changed
Risk Management Inputs
- Your Risk MANAGMENT section is used to set up how your Stop Loss and Take Profit are calculated
- You have the option to take in account Volatility when calculating your Stop Loss. A adjusted ATR formula is used to achieve this. Increase Stop Loss Multiplier from 0 to widen stops.
- Increase Take Profit Multiplier from 0 to access visual Take Profit Levels based on your Stop Loss. This will be important for traders that Prefer trading using risk rewards. For Example: If the the Take Profit Multiplier is 3 a Take Profit level 3 times the size or your stop loss from your entry will be shown and a price number corresponding to that Take Profit Level becomes available.
- Enter your current Account size, Bet Percentage and Fixed Spread to get your Position Size for each trade
-Toggle on the Current Trade Chart and easily get the size of your Position and the exact price of your Take Profit and Stop Loss.
You can increase the Size of the Current Trade Chart= Tiny, Small, Normal, Large, Huge and change the Position of the Current
trade Chart to your preference, (Top- Right, Center, Left) (Middle- Right, Center, Left) (Bottom- Right, Center, Left).
How it can be used ?
- Enter Trades and always know where your stop is going to be
- Eliminate the need to manual calculate Position Size
- Get a consistent view of the current charts momentum
- Systematical enter trades
- Reduce information overload

Supertrend with Target Price & ATREE [SS]Hey everyone,
Releasing this supertrend mashup indicator.
This is your basic supertrend, but with two additions:
1. The integration of the ATREE technical probability modeller; and
2. The use of ATR price targets for crossovers
ATREE
ATREE stands for Advanced Technical Range Expectancy Estimator. It has its very own indicator available here . If you are not that familiar with it, I would suggest heading over to that page and reading about it, because it gives you the in-depth details.
But for a recap, ATREE uses technical indicators such as RSI, Stochastics or Z-Score to predict the likely sentiment, whether it be bullish or bearish. The indicator allows you to select the ATREE model type and supports 3 separate probability models based on either:
1. RSI
2. Stochastics; or
3. Z-Score
If you want to know which model is most effective for the ticker and timeframe you are using, you can launch up the native ATREE indicator and review the backtesting results to ascertain which model performs optimally for that particular ticker on that particular timeframe.
When ATREE assesses the sentiment as bearish, you will get a red fill. When it assesses the sentiment as bullish, you will get a green fill. This will help you adjust your bias to focus on either dip buying or rip shorting.
The ATREE timeframe is also customizable, so you can pull data from higher timeframes than you are on.
ATR Price Targets
As with my EMA 9/21 crossover with the target price, this is essentially the same concept. When the trend shifts to bullish or bearish, bull and bear targets will be printed so you know where to look for potential reversal and you can also set realistic target prices if you are scalping or day trading.
Supertrend
The last and base feature is the supertrend. The supertrend settings are customizeable.
It will provide a green line for uptrend and a redline for downtrend, the basic supertrend functionality.
And that's the indicator!
Let me know what you think and hope you enjoy!
Safe trades as always!

SuperTrend Adaptive (STD Smooth)Supertrend Adaptive (Smoothed StdDev)
Supertrend Adaptive is a refined trend-following indicator based on the classic Supertrend. It enhances the original by incorporating smoothed standard deviation into the volatility calculation, instead of relying solely on ATR. This hybrid approach enables more responsive and adaptive trend detection, reducing noise and false signals in volatile or ranging markets. The indicator also features confidence-weighted signal labels and a clean, uncluttered display, making it practical for any trading timeframe.
🔍 Detailed Methodology and Conceptual Foundation
Unlike traditional Supertrend indicators that use only absolute volatility (ATR) to define trend bands, this version blends standard deviation — a relative volatility measure — into the calculation. Standard deviation helps capture the dispersion of price, not just its range, and when smoothed, it filters out erratic jumps caused by sudden spikes or drops.
This fusion creates trend bands that expand and contract dynamically based on recent price variability. As a result:
Fewer whipsaws : The trend bands adjust to both low and high volatility environments, which helps avoid unnecessary signal flips during consolidation.
Stronger trend adherence : Signals are less reactive to momentary price movements. This allows the indicator to hold positions longer in trending markets, giving traders the opportunity to ride extended moves.
Bollinger Band-style adaptation : By including standard deviation, this indicator behaves similarly to Bollinger Bands — accounting for relative price change rather than absolute moves alone.
These enhancements make the tool suitable not only for identifying directional bias, but also for refining entries and exits with more context-aware volatility filtering.
📈 How to Use the Indicator
Trend Direction: The script draws a colored line beneath (uptrend) or above (downtrend) price. Green indicates bullish trend, red indicates bearish.
Buy/Sell Labels: Only the most recent signal is shown to reduce clutter:
🟢 Green "Buy" label = trend reversal to bullish, with strong confidence.
🔵 Blue "Buy" label = same reversal, but with lower volume confidence.
🔴 Red "Sell" label = trend reversal to bearish, with strong confidence.
🟠 Orange "Sell" label = bearish signal with lower volume confidence.
These color codes are derived from comparing current volume to its average — a higher-than-average volume gives greater confidence to the signal.
Settings:
ATR Period: Controls the smoothing window for volatility calculation.
ATR Multiplier: Adjusts the size of the trend bands.
Std Smooth: Controls smoothing applied to standard deviation to reduce jitter.
Change ATR Method: Option to toggle between default and smoothed ATR.
Show Signals: Toggle for label display.
📢 Alerts
The script includes three built-in alert conditions:
Buy Signal: Triggered when the trend flips to bullish.
Sell Signal: Triggered when the trend flips to bearish.
Trend Direction Change: Alerts on any switch in trend regardless of confidence level.
These alerts allow traders to automate notifications or integrations with bots or trading platforms.
🧼 Clean Chart Display
To ensure clarity and comply with best practices:
The chart shows only this indicator.
Trend lines are drawn in real time for visual context.
Only one label per direction is shown — the most recent one — to keep the chart readable.
No drawings or unrelated indicators are included.
This setup ensures the script’s signals and structure are immediately understandable at a glance.
📌 Best Use Cases
This tool is designed for:
Traders who want adaptive volatility filters instead of rigid ATR-based models.
Scalpers and swing traders who prefer clean charts with minimal lag and fewer false signals.
Any asset class — works well on crypto, FX, and equities.
Shortcoming of this tool is sideway price action (will be tackled in next versions).
Credit for www.tradingview.com the version which this script extends.

SuperTrend Support & Resistance(My goal creating this indicator) : Provide a way to categorize and label key structures on multiple time frames so I can create a plan based on those observable facts.
The Underlying Concept / What is Momentum?
The Momentum shown is derived from a Mathematical Formula, SUPERTREND. When price closes above Supertrend Its bullish Momentum when its below Supertrend its Bearish Momentum. On the first bar bearish momentum is detected a resistance Level is made at the highest point of the previous bullish condition. On the first bar bullish momentum is detected a support Level is made at the lowest point of the previous bearish condition. As I become a better analyst I will find better techniques and this source code may become open-source, but as of now it remains protected. This indicator scans for bullish & bearish Momentum on the Timeframes selected by the user and when there is a shift in momentum on any of those time frames (price closes below or above SUPERTREND ) it notifies the trader with a Supply or Demand level with a unique color and Size to signify the severity of said level.
What is Severity?
Severity is How we differentiate the importance of different Highs and Lows. If Momentum is detected on a higher timeframe the Supply or Demand Level is updated. The Color and Size representing that higher timeframe will be shown. Demand and Supply Levels made by higher Timeframes are more SEVERE then a demand level made by a lower Timeframe.
Technical Inputs
- If you want to optimize the rate of signals to better fit your trading plan you would change the Factor input and ATR Length input. Increase factor and ATR Length to decrease the frequency of signals and decrease the Factor and ATR Length to increase the frequency of signals.
- to ensure the correct calculation of Support and Resistance levels change BAR_INDEX. BAR_INDEX creates a buffer at the start of the chart. For example: If you set BAR_INDEX to 300. The script will wait for 300 bars to elapse on the current chart before running. This allows the script more time to gather data. Which is needed in order for our dynamic lookback length to never return an error(Dynamic lookback length cant be negative or zero). The lower the timeframe the greater the amount of bars need. For Example if I open up a 30 sec chart I would enter 5000 as my BAR_INDEX since that will provide enough data to ensure the correct calculation of Support and Resistance levels.
Time Frame Inputs
- The indicator has 3 Time Frame Displays where you can choose how SEVERE You want the Supply and Demand Levels. For Example: 1min, 3min, 5min, 15 min Levels, 60 min levels Weekly Levels, etc.....The higher the Timeframe Selected the more SEVERE the Level.
- Use the Amount of time Frames input to increase or limit the amount of time frames that will be displayed onto the chart.
Display Inputs
- The toggle (Trend or Basic) option Lets the trend determine the colors of the Support and Resistance Levels or Basic where the color is strictly based on if its a high or a low ( Trend = HH,HL,LL,LH)
- Toggle options (Close) and (High & Low) creates Support and Resistance Levels using the Lowest close and Highest close or using the Lowest low and Highest high.
Toggle on both or toggle off both in order to use both these values when determining the trend of your chart. For Example this would mean (Price has to close higher then the highest high. Not only make a higher high or a
higher close) and the inverse (Price has to close lower then the lowest low. Not only make a lower low or a lower close)
How Trend Is being Determined ?
(Previous Supply Level > Current Supply Level ) if this statement is true then its s LH so the trend is bearish if this statement is false then its a HH so the trend is bullish
(Previous Demand Level > Current Demand Level ) if this statement is true then its a LL so the trend is bearish if this statement is false then its a HL so the trend is bullish
(Close > Current Supply Level ) if this statement is true technically price made a HH so the trend is bullish
(Close < Current Demand Level ) if this statement is true technically price made a LL so the trend is bearish
- Fully customize how you display and label Market Structure in specific timeframes. Line Length, Line Width, Line Style, Label Distance, Label Size, Label Background Size, and Background Color can all be customized.
- Lastly Is the Trend Chart. To Easily verify the current trend of any timeframes displayed by this indicator toggle on Chart On/Off . You also get the option to change the Chart Position and the size of the Trend Chart
*****The Current charts timeframe has to lower then a month to ensure correct calculation of Supply and Demand Levels*****
How it can be used ?
(Examples of Different ways you can use this indicator) : Easily categorize the severity of each and every Supply or Demand Level in the market (The higher the time frame the stronger the level)
: Quickly Determine the trend of any Timeframe
: Get a consistent view of a market and how different time frames are behaving but just use one chart.
: Take the discretion from hand drawing support and resistance lines out of your trading
: Find and categorize strong levels for potential breakouts
: Trend Analysis, Use multiple time frames to create a narrative based on observable facts from these time frames
: Different Targets to take money off the table
: Use labels to differentiate between different trend line setups
: Find Great places to move your stop loss too.

Supertrend Alert with Arrows and Time FilterOverview
This script is designed to generate trading signals based on the Supertrend indicator, a popular technical analysis tool. The Supertrend indicator is used to identify the direction of the market trend and potential reversal points.
Supertrend Settings
The script uses two sets of Supertrend settings:
Small Supertrend
Factor: 3.0
ATR Period: 10
Big Supertrend
Factor: 10.0
ATR Period: 30
These settings are fixed and should not be altered to maintain the integrity of the signal generation process.
Configurable Parameters
startHour: The hour at which signal generation begins.
endHour: The hour at which signal generation ends.
These parameters allow users to focus on specific trading hours, optimizing the signal relevance to their trading strategy.
Signal Types
The script generates two types of signals:
Type 1: Reversal Signal
Long Signal: Triggered when the big Supertrend is in an uptrend, and the small Supertrend transitions from a downtrend to an uptrend.
Short Signal: Triggered when the big Supertrend is in a downtrend, and the small Supertrend transitions from an uptrend to a downtrend.
Type 2: Trend Change Signal
Long Signal: Triggered when the big Supertrend changes from a downtrend to an uptrend.
Short Signal: Triggered when the big Supertrend changes from an uptrend to a downtrend.
How the Script Works
Initialization: The script initializes with predefined Supertrend settings.
Data Input: Market data (e.g., price data) is fed into the script.
Supertrend Calculation: The script calculates the Supertrend values using the predefined factors and ATR periods.
Signal Detection: The script monitors the Supertrend values and detects the defined signals based on the conditions mentioned above.
Time Filtering: Signals are filtered based on the specified startHour and endHour, ensuring only relevant signals are displayed within the desired timeframe.
Usage
Set Parameters: Define startHour and endHour according to your trading schedule.
Run Script: Execute the script with market data input.
Interpret Signals: Monitor the generated signals and use them to inform your trading decisions.
Originality
Dual Supertrend Usage: The use of both a small and a big Supertrend to generate signals adds a layer of complexity and reliability to the signals.
Time-Based Filtering: Allows traders to focus on specific trading hours, enhancing the relevance and accuracy of signals.
Two Signal Types: The combination of reversal signals and trend change signals provides comprehensive market insights.
Conclusion
This Supertrend Signal Generator is a robust tool for traders seeking to leverage the Supertrend indicator for more informed trading decisions. By combining dual Supertrend settings and configurable trading hours, the script offers unique and flexible signal generation capabilities.

SuperTrend Oscillator MTF█ OVERVIEW
SuperTrend Oscillator MTF is a multi-timeframe version of the classic SuperTrend converted into an oscillator. Instead of drawing the SuperTrend line on the price chart, it displays the distance of the close from the SuperTrend line simultaneously for the current timeframe and two additional timeframes. This allows you to instantly see the trend direction and strength across three selected timeframes in a single window.
█ CONCEPT
The classic SuperTrend value is subtracted from price and normalized so that trend direction can be directly compared across different timeframes without switching charts.
- Value above zero = price below SuperTrend line → bearish trend
- Value below zero = price above SuperTrend line → bullish trend
- The further away from zero, the stronger the trend.
█ FEATURES
- Three SuperTrend Oscillator lines: current TF, TF1 and TF2
- Automatic detection of 3-timeframe agreement
- BUY and SELL labels that appear only when all three timeframes turn in the same direction at the same moment
- Circle signals on every zero-line cross of the current timeframe
- Configurable soft gradient fill (can be disabled)
- Zero line changes color (green/red/gray) depending on 3-TF agreement
- Fully customizable colors for each timeframe
- Built-in alerts for all signal types
█ HOW TO USE
Add the indicator to the chart → set two additional timeframes and adjust ATR Period and Factor to suit your trading style.
Main settings:
- ATR Period → default 10
- Factor → default 3.0 (higher = fewer signals)
- TF 1 and TF 2 → any timeframes (e.g. 1H+4H, 4H+D, D+W, etc.)
- Enable gradient → turn fill on/off
- Show BUY/SELL labels (3 TF agreement) → enable/disable the strongest signals
Interpretation:
Two types of signals:
- Green/red circles → current timeframe changes trend direction (faster signal)
- BUY/SELL labels → all three timeframes simultaneously switch to the same direction (strongest confluence)
- Additionally, the zero line turns green or red when all three trends are aligned.
█ APPLICATIONS
Perfect for:
- Trend-following with multi-timeframe confirmation
- Filtering false breakouts on lower timeframes
- Scalping & day trading (use fast circle signals)
- Swing & position trading (wait for full 3-TF agreement)
Best combined with:
- Support/resistance levels and supply/demand zones – enter long after a confirmed breakout and retest of a key level (e.g. Change of Character, Break of Structure, Order Block, 0.618–0.786 Fibonacci) only when the oscillator shows 3-TF agreement or at least a bullish circle. Hold the trade to the next significant resistance/supply zone.
- Volume and Volume Profile – confirm move strength with rising volume and high-volume nodes at the breakout level. Declining volume while moving away from zero may signal trend exhaustion.
- Classic oscillators (RSI, Stochastic, MACD) – use primarily for spotting divergences and overbought/oversold conditions. One of the safest exits is when a regular or hidden divergence appears on RSI/Stochastic in an extreme zone, even if SuperTrend Oscillator MTF still shows alignment.
█ NOTES
- Works on all markets and all timeframes
- BUY/SELL labels (3-TF agreement) are the cleanest and strongest signals
- Circle signals are faster but more prone to noise
- Higher ATR Period = fewer signals, higher quality

SuperTrend Fusion — Trend + Momentum + Volatility FilterSuperTrend Fusion — Trend + Momentum + Volatility Filter
SuperTrend Fusion — ATP is an original, multi-factor trend-filtering tool that enhances the classic SuperTrend by combining three market dimensions in one unified model:
1. Trend direction (SuperTrend)
Provides the base trend structure using ATR-based volatility bands.
2. Momentum confirmation (Average Force – adapted)
An adapted version of an open-source “Average Force” concept published on TradingView by racer8.
This component measures where closing price sits relative to recent highs/lows, smoothed to capture directional pressure.
3. Market condition filtering (Choppiness Index)
Filters out sideways, non-trending zones where SuperTrend alone typically produces false flips.
Together, these components create a cleaner, more selective system that focuses on higher-quality SuperTrend reversals, avoiding the most common whipsaws that occur during low-momentum or high-choppiness periods.
🔍 How it Works
A long signal occurs when:
- SuperTrend flips from downtrend to uptrend
- Momentum (AF) is positive (optional filter)
- The market is trending and not excessively choppy (optional filter)
A short signal triggers under the symmetrical conditions.
Filtered signals are visually marked with subtle “X” markers so traders can understand when a raw SuperTrend flip was rejected by the filters.
The indicator also includes:
Enhanced styling for better visibility
Colored bars during valid signals
Optional background highlight during choppy periods
🎯 What This Indicator Is Designed For
This tool aims to:
- Improve the quality of SuperTrend entries
- Remove many low-probability signals
- Help traders visually identify when the market has the momentum and structure required for cleaner trend continuation
It is not intended to predict markets or guarantee accuracy; rather, it provides structure and clarity for decision-making based on technical rules.
⚙️ Inputs
- ATR Length & Factor (SuperTrend)
- Average Force Period & Smoothing
- Choppiness Length & Threshold
- Option to enable/disable each filter individually
📘 Credits
This script includes an adapted version of an open-source “Average Force” function originally published on TradingView by its author, racer8.
SuperTrend and Choppiness Index components are derived from classical, public-domain formulas.
📌 Important Notes
This indicator is not a strategy and does not guarantee performance.
Signals are based on historical calculations only and do not use lookahead.
Past performance does not guarantee future results.
Always test different assets and timeframes before using in live conditions.
👍 Recommended Usage
For a clean experience:
- Use on standard candlestick charts
- Avoid non-standard chart types (Renko, Heikin Ashi, Kagi, Range)
- Combine with your own risk management and trade planning

Supertrend + Stochastic RSIThe Supertrend + Stochastic RSI indicator is designed for scalping and short-term trading, combining the trend-following power of the Supertrend with the momentum insights of the Stochastic RSI to generate reliable buy and sell signals. This indicator aims to reduce false signals by requiring confirmation from both trend direction and momentum, making it suitable for traders targeting quick, high-probability trades in fast-moving markets on lower timeframes (e.g., 1-minute to 15-minute charts).
How It Works
The indicator integrates two technical components to produce actionable signals:
Supertrend for Trend Direction:
The Supertrend, calculated with a default length of 10 and a factor of 3.0, identifies the prevailing trend. It plots a line above or below the price, turning green when the trend is bullish (price above Supertrend) and red when bearish (price below Supertrend). This helps traders stay aligned with the market’s direction, reducing trades against the trend.
Stochastic RSI for Momentum Confirmation:
The Stochastic RSI, computed over a 14-period RSI with 3-period smoothing for %K and %D lines, measures momentum. A buy signal is generated when the %K line crosses above the oversold level (default: 20), indicating potential upward momentum, while a sell signal occurs when %K crosses below the overbought level (default: 80), suggesting downward momentum.
Signal Generation
Signals are produced only when both conditions align, using the previous bar’s values to prevent repainting:
Buy Signal: The Stochastic RSI %K crosses above the oversold level, and the Supertrend confirms a bullish trend (price above Supertrend). Displayed as a green upward triangle below the bar.
Sell Signal: The Stochastic RSI %K crosses below the overbought level, and the Supertrend confirms a bearish trend (price below Supertrend). Displayed as a red downward triangle above the bar.

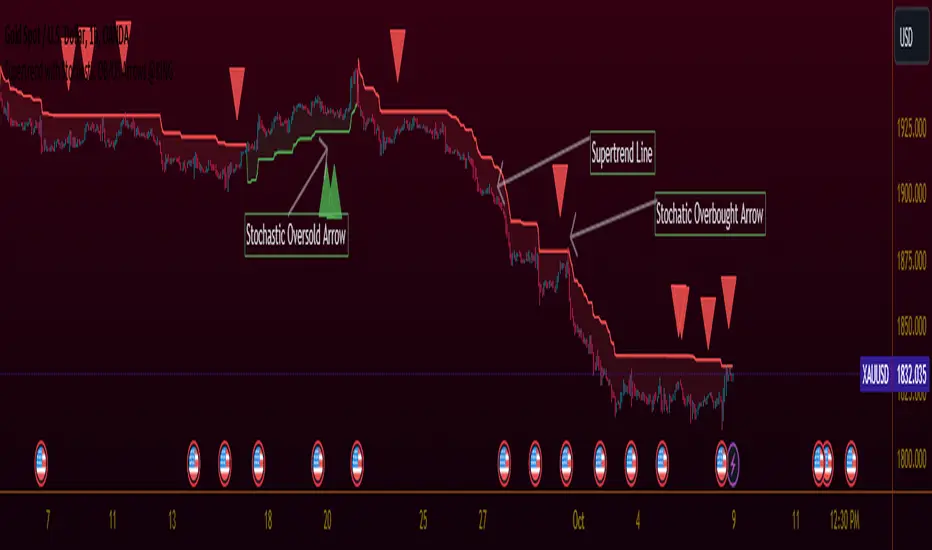
Supertrend with Stochastic OB/OS Arrows @KING
TradingView Idea: Supertrend with Stochastic Arrows @KING
Overview:
- Combining the Supertrend indicator with Stochastic arrows for a comprehensive market
view, providing insights into trend direction and potential reversal points.
Supertrend Settings:
- ATR Length: The length parameter for calculating the Average True Range (ATR).
- Factor: A multiplier used to determine the distance of the Supertrend line from the
price.
Supertrend Display:
The Supertrend is color-coded:
- During an uptrend, it is displayed in green .
- During a downtrend, it is displayed in red .
- The body of the candlesticks is filled with color during the corresponding trend direction.
Stochastic Settings:
- K Length: The period length for the %K line in the Stochastic oscillator.
- K Smoothing: Smoothing factor for %K.
- D Smoothing: Smoothing factor for %D.
- Overbought Level: The threshold indicating an overbought condition.
- Oversold Level: The threshold indicating an oversold condition.
Arrows:
- Buy arrows are displayed below the bars during a downtrend when Stochastic is below the
oversold level.
- Sell arrows are displayed above the bars during an uptrend when Stochastic is above the
overbought level.
Supertrend Display:
- The Supertrend line is plotted with a color change based on its direction.
- The body of the candlesticks is filled with green during an uptrend and red during a downtrend.
Usage:
- Traders can use this script to identify potential entry and exit points, leveraging the
insights provided by both the Supertrend indicator and Stochastic oscillator. This
combination aims to capture trend strength and potential reversal opportunities.
Supertrend Ravi Shinde📌 Multi-Timeframe Supertrend (MFT Supertrend)
This indicator is a refined version of the classic Supertrend, designed with multi-timeframe flexibility for traders who rely on higher-timeframe confirmation while trading lower charts.
🔑 Key Features:
Multi-Timeframe Analysis: Apply Supertrend from any higher timeframe (e.g., use 15m, 1h, or 1d Supertrend on a 5m chart).
Clear Trend Identification:
🔴 Price below Supertrend → Bearish trend.
🟢 Price above Supertrend → Bullish trend.
Customizable Parameters: Input ATR length, ATR multiplier, and timeframe of your choice.
Visual Simplicity: Clean chart display with no clutter – just the essential Supertrend line.

SuperTrend V · AI Buy/Sell超级趋势 V · AI 买卖 + 止盈提示简介 / Overview
中文:
本指标在经典 SuperTrend 上加入了体量价差(VPT)平滑与“参考均线”过滤,给出 AI 买入/卖出 信号(规则化的过滤逻辑,非机器学习),并在价格触及动态止盈通道时打出 “止盈” 圆点。每笔信号之间自动跟踪并标注 峰值收益(可显示杠杆倍数),用于回顾交易潜在的最大浮盈。适合趋势/波段交易与告警联动。
English:
This indicator enhances classic SuperTrend with VPT-style smoothing and a reference EMA filter to emit AI Buy/Sell signals (rule-based, not ML). It plots TP dots when price hits a dynamic take-profit channel and labels the Peak Profit reached between opposite signals (with optional leverage display). Designed for trend/swing trading and alerts.
使用方法 / How to Use
中文:
将指标加到任意品种图表(默认 15 分钟~4 小时均可)。
观察两条“参考均线”:红线=参考均线、蓝线=开盘均线。当红线在蓝线上方时偏多,反之偏空(图中填充区也会切色)。
AI 买入:价格向上穿越 SuperTrend 线,且收盘价位于蓝线之上;AI 卖出:价格向下穿越 SuperTrend 线,且收盘价位于蓝线之下。
出现 “止盈” 圆点(TP)代表价格触达动态带(基于线性回归+σ通道)。可作为分批止盈/加减仓的参考。
当下一次出现相反方向的 AI 信号时,会在本轮交易的峰值位置打出 “峰值收益 xx% (100x)” 标签,用于复盘。
需要自动提醒:在图表右键 → “添加告警”,选择本指标并挑选相应条件(见“告警条件”)。
English:
Add the indicator to any symbol/timeframe (15m–4h recommended).
Use the two reference EMAs (red = reference, blue = open EMA). Red above blue favors long bias and vice versa.
AI Buy: price crosses above the SuperTrend line and closes above the blue EMA. AI Sell: crosses below and closes below the blue EMA.
TP dots appear when price touches the dynamic channel (linear-regression VWAP ± σ). Use them for partial take-profit or scaling.
On the next opposite AI signal, a Peak Profit xx% (100x) label is placed at the highest/lowest excursion for review.
For alerts: Right-click chart → “Add Alert” → choose this script and a condition (see “Alert conditions”).
主要参数 / Key Inputs
中文:
参考时间框架(分钟):用于参考均线与平滑的更高周期(默认 720 分=12H)。
SuperTrend 乘数 / 周期:决定 ST 线的灵敏度与带宽;乘数越小越敏感。
止盈倍数(σ)、止盈窗口长度:决定 TP 圆点通道的宽度与回溯长度。
显示峰值收益标签、杠杆(仅用于文本显示):是否显示“峰值收益”,以及标签内显示的 x 倍数。
English:
Reference timeframe (minutes) for smoothing/EMAs (default 720 = 12H).
SuperTrend Multiplier / Period control sensitivity and band width.
TP Sigma, TP Window Length define the dynamic channel.
Show Peak Profit, Leverage (text only) toggle the label and x-multiplier text.
告警条件 / Alert Conditions
中文:买入、卖出、卖出止盈触发(低位 TP)、买入止盈触发(高位 TP)。
English: Buy, Sell, TP on Short (low band cross up), TP on Long (upper band cross down).
参数建议 / Tuning Tips
中文:
加密 15m:ST 乘数 1.0~1.5、周期 10~14;TP σ=2、窗口 100~200。
趋势强:可增大乘数/窗口,减少噪音;震荡多:减小乘数/窗口,提高敏感度但留意假信号。
English:
Crypto 15m: ST mult 1.0–1.5, period 10–14; TP σ=2, window 100–200.
Strong trend: increase mult/window to cut noise. Choppy: decrease for responsiveness (watch for whipsaw).
交易提示 / Trading Notes
中文:AI 标签仅为规则化过滤,不代表模型预测;建议结合更大周期方向与量能确认。止盈圆点可做分批减仓,切勿仅依赖单一信号。
English: “AI” labels are rule-based filters, not ML predictions. Combine with higher-TF bias/volume. Use TP dots for scaling; avoid single-signal decisions.

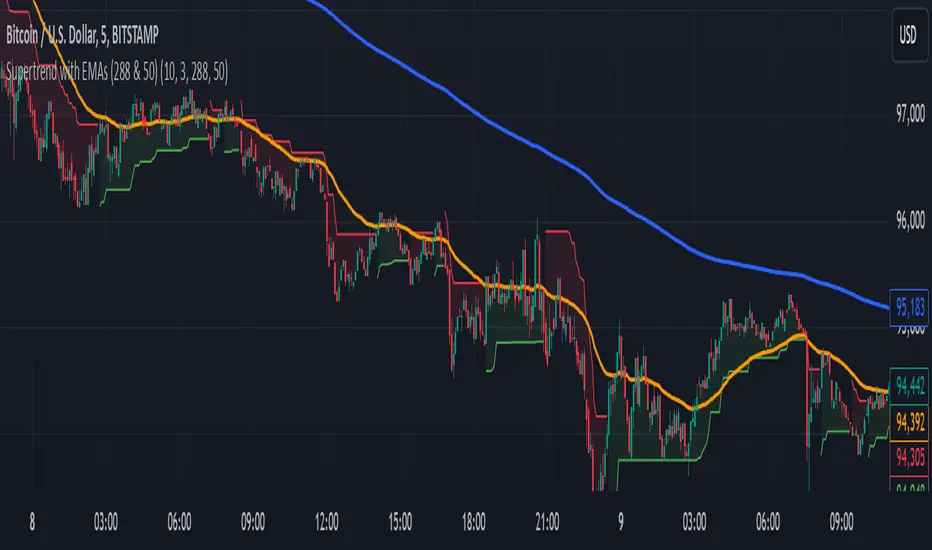
Supertrend with EMAs (288 & 50)This indicator combines the Supertrend with two key Exponential Moving Averages (EMAs) — the 50 EMA and the 288 EMA — to help traders identify trends and possible entry or exit points in the market.
Key Features:
Supertrend Indicator:
The Supertrend indicator is a widely used trend-following tool. It helps determine whether the market is in an uptrend or downtrend by adjusting based on the Average True Range (ATR).
In this indicator, green represents an uptrend, and red represents a downtrend.
288 EMA:
The 288-period Exponential Moving Average is plotted to show the long-term market trend. It reacts more quickly to recent price changes than a simple moving average, offering an effective way to gauge long-term market direction.
50 EMA:
The 50-period Exponential Moving Average is commonly used as a short-term trend indicator. It helps identify shorter-term trends and serves as a dynamic support/resistance level.
EMA Crossover Alerts:
This indicator includes alerts for when the 50 EMA crosses above the 288 EMA (bullish signal) and when it crosses below (bearish signal), helping traders catch trend reversals or confirmation of current trends.
Supertrend Alerts:
Alerts are triggered when the Supertrend indicator switches from uptrend to downtrend or downtrend to uptrend, indicating a potential shift in market direction.
Usage:
Uptrend Confirmation: When the Supertrend is green and the 50 EMA is above the 288 EMA, it signals that the market is in a strong bullish trend.
Downtrend Confirmation: When the Supertrend is red and the 50 EMA is below the 288 EMA, it indicates that the market is in a bearish trend.
Crossover Signals: The indicator provides alerts when the 50 EMA crosses above or below the 288 EMA, helping traders spot trend changes.
Best For:
Trend-following strategies
Identifying potential trend reversals and market shifts
Traders looking for a combination of short-term and long-term trend analysis
Note: This indicator is most effective when used in conjunction with other technical analysis tools and should be considered alongside other factors such as volume, support/resistance levels, and price action.
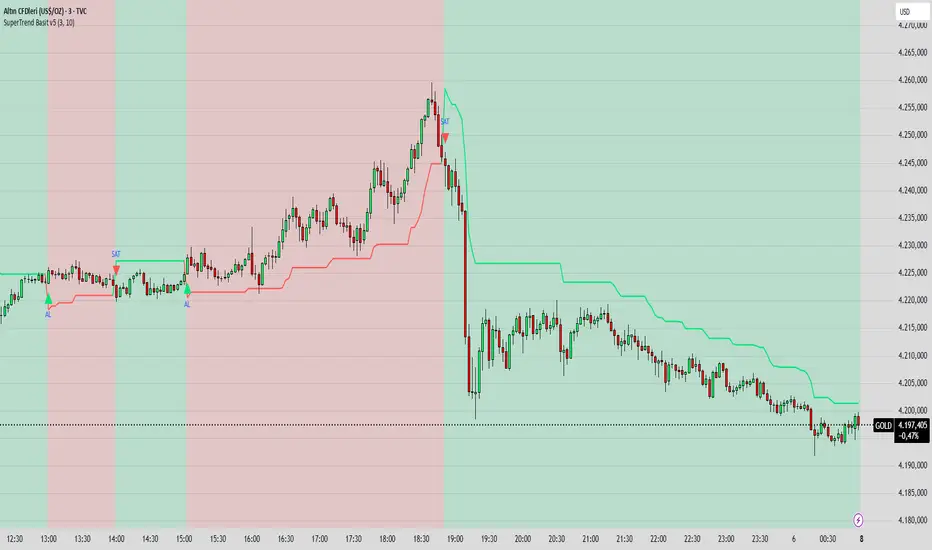
SuperTrend Basit BY İNCEBACAK//@version=5
indicator("SuperTrend Basit v5", overlay=true)
// === Girdi ayarları ===
factor = input.float(3.0, "ATR Katsayısı")
atrPeriod = input.int(10, "ATR Periyodu")
// === Hesaplamalar ===
= ta.supertrend(factor, atrPeriod)
// === Çizim ===
bodyColor = direction == 1 ? color.new(color.lime, 0) : color.new(color.red, 0)
bgcolor(direction == 1 ? color.new(color.lime, 85) : color.new(color.red, 85))
plot(supertrend, color=bodyColor, linewidth=2, title="SuperTrend Çizgisi")
// === Al/Sat sinyali ===
buySignal = ta.crossover(close, supertrend)
sellSignal = ta.crossunder(close, supertrend)
plotshape(buySignal, title="AL", location=location.belowbar, color=color.lime, style=shape.triangleup, size=size.small, text="AL")
plotshape(sellSignal, title="SAT", location=location.abovebar, color=color.red, style=shape.triangledown, size=size.small, text="SAT")
Supertrend + MACD with Advanced FiltersDetailed Guide
1. Indicator Overview
Purpose:
This enhanced indicator combines Supertrend and MACD to signal potential trend changes. In addition, it now includes several extra filters for more reliable signals:
Multi-Timeframe (MTF) Confirmation: Checks a higher timeframe’s trend.
ADX (Momentum) Filter: Ensures the market is trending strongly.
Dynamic Factor Adjustment: Adapts the Supertrend sensitivity to current volatility.
Volume Filter: Verifies that current volume is above average.
Each filter can be enabled or disabled according to your preference.
How It Works:
The Supertrend calculates dynamic support/resistance levels based on ATR and an adjustable factor, while MACD identifies momentum shifts via its crossovers. The additional filters then confirm whether the conditions meet your criteria for a trend change. If all enabled filters align, the indicator plots a shape and triggers an alert.
2. Supertrend Component with Dynamic Factor
Base Factor & ATR Period:
The Supertrend uses these inputs to compute its dynamic bands.
Dynamic Factor Toggle:
When enabled, the factor is adjusted by comparing the current ATR to its simple moving average. This makes the indicator adapt to higher or lower volatility conditions, helping to reduce false signals.
3. MACD Component
Parameters:
Standard MACD settings (Fast MA, Slow MA, Signal Smoothing) determine the responsiveness of the MACD line. Crossovers between the MACD line and its signal line indicate potential trend reversals.
4. Multi-Timeframe (MTF) Filter
Function:
If enabled, the indicator uses a higher timeframe’s simple moving average (SMA) to confirm the prevailing trend.
Bullish Confirmation: The current close is above the higher timeframe SMA.
Bearish Confirmation: The current close is below the higher timeframe SMA.
5. ADX Filter (Momentum)
Custom Calculation:
Since the built-in ta.adx function may not be available, a custom ADX is calculated. This involves:
Determining positive and negative directional movements (DMs).
Smoothing these values to obtain +DI and -DI.
Calculating the DX and then smoothing it to yield the ADX.
Threshold:
Only signals where the ADX exceeds the set threshold (default 20) are considered valid, ensuring that the market is trending strongly enough.
6. Volume Filter
Function:
Checks if the current volume exceeds the average volume (SMA) multiplied by a specified factor. This helps confirm that a price move is supported by sufficient trading activity.
7. Combined Signal Logic & Alerts
Final Signal:
A bullish signal is generated when:
MACD shows a bullish crossover,
Supertrend indicates an uptrend,
And all enabled filters (MTF, ADX, volume) confirm the signal.
The bearish signal is generated similarly in the opposite direction.
Alerts:
Alert conditions are set so that TradingView can notify you via pop-up, email, or SMS when these combined conditions are met.
8. User Adjustments
Toggle Filters:
Use the on/off switches for MTF, ADX, and Volume filters as needed.
Parameter Tuning:
Adjust the ATR period, base factor, higher timeframe settings, ADX period/threshold, and volume multiplier to match your trading style and market conditions.
Backtesting:
Always backtest your settings to ensure that they perform well with your strategy.