Qullamaggie Breakout V2After publishing the Qullamaggie Breakout script and seeing that it had some decent results, I wanted to explore it a bit further. There were a few things I didn't like about that methodology that didn't really jive with the way I like to trade. So what I did was combined the Breakout Trend Follower strategy I had been using for entries with the Qullamaggie strategy for trailing stops once in profit. The results seem pretty good to me and an approach that fits my personality and something I can actually trade. Typically better profit than the Breakout Trend Follower by giving more room for your winners to run, while still protecting your entries by moving up the trailing stop until you are in profit, all while taking less trades, so that's great.
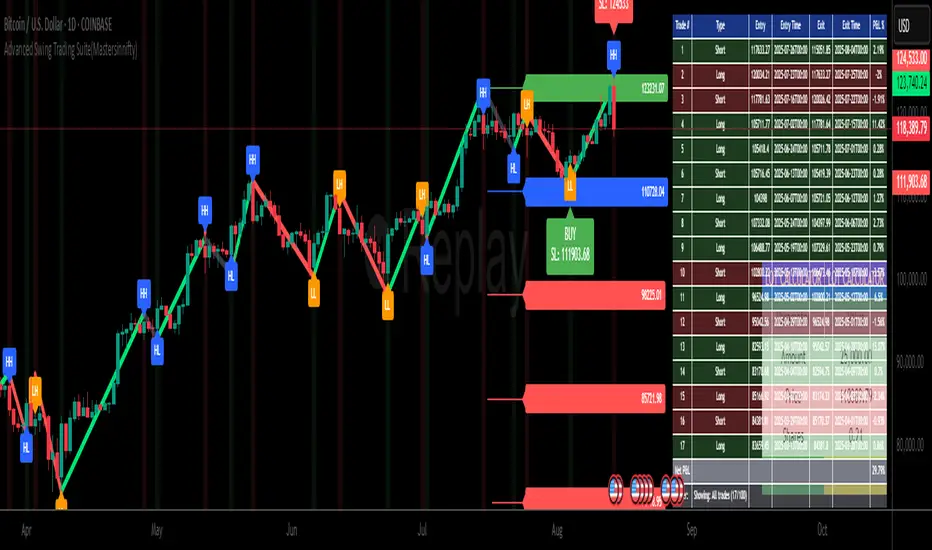
Everything is done with stop orders. So you set your buy stop at the recent swing high point and wait for a breakout. Once in a position you set your sell stop at the recent swing low point. The most recent swing high and low are shown on the chart for easy reference with the blue and orange horizontal lines. Once in a trade, trail your sell stop after a new swing low is registered (shown by the thicker orange stop line). Once you are in profit, leave that hard stop level there (the orange line will stay there helping you). Now, you wait for price to cross a Moving Average of your choosing (default is Daily 10 MA). Once the bar crosses that moving average, you move your stop to the low of that candle (shown by the blue stop line) and trail your stop along every crossing of the moving average until the trend changes and takes out your stop. So managing this trade is pretty easy...just wait for the stop lines to move and move your stop with them. It's a great way to trade when you can't be at your computer all the time because the stop orders take care of execution on both buy and sell side. If you use a daily timeframe for your moving averages (the default), you really only need to move stops around about once a day, so is a good part time trader's strategy in my opinion.
The best opportunities will come by scanning for stocks in the longer term timeframe of your moving averages. Wait for a consolidation on that timeframe so the anticipated breakout has some room to run. Once you've identified a good candidate, zoom in to your lower timeframe where the swing highs/lows will act as your entry and exit points, all while keeping the moving averages consistent between timeframes.
Hope you guys find it useful.
A few options available:
- Choose any timeframe for your moving averages, while using swing high/low points on intraday charts.
- Choose one of two moving averages shown for your trailing stops (default 10 and 20 MA).
- Choose to use the third moving average as a filter for keeping you out of trades that are below it (trading with the trend).
- Use the charts resolution candle or the moving average resolution candle for the moving average trailing stop.
- Only take trades where your buy level minus stop level is below a % of the Average Daily Range (ADR). This allows you to potentially have better risk/reward. I added a little table that shows the ADR of the stock/ticker as well as the range between the recent buy and sell levels (shown by the orange and blue horizontal lines) for easy reference.
Поиск скриптов по запросу "swing high low"

Scalper - Pattern Recognition & Price Action with Divergence Scalper - Pattern Recognition & Price Action with Divergence
Overview
An educational indicator designed to demonstrate comprehensive technical analysis concepts through integrated pattern recognition, price action analysis, and divergence detection. This tool combines traditional candlestick patterns with modern institutional concepts and advanced divergence analysis for educational market study.
Educational Purpose & Originality
Core Educational Concepts
This indicator serves as a learning platform for understanding:
- **Pattern Recognition Methodology**: Systematic identification of candlestick formations
- **Price Action Theory**: Modern institutional footprint analysis
- **Divergence Analysis**: Momentum divergence detection across multiple oscillators
- **Confluence Systems**: Multi-signal integration and validation techniques
Original Implementation Features
1. Enhanced Pattern Detection Library
- **Volatility-Filtered Patterns**: ATR-based validation for pattern significance
- **Volume-Confirmed Formations**: Integration of volume analysis with pattern detection
- **Multi-Candle Pattern Recognition**: Three-candle formations and complex patterns
- **Context-Aware Detection**: Patterns validated against market structure
2. Advanced Divergence System
- **Multi-Oscillator Analysis**: RSI, CCI, and MACD divergence detection
- **Four Divergence Types**: Regular bullish/bearish and hidden bullish/bearish
- **Pivot-Based Detection**: Systematic swing high/low identification
- **Weighted Signal Integration**: Divergences integrated into confluence scoring
3. Modern Price Action Concepts
- **Fair Value Gaps (FVG)**: Identification of institutional inefficiencies
- **Order Block Detection**: Volume-validated accumulation/distribution zones
- **Dynamic Support/Resistance**: Touch-count validated levels with ATR tolerance
- **Breakout Analysis**: Volume-confirmed price breakouts
4. Intelligent Confluence System
- **Multi-Signal Aggregation**: Combines patterns, oscillators, divergences, and breakouts
- **Weighted Scoring Algorithm**: Different signal types receive appropriate weighting
- **Visual Confluence Display**: Clear indication of high-probability setups
- **Reason Tracking**: Shows which signals contribute to confluence
How to Use
Initial Configuration
1. **Enable Desired Components**: Toggle individual analysis modules based on learning focus
2. **Adjust Sensitivity Settings**: Configure pattern detection parameters for your market
3. **Select Divergence Options**: Choose oscillators and divergence types to monitor
4. **Set Confluence Requirements**: Define minimum signals needed for confirmation
Component Settings
Moving Average Configuration
- Four customizable MA lines for multi-timeframe trend analysis
- Selectable MA types (SMA, EMA, WMA, VWMA, HMA)
- Independent timeframe settings for each MA
Pattern Recognition Settings
- **Engulfing Patterns**: Strong engulfing with ATR validation
- **Doji Variations**: Standard, gravestone, and dragonfly detection
- **Hammer/Hanging Man**: Context-validated reversal patterns
- **Star Formations**: Morning and evening star patterns
- **Three Soldiers/Crows**: Momentum continuation patterns
Divergence Detection Parameters
- **Lookback Period**: Adjustable swing detection range
- **Minimum Pivot Strength**: Percentage threshold for valid pivots
- **Oscillator Selection**: RSI, CCI, MACD, or combination
- **Divergence Types**: Regular and hidden divergences
Signal Interpretation
Visual Indicators
- **Pattern Labels**: Clear marking of detected formations
- **Divergence Lines**: Visual connection between price and oscillator pivots
- **Support/Resistance Levels**: Dynamic horizontal levels with validation
- **Confluence Signals**: Large "BULL" or "BEAR" labels for high-probability setups
Dashboard Information
- Real-time oscillator values (RSI, CCI, MACD)
- Current signal count for bulls and bears
- Active divergence status
- Confluence confirmation status
Important Educational Considerations
Learning Focus
- **Pattern Study**: Understand how traditional patterns form and their limitations
- **Divergence Concepts**: Learn to identify momentum shifts before price reversals
- **Confluence Theory**: Practice combining multiple analysis techniques
- **Risk Awareness**: No pattern or signal guarantees future price movement
Limitations for Learning
- **Historical Analysis**: Patterns are identified after formation
- **No Predictive Guarantee**: Educational tool for understanding concepts, not predictions
- **Market Context Required**: Patterns should be considered within broader market context
- **Practice Required**: Effective use requires study and practice
Educational Best Practices
1. **Start Simple**: Enable one component at a time to understand each concept
2. **Paper Trade**: Practice identifying signals without real money risk
3. **Study Failed Signals**: Learn why patterns fail to improve understanding
4. **Combine with Other Analysis**: Use alongside fundamental and sentiment analysis
5. **Document Observations**: Keep a journal of pattern occurrences and outcomes
Technical Components
Indicator Architecture
- **Modular Design**: Independent modules for different analysis types
- **Performance Optimization**: Efficient calculation methods for smooth operation
- **Visual Management**: Controlled use of Pine Script drawing objects
- **Array-Based Storage**: Efficient data management for historical analysis
Calculation Methods
- **ATR-Based Validation**: Volatility-adjusted pattern filtering
- **Volume Analysis**: Comparative volume assessment for confirmation
- **Pivot Detection**: Mathematical identification of swing points
- **Statistical Validation**: Touch-count and tolerance-based S/R levels
Divergence Detection Methodology
Regular Divergences (Reversal Signals)
- **Bullish**: Price lower low + Oscillator higher low
- **Bearish**: Price higher high + Oscillator lower high
Hidden Divergences (Continuation Signals)
- **Hidden Bullish**: Price higher low + Oscillator lower low
- **Hidden Bearish**: Price lower high + Oscillator higher high
Validation Criteria
- Minimum pivot strength requirement (percentage-based)
- Lookback period for swing detection
- Multiple oscillator confirmation option
Confluence Scoring System
Signal Categories
1. **Pattern Signals** (Weight: 1): Candlestick formations
2. **Oscillator Signals** (Weight: 1): RSI/CCI extremes
3. **Breakout Signals** (Weight: 1): Volume-confirmed breaks
4. **Regular Divergences** (Weight: 2): Higher probability reversals
5. **Hidden Divergences** (Weight: 1): Trend continuation signals
Confluence Thresholds
- Adjustable minimum signal requirement (2-6 signals)
- Visual indication when threshold is met
- Detailed reason display for educational understanding
Educational Dashboard
Real-Time Metrics
- Oscillator readings (RSI, CCI, MACD)
- ATR volatility measurement
- Bull/Bear signal counts
- Divergence status
- Confluence confirmation
Customization Options
- Position selection (6 screen locations)
- Color customization for all elements
- Enable/disable individual components
Version Information
- **Version 1.1**: Added comprehensive divergence detection system
- **Educational Focus**: Designed for learning technical analysis concepts
- **Integration**: All components work together in confluence system
Disclaimer
This indicator is designed exclusively for educational purposes to demonstrate technical analysis concepts. It is not financial advice and should not be used as the sole basis for trading decisions. Past patterns and signals do not guarantee future results. Trading involves substantial risk of loss. Users should conduct their own research, practice with demo accounts, and consider seeking advice from qualified professionals before making investment decisions.
Learning Resources
The indicator includes extensive inline comments explaining each calculation and concept. Users are encouraged to study the source code to understand the methodology behind each component. This transparency aids in learning how technical indicators work and their limitations.
---
**Note**: This is an educational tool meant to help traders learn pattern recognition and technical analysis concepts. Success requires practice, additional analysis, and proper risk management.

Double-Numbered Hexagon Price and Time Chart ⬢️ Double-Numbered Hexagon Price and Time Chart ⬢️
Overview
The Double-Numbered Hexagon Price and Time Chart is an advanced overlay indicator for TradingView that fuses William D. Gann’s geometric principles with modern charting tools. Inspired by the work of Patrick Mikula in Gann’s Scientific Methods Unveiled (Volumes 1 & 2), this tool reimagines Gann’s hexagonal number spirals—where market price and time unfold within a structured 360° framework.
This indicator constructs a dynamic, double-numbered hexagonal grid expanding from a central seed. Users can anchor from a price high or low , or override with a manual seed to start the chart from any desired value. As prices progress or regress from this origin, the chart plots swing pivots directly onto the hexagonal grid , allowing users to assess whether historical highs and lows align with key angles. The grid displays 12 angular spokes (0° to 330° in 30° steps) by default, and users can highlight any single angle , which applies a color-coded emphasis to both the spoke and its corresponding horizontal levels—helping reveal potential support, resistance, and geometric symmetry .
It supports automatic detection of pivots, live tracking of current price within the grid, and detailed display customizations—making it ideal for Gann-style geometric analysis, pivot-based strategies, and time/price harmonic research.
---
Key Features
* Hexagonal Spiral Structure: Constructs a grid of expanding rings from a central price seed, with each cell aligned to a 360° angular framework (in 30° increments).
* Anchor Customization: Seed from a bar's high/low using a selected timestamp, or override with a manual starting value.
* Increment/Decrement Control: Define step size for upward progression (positive) or downward regression (negative).
* Angle Highlighting and Lines: Select from 12 angles (0° to 330°) to highlight hexagon spokes and project price lines from the anchor.
* Swing Pivot Detection: Automatically identifies post-anchor highs/lows using `ta.pivothigh/low` logic with user-defined left/right bars.
* Real-Time Close Highlight: Dynamically marks the cell closest to the current close (unconfirmed bars).
* Display Customization: Control cell size, text size, table position, colors, and label visibility.
* Pivot Label Options: Show/hide labels for swing highs/lows with full color control.
* Rounding Precision: Set decimal places for all displayed values.
---
How to Use
1. Add to Chart: Apply the indicator as an overlay on your preferred symbol and timeframe.
2. Set the Anchor:
* Select anchor date/time using the calendar icon.
* Choose price source (High or Low).
* Set rounding to match instrument precision.
3. Configure Hexagon:
* Set number of rings to expand the grid.
* Define increment (positive or negative).
* Enable time index values for time-based sequencing.
4. Manual Override (Optional):
* Enable manual mode and input custom seed value.
5. Customize Display:
* Adjust cell and text sizes, table position, and color themes.
6. Angle Settings:
* Choose any angle (e.g., 90°) to highlight spokes and draw horizontal lines from anchor price.
7. Swing Pivots:
* Configure pivot detection using left/right bar settings.
* Toggle pivot label visibility.
8. Interpretation:
* Center cell = anchor price.
* Rings = stepped price levels.
* Spokes = geometric angles for support/resistance.
* Highlighted pivots = potential alignment zones.
* Real-time cell = current price’s position in the grid.
---
Methodology
The indicator uses hexagonal math to plot a spiral of price levels outward from a seed, calculated with degree-based geometry and coordinates. Pivots are identified using built-in TradingView functions and color-coded based on user settings. Angle highlights represent key 30° divisions for price projection.
This tool reinterprets Gann’s spiral and double-numbered techniques without astrological overlays, offering a modern and interactive way to explore time/price relationships geometrically.
---
Limitations and Notes
* Real-Time Behavior: Close highlight updates on unconfirmed bars; locks on candle close.
* Not a Signal Generator: This is a Gann research and visualization tool. Past confluences do not guarantee future outcomes. Use with proper strategy and risk management.
* Future Updates: More features may be added pending feedback and TradingView approval.

권재용 ai 시그널(단타, 스윙모드 버전)기존 보조지표들에 문제점이 많이 느낌.
한 보조지표에 한가지 밖에 적용못한다는 점과 선물용 시그널이 없다는점.
모든 보조지표를 뒤져봐도, 롱,숏,청산 까지 나오는 보조지표가 없어서, 답답해서 직접 알고리즘 구현함.
아직은 베타버전. 지속적 업데이트 예정(스윙모드 값 최적화 덜됨.)
1. 현재 비트코인과 이더리움 최적화되게 세팅값 자동 조정되게 구현함.
2. 시간봉에 따라 세팅값 자동으로 조정되게 많듦.
3. 여러 신뢰도 높은 보조지표들 알고리즘 통합하여 알고리즘 구현.
간단 알고리즘
1)추세 레짐 감지
ADX(평균 방향성 지수) + 200EMA 기울기(Slope) + ST 안정도(Trend Stability) + HTF 방향 일치 4개 요소 합산 → Trend Score 산출.
점수 기반으로 추세장 / 박스장 / 전이구간 분류, 상태 전환시 히스테리시스(Hysteresis) 적용해 딸깍거리 방지함.
즉, 한번 추세로 들어가면 일정 조건 만족해야만 박스로 전환됨 → Noise Filtering 핵심.
2)다층 청산 로직
Give-back Limit: MFE(최대유리구간) 대비 일정 비율 되돌리면 청산 → 익절 보호.
ADX Weakness Counter: ADX가 약해지는 횟수 카운팅 → 모멘텀 사라질 때 청산.
HTF Flip Exit: 상위TF 추세 뒤집힘 시 강제 청산.
Structure Exit: 스윙 저점/고점 깨지면 구조 붕괴로 판단해 청산.
Time Stop: 스윙에서 일정 시간 진전 없으면 자동 청산.
이 모든 걸 OR 조건으로 묶음 → Multi-factor Exit Engine.
3). Adaptive Parameter Scaling (적응형 파라미터 스케일링)
사용자가 정한 공격성(aggressiveness) 값 + 실시간 레짐 상태 합쳐서
트레일링 폭(k)
되돌림 한계(gb)
ADX 문턱값
타임스톱 시간
다이나믹하게 바뀜.
결과: 시장이 고변동 추세장이면 청산 늦추고, 저변동 박스장이면 빨리 털고 나옴.
이게 Risk-Adjusted Exit Control 핵심.
4) State Machine Position Handling (포지션 상태 머신)
포지션 열림/닫힘/쿨다운 주기 관리.
진입 후 entryPrice, slPrice, mfe, noProgBars 등 상태변수 실시간 업데이트.
일종의 Finite State Machine(FSM) 구조라서 로직 충돌 없이 깔끔하게 동작함.
7. Hysteresis & Persistence Filters
추세/변동성 상태 바뀔 때 Persistence Counter로 연속성 요구함.
예: 한두 봉 노이즈로는 추세 안바뀜 → Signal Debouncing 기법.
간단 사용 루틴(단타)
1~15분봉 추천, 단타 + Auto + Auto + 공격성 50~60.
우상단 시장이 추세장·고변동이면 시그널↑. 박스장·저변동이면 진입 빈도↓.
KJY-L/S 뜨면 진입, 회색선=진입가/빨간선=SL 확인.
KJY-E 뜨면 미련 없이 정리. 알림 연동해두면 실전 편함.
간단 사용 루틴(스윙)
2H~4H, 스윙 + Auto + Auto + 공격성 45~55 + 스윙 최적화 ON.
구조 붕괴/타임스톱/HTF 뒤집힘 오면 자동으로 E 라벨로 정리.
레짐 감지: ADX 스무딩, 200EMA 기울기, ST 안정도, HTF 정합로 점수화 → 추세/박스 자동 분류.
변동성 적응: TR 비율로 고/저변동 인식 → 트레일 폭, 되돌림 한계, 타임스톱 스케일 조정.
스윙 가드: 1D 구조/기울기/정체시간 3중 안전장치.
공격성 슬라이더: 사용자 성향 한 방에 반영(트레일·되돌림·ADX 문턱 동시 스케일링).
I felt a lot of limitations with existing indicators.
Most indicators can only handle one thing at a time, and none of them provide signals specifically for futures trading.
After digging through all indicators, I realized there wasn’t a single one that gave me long, short, and exit signals all in one — so I built my own algorithm out of frustration.
This is still a beta version, with continuous updates planned.
Automatically optimized for Bitcoin and Ethereum.
Parameters auto-adjust based on timeframe.
Combines multiple high-reliability indicators into one unified algorithm.
1) Trend Regime Detection
Uses ADX (Average Directional Index) + 200EMA Slope + ST Stability (Trend Stability) + HTF Direction Alignment.
Combines the four elements into a Trend Score.
Classifies markets into Trending / Ranging / Transitional phases.
Applies Hysteresis during regime switching to prevent rapid signal flipping.
Once in a trend, it only switches to range mode after strict conditions are met → core Noise Filtering logic.
2) Multi-Layer Exit Logic
Give-back Limit: Exits if price retraces beyond a set % of MFE (Maximum Favorable Excursion) → protects profits.
ADX Weakness Counter: Counts consecutive ADX weakening periods → exits when momentum dies.
HTF Flip Exit: Forces exit if higher-timeframe trend reverses.
Structure Exit: Exits when swing high/low breaks = structural failure.
Time Stop: Auto exit if no progress after a set number of bars in swing mode.
All combined via OR conditions → Multi-factor Exit Engine.
3) Adaptive Parameter Scaling
Combines user-defined aggressiveness + real-time regime state to dynamically adjust:
Trailing stop width (k)
Give-back limit (gb)
ADX threshold
Time-stop duration
Result: In high-volatility trending markets, exits trail further; in low-volatility ranging markets, exits tighten quickly → key to Risk-Adjusted Exit Control.
4) State Machine Position Handling
Manages open/close/cooldown cycles for positions.
Updates variables like entryPrice, slPrice, mfe, noProgBars in real-time.
Built as a Finite State Machine (FSM) → avoids logic conflicts, ensures clean execution.
5) Hysteresis & Persistence Filters
Adds Persistence Counters for regime switching.
Prevents a single noisy candle from flipping states → Signal Debouncing technique.
Recommended: 1–15min charts, Settings: Scalp + Auto + Auto + Aggressiveness 50–60.
Top-right panel: Trending + High-Volatility → More Signals, Ranging + Low-Volatility → Fewer Entries.
When KJY-L/S appears → enter trade. Gray line = entry price, red line = SL.
When KJY-E appears → exit with no hesitation. Alerts make it seamless in real trading.
Recommended: 2H–4H charts, Settings: Swing + Auto + Auto + Aggressiveness 45–55 + Swing Optimization ON.
Structural breaks / Time-stop / HTF trend reversals → auto exit with E label.
Regime Detection: ADX smoothing + 200EMA slope + ST stability + HTF alignment → auto classifies Trend vs Range.
Volatility Adaptation: TR ratio detects high/low volatility → adjusts trail, give-back, and time-stop levels.
Swing Guard: 1D structure, slope, and time-stop → triple safety filter.
Aggressiveness Slider: Instantly applies user preference to trail width, give-back, ADX thresholds

PCCE + False Breakout DetectorPCCE + False Breakout Detector
Type: Invite‑Only Indicator (closed source)
Purpose: Identify volatility compression (“coil”) and the first expansion after it, while filtering failed breakouts (bull/bear traps).
What it does — in plain language
This tool unifies two complementary behaviours that often appear back‑to‑back around strong moves:
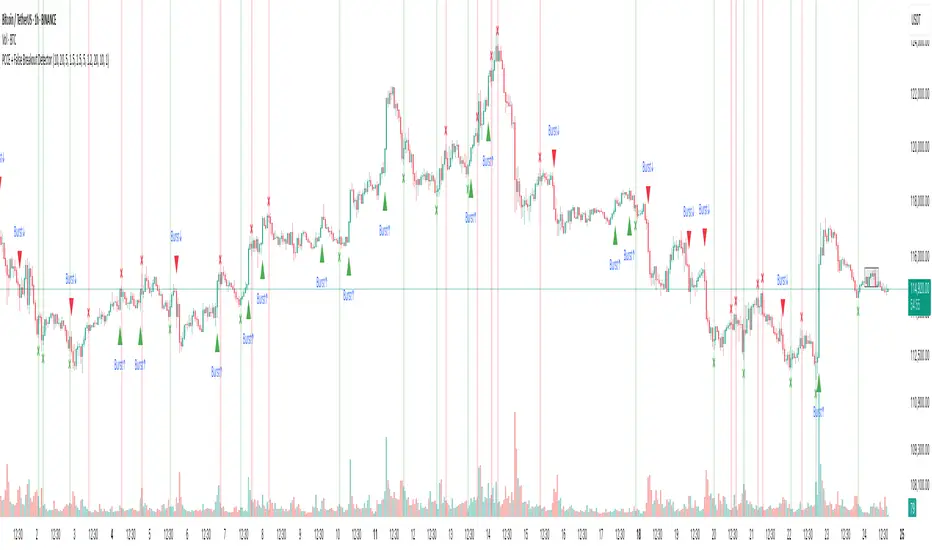
1. Price Coil Compression & Expansion (PCCE) – finds compact ranges created by shrinking candle bodies, wick dominance, and contracting range relative to recent history. When price expands out of that coil with strength, it prints a Burst↑ / Burst↓ label.
2. False Breakout Detection – monitors recent swing extremes. If price closes beyond a prior high/low but re‑enters that range within a short window, it marks a trap (❌ red for failed bullish breakout, ❌ green for failed bearish breakout).
Why combine them?
PCCE tells you where the next move is likely brewing; the trap filter validates whether the breakout is genuine or failing. Used together they turn raw breakouts into structured, risk‑aware opportunities.
How it works — concepts behind the calculations
1) Detecting “Coil” (compression)
• Body contraction: Count of consecutive bars where |close-open| is decreasing within a sliding window.
• Wick dominance: Average (upper wick + lower wick) / body must exceed a threshold → indecision/liquidity probing.
• Relative range: Current high‑low over the window must be smaller than the average of prior windows (tight market).
• Coil zone: When the above conditions align, the most recent high/low envelope defines the coil’s bounds.
2) Confirming “Burst” (expansion)
A breakout through the coil high/low is only labelled when:
• Body thrust: current body > moving‑average body × multiplier (large real body).
• Relative volume: volume > moving‑average volume × multiplier (participation filter).
• Trend alignment (optional): close vs EMA to avoid counter‑trend bursts.
• Cooldown: minimum bars between signals to reduce clustering.
Result: Burst↑ if closing beyond coil high with thrust; Burst↓ if closing beyond coil low with thrust.
3) Flagging failed breakouts (traps)
• Track recent swing high/low from a lookback excluding the current bar.
• If a bar closes beyond that swing but within N bars price closes back inside the swing range → flag a trap:
• Bull trap: ❌ red above bar (break above failed)
• Bear trap: ❌ green below bar (break below failed)
⸻
What you see on the chart
• Coil zone: a shaded box (tight range envelope).
• Burst labels: Burst↑ (triangle up) and Burst↓ (triangle down) at confirmed expansion bars.
• Trap markers: ❌ red (failed bullish breakout), ❌ green (failed bearish breakout).
• Alerts: “Burst Up”, “Burst Down” (fires on bar close only).
⸻
How to use it
1. Preparation : When a coil box forms, mark the zone and wait.
2. Trigger : A Burst label confirms the first expansion with thrust/volume; treat it as an entry cue only within your own plan.
3. Validation : If a ❌ trap appears shortly after a break, treat it as caution/exit info; the breakout is failing.
4. Context : Best on 15m–4H. Combine with higher‑timeframe bias, nearby S/R, and risk controls.
5. Parameters to tune :
• Coil window, wick‑to‑body threshold, and range tightness
• Body/volume multipliers
• EMA trend filter on/off
• Trap lookback and confirmation bars
• Cooldown bars
⸻
Originality & usefulness
• Behaviour‑first compression scoring: Coil detection blends monotonic body shrink, wick dominance, and relative range contraction—not generic bands or a single oscillator.
• Two‑stage discipline: A burst is not just any break; it requires body thrust + relative volume (+ optional trend) to reduce noise.
• Immediate invalidation layer: The trap filter is evaluated right after the burst context, turning breakouts into risk‑aware signals rather than blind entries.
• Operator controls: Cooldown + multipliers let traders adapt the strictness to instrument/session behaviour.
⸻
Repainting & limitations
• Signals are evaluated on bar close; no lookahead, no request.security() with lookahead_on.
• Coil boxes while forming can update until confirmed; Burst/Trap labels do not repaint after their bar closes.
• News spikes and illiquid hours can still create noise; adjust multipliers and cooldown for your market.
⸻
Disclaimer
This indicator is an educational decision‑support tool, not financial advice. Markets are uncertain; past behaviour does not guarantee future results. Use with your own analysis and risk management.
Auction S/D Zones (Pivot + Volume + ATR) - S9Trader
Short Summary
Plots high-probability Supply & Demand zones from confirmed pivots, validated by volume and an ATR-impulse filter. Highlights the first retest, supports optional invalidation, and includes touch alerts. Works on any symbol and timeframe.
Script Description
What it does
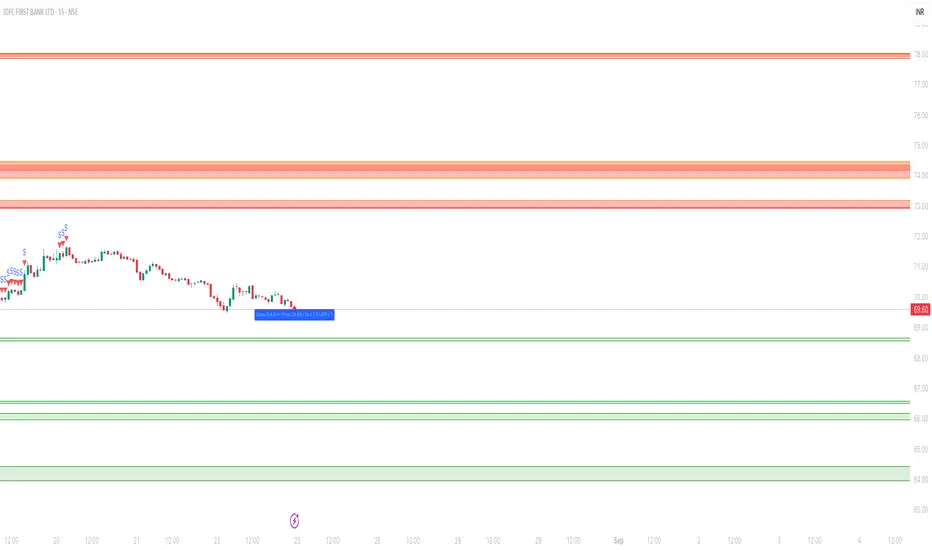
Detects swing highs/lows (confirmed pivots) and draws Supply (red) / Demand (green) zones.
Confirms potential institutional activity with Volume > SMA × multiplier.
Requires an impulse move at the pivot (range ≥ ATR × multiplier) to avoid weak swings.
Extends zones to the right, highlights the first touch, and can invalidate zones on clean breaks.
Provides alerts when price touches an active zone.
Principles (why it works)
Auction Market Theory: Markets rotate between balance and imbalance; sharp moves often mark “unfair” highs/lows that react on retest.
Supply/Demand Mapping: Swing highs tend to act as Supply on revisit; swing lows as Demand.
Volume Confirmation: Above-average pivot volume suggests non-retail participation.
ATR Impulse: Prioritizes pivots formed by meaningful range expansion, not noise.
How it works (logic)
Pivot detection: ta.pivothigh/low(leftBars, rightBars) confirms a swing after rightBars candles.
Zone construction: Supply = top at pivot high, bottom at max(open, close). Demand = bottom at pivot low, top at min(open, close). Optional minimum % height filter.
Filters: Volume > SMA(Volume, volLen) × volMult AND true range ≥ ATR × impATRmult.
Management: Keeps up to maxZones per side; highlights first retest; invalidates on decisive close through the far edge.
Alerts: Triggers when the current bar intersects any active zone.
Inputs (recommended starting points)
Pivot Left/Right Bars (5/5): Higher = stronger, fewer zones. Intraday: 3–6; Swing: 8–12.
Volume SMA Length (20) & High-Volume Multiplier (1.5–2.0): Higher = stricter.
ATR Length (14) & Impulse Multiplier (1.0–1.5): Higher = stricter.
Min Zone Height % (0.05–0.15%): Skip micro-zones.
Max Zones / Side (5–15): Reduce clutter & stay within object limits.
Invalidate on Break: Remove “proven wrong” zones.
Highlight First Touch: Emphasize the first interaction.
Extend Left: Optional historical context.
How to use (playbook)
Start with context: Identify the higher-timeframe trend/structure.
Prioritize first touch: Reactions are typically strongest on the first revisit.
Seek confluence: Favor zones aligned with trend or near HTF levels, VWAP/MA confluence, or round numbers.
Risk: Place stops just beyond the zone; size so a clean break is tolerable.
Targets: Mid-range, opposite side of the session’s rotation, or next HTF level; trail if momentum persists.
Alerts available
Supply Zone Touch
Demand Zone Touch
Notes & limitations
Pivots confirm only after rightBars candles; zones appear at the confirmed pivot (no instant hindsight).
Order flow/footprint is not available in Pine; bar volume is used as a proxy.
Drawing objects are limited by TradingView; keep maxZones modest on long histories.
Indicator only (not a strategy); backtesting requires a separate strategy script.
Changelog
v1.0.0 — Initial release: pivots + volume + ATR impulse, first-touch highlight, invalidation, alerts, zone caps.
Disclaimer
For educational purposes only. Not financial advice. Trading involves risk—do your own research and manage risk.
Auction S/D Zones (Pivot + Volume + ATR) -S9TraderShort Summary
Plots high-probability Supply & Demand zones from confirmed pivots, validated by volume and an ATR-impulse filter. Highlights the first retest, supports optional invalidation, and includes touch alerts. Works on any symbol and timeframe.
Script Description
What it does
* Detects swing highs/lows (confirmed pivots) and draws Supply (red) / Demand (green) zones.
* Confirms potential institutional activity with Volume > SMA × multiplier.
* Requires an impulse move at the pivot (range ≥ ATR × multiplier) to avoid weak swings.
* Extends zones to the right, highlights the first touch, and can invalidate zones on clean breaks.
* Provides alerts when price touches an active zone.
Principles (why it works)
* Auction Market Theory: Markets rotate between balance and imbalance; sharp moves often mark “unfair” highs/lows that react on retest.
* Supply/Demand Mapping: Swing highs tend to act as Supply on revisit; swing lows as Demand.
* Volume Confirmation: Above-average pivot volume suggests non-retail participation.
* ATR Impulse: Prioritizes pivots formed by meaningful range expansion, not noise.
How it works (logic)
* Pivot detection: `ta.pivothigh/low(leftBars, rightBars)` confirms a swing after rightBars candles.
* Zone construction: Supply = top at pivot high, bottom at max(open, close). Demand = bottom at pivot low, top at min(open, close). Optional minimum % height filter.
* Filters: `Volume > SMA(Volume, volLen) × volMult` AND `true range ≥ ATR × impATRmult`.
* Management: Keeps up to maxZones per side; highlights first retest; invalidates on decisive close through the far edge.
* Alerts: Triggers when the current bar intersects any active zone.
Inputs (recommended starting points)
* Pivot Left/Right Bars (5/5): Higher = stronger, fewer zones. Intraday: 3–6; Swing: 8–12.
* Volume SMA Length (20) & High-Volume Multiplier (1.5–2.0): Higher = stricter.
* ATR Length (14) & Impulse Multiplier (1.0–1.5): Higher = stricter.
* Min Zone Height % (0.05–0.15%): Skip micro-zones.
* Max Zones / Side (5–15): Reduce clutter & stay within object limits.
* Invalidate on Break: Remove “proven wrong” zones.
* Highlight First Touch: Emphasize the first interaction.
* Extend Left: Optional historical context.
How to use (playbook)
* Start with context: Identify the higher-timeframe trend/structure.
* Prioritize first touch: Reactions are typically strongest on the first revisit.
* Seek confluence: Favor zones aligned with trend or near HTF levels, VWAP/MA confluence, or round numbers.
* Risk: Place stops just beyond the zone; size so a clean break is tolerable.
* Targets: Mid-range, opposite side of the session’s rotation, or next HTF level; trail if momentum persists.
Alerts available
* Supply Zone Touch
* Demand Zone Touch
Notes & limitations
* Pivots confirm only after rightBars candles; zones appear at the confirmed pivot (no instant hindsight).
* Order flow/footprint is not available in Pine; bar volume is used as a proxy.
* Drawing objects are limited by TradingView; keep maxZones modest on long histories.
* Indicator only (not a strategy); backtesting requires a separate strategy script.
Changelog
* v1.0.0 — Initial release: pivots + volume + ATR impulse, first-touch highlight, invalidation, alerts, zone caps.
Disclaimer
For educational purposes only. Not financial advice. Trading involves risk—do your own research and manage risk.

Smart Impulse Exhaustion Finder (ATR + ADX Filter)📌 Purpose
This indicator detects potential exhaustion of strong bullish or bearish impulses at fresh swing highs/lows by combining multiple price action and volatility-based filters.
🧠 How It Works
A signal is triggered only when all core conditions are satisfied:
1. Swing High/Low Detection
Current high (or low) must be the highest (or lowest) over the last Extremum Lookback bars (default: 50).
This ensures the move is significant relative to recent price action.
2. Impulse Confirmation
Price must extend by at least 1 × ATR from the previous swing point.
This filters out minor fluctuations.
3. Exhaustion Conditions (at least 2 out of 3 must be met)
RSI Extreme: RSI > Overbought Level (default: 80) for bearish signals, RSI < Oversold Level (default: 20) for bullish signals.
Volume Spike: Volume > SMA(Volume, Volume SMA Length) × Volume Spike Multiplier.
Candle Wick Rejection: Upper wick ≥ Wick Threshold % for bearish setups, Lower wick ≥ Wick Threshold % for bullish setups.
4. Trend Filter
ADX > ADX Threshold ensures the market is trending and filters out sideways conditions.
5. Candle Body Filter
Candle body must be ≥ Body Size ATR Factor × ATR.
This avoids weak signals from small candles or doji formations.
📈 How to Use
Bearish Signal:
Appears at fresh swing highs with exhaustion conditions met. Useful for tightening stops, taking partial profits, or counter-trend shorts.
Bullish Signal:
Appears at fresh swing lows with exhaustion conditions met. Useful for trailing stops, profit-taking, or counter-trend longs.
Recommended Timeframes: Works best on 1h, 4h, and Daily charts.
Markets: Crypto, Forex, Stocks — wherever volatility and trends are present.
⚙️ Inputs
RSI Length / Overbought / Oversold
Volume SMA Length & Volume Spike Multiplier
Wick Threshold %
Extremum Lookback (bars for highs/lows)
ADX Length & Threshold
Body Size ATR Factor
⚠️ Disclaimer
This script is for educational purposes only and does not constitute financial advice.
Always test thoroughly and apply proper risk management before live trading.
💡 Tip: Combine this tool with your own market context and confluence factors for higher probability setups.

ParthFintech SMART Indicator V1.0A powerful, all-in-one SMART indicator designed to identify high-probability trade setups across any timeframe. By combining break-of-structure entries with multi-timeframe trend confirmation, dynamic support & resistance, Order Block (OB) and Fair Value Gaps (FVG ) Detection, it automatically plots your entry, stop loss, and three tiered take-profit levels—and even marks them with arrows and labels so you can act at a glance.
---
A. 🔑 Key Features
1. Break of Structure (BOS) based entries: Detects fresh bullish or bearish structure breaks for precise timing.
2. Multi-Timeframe Trend Filter: Confirms 4 hour and Daily trend alignment via crossovers to avoid counter-trend signals.
3. Dynamic Support & Resistance Zones: Automatically captures the most recent swing highs/lows as S/R levels in the chart.
4. Multiple confluence Detection: Marks recent bullish/bearish order blocks with tiny colored squares.
5. Fair Value Gap (FVG) Zones: Highlights potential liquidity imbalance areas where price often returns.
6. Automated Risk/Reward Levels:
- Entry at the BOS candle high/low
- Stop Loss at the most recent swing low (for longs) or swing high (for shorts)
- TP1, TP2, TP3 calculated as configurable RR multiples (default 1.5×, 2×, 3×)
B. Visual Cues:
- Green arrow below the bar for long entries
- Red arrow above the bar for short entries
- Labels “ENTRY”, “SL”, “TP1”, “TP2”, “TP3” plotted at their respective price levels
- Alert-Ready: Built-in alert conditions for Entry, all three TPs and SL hits—perfect for pop-ups, emails, or webhooks (Telegram integration).
C. ⚙️ Inputs & Customization
Input Default Description
- TP1 RR 1.5 First take-profit as a multiple of risk
- TP2 RR 2.0 Second take-profit multiple
- TP3 RR 3.0 Third take-profit multiple
- Lookback S/R 20 Bars to use when calculating swing highs/lows
- Arrow Offset (pips) 10 Vertical offset for the entry arrows
- HTF 1 240 Higher timeframe #1 (4 hour)
- HTF 2 D Higher timeframe #2 (Daily)
- Customize RR targets, lookback period, arrow offset, or HF trend timeframes to match your trading style.
---
D. 🎯 How It Works
1. Trend Check – Uses trend analysis on 4H & Daily to ensure you trade with the dominant market direction.
2. Structure Break – Alerts when price closes beyond the most recent swing high (bullish) or low (bearish).
3. Zone Confirmation – Plots S/R, OB, and FVG zones to help you visualize confluence.
4. Level Calculation – Automatically computes entry, stop, and three target levels based on your RR settings.
5. Visual Signals & Alerts – Draws arrows/labels on the chart and triggers alerts so you never miss a setup.
---
E. 🚀 Getting Started
1. Open Indicators menu on TradingView and search for ParthFintech SMART Indicator.v1.0
2. Click Add to Chart and tweak input settings to your preference.
3. Create alerts on “Buy Signal”, “Sell Signal”, “TP1 Hit”, “SL Hit”, etc., choosing popup, email, or webhook delivery.
Contact: support@parth-fintech.com or visit parth-fintech.com for any queries.
-----
> Disclaimer: This indicator is provided for personal use and should be tested thoroughly in a demo environment before deploying with real capital. Always manage your risk appropriately.

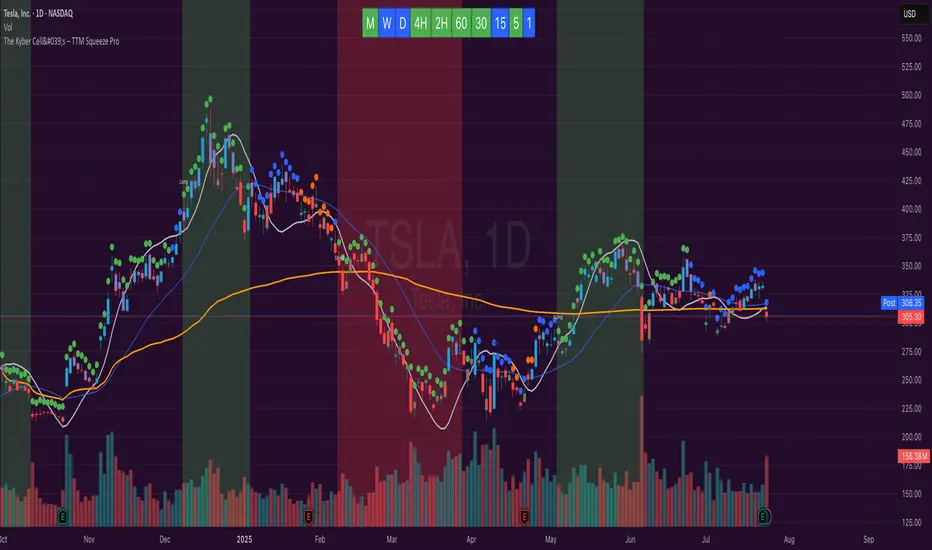
The Kyber Cell's – TTM Squeeze ProThe Kyber Cell’s TTM Squeeze Pro
TTM Squeeze + ALMA + VWAP for Precision Trade Timing
⸻
1. Introduction
Kyber Cell’s Squeeze Pro is a comprehensive, all-in-one overlay indicator built on top of John Carter’s famous TTM Squeeze concept. It integrates advanced momentum and trend analysis using Arnaud Legoux Moving Averages (ALMA), a scroll-aware VWAP with optional deviation bands, and a clean, user-friendly visual system. The goal is simple: give traders a clear and configurable chart that identifies price compression, detects release moments, confirms direction, and helps manage risk and reward visually and effectively.
This tool is intended for traders of all styles — scalpers, swing traders, or intraday strategists — looking for cleaner signals, better visual cues, and more confidence in entry/exit timing.
⸻
2. Core Concepts
At its heart, the Squeeze Pro builds an in-chart visualization of the TTM Squeeze, a strategy that identifies when price volatility compresses inside a Bollinger Band that is narrower than a Keltner Channel. These moments often precede explosive breakouts. This version categorizes squeezes into three levels of compression:
• Blue Dot – Low Compression
• Orange Dot – Medium Compression
• Red Dot – High Compression
When the squeeze “fires” (i.e., the Bollinger Bands expand beyond all Keltner thresholds), the indicator flips to a Green Dot, signaling potential entry if confirmed by trend direction.
The indicator also includes a momentum model using linear regression on smoothed price deviation to determine directional bias. Momentum is further reinforced by a customizable trend engine, allowing you to switch between EMA-21 or HMA 34/144 logic.
An ALMA ribbon is plotted across the chart to represent smoothed trend strength with minimal lag, and a scroll-aware VWAP (Volume-Weighted Average Price) line, optionally with ±σ bands, helps confirm mean-reversion or momentum continuation setups.
⸻
3. Visual Components
Squeeze Pro replaces the traditional histogram with bar coloring logic based on your selected overlay mode:
• Momentum Mode colors bars based on whether momentum is rising or falling and in which direction (aqua/blue for bullish, red/yellow for bearish).
• Trend Mode colors bars using EMA or HMA logic to identify whether price is in a bullish, bearish, or neutral trend state.
A colored backdrop is triggered when a squeeze fires and momentum direction is confirmed. It remains green for bullish runs and red for bearish runs. The background disappears when the trend exhausts or reverses.
Each squeeze level (low, medium, high) is plotted as tiny dots above or below candles, with configurable colors. On the exact bar where the squeeze fires, the indicator optionally plots entry markers — either arrows or triangles — which can be placed with adjustable padding using ATR. These provide an at-a-glance signal of possible long or short entries.
EXPERIMENTAL : For risk and reward management, protective stop lines and limit targets can be toggled on. Stops are calculated using either recent swing highs/lows or a fixed ATR multiple, depending on user preference. Limit targets are calculated from entry price using ATR-based projections.
All colors are customizable.
⸻
4. Multi-Timeframe Squeeze Panel
An optional MTF Squeeze Panel appears in the top-right corner of the chart, displaying the squeeze status across multiple timeframes — from 1-minute to Monthly. Each timeframe is color-coded:
• Red for High Compression
• Orange for Medium Compression
• Blue for Low Compression
• Yellow for Open/No Compression
This provides rapid context for whether multiple timeframes are simultaneously compressing (a common precursor to explosive moves), helping traders align higher- and lower-timeframe signals. Colors are customizable.
The MTF panel dynamically adjusts to chart space and only renders the selected intervals for clarity and performance.
⸻
5. Inputs and Configuration Options
Squeeze Pro offers a rich configuration suite:
• Squeeze Settings: Control the Bollinger Band standard deviation, and three separate Keltner Channel multipliers (for low, medium, and high compression zones).
• ALMA Controls: Adjust the smoothing length, offset, and σ factor to control ribbon sensitivity.
• VWAP Options: Toggle VWAP on/off and optionally show ±σ bands for mean reversion signals.
• Entry Markers: Customize marker shape (arrow or triangle), size (tiny to huge), color, and padding using ATR multipliers.
• Stops and Targets:
• Choose between Swing High/Low or ATR-based stop logic.
• Define separate ATR lengths and multipliers for stops and targets.
• Independently toggle their visibility and color.
• Bar Coloring Mode: Select either Momentum or Trend logic for bar overlays.
• Trend Engine: Choose between EMA-21 or HMA 34/144 for identifying trend direction.
• Squeeze Dot Colors: Customize the colors for each compression level and release state.
• MTF Panel: Toggle visibility per timeframe — from 1m to Monthly.
This high degree of customization ensures that the indicator can adapt to nearly any trading style or preference.
⸻
6. Trade Workflow Suggestions
To get the most out of this tool, traders can follow a consistent workflow:
1. Watch Dot Progression: Blue → Orange → Red indicates increasing compression and likelihood of breakout.
2. Enter on Green Dot: When the squeeze fires (green dot), confirm entry direction with bar color and backdrop.
3. Use Confirmation Tools:
• ALMA should slope in the trade direction.
• VWAP should support the price move or confirm expansion away from mean.
4. Manage Risk and Reward (experimental):
• Respect stop-loss placements (Swing/ATR).
• Use ATR-based limit targets if enabled.
5. Exit:
• Consider exiting when momentum crosses zero.
• Or exit when the background color disappears, signaling potential trend exhaustion.
⸻
7. Alerts
Includes built-in alert conditions to notify you when a squeeze fires in either direction:
• “Squeeze Long”: Triggers when a green dot appears and momentum is bullish.
• “Squeeze Short”: Triggers when a green dot appears and momentum is bearish.
You can use these alerts for automation or to stay notified of new setups even when away from the screen.
⸻
8. Disclaimer
This indicator is designed for educational purposes only and should not be interpreted as financial advice. Trading is inherently risky, and any decisions based on this tool should be made with full awareness of personal risk tolerance and capital exposure.
NF Liquidity Sweep TrackerNF Liquidity Sweep Tracker
A tool for detecting stop hunts, reversals, and liquidity grabs
Built for Smart Money Concepts (SMC) and ICT-style trading
🔧 Full Features Usage -
🔹 1. Lookback Period
How it works: Automatically finds recent swing highs and lows using a configurable Swing High/Low Detection.
Forms the foundation for detecting liquidity levels. These are potential areas where price may reverse or sweep.
🔹 2. Liquidity Sweep Detection
Detects price movements that break through swing points, often used by institutions to trigger stops.
Modes Available:
Wick-Based Sweeps: Price wicks above/below a swing but closes back inside.
Indicates a possible stop hunt or false breakout. Shown as Label: LS
Break- Retest Based Sweeps: Price breaks the swing level and continues or retests the zone.
Helps confirm continuation or retest setups. Shown as Labels: BO (Breakout), R (Retest)
All Types of Sweeps:
Enables both wick-based and breakout/retest sweeps.
🔹 3. Liquidity Zones (Boxes)
Draws boxes around swept areas to highlight liquidity zones.
Color-coded:
🟩 Green for bullish sweeps (below swing lows)
🟥 Red for bearish sweeps (above swing highs)
Usage: These zones act as temporary support/resistance and help traders spot: Reversals, Breakout continuations, Entries after retests.
🔹 5. Visual Labels
Helps quickly identify the type of liquidity event.
LS – Liquidity Sweep
Triggered when price wicks above/below a level and closes back inside.
BO – Breakout
Triggered when price cleanly breaks above/below a zone.
R – Retest
Triggered when price revisits a broken level.
Note: In a strong trending market, using a wick-based liquidity sweep (LS) strategy is often ineffective because the liquidity sweeps triggered by breakouts (BO) and breakdowns tend to dominate price action, making wick-based setups less reliable. However, liquidity sweeps ( LS ) tend to work very well when they occur near strong liquidity zones—areas where a significant concentration of buy or sell orders exist—because these zones act as natural support or resistance levels, increasing the likelihood of price reacting strongly and providing better trading opportunities.
📌 Usage Tip: These labels help with entry zone, trend confirmation, and trap detection.
🔹 6. Liquidity Lines
What it does: Draws horizontal lines from each swing high/low.
Usage: Acts as a visual reference for where liquidity lies. Great for planning take-profits, stop placements, or sniper entries.
🔹 8. Customization Options
Turn on/off:
Labels (LS, BO, R)
Liquidity lines
Breakout/retest zones
Set your own:
Line and box colors
Detection mode (Wick/Breakout/All)
Lookback period for swing points
🧠 Many Trader's use this concept to -
Identify high-probability reversal points (after sweeps)
Trade stop hunts and traps like institutions
Use zones for breakout and retest entries
Avoid false signals by waiting for sweeps and mitigations.

SMT Time Windows# SMT Time Windows
SMT Time Windows is a Pine Script v6 indicator by **Originalsauce1** that automates ICT-style Smart Money Technique (SMT) divergences between two correlated symbols. It detects bullish and bearish SMT divergences using swing highs/lows (pivot logic) across both instruments. Bullish SMT occurs when one symbol makes a higher low while the other forms a lower low; bearish SMT is when one symbol prints a higher high while the other records a lower high. These divergences highlight imbalances in correlated markets and can signal potential momentum shifts. SMT Time Windows plots clear labels for each divergence event and offers comprehensive filtering by custom time sessions.
## Key Features
* **Time Window Filters:** Define up to three custom time windows (e.g. 2:00–4:00 AM, 6:00–8:30 AM, 9:00–10:30 AM) with individual enable/disable toggles. Active windows can be highlighted on the chart with optional background shading for visual cueing.
* **Timezone Support:** User-selectable time zone ensures that time windows align correctly across different session schedules (global session alignment).
* **Adjustable Detection:** Set the pivot **length** (sensitivity of swing detection) and the signal **timeframe**. This pivot-based approach confirms valid swing highs/lows before marking divergences.
* **Clean SMT Labels:** The indicator plots “Bullish SMT” or “Bearish SMT” labels at the relevant pivots, clearly marking each divergence event. Label color and style are customizable, providing a clean visual cue of SMT signals.
* **Chart Highlights:** Optionally shade the chart background during active time windows, making it easy to see when the session filter is in effect.
* **Session Status Table:** An on-chart table shows which time windows are currently active (e.g. shows “Open”/“Closed” status). This real-time session table provides live feedback similar to other TradingView session trackers.
* **Comparison Symbol & Alerts:** Optionally overlay the comparison symbol on your chart. Built-in alerts notify you when bullish or bearish SMT divergences occur, allowing timely review.
## How It Works
SMT Time Windows checks for divergences between two positively correlated markets (for example, equity futures like S\&P 500 (ES) vs Nasdaq 100 (NQ), or FX pairs like US Dollar Index vs EUR/USD). When one instrument’s swing high/low is not confirmed by the other, it flags this as an SMT event. For instance, a **Bearish SMT** is identified when one symbol makes a higher high but the other fails to keep pace (prints a lower high); a **Bullish SMT** is when one symbol’s low is higher while the other’s low is lower. These divergences are interpreted as signs of uneven buying/selling pressure and can precede shifts in momentum.
The indicator is designed for use with correlated markets (e.g. ES/NQ, DXY/EURUSD, etc.) to enhance your market structure analysis. It is not a “set and forget” signal but a tool to spot potential imbalances. Use SMT Time Windows alongside your discretionary analysis and higher-timeframe context for best results.
## Disclaimer
This script is provided *“for educational and informational purposes only”*. It is **not** financial or trading advice. Always perform your own analysis and risk management before making trading decisions.
*Created by Originalsauce1. For educational and informational purposes only.*

Interest Zones | @CRYPTOKAZANCEVEnglish Description.
🧠 What This Script Does
This script automatically detects price interest zones — areas where the price repeatedly reacts by forming local swing highs or lows , suggesting heightened supply/demand or market attention. It uses a custom volatility-adjusted range (pseudo-ATR) to dynamically group significant swing points and highlights these zones visually on the chart.
The script is not a mashup or copy of built-in indicators. It’s an original implementation that performs a meaningful calculation based on market structure and volatility to help traders identify important price areas.
⚙️ How It Works
1. Swing Point Detection:
The script identifies swing highs and lows using a configurable lookback window.
2. Zone Candidate Evaluation:
Each swing is checked against a custom zone width (based on ATR and your multiplier). If multiple swings fall within this range, it’s marked as a potential zone.
3. Filtering:
The script keeps only those zones that:
• Contain at least a user-defined number of swing points.
• Do not overlap with stronger (higher swing count) zones.
4. Visualization:
• The strongest zones are drawn as semi-transparent boxes.
• Zones are limited by time (last X candles).
• Optional: Swing highs/lows can be shown on chart.
📊 How to Use
• Use it on any timeframe or asset to identify price regions of interest.
• Combine with volume, trend, or candlestick analysis for entries/exits.
• The number of touches (swing points in a zone) gives insight into zone significance.
This tool is particularly useful for identifying support/resistance areas based on actual price structure rather than arbitrary levels.
🔧 Settings
• Swing Lookback Period: Controls how many candles on each side of a pivot the script checks to detect a local high/low.
• Zone Width Multiplier: Adjusts the volatility-based range. Larger values create wider zones.
• Min Swing Count: Zones with fewer swing points than this won't be shown.
• Max Zones Displayed: Limits the number of zones shown on screen.
• Max Candles for Analysis: Old swing points beyond this range are ignored.
📌 Notes
• No third-party code or mashups used.
• This is a standalone implementation of a concept similar to market structure mapping, tailored to be dynamic and responsive to volatility.
• Ideal for traders who prefer clean, price-action-based analysis.
🇷🇺 Русское описание
🧠 Что делает этот индикатор:
Индикатор автоматически определяет зоны интереса цены — области, где цена многократно формирует локальные максимумы или минимумы (свинги) . Эти зоны могут сигнализировать о повышенном внимании рынка, предложении или спросе. Скрипт использует псевдо-ATR (волатильность на основе среднего диапазона), чтобы динамически определять такие области и выделяет их на графике.
Это не копия стандартных индикаторов и не микс чужих скриптов — это оригинальная разработка , полезная для всех, кто ищет автоматическую разметку важных ценовых уровней.
⚙️ Как работает индикатор
1. Поиск свинг-точек:
Определяются локальные экстремумы с учетом указанного периода.
2. Формирование кандидатов в зоны:
Каждая свинг-точка проверяется, есть ли в её диапазоне другие свинги. Если таких достаточно — зона считается потенциальной.
3. Фильтрация зон:
• Учитываются только зоны с минимумом заданных свингов.
• Перекрывающиеся зоны удаляются в пользу более значимых.
4. Визуализация:
• Отображаются зоны с наибольшим числом касаний.
• Зоны ограничиваются последними X свечами.
• При желании можно отобразить сами свинг-точки.
📊 Как использовать
• Работает на любом таймфрейме и инструменте.
• Используйте совместно с объёмами, трендом или свечным анализом.
• Количество касаний помогает оценить важность зоны.
Полезен тем, кто предпочитает анализ на основе структуры цены, а не произвольных уровней.
🔧 Настройки
• Период свингов: Сколько свечей учитывается по бокам для поиска экстремумов.
• Множитель зоны: Увеличивает диапазон зоны на основе волатильности.
• Мин. количество свингов: Минимум точек в зоне для её отображения.
• Макс. зон на графике: Ограничение по количеству отображаемых зон.
• Макс. свечей анализа: Старые точки за пределами не учитываются.
📌 Примечания
• Не содержит чужих индикаторов или шаблонов.
• Самостоятельная реализация механизма анализа структуры рынка.

PRO SMC Full Suite BY Mashrur“PRO SMC Full Suite BY Mashrur”
A Pine Script (v5) indicator for TradingView, focused on Smart Money Concepts (SMC). It overlays on price charts and provides visual tools for identifying key institutional trading behaviors.
🎯 Purpose
This script is designed to help traders analyze and trade using SMC principles by automatically detecting:
Order Blocks (OBs)
Fair Value Gaps (FVGs)
Breaks of Structure (BoS)
Liquidity Sweeps (Buy/Sell Side Liquidity Grabs)
Mitigation Entries
⚙️ Inputs / Settings
Show Fair Value Gaps: Toggle FVGs on/off
Higher Timeframe (HTF): Choose HTF for OB analysis
Use HTF OBs: Switch between current TF OBs and HTF OBs
Show Order Blocks: Toggle OBs on/off
Show OB Mitigation Entries: Toggle mitigation entry signals on/off
🧠 Core Logic Overview
🔹 1. Swing Points Detection
Identifies swing highs/lows using a 3-bar pattern (pivot-based structure).
🔹 2. Break of Structure (BoS)
A bullish BoS happens when price closes above the last swing high.
A bearish BoS occurs when price closes below the last swing low.
🔹 3. Order Block Detection
Upon BoS, the script marks the previous candle as the Order Block.
Uses either:
Current TF OBs (based on price action)
HTF OBs (based on candle body direction)
🔹 4. Mitigation Entry Logic
A mitigation occurs when price returns to the OB and reacts with confirmation:
Bullish: price dips into OB and closes above
Bearish: price wicks into OB and closes below
Plots entry markers for these mitigations.
🔹 5. Liquidity Sweeps
Detects equal highs/lows (liquidity zones)
Marks Buy SL when price dips below an equal low then closes above
Marks Sell SL when price breaks above an equal high then closes below
🔹 6. Fair Value Gaps (FVGs)
FVG Up: Gap between candle 3 and candle 1 (low > high )
FVG Down: Gap between candle 3 and candle 1 (high < low )
Plots highlighted boxes on these gaps
📊 Visual Elements
Boxes: For OB zones and FVGs
Shapes:
Labels: OB Buy/Sell entries
Triangles: Buy SL / Sell SL liquidity sweeps
Lines: Equal Highs and Lows
🔔 Alerts
Built-in alerts to notify when:
OB entries are confirmed
Liquidity sweeps happen
Helps in automation or active monitoring
✅ Ideal For
Traders using SMC, ICT concepts, Wyckoff, or institutional trading models
Anyone wanting to automate detection of structural elements on their chart

ICT Turtle Soup Ultimate V2📜 ICT Turtle Soup Ultimate V2 — Advanced Liquidity Reversal System
Overview:
The ICT Turtle Soup Ultimate V2 is a next-generation liquidity reversal indicator built on the principles of smart money concepts (SMC) and the classic ICT Turtle Soup setup. It is designed to detect false breakouts (liquidity grabs) at key swing points, enhanced by proprietary logic that filters out low-quality signals using a combination of trend context, kill zone timing, candle wick behavior, and multi-timeframe imbalance zones.
This tool is ideal for intraday traders seeking high-probability entry signals near liquidity pools and imbalance zones — where smart money makes its move.
🔍 What This Script Does
🧠 Liquidity Grab Detection (Turtle Soup Core Logic)
The script scans for recent swing highs/lows using a user-defined lookback.
A signal is generated when price breaks above/below a previous swing level but closes back inside — indicating a liquidity run and likely reversal.
A special Wick Trap Mode enhances this logic by detecting long-wick fakeouts — where the wick grabs stops but the candle body closes opposite the breakout direction.
📉 Trend Filter with ATR Buffer
Optional trend filter uses a simple moving average (SMA) to gauge market direction.
Instead of hard filtering, it applies an ATR-based buffer to allow for entries near the trend line, reducing signal suppression from micro-fluctuations.
🕰️ Kill Zone Session Filtering
Only show signals during institutional trading hours:
London Session
New York AM
Or any custom user-defined session
Helps traders avoid low-volume hours and focus on where stop hunts and price expansions typically occur.
🧱 Multi-Timeframe FVG Confluence (Optional)
Signal validation is strengthened by checking if price is within a higher timeframe Fair Value Gap — commonly used to identify imbalances or inefficiencies.
Filters out setups that lack underlying displacement or order flow justification.
🎨 Visual Feedback
Plots 🔺 bullish and 🔻 bearish markers at signal candles.
Optionally displays:
Swing High/Low Labels (SH / SL)
Reversal distance labels
Background color shading on valid signals
Includes built-in alerts for automated trade notification.
🔑 Unique Benefits
Wick Trap Detection: A proprietary approach to detecting stop hunts via wick behavior, not just candle closes.
ATR-based trend filtering: Avoids unnecessary filtering while still maintaining directional bias.
All-in-one system: No need to stack multiple indicators — swing detection, reversal logic, session filtering, and imbalance confirmation are all integrated.
💡 How to Use
Enable Wick Trap Mode to detect stealthy liquidity grabs with strong wicks.
Use Kill Zone filters to trade only when institutions are active.
Optionally enable FVG confluence to improve confidence in reversal zones.
Watch for Bullish signals near SL levels and Bearish signals near SH levels.
Combine with your own execution strategy or other SMC tools for optimal results.
🔗 Best Used With:
Maximize your edge by combining this script with complementary SMC-based tools:
✅ First FVG — Opening Range Fair Value Gap Detector
✅ ICT SMC Liquidity Grabs + OB + Fibonacci OTE Levels
✅ Liquidity Levels — Smart Swing Highs and Lows with horizontal line projections

CHoCH Detector – A Clean & Effective Market Structure Tool🔍 Overview:
This CHoCH Detector is designed for traders who focus on market structure shifts. CHoCH (Change of Character) is a key early sign of potential trend reversals. This script helps identify CHoCH based on swing structure, candle strength, and higher timeframe confirmation for better reliability.
📌 Key Features:
✅ CHoCH Detection: Identifies early trend shifts (Uptrend & Downtrend).
✅ Custom Swing Lookback: Adjust how far back the script looks for swing highs/lows.
✅ Retracement Strength Check: Ensures CHoCH has enough momentum to be valid.
✅ Retest Condition: Allows price to slightly deviate from the break level.
✅ Higher Timeframe Confirmation (Optional): Helps filter out weak CHoCH signals.
✅ Clean & Simple Visualization: Labels solid green CHoCH for uptrend & solid red CHoCH for downtrend.
📌 How the CHoCH Detection Works
1️⃣ Swing Highs & Lows:
The script checks for the highest high and lowest low within a user-defined Swing Lookback period.
If price breaks the previous swing high/low, it signals a potential CHoCH.
2️⃣ CHoCH Confirmation with Candle Strength:
To avoid false signals, CHoCH must have a strong enough price move.
It calculates the average body size over a Retracement Lookback period and multiplies it by 1.5 to ensure significant price movement.
3️⃣ Retest Condition:
A valid CHoCH allows slight price deviation after the structure shift (acts as a retest zone).
4️⃣ Higher Timeframe Confirmation (Optional):
If enabled, the script compares current CHoCH with a higher timeframe swing structure to reduce false signals.
📌 Script Inputs & Adjustments
Swing Lookback (Default: 10): Defines how many candles to check for previous swing highs/lows.
Retracement Lookback (Default: 5): Defines the number of candles for calculating the average body size (used to validate CHoCH strength).
Higher Timeframe Confirmation (Default: ON): Helps filter false signals by checking a larger market structure.
📌 Why Use This CHoCH Detector?
✅ Lightweight & Simple – No clutter, just clean CHoCH signals.
✅ Customizable Lookback Periods – Adjust sensitivity for different timeframes.
✅ Stronger CHoCH Validation – Avoids weak signals using retracement strength check.
✅ Works with Any Strategy – Can be combined with Fibonacci, FRVP, Trend Analysis, etc.
🚀 This script is ideal for traders who want an efficient and reliable CHoCH detection tool!
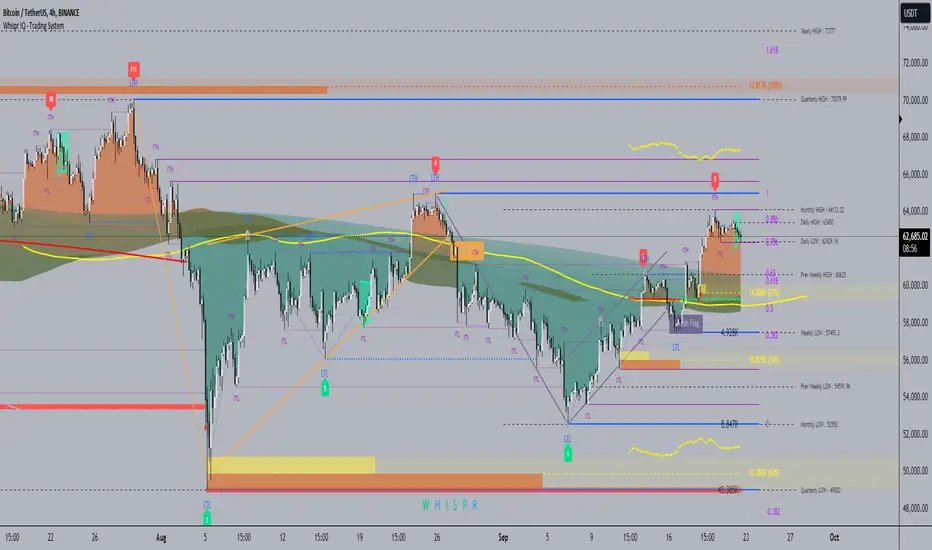
Whispr IQ - Trading SystemWhispr IQ - Trading System
This advanced multi-component indicator combines several powerful analysis tools to provide a comprehensive view of market conditions and potential trading opportunities.
Key Components:
Kernel Regression Ribbon
Institutional Order Flow
Volume Profile
Order Blocks
Swing Points and Liquidity
Naked POC (Point of Control)
Fibonacci Levels
Zig Zag Patterns
Divergence Scanner
Squeeze Bands
How It Works:
Kernel Regression Ribbon
Uses kernel regression to create a smoothed ribbon of price action
Multiple timeframes analyzed to show short, medium and long-term trends
Color coding indicates bullish/bearish bias
Institutional Order Flow
Identifies areas of high volume and potential institutional activity
Highlights order blocks, liquidity levels, and fair value gaps
Helps visualize potential support/resistance zones
Volume Profile
Displays volume distribution at different price levels
Identifies high volume nodes and value areas
Useful for determining potential reversal points
Order Blocks
Highlights significant swing highs/lows with high volume
Indicates potential areas where large players may have placed orders
Useful for identifying key support/resistance levels
Swing Points and Liquidity
Marks major swing highs and lows
Highlights areas of potential liquidity buildup
Helps identify trend changes and potential reversal zones
Naked POC
Shows uncovered Points of Control from volume profile analysis
Indicates areas of high trading activity that price has moved away from
Potential magnet for price to return to
Fibonacci Levels
Plots key Fibonacci retracement and extension levels
Useful for identifying potential support, resistance and targets
Multiple Fibonacci sequences used for confirmation
Zig Zag Patterns
Identifies key swing highs and lows
Filters out minor price movements
Helps visualize overall trend structure
Divergence Scanner
Scans for regular and hidden divergences on multiple indicators
Signals potential trend reversals or continuations
Configurable to scan RSI, MACD, CCI and other oscillators
Squeeze Bands
Identifies periods of low volatility (squeezes)
Signals potential for explosive moves when volatility expands
Based on Bollinger Bands and Keltner Channel relationships
The Whispr IQ system combines all these elements to provide a holistic view of market conditions. Traders can use the various signals and overlays to identify high-probability trade setups, key support/resistance levels, trend direction on multiple timeframes, and potential reversals.
This indicator is designed for experienced traders who can interpret the multiple data points and use them in conjunction with their own analysis and risk management. It's a powerful tool that can enhance trading decisions when used properly as part of a complete trading plan.
Pure Price Action Order & Breaker Blocks [LuxAlgo]The Pure Price Action Order & Breaker Blocks indicator is a pure price action adaptation of our previously published and highly popular Order-Blocks-Breaker-Blocks script.
Similar to its earlier version, this indicator detects order blocks that can automatically turn into breaker blocks on the chart once mitigated. However, the key difference/uniqueness is that the pure price action version relies solely on price patterns, eliminating the need for length definitions. In other words, it removes the limitation of user-defined inputs, ensuring a robust and objective analysis of market dynamics.
🔶 USAGE
An order block is a significant area on a price chart where there was a notable accumulation or distribution of orders, often identified by a strong price move followed by consolidation. Traders use order blocks to identify potential support or resistance levels.
A mitigated order block refers to an order block that has been invalidated due to subsequent market movements. It may no longer hold the same significance in the current market context. However, when the price mitigates an order block, a breaker block is confirmed. It is possible that the price might trade back to this breaker block, potentially offering a new trading opportunity.
Users can optionally enable the "Historical Polarity Changes" labels within the settings menu to see where breaker blocks might have previously provided effective trade setups.
This feature is most effective when using replay mode. Please note that these labels are subject to backpainting.
🔶 DETAILS
The swing points detection feature relies exclusively on price action, eliminating the need for numerical user-defined settings.
The first step involves detecting short-term swing points, where a short-term swing high (STH) is identified as a price peak surrounded by lower highs on both sides. Similarly, a short-term swing low is recognized as a price trough surrounded by higher lows on both sides.
Intermediate-term swing and long-term swing points are detected using the same approach but with a slight modification. Instead of directly analyzing price candles, we now utilize the previously detected short-term swing points. For intermediate-term swing points, we rely on short-term swing points, while for long-term swing points, we use the intermediate-term ones.
🔶 SETTINGS
Detection: Market structure used to detect swing points for creating order blocks.
Show Last Bullish OB: Number of the most recent bullish order/breaker blocks to display on the chart.
Show Last Bearish OB: Number of the most recent bearish order/breaker blocks to display on the chart.
Use Candle Body: Allows users to use candle bodies as order block areas instead of the full candle range.
🔹 Style
Show Historical Polarity Changes: Allows users to see labels indicating where a swing high/low previously occurred within a breaker block.
🔶 RELATED SCRIPTS
Pure-Price-Action-Structures.
Order-Blocks-Breaker-Blocks.
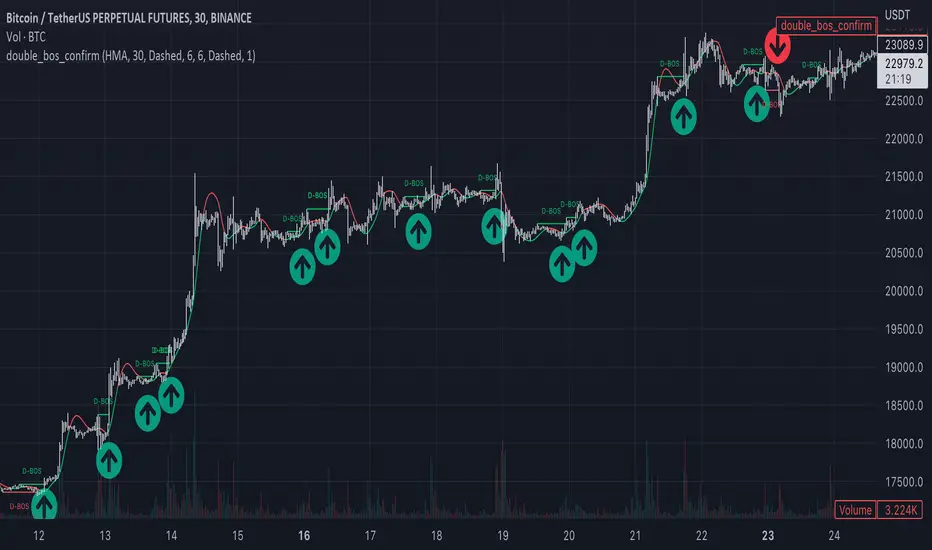
Market Structure Double BOS Confirm
🔥 Overview
🎯 This Double BOS(Break Of Structure) Confirm indicator combined ma-based BOS and classic BOS
to achieve a more credible BOS signal . it works well in most symbols with 2 parameters finetune.
🎯 It's a enhanced version compare with previous script.
🎯 at the same time, I keep D-BOS and BOS separately, you can use them in combination freely.
🔥 Indicator design logic
🎯 there are 3 parts in this indicator.
Part 1: MA-Based BOS
1. use close-in EMA's highest/lowest value mark as SWING High/Low when EMA crossover/under,
not use func ta.pivothigh()/ta.pivotlow()
2. once price reaching EMA’s SWING High/Low, draw a line link High/Low to current bar, labled as BOS
3. more MA-Based BOS details can get from my previous script.
Part 2: Classic BOS
1. use pivothigh/low function to find pivot (decided by left/right swing length)
2. when get new pivothigh, compare with previous high, calculate HH/LH/HL/LL result
3. once bar closed and break pivothigh then labed as BOS
Part 3: Double BOS Confirms
1. when MA-Based BOS and Classic BOS occured at the same bar closed signed as D-BOS
2. when two BOS events one bar apart, signed as D-BOS
🔥 Settings
🎯 there are 13 input properties in script, 4 properties(Bold field) have an impact on the results and the other 9 show display effects.
GRP1
MA_Type : MA type you can choose(EMA/RMA/SMA/HMA/WMA/VWMA), default is HMA
short_ma_len : MA length of your current timeframe on chart, default 30
show_ma_bos_line: whether show ma-based BOS line, default false
GRP2
left_swing_len : pivothigh(source, left,right), it‘s left swing length
right_swing_len : right swing length
show_pivot_bos_line: whether show pivot-based BOS line, default false
GRP3
show_double_bos_line: show double_bos_line, default true
double_bos_linewidth: linewidth, default 2 (Bold line)
double_bos_linestyle: default Dashed
🔥 Usage
🎯 BOS signal usually worked fine in high volatility market, low volatility is meaningless.
🎯 D-BOS will filtered much more signals than ma-based BOS and classic BOS
We can see that it performs well in trending market of different symbols, and BOS is an opportunity to add positions,
D-BOS will filtered much more signals
Double-BOS Confirm : BINANCE:BTCUSDTPERP 30m
MA-Based BOS : BINANCE:BTCUSDTPERP 30m
🎯 Support classic HH/HL label, MA-Based Zigzag
🎯 You can use only D-BOS, MA-BOS or Classic-BOS alone, or D-BOS and one of the other, it's up to you,
but my personal preference is to use D-BOS and MA-BOS in combination
🎯 any questions or suggestion please comment below, I would appreciate it greatly.
Additionally, I plan to publish 20 profitable strategies in 2023; indicatior not one of them,
let‘s witness it together!
Hope this indicator will be useful for you :)
enjoy! 🚀🚀🚀
Swing Pivots High LowBINANCE:BTCUSDT
This indicator is an opensource merge of the built in 'Pivot Points High Low' and the most popular 'Swing-high-low-support-resistance' indicators. The original 'Pivot Points High Low' does not have extensions with better visibility, while the most popular 'Swing-high-low-support-resistance' has no source available. I've also added additional configurable alert conditions for Pivot High and Low Crossover/Crossunder.
Please read the official documentation for further information about the indicator.

Advanced Market Structure [OmegaTools]📌 Market Structure
Advanced Market Structure is a next–generation indicator designed to decode price structure in real time by combining classical swing–based analysis with modern quantitative confirmation techniques. Built for traders who demand both precision and adaptability, it provides a robust multi–layered framework to identify structural shifts, trend continuations, and potential reversals across any asset class or timeframe.
Unlike traditional structure indicators that rely solely on visual swing identification, Market Structure introduces an integrated methodology: pivot detection, Donchian trend modeling, statistical confirmation via Z–Score, and volume–based validation. Each element contributes to a comprehensive, systematic representation of the underlying market dynamics.
🔑 Core Features
1. Five Distinct Market Structure Modes
Standard Mode:
Captures structural breaks through classical swing high/low pivots. Ideal for discretionary traders looking for clarity in directional bias.
Confirmed Breakout Mode:
Requires validation beyond the initial pivot break, filtering out noise and reducing false positives.
Donchian Trend HL (High/Low):
Establishes structure based on absolute highs and lows over rolling lookback windows. This approach highlights broader momentum shifts and trend–defining extremes.
Donchian Trend CC (Close/Close):
Similar to HL mode, but calculated using closing prices, enabling more precise bias identification where close–to–close structure carries stronger statistical weight.
Average Mode:
A composite methodology that synthesizes the four models into a weighted signal, producing a balanced structural bias designed to minimize model–specific weaknesses.
2. Dynamic Pivot Recognition with Auto–Updating Levels
Swing highs and lows are automatically detected and plotted with adaptive horizontal levels. These dynamic support/resistance markers continuously extend into the future, ensuring that historically significant levels remain visible and actionable.
3. Color–Adaptive Candlesticks
Price bars are dynamically recolored to reflect the prevailing structural regime: bullish (default blue), bearish (default red), or neutral (gray). This enables instant visual recognition of regime changes without requiring external confirmation.
4. Statistical Reversal Triggers
The script integrates a 21–period Z–Score calculation applied to closing prices, combined with multi–layered volume confirmation (SMA and EMA convergence).
Bullish trigger: Z–Score < –2 with structural confirmation and volume support.
Bearish trigger: Z–Score > +2 with structural confirmation and volume support.
Signals are plotted as diamond markers above or below the bars, identifying potential high–probability reversal setups in real time.
5. Integrated Alpha Backtesting Engine
Each market structure mode is evaluated through a built–in backtesting routine, tracking hit ratios and consistency across the most recent ~2000 structural events.
Performance metrics (“Alpha”) are displayed directly on–chart via a dedicated Performance Dashboard Table, allowing side–by–side comparison of Standard, Confirmed Breakout, Donchian HL, Donchian CC, and Average models.
Traders can instantly evaluate which structural methodology best adapts to the current market conditions.
🎯 Practical Advantages
Systematic Clarity: Eliminates subjectivity in defining structural bias, offering a rules–based framework.
Statistical Transparency: Built–in performance metrics validate each mode in real time, allowing informed decision–making.
Noise Reduction: Confirmed Breakouts and Donchian modes filter out common traps in structural trading.
Multi–Asset Adaptability: Optimized for scalping, intraday, swing, and multi–day strategies across FX, equities, futures, commodities, and crypto.
Complementary Usage: Works as a stand–alone structure identifier or as a quantitative filter in larger algorithmic/trading frameworks.
⚙️ Ideal Users
Discretionary traders seeking an objective reference for structural bias.
Quantitative/systematic traders requiring on–chart statistical validation of structural regimes.
Technical analysts leveraging pivots, Donchian channels, and price action as part of broader frameworks.
Portfolio traders integrating structure into multi–factor models.
💡 Why This Tool?
Market Structure is not a static indicator — it is an adaptive framework. By merging classical pivot theory with Donchian–style momentum analysis, and reinforcing both with statistical backtesting and volume confirmation, it provides traders with a unique ability:
To see the structure,
To measure its reliability,
And to act with confidence on quantifiably validated signals.

Dow Theory Indicator## 🎯 Key Features of the Indicator
### 📈 Complete Implementation of Dow Theory
- Three-tier trend structure: primary trend (50 periods), secondary trend (20 periods), and minor trend (10 periods).
- Swing point analysis: automatically detects critical swing highs and lows.
- Trend confirmation mechanism: strict confirmation logic based on consecutive higher highs/higher lows or lower highs/lower lows.
- Volume confirmation: ensures price moves are supported by trading volume.
### 🕐 Flexible Timeframe Parameters
All key parameters are adjustable, making it especially suitable for U.S. equities:
Trend analysis parameters:
- Primary trend period: 20–200 (default 50; recommended 50–100 for U.S. stocks).
- Secondary trend period: 10–100 (default 20; recommended 15–30 for U.S. stocks).
- Minor trend period: 5–50 (default 10; recommended 5–15 for U.S. stocks).
Dow Theory parameters:
- Swing high/low lookback: 5–50 (default 10).
- Trend confirmation bar count: 1–10 (default 3).
- Volume confirmation period: 10–100 (default 20).
### 🇺🇸 U.S. Market Optimizations
- Session awareness: distinguishes Regular Trading Hours (9:30–16:00 EST) from pre-market and after-hours.
- Pre/post-market weighting: adjustable weighting factor for signals during extended hours.
- Earnings season filter: automatically adjusts sensitivity during earnings periods.
- U.S.-optimized default parameters.
## 🎨 Visualization
1. Trend lines: three differently colored trend lines.
2. Background fill: green (uptrend) / red (downtrend) / gray (neutral).
3. Signal markers: arrows, labels, and warning icons.
4. Swing point markers: small triangles at key turning points.
5. Info panel: real-time display of eight key metrics.
## 🚨 Alert System
- Trend turning to up/down.
- Strong bullish/bearish signals (dual confirmation).
- Volume divergence warning.
- New swing high/low formed.
## 📋 How to Use
1. Open the Pine Editor in TradingView.
2. Copy the contents of dow_theory_indicator.pine.
3. Paste and click “Add to chart.”
4. Adjust parameters based on trading style:
- Long-term investing: increase all period parameters.
- Swing trading: use the default parameters.
- Short-term trading: decrease all period parameters.
## 💡 Parameter Tips for U.S. Stocks
- Large-cap blue chips (AAPL, MSFT): primary 60–80, secondary 25–30.
- Mid-cap growth stocks: primary 40–60, secondary 18–25.
- Small-cap high-volatility stocks: primary 30–50, secondary 15–20.

Advanced Swing Trading Suite(Mastersinnifty)🔹 Core Logic
The Advanced Swing Trading Suite is a complete framework for analyzing and trading market swings.
It combines:
A modified QQE momentum engine (adapted from the original QQE by © Peter_O under MPL 2.0).
RSI-based trend strength filter for validation.
Zigzag-driven swing structure detection (higher highs, higher lows, lower highs, lower lows).
Dynamic trade and risk management modules for practical execution.
By merging momentum, structure, and risk control, this tool goes beyond standalone indicators and provides a structured decision-support system for swing traders.
🔹 Uniqueness
While the QQE concept is freely available, this script builds an integrated swing trading ecosystem that adds multiple layers of functionality:
Swing structure analyzer that maps price action into HH, HL, LH, LL patterns in real time.
Dynamic percentage-based trade table that automatically logs entries, exits, P&L %, and timestamps.
Lot size calculator that converts account capital into position size per trade.
Swing extensions and retracement projections for planning targets.
Momentum confirmation via a tuned QQE + RSI engine.
This makes it not just an indicator, but a complete swing trading suite.
🔹 Key Features
✔ Modified QQE + RSI Momentum Filter → Early trend confirmation.
✔ Real-Time Swing Structure Labels (HH, HL, LH, LL) → Clear market context.
✔ Trade Performance Table → Tracks signals with percentage P&L and timing.
✔ Lot Size Calculator → Position sizing based on account capital.
✔ Dynamic Stops & Targets → Swing highs/lows as stops, extensions for projections.
✔ Alerts Ready → Configurable buy/sell alerts.
✔ Visual Labels → Background highlighting and trade markers.
🔹 How to Use
Entries: Green background = Long entry, Red background = Short entry.
Structure: HH/HL/LH/LL labels mark evolving swing structure.
Trade Table: Displays performance stats of past signals.
Risk Control: Use lot size calculator for instant position sizing.
Targets: Refer to swing extensions for profit zones.
Alerts: Set alerts for buy/sell triggers to receive notifications.
🔹 Disclaimer
This script integrates a modified version of QQE by © Peter_O (MPL 2.0 License).
Original QQE source: mozilla.org
All additional modules (swing analyzer, trade table, lot calculator, extensions) are original contributions by Mastersinnifty.
⚠️ Trading Disclaimer:
This script is for educational purposes only and does not constitute financial advice. Past performance is not indicative of future results. Always conduct your own research, test thoroughly, and trade with proper risk management.