TDI 7 MA and HISTOGRAMTDI %K Histogram with 7 MA
Overview
This indicator enhances trend and momentum analysis using the %K line from the Traders Dynamic Index (TDI), combined with a 7-period moving average (MA) and a histogram.
How It Works
The script calculates %K (similar to Stochastic RSI), representing the relative price position within a given range.
A 7-period Simple Moving Average (SMA) is applied to smooth the %K line, reducing noise and improving trend clarity.
A histogram is plotted based on the difference between %K and the 7-period MA:
Green bars indicate that %K is above the 7-period MA, suggesting bullish momentum.
Red bars indicate that %K is below the 7-period MA, suggesting bearish momentum.
Key Features
-%K Line (Blue) – Reflects short-term momentum shifts.
-7-period MA (Purple) – Helps smooth out fluctuations in %K for better trend identification.
-Histogram (Green/Red Columns) – Highlights momentum shifts visually.
Overbought (68), Midpoint (50), and Oversold (32) Levels – Provides reference points for potential reversals or trend continuation.
How to Use
Bullish Confirmation: When the histogram turns green and %K is above the 7 MA, it suggests upward momentum.
Bearish Confirmation: When the histogram turns red and %K is below the 7 MA, it suggests downward momentum.
Overbought/Oversold Conditions: Use the 68 and 32 levels as potential reversal zones, but always confirm with price action.
Midpoint (50 Level): Acts as a dynamic support/resistance area for momentum shifts.
This indicator is suitable for trend-following and momentum-based trading strategies, whether on lower timeframes for scalping or higher timeframes for swing trading.
Try it out and integrate it with your trading system to refine your entries and exits!
Поиск скриптов по запросу "swing trading"

GOLDEN Trading System by @thejamiulThe Golden Trading System is a powerful trading indicator designed to help traders easily identify market conditions and potential breakout opportunities.
Source of this indicator :
This indicator is built on TradingView original pivot indicator but focuses exclusively on Camarilla pivots, utilising H3-H4 and L3-L4 as breakout zones.
Timeframe Selection:
Before start using it we should choose Pivot Resolution time-frame accordingly.
If you use 5min candle - use D
If you use 15min candle - use W
If you use 1H candle - use M
If you use 1D candle - use 12M
How It Works:
Sideways Market: If the price remains inside the H3-H4 as Green Band and L3-L4 as Red band, the market is considered range-bound.
Trending Market: If the price moves outside Green Band, it indicates a potential up-trend formation. If the price moves outside Red Band, it indicates a potential down-trend formation.
Additional Features:
Displays Daily, Weekly, Monthly, and Yearly Highs and Lows to help traders identify key support and resistance levels also helps spot potential trend reversal points based on historical price action. Suitable for both intraday and swing trading strategies.
This indicator is a trend-following and breakout confirmation tool, making it ideal for traders looking to improve their decision-making with clear, objective levels.
🔹 Note: This script is intended for educational purposes only and should not be considered financial advice. Always conduct your own research before making trading decisions.

Multi-Timeframe Stochastic OverviewPurpose of the Multi-Timeframe Stochastic Indicator:
The Multi-Timeframe Stochastic Indicator provides a consolidated view of market conditions across multiple timeframes (M1, M5, M15, H1) based on the Stochastic Oscillator, a popular technical analysis tool. The main objective is to allow traders to quickly assess momentum and potential trend reversals across different timeframes on a single chart, helping to make informed trading decisions.
---
General Purpose of Stochastic Oscillator:
The Stochastic Oscillator measures the relationship between a security's closing price and its price range over a given period, aiming to identify momentum, overbought/oversold levels, and potential reversal points. It works on the assumption that:
1. In uptrends, prices tend to close near their highs.
2. In downtrends, prices tend to close near their lows.
It consists of two lines:
%K (fast line): Represents the raw Stochastic value.
%D (slow line): A moving average of %K, used to smooth the data for better signals.
The indicator is generally used to:
Identify Overbought (price above 80% threshold) and Oversold (price below 20% threshold) conditions.
Spot Bullish and Bearish divergences for potential trend reversals.
Evaluate momentum strength within a trend.
---
How This Multi-Timeframe Indicator Enhances Stochastic's Utility:
1. Multi-Timeframe Overview:
The indicator calculates Stochastic values for multiple timeframes (1-minute, 5-minute, 15-minute, and 1-hour) and displays their market conditions (e.g., Bullish, Bearish, Overbought, Oversold, or Indecision) in an organized table format.
This gives traders a broad perspective on short-term, mid-term, and long-term trends simultaneously.
2. Market Condition Summary:
Bullish: Indicates upward momentum (both %K and %D > 50%).
Bearish: Indicates downward momentum (both %K and %D < 50%).
Overbought: Suggests potential trend exhaustion (both %K and %D > 80%).
Oversold: Suggests a potential reversal to the upside (both %K and %D < 20%).
Indecision: Highlights uncertainty when %K and %D are on opposite sides of the 50% level.
3. Quick Decision-Making:
The color-coded table (green for Bullish/Overbought, red for Bearish/Oversold, orange for Indecision) allows traders to quickly identify dominant conditions and momentum alignment across timeframes, helping in trade confirmation.
4. Trend Analysis:
By observing alignment or divergence in market conditions across timeframes, traders can gauge the strength of a trend or anticipate reversals. For example:
If all timeframes show "Bullish," it suggests strong momentum.
If smaller timeframes are "Overbought" while larger ones are "Bearish," it warns of a possible pullback.
5. Customizable Parameters:
The indicator allows customization of Stochastic K, D, smoothing values, and overbought/oversold levels, enabling users to tailor the analysis to specific trading styles or market conditions.
---
Use Cases:
1. Scalping:
A scalper can use lower timeframes (e.g., M1, M5) to find overbought/oversold zones for quick trades.
2. Swing Trading:
Swing traders can align smaller timeframes with higher ones (e.g., M15 and H1) to confirm momentum before entering a trade.
3. Trend Reversals:
Overbought or oversold conditions across all timeframes may indicate a major reversal point, helping traders plan exits or countertrend entries.
4. Trend Continuation:
Consistent bullish or bearish conditions across all timeframes confirm the continuation of a trend, providing confidence to hold positions.
---
Summary:
This indicator enhances the traditional Stochastic Oscillator by giving a multi-timeframe snapshot of market momentum, overbought/oversold conditions, and trend direction. It enables traders to quickly assess the overall market state, spot opportunities, and make more informed trading decisions.

Swing High/Low (ZigZag) [ChartPrime]Swing High/Low (ZigZag) Indicator
The Swing High/Low (ZigZag) Indicator is a versatile tool for identifying and visualizing price swings, swing highs, and swing lows. It dynamically plots levels for significant price points while connecting them with a ZigZag line, enabling traders to analyze market structure and trends with precision.
⯁ KEY FEATURES
Swing Highs and Lows Detection
Accurately detects and marks swing highs and lows, providing a clear structure of market movements.
Real-Time ZigZag Line
Connects swing points with a dynamic ZigZag line for a visual representation of price trends.
Customizable Swing Sensitivity
Swing length input allows traders to adjust the sensitivity of swing detection to match their preferred market conditions.
Swing Levels with Shadows
Option to display swing levels with extended shadows for better visibility and market analysis.
Broken Levels Marking
Tracks and visually updates levels as dashed lines when broken, providing insights into shifts in market structure.
Swing Direction Display
At the top-right corner, the indicator displays the current swing direction (up or down) with a directional arrow for quick reference.
Interactive Labels
Marks swing levels with labels, showing the price of swing highs and lows for added clarity.
Dynamic Market Structure Analysis
Automatically adjusts ZigZag lines and levels as the market evolves, ensuring real-time updates for accurate trading decisions.
⯁ HOW TO USE
Analyze Market Trends
Use the ZigZag line and swing levels to identify the overall direction and structure of the market.
Spot Significant Price Points
Swing highs and lows act as potential support and resistance levels for trading opportunities.
Adjust Swing Sensitivity
Modify the swing length setting to match your trading strategy, whether scalping, day trading, or swing trading.
Monitor Broken Levels
Use the dashed lines of broken levels to identify changes in market dynamics and potential breakout or breakdown zones.
Plan Entries and Exits
Leverage swing levels and direction to determine optimal entry, stop-loss, and take-profit points.
⯁ CONCLUSION
The Swing High/Low (ZigZag) Indicator is a powerful tool for traders seeking to visualize price swings and market structure. Its real-time updates, customizable settings, and dynamic swing direction make it an invaluable resource for technical analysis and decision-making.

Dual Trendline Breakout [Splirus]This advanced trading tool leverages the power of dual pivot-based trendlines to provide traders with a superior edge in identifying potential breakout and retest opportunities. By combining two separate pivot lengths, the indicator creates both primary and secondary trendlines, enabling more robust confluence and decision-making in your trading strategy.
Key Features:
1. Dual Pivot Analysis:
Primary Trendline: Uses a shorter pivot length to capture immediate price movements and breakout scenarios.
Secondary Trendline: Employs a longer pivot length for broader trend identification and confirmation.
2. Enhanced Confluence:
The combination of short-term and long-term trendlines provides stronger signals, reducing false positives and enhancing accuracy.
3. Dynamic Visualization:
Automatically plots trendlines and extends them until they are crossed.
Distinct colors for uptrend and downtrend lines for easy interpretation.
Highlights where price breaks above or below the trendlines with bar coloring.
4. Alerts for Key Events:
Alerts are triggered for breakout and retest scenarios, ensuring you never miss critical market movements.
5. Customizable Settings:
Adjust pivot lengths, trendline colors, and visualization preferences to suit your trading style.
Optional settings for showing only the most recent trendlines, hiding crossed lines, and extending lines dynamically.
How It Works:
The indicator identifies pivot highs and lows based on the specified lengths for both primary and secondary trendlines.
When price interacts with these trendlines (breakout, retest, or cross), it highlights the event with customizable bar colors and optional alerts.
By monitoring these interactions, traders can better time their entries and exits, leveraging the dual-period analysis for stronger market confluence.
Ideal Use Cases:
Scalping: Use primary trendlines for quick trade opportunities.
Swing Trading: Combine primary and secondary trendlines for more significant market moves.
Trend Continuation or Reversal: Identify breakout confirmations or retests for confident trade setups.
This indicator is a powerful addition to any trader's toolkit, offering precision, adaptability, and actionable insights for navigating the markets with confidence.
Its closed-source design ensures that the unique advantages of the Dual Trendline identification algorithm remain exclusive to its users, providing an edge that cannot be duplicated elsewhere.

CHAKRA RISS ENGULFING CANDLESTICK STRATEGYChakra RISS Engulfing Candlestick Strategy
Type: Technical Indicator & Strategy
Platform: TradingView
Script Version: Pine Script v6
Overview:
The Chakra RISS Engulfing Candlestick Strategy combines a momentum-based approach using the Relative Strength Index (RSI) with Engulfing Candlestick Patterns to generate buy and sell signals. The strategy filters trades based on price movement relative to a 50-period Simple Moving Average (SMA), making it a trend-following strategy.
The indicator uses color-coded bars to visually represent market conditions, helping traders easily identify bullish and bearish trends. The strategy is designed to be dynamic, adapting to changing market conditions and filtering out noise using key technical indicators.
How It Works:
RSI-Based Color Conditions:
Green Bars: When the RSI crosses above a specified UpLevel (default: 50), indicating a bullish momentum and signaling potential buy conditions.
Red Bars: When the RSI crosses below a specified DownLevel (default: 50), indicating a bearish momentum and signaling potential sell conditions.
Buy Signal:
Triggered when the following conditions are met:
RSI crosses from below the UpLevel (default: 50) to above it, signaling increasing bullish momentum.
The close price is above the 50-period Simple Moving Average (SMA), confirming an uptrend.
The Buy Signal is plotted below the bar with a green arrow and a "BUY" label.
Sell Signal:
Triggered when the following conditions are met:
RSI crosses from above the DownLevel (default: 50) to below it, signaling increasing bearish momentum.
The close price is below the 50-period Simple Moving Average (SMA), confirming a downtrend.
The Sell Signal is plotted above the bar with a red arrow and a "SELL" label.
Stop Loss and Take Profit:
For long trades (buy signals), the stop loss is placed below the previous bar's low, and the take profit is set at 3% above the entry price.
For short trades (sell signals), the stop loss is placed above the previous bar's high, and the take profit is set at 3% below the entry price.
Dynamic Bar Coloring:
The bar colors change dynamically based on RSI levels:
Green Bars: Indicating a potential uptrend (bullish).
Red Bars: Indicating a potential downtrend (bearish).
These visual cues help traders quickly identify market trends and potential reversals.
Trend Filtering:
The 50-period Simple Moving Average (SMA) is used to filter trades based on the overall market trend:
Buy signals are only considered when the price is above the moving average, indicating an uptrend.
Sell signals are only considered when the price is below the moving average, indicating a downtrend.
Alerting System:
Alerts can be set for both buy and sell signals. These alerts notify traders in real-time when potential trades are generated, allowing them to act promptly.
Alerts can be configured to send notifications through email, SMS, or a webhook for integration with other services like IFTTT or Zapier.
Key Features:
RSI and Moving Average-Based Signals: Combines RSI with a moving average for more accurate trade signals.
Stop Loss and Take Profit: Dynamic risk management with custom stop loss and take profit levels based on previous high and low prices.
Buy and Sell Alerts: Provides real-time alerts when a buy or sell signal is triggered.
Trend Confirmation: Uses the 50-period Simple Moving Average to filter signals and confirm the direction of the trend.
Visual Bar Color Changes: Makes it easy to identify bullish or bearish trends with color-coded bars.
Usage:
This strategy is suitable for traders who prefer a trend-following approach and want to combine momentum indicators (RSI) with price action (Engulfing Candlestick patterns). It is particularly useful in volatile markets where quick identification of trend changes can lead to profitable trades.
Best Used For: Day trading, swing trading, and trend-following strategies.
Timeframes: Works well on various timeframes, from 1-minute charts for scalping to daily charts for swing trading.
Markets: Can be applied to any market with sufficient liquidity (stocks, forex, crypto, etc.).
Settings:
UpLevel: The RSI level above which the market is considered bullish (default: 50).
DownLevel: The RSI level below which the market is considered bearish (default: 50).
SMA Length: The period of the Simple Moving Average used to filter trades (default: 50).
Risk Management: Customizable stop loss and take profit settings based on price action (default: 3% above/below the entry price).

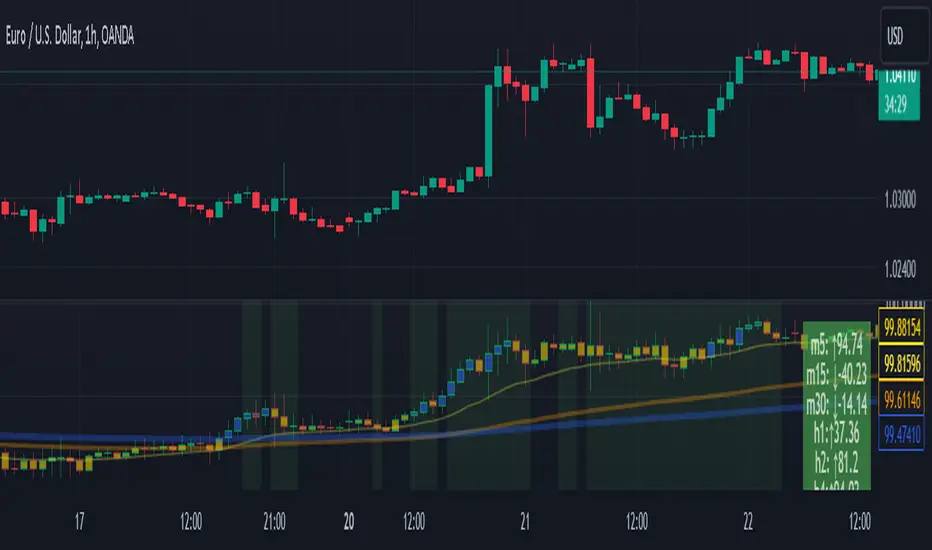
tripleFlows Master EUR - by ManhDNThe TripleFlows Master EUR indicator is a technical analysis tool designed for TradingView to systematically evaluate the strength or weakness of the Euro (EUR) across 7 major currency pairs. This indicator provides a clear and objective measure of EUR momentum by analyzing moving averages, aggregating the data into a comprehensive Flow Index, and visualizing the collective price action of the Euro.
---
How It Works
1. Data Collection:
- The indicator pulls price data from the 7 most significant EUR currency pairs:
EUR/USD, EUR/JPY, EUR/GBP, EUR/AUD, EUR/CAD, EUR/NZD, and EUR/CHF.
2. Moving Average Calculation:
- For each of the 7 currency pairs, the indicator computes:
- A 5-period moving average (MA).
- A 20-period moving average (MA).
- It then compares these two moving averages to identify whether the trend for each pair is bullish or bearish:
- If MA(5) > MA(20), the trend is considered bullish for the Euro.
- If MA(5) < MA(20), the trend is considered bearish for the Euro.
3. Flow Index Aggregation:
- The indicator aggregates the trend signals from all 7 currency pairs to calculate a Flow Index, which ranges from -100 to +100:
- +100: All 7 pairs indicate a bullish trend for EUR (maximum strength).
- -100: All 7 pairs indicate a bearish trend for EUR (maximum weakness).
- Values closer to 0 indicate a more neutral market condition.
4. Visual Representation of Composite Price Action:
- In addition to the Flow Index, the TripleFlows Master EUR generates a **composite candlestick chart** based on the aggregated price action of the 7 EUR pairs.
- This chart provides a clear visual representation of the Euro's overall price behavior, allowing traders to analyze trends directly through candlestick patterns and moving averages.
- By observing this chart, traders can make decisions based on the combined action of all 7 pairs, rather than relying on a single pair.
5. Triple Flow Calculation Across Timeframes:
- The Flow Index is calculated on three timeframes:
- Junior (short timeframe).
- Medior (medium timeframe).
- Senior (long timeframe).
- The indicator evaluates the Flow Index across these three timeframes to determine Triple Flow:
- Triple Flow Up (Bullish): All three timeframes show a Flow Index of +100.
- Triple Flow Down (Bearish): All three timeframes show a Flow Index of -100.
---
Purpose and Application
- Trend Confirmation:
The TripleFlows Master EUR provides objective trend confirmation by synthesizing data across multiple pairs and timeframes.
- Bullish Trend: Look for opportunities to go long when Triple Flow Up is confirmed.
- Bearish Trend: Look for opportunities to go short when Triple Flow Down is confirmed.
- Multi-Timeframe Consistency:
The synchronization of the Flow Index across junior, medior, and senior timeframes ensures high-probability setups by aligning short-term and long-term trends.
- Composite Price Action Analysis:
The composite candlestick chart simplifies the analysis of EUR price behavior by aggregating data from 7 pairs, helping traders identify trends, key levels, and patterns visually.
---
Outputs and Visuals
1. Flow Index:
- Displayed as a value between -100 and +100, showing the aggregated strength or weakness of the Euro.
2. Composite Candlestick Chart:
- A real-time chart that represents the Euro's collective price action across 7 pairs.
3. Triple Flow Status:
- Visual indication of Triple Flow conditions (e.g., Triple Flow Up or Triple Flow Down) based on the alignment of Flow Index values across all three timeframes.
4. Alerts:
- The indicator includes alerts for when a Triple Flow Up or Down condition is detected, allowing users to respond to key market opportunities.
---
Technical Notes
- Flow Index Calculation:
The calculation is based purely on the relative position of the 5-period and 20-period moving averages across 7 pairs. It does not rely on external factors, ensuring the results are fully derived from price data.
- Composite Price Action:
The composite candlestick chart integrates the aggregated price movements of 7 pairs into a single, easy-to-read visual representation.
- Scalability Across Timeframes:
The TripleFlows Master EUR can be applied to any trading style, as it adapts to various timeframes:
- Junior timeframe for intraday analysis.
- Medior timeframe for swing trading.
- Senior timeframe for position trading.
---
Conclusion
The TripleFlows Master EUR indicator provides a robust, data-driven solution for analyzing the Euro’s performance across major currency pairs. By aggregating price action from 7 pairs into a composite candlestick chart and synchronizing trends across multiple timeframes, the indicator eliminates the limitations of analyzing individual pairs in isolation. This comprehensive approach ensures traders can identify trends and opportunities with greater accuracy and confidence.
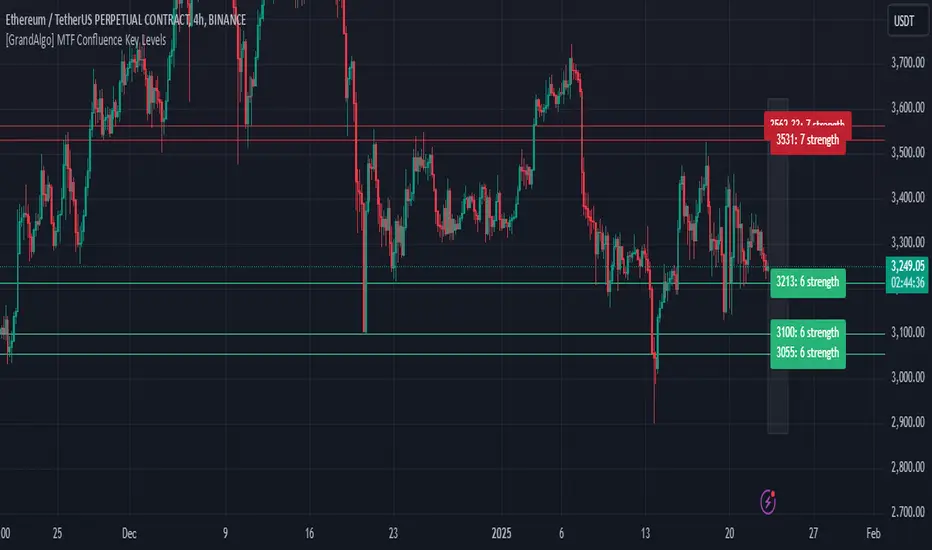
[GrandAlgo] MTF Confluence Key LevelsMTF Confluence Key Levels
The MTF Confluence Key Levels indicator is a powerful tool designed to identify pivotal price levels by analyzing price action across three timeframes . By leveraging a proprietary algorithm, this indicator filters out noise and highlights only the most significant zones, providing traders with actionable insights into potential price reactions.
With daily level resets , the indicator ensures traders work with the most current data, enabling precision and confidence in their trading decisions. Whether you’re a day trader, swing trader, or long-term investor, this tool adapts seamlessly to your trading style across all markets.
Key Features:
Multi-Timeframe Analysis: Evaluates price data across three timeframes to identify areas of confluence with high accuracy.
Daily Level Reset: Automatically refreshes key levels each day to reflect the latest market dynamics.
Proprietary Algorithm: Filters out insignificant levels to focus on zones that matter most, reducing chart clutter.
Universal Application: Compatible with Forex, crypto, stocks, indices, and commodities.
Customizable Settings: Tailor the indicator to align with your preferred strategy and level of precision.
Benefits:
Identify high-probability zones for potential reversals, breakouts, or consolidations.
Align short-term trades with long-term trends for enhanced confluence.
Optimize entries and exits by using precise confluence levels.
Improve risk management by setting stop-loss and take-profit levels based on robust support and resistance zones.
Adaptable for all trading styles, including day trading, swing trading, and position trading.
Use Cases:
Confirm overarching market trends by analyzing key levels from higher timeframes.
Refine trade entries and exits by leveraging multi-timeframe confluence.
Combine key levels with other tools, such as volume and momentum indicators, for enhanced decision-making.
Adjust strategies daily with updated levels reflecting current price action.
The image showcases how the MTF Confluence Key Levels indicator dynamically highlights critical areas of market interest using three timeframes for actionable trading insights.
Disclaimer:
This indicator is a technical analysis tool designed to assist traders by providing insights into market conditions. It does not guarantee future price movements or trading outcomes and should not be relied upon as a sole decision-making tool. The effectiveness of this indicator depends on its application, which requires your trading knowledge, experience, and judgment.
Trading involves significant financial risk, including the potential loss of capital. Past performance of any tool or indicator does not guarantee future results. This script is intended for educational and informational purposes only and does not constitute financial or investment advice. Users are strongly encouraged to perform their own analysis and consult with a qualified financial professional before making trading decisions.
Hourly Market Movement Pattern Indicator# Hourly Market Movement Pattern Indicator
This versatile technical analysis tool identifies the most active hours for trading by analyzing historical price movements. While it can be viewed on any timeframe chart, the indicator specifically tracks and displays which hours of the day historically show the strongest upward or downward price movements, helping traders optimize their trading schedule around these recurring hourly patterns.
## Core Features
- Tracks the best performing hours for both upward and downward movements
- Viewable on any timeframe chart while maintaining hourly analysis
- Clear visual display through a color-coded table overlay
- Real-time updates with new market data
- Works with all trading instruments (stocks, crypto, forex, futures, etc.)
## Timeframe Applications
### Chart Viewing Options
- Can be viewed on any timeframe chart (1min to Monthly)
- Maintains hourly pattern analysis regardless of chart timeframe
- Helps correlate hourly patterns with your preferred trading timeframe
- Allows detailed visualization of hourly patterns within your analysis period
### Intraday Trading
- Identify the most profitable hours for trading
- Plan trading sessions around historically strong hours
- Optimize entry and exit timing based on hourly patterns
- Structure day trading schedules around peak movement hours
### Swing Trading
- Use hourly statistics to optimize entry/exit timing
- Plan trade executions during historically strong hours
- Time position entries based on hourly success rates
- Enhance swing trading decisions with hourly pattern data
## Practical Applications
### Pattern Recognition
- Track recurring hourly market movements
- Identify institutional trading hour patterns
- Detect regular market cycle hours
- Recognize changes in hourly market behavior
### Risk Management
- Adjust position sizing based on historical hourly patterns
- Plan entries during statistically favorable hours
- Time stop loss adjustments around known volatile hours
- Scale positions according to hourly success rates
### Trade Planning
- Schedule trading sessions during optimal hours
- Plan trade executions around strong movement periods
- Structure trading day around peak hours
- Time position adjustments to favorable hours
## Setup Options
- Timeframe: View on any chart timeframe while tracking hourly patterns
- Visual Display: Non-intrusive table overlay
- Color Coding: Green for upward movements, Red for downward movements
- Hour Display: 24-hour format for global market compatibility
## Trading Strategy Integration
The indicator enhances trading approaches through:
- Optimal hour identification for trade execution
- Historical hourly pattern analysis
- Day trading session optimization
- Position timing based on hourly statistics
## Notes
This indicator proves particularly valuable for:
- Traders seeking to optimize their daily trading schedule
- Day traders focusing on peak market hours
- Swing traders optimizing entry/exit timing
- Traders adapting strategies to specific market hours
- International traders tracking hour-specific patterns across sessions
The tool's hourly pattern analysis provides crucial timing information regardless of your preferred chart timeframe or trading style, helping optimize trade execution around the most statistically favorable hours of the day.

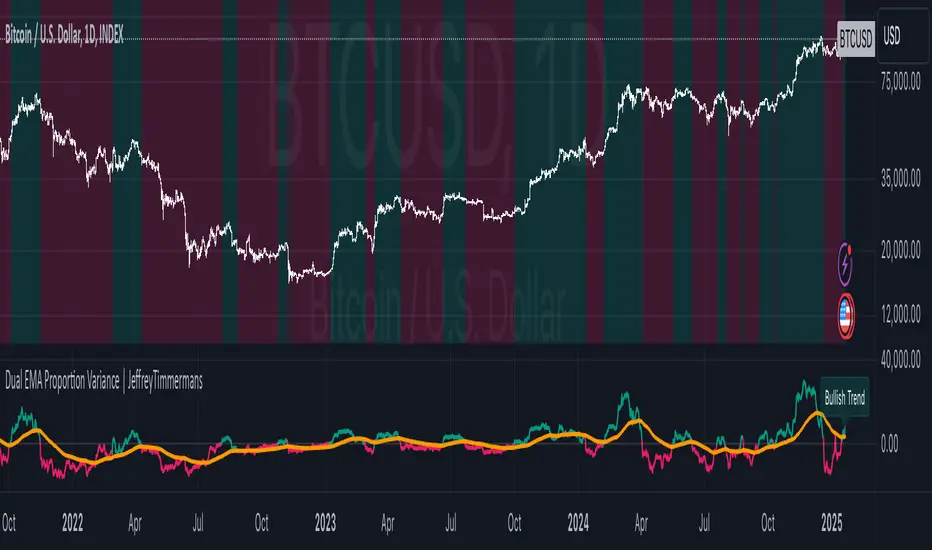
Dual EMA Proportion Variance | JeffreyTimmermansDual EMA Proportion Variance
The "Dual EMA Proportion Variance" Indicator provides a robust way to analyze price trends, volatility, and momentum using dual EMA calculations combined with percentile-based thresholds. This approach enables traders to identify significant bullish and bearish trends while incorporating smoothing and tailoring options for better adaptability.
Key Features
Dual EMA with Proportion Variance
DEMA Calculation: Computes the Dual Exponential Moving Average (DEMA) based on a user-defined length and source.
Proportion Thresholds: Uses percentile-based thresholds (e.g., 60/45, 60/40, 55/45, or 55/40) to determine upper and lower bounds for trend detection. Percentile thresholds help identify key levels of market behavior based on historical data.
Momentum and Volatility Analysis
Momentum Calculation: Computes momentum based on proximity to percentile levels, smoothed using a simple moving average (SMA) if enabled.
Volatility Incorporation: Uses the standard deviation (SD) of the lower percentile (PerDown) to define additional levels of significance.
Smoothing and Trend Calculation
Smoothing Options: Enables optional smoothing for momentum and trend values, helping reduce noise.
EMA Confluence: Adds an additional EMA overlay to enhance the trend confirmation process.
Customizable Visuals
Background Coloring: Dynamically changes the background color based on trend direction (bullish or bearish).
Momentum Plotting: Displays smoothed momentum and EMA confluence lines on the chart, with clear visual differentiation.
Alerts
Bullish Signal: Triggers when the trend transitions from neutral or bearish to bullish.
Bearish Signal: Triggers when the trend transitions from neutral or bullish to bearish.
Inputs Overview
DEMA Inputs
Length (DemaLen): Defines the length of the Dual EMA calculation.
Source (DemaSrc): Allows selection of price data (e.g., high, low, close) for the DEMA computation.
Proportion Settings
Proportion Length (PerLen): Defines the lookback period for percentile calculations.
Proportion Type (pertype): Choose from predefined combinations (e.g., 60/45, 60/40) to customize thresholds.
Smoothing Options
Enable Smoothing (UseSmoothing): Toggle to enable or disable smoothing.
Smoothing Length (SmoothingLen): Specifies the lookback period for smoothing.
Standard Deviation
Length (SDlen): Length of the lookback period used to calculate the standard deviation.
Tailoring
Bullish/Bearish Colors (ColUp/ColDown): Customizable colors for bullish and bearish trends.
Background Colors (ShowBGCol): Toggle to enable or disable background coloring.
Momentum Plot (PlotMomentum): Toggle to show or hide the momentum plot.
EMA Confluence
Enable Extra EMA (IncludeEma): Adds an additional EMA layer for trend confirmation.
Length (EmaLen): Defines the length of the EMA.
Indicator Behavior
Trend Detection
Bullish Trend: When the smoothed momentum (smoothedPT) is above zero and higher than the EMA (if enabled).
Bearish Trend: When the smoothed momentum is below zero and lower than the EMA (if enabled).
Signal Generation
Bullish Signal: Triggered on a crossover of smoothedTrend from negative to positive.
Bearish Signal: Triggered on a crossunder of smoothedTrend from positive to negative.
Customizations
Percentile Adjustments: Choose from various proportion thresholds to suit specific market conditions.
Smoothing Options: Fine-tune the level of noise reduction by adjusting smoothing parameters.
Visual Tailoring: Customize chart visuals, including colors, momentum plots, and background highlights.
EMA Inclusion: Optionally enable the extra EMA for more conservative trend confirmation.
Use Cases
Momentum Trading: Identify bullish or bearish momentum shifts based on percentile levels.
Volatility Assessment: Incorporate standard deviation levels to evaluate price volatility.
Trend Following: Align trades with dominant market trends using percentile thresholds and EMA confirmation.
Alerts for Automation: Set alerts for real-time notifications of potential trade opportunities.
This indicator provides flexibility and precision, making it suitable for a variety of trading styles, including trend following, swing trading, and momentum-based strategies.
This script is inspired by "Patito_1" . However, it is more advanced and includes additional features and options.
-Jeffrey
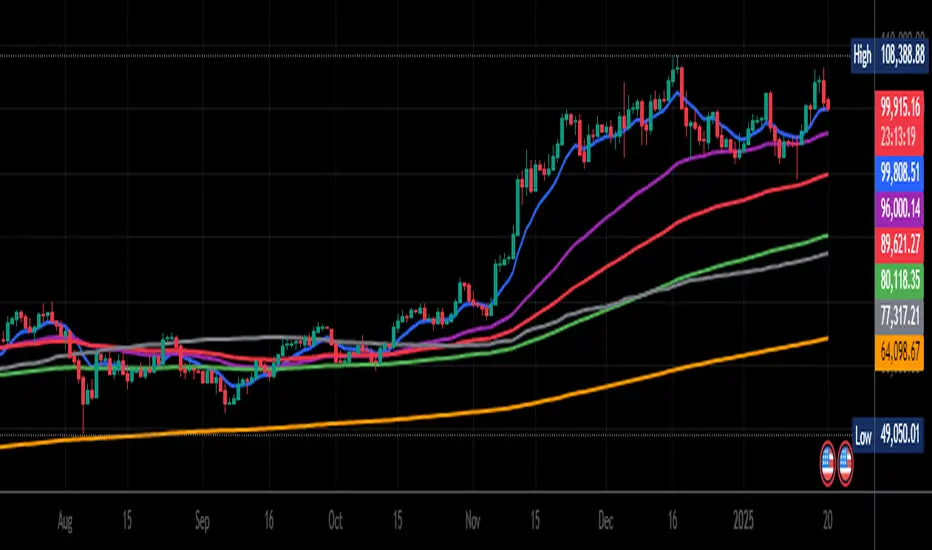
BK Multiple MA, RMA, SMA, HMA, VWAP, Rolling VWAP **Indicator Description**
I’m incredibly proud to introduce my third indicator to the TradingView community: **BK Multiple MA with HMA, VWAP, and Rolling VWAP**! This tool has been a game-changer in my trading strategy, and I’m excited to share it with others who are navigating the markets.
This indicator holds a special place in my heart because it represents the first technical analysis concept introduced to me by my mentor when I began apprenticing under him. His wisdom, guidance, and passion for trading—and for life—left an indelible mark on my journey. I dedicate this work, and every indicator I introduce, to the foundation he helped me build, while giving glory first and foremost to God.
**Moving Averages (MAs)** are one of the most widely used tools in technical analysis, and this indicator takes them to the next level. It allows you to plot **six fully customizable moving averages simultaneously**, with options including:
- **Exponential Moving Average (EMA)**
- **Simple Moving Average (SMA)**
- **Relative Moving Average (RMA)**
- **Hull Moving Average (HMA)**
- **Volume Weighted Average Price (VWAP)**
- **Rolling VWAP**
This flexibility makes the indicator highly versatile, whether you’re a day trader, swing trader, or long-term investor. By customizing periods, colors, and line widths for each MA, you can tailor the indicator to perfectly suit your trading style.
**Key Features**
1. **Six Fully Customizable MAs**:
- Adjust periods, line colors, and widths to match your preferences.
- Select from EMA, SMA, RMA, HMA, VWAP, or Rolling VWAP for each line.
2. **Unique Rolling VWAP Option**:
- Rolling VWAP calculates the volume-weighted average price over a user-defined period, such as 200 candles.
- This feature is ideal for traders seeking volume-weighted levels that don’t reset with each session, making it invaluable for trend-following and swing trading.
3. **HMA for Smoother Trends**:
- The Hull Moving Average (HMA) is designed to reduce lag and provide a responsive, noise-free view of price trends.
- It’s a powerful tool for spotting reversals and confirming directional momentum.
4. **Session VWAP**:
- Traditional VWAP resets with each trading session, making it a reliable benchmark for intraday support and resistance levels.
**How It Works**
- **VWAP**: Reflects the average price weighted by volume for the current trading session, commonly used by institutional traders to identify key price levels.
- **Rolling VWAP**: Extends VWAP functionality by calculating over a user-defined period, allowing for flexible multi-timeframe analysis.
- **HMA**: A fast, smooth moving average that reacts quickly to price changes while filtering out noise.
The combination of these options provides traders with a comprehensive view of market dynamics, enabling better decision-making.
**Final Thoughts**
This indicator is deeply meaningful to me because it represents the first concept my mentor introduced when I began apprenticing under him. His wisdom, guidance, and passion for trading—and for life—left an indelible mark on my journey. I dedicate this work, and every indicator I introduce, to the foundation he helped me build, while giving glory first and foremost to God.
If this indicator helps you succeed, I humbly ask that you honor the blessings in your life by giving back—whether through acts of kindness, philanthropy, or helping others in need.
May the Almighty guide us all toward wisdom and success in our endeavors. All glory belongs to God!
Multi-Timeframe Technical IndicatorThis Multi-Timeframe Technical Indicator is designed for use in financial markets to assist traders in evaluating various key technical indicators across multiple timeframes. The indicator displays a table that includes the values of Moving Averages (MA), Relative Strength Index (RSI), Momentum, and VWAP for a range of timeframes, allowing for the evaluation of trends in real-time.
Key Features:
Multiple Timeframes: The indicator supports timeframes ranging from as low as 1 minute up to 1 month. By tracking indicators on multiple timeframes, traders can make better-informed decisions based on trends across different periods (e.g., short-term vs. long-term trends).
Technical Indicators:
Moving Average (MA): The MA provides insight into the trend direction of the asset's price. It can be configured as Simple Moving Average (SMA), Exponential Moving Average (EMA), or Weighted Moving Average (WMA).
Relative Strength Index (RSI): A momentum oscillator that measures the speed and change of price movements. RSI values below 50 suggest an upward trend, while values above 50 indicate a downward trend.
Momentum: Measures the rate of change of an asset's price, highlighting whether the price is increasing or decreasing.
VWAP (Volume Weighted Average Price): Reflects the average price of the asset weighted by its trading volume. Traders use this value to gauge the fair value of an asset.
Trend Indicators: The table dynamically displays trend arrows (↑ or ↓) based on the comparison of each indicator's value to the previous timeframe’s value. This allows users to identify the prevailing market sentiment or trend at a glance.
Visualization: The data is presented in an easy-to-read table format, where each value is accompanied by color-coded indicators (e.g., green for bullish trends, red for bearish trends). This provides a clear and visually accessible way to interpret complex market conditions.
Use Cases:
Day Trading: Helps day traders assess the momentum and strength of a price move on short-term timeframes like 1-minute, 5-minute, and 15-minute intervals.
Swing Trading: Provides insights into medium-term trends using 1-hour, 4-hour, and daily data points.
Long-Term Analysis: Useful for traders and investors looking to gauge the overall health of an asset over weeks or months, analyzing the 1-week and 1-month indicators.
Limitations and Risks:
As with all technical indicators, it is important to remember that the Multi-Timeframe Technical Indicator is not foolproof. While technical analysis offers valuable insights, it does not guarantee success and can lead to losses. Traders should always use a combination of different methods (technical and fundamental) and consult with financial advisors before making trading decisions.
The indicator operates as a tool for analysis but should not be the sole basis for trading decisions. According to Elder (1993), no indicator is perfect, and it is crucial to combine multiple factors when assessing market conditions. Additionally, Murphy (1999) emphasized the importance of understanding the limitations of indicators, as they are based on historical price movements and may not always predict future trends accurately.
References:
Elder, A. (1993). Trading for a Living. Wiley.
Murphy, J. J. (1999). Technical Analysis of the Financial Markets. New York Institute of Finance.
This Multi-Timeframe Technical Indicator is built to provide real-time, comprehensive data for informed decision-making, and is best used in conjunction with other analysis methods to manage risk effectively.

[volfgang] Pivot Levels (Open, Close, High, Low)This script provides a clear and consistent way to track key price levels from Weekly and Daily bars, directly on your current chart interval.
The default colours are;
Today & This Week Open = White
Yesterday & Previous Week Open = Cream
Yesterday's High = Red
Yesterday's Low = Green
Weekly Pivots are 2px, and Daily Pivots are 1px.
Instead of requiring manual referencing of daily or weekly charts, these significant levels are automatically drawn and updated in real time, extending to the right as new bars form.
It adds value by helping traders quickly identify potential support/resistance zones and compare intraday price action with higher-timeframe pivots. This approach can aid in scalping, day trading, or swing trading strategies that rely on past price levels for trade entries, exits, or stop loss placement.
Daily Pivots Displayed Intraday
The script imports the previous day’s High, Low, Open, and Close and draws lines on the current chart, so you can see exactly where those levels lie on any intraday timeframe. You can easily change the colour of these lines in the menu.
Instead of switching between multiple charts for daily references, you can keep an intraday chart open and still watch how price behaves around these important daily pivots.
Weekly Pivots for Broader Context
In addition to daily levels, it also shows the previous week’s Open and Close. This feature helps traders who want to maintain a broader perspective and gauge the market’s weekly trend or bias while remaining on lower timeframes.
Automatic Line & Label Management
Each new trading day triggers a “session change” in the code, prompting the script to delete old lines and labels for daily levels. This keeps your chart from getting cluttered with outdated lines.
Weekly lines and labels follow the same approach, ensuring only the most recent weekly levels are highlighted.
Real-Time Extension
Lines are continuously extended to the right as new bars print, ensuring that you always have an updated view of your key price levels without any manual adjustments.
On the last bar, the script shifts to a time-based coordinate system for seamless visual extension.
Minimal Recalculation
This script uses security() calls in a carefully optimized way to reduce unnecessary recalculations and avoid repaint issues. By referencing open , close , etc., the lines remain fixed once the daily (or weekly) candle is confirmed.
Flexible Usage
You can apply this script to any symbol on TradingView. It’s especially beneficial for Forex pairs, indices, futures, or cryptocurrencies where you want to track significant past levels.
If you’re a scalper looking for areas of likely reaction, or a swing trader watching weekly opens for trend confirmation, these levels can be integral to your technical approach.
How to Use
Add to Chart: Click the “Add to Favorite Indicators” or “Apply to Chart” button once published.
Enable or Disable Previous Day Bars: Use the script’s input to toggle the display of previous day’s High, Low, Open, and Close lines if you only want weekly lines (or vice versa).
Customize Visuals: You can change line colors, width, and label text in the “Style” or “Inputs” tab. Adjust them to fit your preferred color scheme.
Interpretation:
Daily levels typically carry relevance for the next trading session. They can be used for intraday support/resistance, breakout checks, or gap fills.
Weekly levels help identify more prominent zones for bigger moves or for understanding overall sentiment from the prior week.
Conceptual Underpinnings
Support/Resistance: Past opens/closes often act as support or resistance because they represent important points of reference (where trading started or ended during a prior session).
Market Psychology: Many traders watch daily or weekly closes to gauge momentum and bias, which can become self-fulfilling as more participants join around those levels.
Improved Situational Awareness: By having these levels automatically drawn and updated, traders avoid missing critical areas where price may pivot.
This script is intentionally open-source to help traders study and personalize it.
By merging daily and weekly pivot concepts in a single script, it provides a convenient and efficient tool—rather than a simple mashup, it unifies two timeframes that are crucial in short-term and medium-term trading decisions.
Remember that these levels alone do not constitute a complete trading system; they are best used as part of a broader strategy involving risk management, additional technical signals, and market context.

Pivot Points High Low - JVersion**Indicator Name**: Pivot Points High Low (Without Price Labels)
**Overview**
The Pivot Points High Low indicator is designed to identify and mark local highs and lows (or “pivot” points) on a price chart. Unlike other pivot-based indicators that label each pivot with its exact price, this version displays only small circular markers—removing clutter and focusing attention on the pivot locations themselves.
**Key Features**
1. **Pivot Detection**
- The script uses TradingView’s built-in `ta.pivothigh()` and `ta.pivotlow()` functions to determine when the market has formed a pivot high or pivot low.
- You can define how many bars to the left and right are required to confirm a pivot, helping you tailor the indicator to different market conditions and timeframes.
2. **Clean Markers**
- Each confirmed pivot high or low is represented by a circle placed precisely on the candle where the pivot is detected.
- No numeric labels are shown, keeping your chart visually uncluttered while still highlighting important turning points in price.
3. **Customization**
- **Left/Right Pivot Length**: Choose how many bars to the left and right must be lower (for highs) or higher (for lows) to validate a pivot. Larger values mean fewer but more significant pivots; smaller values mean more frequent pivots.
- **Marker Colors**: Independently customize the colors of the high-marker circles and low-marker circles to easily distinguish between local tops and bottoms.
4. **Usage and Interpretation**
- **Identifying Reversals**: As soon as a circle appears at a local high or low, it may indicate a short-term trend reversal or the beginning of a new swing in price.
- **Combine with Other Tools**: Pivot points are more informative when used alongside broader trend analysis, support/resistance identification, or other momentum indicators.
- **Adjusting Sensitivity**: By increasing or decreasing the left/right pivot lengths, you can make the indicator more or less sensitive to small market fluctuations.
5. **Practical Tips**
- **Swing Trading**: Shorter lengths can be used by swing traders looking for quick reversals in lower timeframes.
- **Longer-Term Trends**: Larger lengths are better for position traders or those who prefer to see only major turning points in the market.
- **Clean Chart Layout**: Because text labels are removed, you can visually focus on the circles—especially helpful if you use multiple indicators and prefer a less cluttered chart.
---
By pinpointing local highs and lows without price labels, the **Pivot Points High Low** indicator keeps charts neat yet informative, allowing traders to quickly recognize potential turning points in the market and make more informed decisions.
Williams %R IntensityOverview
"Williams %R Intensity" is a unique indicator that combines the classic Williams %R with a dynamic intensity-based visualization. This indicator helps traders identify overbought and oversold conditions with enhanced clarity while also predicting potential future crossovers using smoothed slope calculations. It is tailored for traders seeking a more nuanced approach to trend detection and momentum analysis.
Features and How It Works
Core Calculation:
Williams %R : Measures the current closing price relative to the highest high and lowest low over a user-defined length (default: 14).
Exponential Moving Average (EMA) : Smoothens the %R values for better trend tracking (default length: 14).
Overbought/Oversold Zones :
Upper and lower threshold levels are set at -20 (overbought) and -80 (oversold), making it easier to identify extreme conditions.
Intensity Visualization:
The intensity is calculated based on the absolute distance between Williams %R and its EMA.
The closer the value is to extreme levels, the more pronounced the visual intensity, capping at 90% transparency.
Overbought conditions are highlighted in red; oversold conditions in teal.
Crossover Signals:
Bullish Cross: When Williams %R crosses above its EMA in the oversold zone.
Bearish Cross: When Williams %R crosses below its EMA in the overbought zone.
The background color changes (lime for bullish, red for bearish) to highlight these critical moments when enabled via the "Show Cross & Predicted Cross Signal" option.
Future Cross Prediction:
Uses the smoothed slope of %R to estimate future values over a customizable number of steps.
Predicts potential bullish or bearish crosses based on the interaction between the predicted Williams %R and EMA.
Light green and light red background colors indicate predicted bullish and bearish crosses, respectively.
How to Use
Trend Detection: Use the Williams %R and its EMA to identify ongoing trends and confirm their strength.
Overbought/Oversold Analysis: Pay attention to crosses in extreme zones (-20 and -80) for potential reversals.
Intensity-Based Filtering: The intensity visualization helps to focus on the most significant conditions, reducing noise.
Cross Prediction: Enable "Show Cross & Predicted Cross Signal" to anticipate future turning points and plan trades proactively.
Example Applications
Scalping: Monitor rapid crossovers in lower timeframes for quick entries and exits.
Swing Trading: Use the overbought/oversold zones and cross predictions to identify longer-term reversal opportunities.
Risk Management: The intensity visualization can be used to filter out weak signals, ensuring higher-quality trade setups.
Chart Information
For clarity and compliance with publishing standards:
The chart should display the full symbol, timeframe, and the script name ("Williams %R Intensity").
Ensure the indicator is visible and properly configured for the chart.

JJ Psychological Levels (125 Increments)Psychological Levels Indicator
Description:
The Psychological Levels Indicator is a versatile tool designed for traders to identify key price levels that often act as support or resistance zones in the market. These levels are plotted at regular intervals, customizable by the user, starting from a base price level. This is particularly useful for spotting psychological price points that traders and investors frequently monitor.
Key Features:
1.Dynamic Psychological Levels:
- The script calculates and displays horizontal lines at price levels separated by customizable increments (default: 125 points).
- These levels are dynamically adjusted to the visible range of the chart.
2. Customizable Inputs:
- Starting Level: Set the base level from which increments are calculated (e.g., 0 or 1000).
- Step Size: Define the interval between levels (e.g., 125 for indices like Bank NIFTY).
3. Visual Representation:
- Horizontal lines are drawn at each psychological level, helping traders quickly identify key zones.
- Labels are placed next to each level, displaying the corresponding price for easy reference.
4. Application Across Instruments:
- This indicator works seamlessly with various asset classes, including stocks, indices, forex, and cryptocurrencies.
How to Use:
1.Identify Key Price Zones:
- Use the plotted psychological levels to spot areas where price action is likely to react.
- Levels such as 1125, 1250, and 1375 (for a step size of 125) are visually highlighted.
2. Plan Trades Around Key Levels:
- These levels can act as support/resistance or breakout points, providing opportunities for entry, exit, and stop-loss placement.
3. Customizable Settings:
- Adjust the starting level and step size to tailor the indicator to your trading instrument or strategy.
Why Psychological Levels Matter:
Psychological levels are widely followed by traders and often coincide with key market turning points due to their significance in human behavior and market psychology. They are frequently used by institutional traders, making them valuable reference points for intraday and swing trading.
Custom Settings:
- **Starting Level:** Default: `0`
- **Step Size:** Default: `125`
Disclaimer:
This indicator is a technical analysis tool and is not intended to provide financial advice. Always combine it with other indicators and perform your due diligence before making trading decisions.
