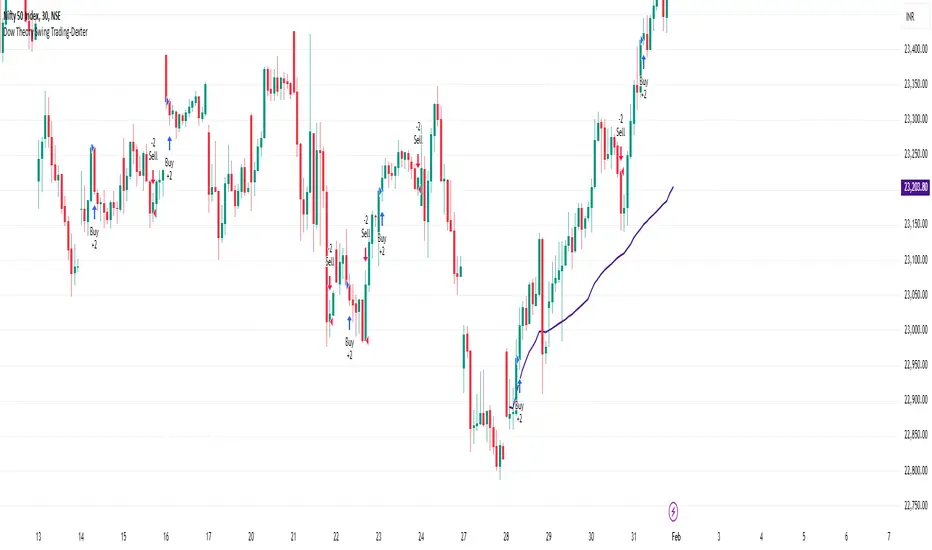
Dow Theory Swing Trading-DexterThis Pine Script strategy that implements a basic price action-based trading system inspired by Dow Theory, focusing on swing highs and swing lows. This strategy will generate buy and sell signals based on the formation of higher highs (HH) and higher lows (HL) for an uptrend, and lower highs (LH) and lower lows (LL) for a downtrend.
Swing Highs and Swing Lows:
The script identifies swing highs and swing lows using the ta.highest and ta.lowest functions over a specified lookback period.
A swing high is identified when the high of the current bar is the highest high over the lookback period.
A swing low is identified when the low of the current bar is the lowest low over the lookback period.
Trend Detection:
An uptrend is detected when the current low is higher than the last identified swing low.
A downtrend is detected when the current high is lower than the last identified swing high.
Buy and Sell Signals:
A buy signal is generated when the price closes above the last swing high during an uptrend.
A sell signal is generated when the price closes below the last swing low during a downtrend.
Plotting:
Swing highs and swing lows are plotted on the chart using plotshape.
Buy and sell signals are also plotted on the chart for visual reference.
How to Use:
Copy and paste the script into the Pine Script editor in TradingView.
Adjust the lookback period as needed to suit your trading style and timeframe.
Apply the script to your chart and it will generate buy and sell signals based on the price action.
NOTE: Please uncheck the all the unwanted symbol from chart for clear view .
Поиск скриптов по запросу "swing"
Auto Anchored Swing VWAP'sThe Auto Anchored Swing VWAP's indicator automatically anchors Volume-Weighted Average Price (VWAP) lines to recent swing highs and swing lows. VWAPs often act as key support or resistance levels because they represent the average price at which the majority of trading volume has occurred over a given time.
What is VWAP? VWAP is an essential tool in trading, representing the average price of a security over a specific period, weighted by volume. It helps traders identify the average price at which most trades have been executed, providing a balanced view of price action over time.
Anchored VWAPs: Unlike traditional VWAPs, which start from the beginning of the day, anchored VWAPs allow traders to "anchor" the calculation to a specific point in time or a pivot on the chart, in this case a swing high and swing low. This version of VWAP follows the price action from a selected point forward.
When the price is above the VWAP, it indicates that the majority of traders have paid less for the asset, creating a potential support zone as buyers may step in at or near this level. On the other hand, when the price is below the VWAP, it suggests that most traders have paid a higher price, which can lead to a resistance level where sellers may appear to defend their positions.
Anchored VWAPs, in particular, provide more precise support and resistance levels by starting from a specific swing high, swing low, or other significant point on the chart. This allows traders to track how price interacts with these levels after a certain bar.
The selectable pivot lookback length in this indicator defines the number of bars to the left and right of a potential swing high or swing low that must be lower (for a swing high) or higher (for a swing low) in order to confirm the pivot. In other words, it controls how many surrounding bars need to validate a local price extreme before it is considered a true swing point.
For example, if the lookback length is set to 9, a swing high is identified when there are 9 bars to the left and 9 bars to the right that all have lower highs than the current bar. The same logic applies for swing lows, where the price must be lower than the highs of the bars to the left and right for it to be considered a swing low.
This parameter allows traders to control the sensitivity of the swing points used to anchor VWAPs. A smaller lookback value will identify more frequent and short-term swing highs and lows, making the VWAPs more responsive to recent price action. Conversely, a larger lookback value will result in fewer but more significant swing points.
Pine Script
Utilization of Pine Script’s Enum Feature: This indicator leverages Pine Script's new enum feature for the selection of the VWAP lines (solid, dashed, or dotted) style.
GSS: Gold Swing Sniper [DoNotFollowMeGod]"Inspired by Mean Reversion Theory and Dynamic Volatility Bands (similar to Keltner/Bollinger concepts).
Gold (XAUUSD) tends to respect volatility extremes. This script was designed to capture those extremes by combining a Volatility Channel with an ADX Strength Filter. It’s basically a mathematical approach to 'Buying Low and Selling High' in a ranging market."
Most traders lose money when the market stops trending. This indicator fixes that by identifying "Range-Bound" conditions using a smart ADX Filter.
How it works:
Market State Detection: It checks the ADX. If the market is trending strong, it stays quiet. If the market is chopping/ranging, it activates.
Sniper Entries:
SWING LONG: When price hits the lower band + RSI Oversold + Rejection Candle.
SWING SHORT: When price hits the upper band + RSI Overbought + Rejection Candle.
Dashboard: A clean Multi-Timeframe table to see if higher timeframes are Trending or Sideways.
Disclaimer:
This tool is a "Shield" against chop. Do not use it during high-impact news.
Based on volatility band logic.

RSI Swing Camarilla s3 r3+ PDH/PDL+CPR - v1.0This script provide the follwing -
1. Daily CPR level
2. Camarilla S3/R3
3. Previous Day High/Low (PDH/PDL)
4. Dynamic VWAP
5. Dynamic EMA 20/200
6. Dynamic RSi Swing
Dec 10
Release Notes
This script provide the follwing -
1. Daily CPR level
2. Camarilla S3/R3
3. Previous Day High/Low (PDH/PDL)
4. Dynamic VWAP
5. Dynamic EMA 20/200/36
6. Dynamic RSi Swing
Which is better: 36 EMA or 36 SMA for Support/Resistance?
✔ 36 EMA (Exponential Moving Average)
Better for intraday, short-term trading, scalping, and momentum trading.
Why?
Reacts faster to price.
Captures trend shifts early.
Works great when market is trending or volatile.
Most traders use EMA for dynamic support/resistance → works better because of crowd behavior.
Ideal for:
NIFTY, BANKNIFTY, FINNIFTY intraday | Options entries | Trend continuation trades.
Why 20 EMA is Important
The 20 EMA is one of the most widely used moving averages for intraday, swing, and positional trading because it captures short-term trend strength and momentum.
📌 20 EMA Works Best For
✔ Intraday trend identification
✔ Momentum continuation entries
✔ Dynamic support/resistance
✔ Quick reversal detection
✔ Options trading (NIFTY/BNF)
✔ Breakout & pullback trades
EMA 200 – Why It’s Extremely Important
The 200 EMA represents the long-term trend and is respected by:
Institutions
Algo systems
Big traders
Swing traders
Index traders
It acts like a major wall of support or resistance.
💡 What EMA 200 Tells You
✔ Long-term trend direction
Price above 200 EMA → Long-term uptrend
Price below 200 EMA → Long-term downtrend
✔ Strong trend reversal signals
When price crosses the 200 EMA on 15m/1h/1D charts → a deeper trend change is possible.
✔ Institutional support/resistance
Very powerful bounce/rejection zones
Many markets reverse exactly at 200 EMA
What is Previous Day High (PDH)?
The highest price the market reached in the previous trading session.
Why PDH is Important?
Acts as strong resistance
Breakout level for uptrend
Sellers often defend this zone
If broken with volume → strong bullish momentum
🔴 What is Previous Day Low (PDL)?
The lowest price the market reached in the previous trading session.
Why PDL is Important?
Acts as strong support
Breakdown level for downtrend
Buyers defend this level
If broken with volume → strong bearish trend
📌 How PDH/PDL Help in Intraday Trading
1️⃣ Range Breakout Trades
If price breaks PDH → bullish breakout (Buy CE)
If price breaks PDL → bearish breakdown (Buy PE)
What is Camarilla R3?
R3 = Resistance Level 3 in the Camarilla Pivot system.
Why R3 is important?
Acts as a major intraday resistance
Price often reverses from R3
If broken with force → strong uptrend starts
Many traders use R3 as a decision zone
Typical Market Behavior at R3
Rejection from R3 → Sell/PE opportunity
Break + Retest above R3 → CE opportunity
🔴 What is Camarilla S3?
S3 = Support Level 3 in the Camarilla Pivot system.
Why S3 is important?
Acts as a major intraday support
Buyers defend this zone
Breakdown of S3 → strong fall
S3 is often a bounce zone in the morning
Typical Market Behavior at S3
Bounce from S3 → Buy/CE opportunity
Break + Retest below S3 → PE opportunity
📌 Trader Logic: R3 & S3 Zones
⭐ 1. Range Reversal Strategy (Most Popular)
At R3 → Sell/PE
At S3 → Buy/CE
What is VWAP?
VWAP = Volume Weighted Average Price
It shows the average price at which most trading has happened during the day, based on both price and volume.
It resets every day at market open.
🔥 Why VWAP Is So Powerful?
VWAP is used by:
Institutions
Algo traders
Scalpers
Intraday traders
Dec 10
Release Notes
This script provide the follwing -
1. Daily CPR level
2. Camarilla S3/R3
3. Previous Day High/Low (PDH/PDL)
4. Dynamic VWAP
5. Dynamic EMA 20/200
6. Dynamic RSi Swing
3 hours ago
Release Notes
This script provide the follwing -
1. Daily CPR level
2. Camarilla S3/R3
3. Previous Day High/Low (PDH/PDL)
4. Dynamic VWAP
5. Dynamic EMA 20/200/36
6. Dynamic RSi Swing
Which is better: 36 EMA or 36 SMA for Support/Resistance?
✔ 36 EMA (Exponential Moving Average)
Better for intraday, short-term trading, scalping, and momentum trading.
Why?
Reacts faster to price.
Captures trend shifts early.
Works great when market is trending or volatile.
Most traders use EMA for dynamic support/resistance → works better because of crowd behavior.
Ideal for:
NIFTY, BANKNIFTY, FINNIFTY intraday | Options entries | Trend continuation trades.
Why 20 EMA is Important
The 20 EMA is one of the most widely used moving averages for intraday, swing, and positional trading because it captures short-term trend strength and momentum.
📌 20 EMA Works Best For
✔ Intraday trend identification
✔ Momentum continuation entries
✔ Dynamic support/resistance
✔ Quick reversal detection
✔ Options trading (NIFTY/BNF)
✔ Breakout & pullback trades
EMA 200 – Why It’s Extremely Important
The 200 EMA represents the long-term trend and is respected by:
Institutions
Algo systems
Big traders
Swing traders
Index traders
It acts like a major wall of support or resistance.
💡 What EMA 200 Tells You
✔ Long-term trend direction
Price above 200 EMA → Long-term uptrend
Price below 200 EMA → Long-term downtrend
✔ Strong trend reversal signals
When price crosses the 200 EMA on 15m/1h/1D charts → a deeper trend change is possible.
✔ Institutional support/resistance
Very powerful bounce/rejection zones
Many markets reverse exactly at 200 EMA
What is Previous Day High (PDH)?
The highest price the market reached in the previous trading session.
Why PDH is Important?
Acts as strong resistance
Breakout level for uptrend
Sellers often defend this zone
If broken with volume → strong bullish momentum
🔴 What is Previous Day Low (PDL)?
The lowest price the market reached in the previous trading session.
Why PDL is Important?
Acts as strong support
Breakdown level for downtrend
Buyers defend this level
If broken with volume → strong bearish trend
📌 How PDH/PDL Help in Intraday Trading
1️⃣ Range Breakout Trades
If price breaks PDH → bullish breakout (Buy CE)
If price breaks PDL → bearish breakdown (Buy PE)
What is Camarilla R3?
R3 = Resistance Level 3 in the Camarilla Pivot system.
Why R3 is important?
Acts as a major intraday resistance
Price often reverses from R3
If broken with force → strong uptrend starts
Many traders use R3 as a decision zone
Typical Market Behavior at R3
Rejection from R3 → Sell/PE opportunity
Break + Retest above R3 → CE opportunity
🔴 What is Camarilla S3?
S3 = Support Level 3 in the Camarilla Pivot system.
Why S3 is important?
Acts as a major intraday support
Buyers defend this zone
Breakdown of S3 → strong fall
S3 is often a bounce zone in the morning
Typical Market Behavior at S3
Bounce from S3 → Buy/CE opportunity
Break + Retest below S3 → PE opportunity
📌 Trader Logic: R3 & S3 Zones
⭐ 1. Range Reversal Strategy (Most Popular)
At R3 → Sell/PE
At S3 → Buy/CE
What is VWAP?
VWAP = Volume Weighted Average Price
It shows the average price at which most trading has happened during the day, based on both price and volume.
It resets every day at market open.
🔥 Why VWAP Is So Powerful?
VWAP is used by:
Institutions
Algo traders
Scalpers
Intraday traders

Heikin Ashi Swing Setup DailyTFHeikin Ashi Swing Setup is a trend-following swing trading indicator designed for Daily timeframe traders.
This indicator combines:
Heikin Ashi candle strength
EMA-based trend confirmation
RSI momentum filter
ATR-based price expansion logic
The goal is to capture strong directional swing moves while avoiding sideways and noisy markets.
BUY Signal Logic
Strong bullish Heikin Ashi candle (no lower wick)
Price above EMA 50
EMA slope upward (trend confirmation)
RSI between 50–70
Price sufficiently away from EMA (ATR filter)
SELL Signal Logic
Strong bearish Heikin Ashi candle (no upper wick)
Price below EMA 50
EMA slope downward
RSI between 30–50
ATR-based price expansion confirmed
Recommended Usage
Timeframe: Daily
Markets: Stocks & Indices
Holding Period: 5–20 trading days
Best used with:
Weekly trend analysis
Supply & Demand zones
Previous swing highs/lows

Support and Resistance Breakout Signals [MarkitTick]💡 This indicator provides a comprehensive, automated system for identifying, tracking, and trading Support and Resistance (S/R) breakouts. By synthesizing classic Swing High and Swing Low pivot analysis with Multi-Timeframe (HTF) capabilities and Volume confirmation, it transforms raw price action into actionable structural data. It is designed to declutter charts by automatically managing active levels and highlighting significant market structure shifts (Higher Highs, Lower Lows) alongside verified breakout signals.
✨ Originality and Utility
While many indicators draw static pivot points, this tool distinguishes itself through "State Management." It treats Support and Resistance not just as historical markers, but as active zones that evolve.
Dynamic Level Management: Instead of flooding the chart with infinite lines, the script uses arrays to store a specific number of recent levels. As price action progresses, invalid or broken levels are removed or updated, keeping the analysis focused on current relevance.
Multi-Timeframe Confluence: Uniquely, it allows you to overlay higher timeframe support and resistance levels (e.g., Daily levels on a 4-hours chart) without changing your chart view, enabling top-down analysis instantly.
Market Structure Labeling: It automatically tags pivot points with Dow Theory labels (HH, LH, LL, HL), aiding traders in instantly recognizing trend direction without manual charting.
🔬 Methodology and Concepts
The script operates on three core technical pillars:
● Swing Pivot Detection
The foundation is the detection of local extrema using a "Left/Right" bar lookback mechanism. A Swing High is identified when a high is greater than the L bars preceding it and the R bars following it. This confirms a fractal peak or valley.
Note on Confirmation: Because the script waits for R bars to close to confirm a pivot, the lines appear retroactively. However, the extension of these lines and subsequent breakout signals occur in real-time.
● Breakout Logic with Volume Integration
A breakout is triggered when the Close price crosses an active S/R line.
Resistance Break: Current Close > Resistance Level (and Previous Close ≤ Level).
Support Break: Current Close < Support Level (and Previous Close ≥ Level).
Volume Confirmation: An optional filter requires the breakout bar's volume to exceed a Moving Average of volume, ensuring momentum backs the move.
● Time Decay
To mimic the reduced relevance of stale levels, the script includes a "Time Decay" feature. If a level is not interacted with for a user-defined number of bars, it is automatically purged from the system, ensuring the chart reflects only fresh interest levels.
🎨 Visual Guide
The indicator uses a specific color-coding and labeling system to convey information quickly:
● Support & Resistance Lines
Red Lines (Thin): Represent active Resistance levels on the current timeframe.
Green Lines (Thin): Represent active Support levels on the current timeframe.
Fuchsia Lines (Thick): Represent Higher Timeframe (HTF) Resistance levels.
Aqua Lines (Thick): Represent Higher Timeframe (HTF) Support levels.
● Market Structure Labels
Located at the pivot points, these text labels define the trend structure:
HH / LH: Higher High / Lower High (Red Text).
LL / HL: Lower Low / Higher Low (Green/Aqua Text).
HTF-R / HTF-S: Indicates major structural pivots from the higher timeframe.
● Breakout Signals
When a valid break occurs, a label appears above or below the bar:
Blue Triangle Up (▲): Bullish breakout through resistance.
Blue Triangle Down (▼): Bearish breakout through support.
Number in Label: Indicates the cumulative count of breaks for that specific trend sequence (e.g., "1" is the first break, "2" is the second).
The breakout count represents the intensity of the move. A reading greater than 1 signals exceptional market strength, indicating the penetration of multiple Key Levels (Support or Resistance) within a single candle.
📖 How to Use
Trend Continuation: In an uptrend (sequence of HH/HL), wait for a Blue Triangle Up (▲) occurring at a Red Resistance line. This signals the continuation of the trend.
Trend Reversal: Watch for a "Structure Break." If price is making Higher Highs, but then breaks a Green Support line (generating a ▼ signal) and forms a Lower Low (LL), the trend may be reversing.
HTF "Bounce" Plays: Use the thick Fuchsia/Aqua lines as major zones. If price approaches a thick Aqua line (HTF Support) and fails to break it, look for LTF bullish structure (HH/HL) to form for an entry.
Volume Filtering: Enable the "Volume Confirmation" setting to filter out "fakeouts" (breaks on low volume).
⚙️ Inputs and Settings
● Swing Settings
Left/Right Bars: Determines the sensitivity of the pivot detection. Higher numbers = fewer, more significant pivots.
Max Stored Levels: How many S/R lines to keep in memory at once.
Max Break Labels: Limits visual clutter by capping the number of signal labels.
● Usability & HTF
Enable Time Decay: If true, deletes lines that are older than "Decay Period" bars.
Enable HTF Levels: Toggles the display of higher timeframe pivots.
HTF Timeframe: Select the specific timeframe for the macro view (e.g., "D" for Daily).
● Analysis
Volume Confirmation: Toggles the requirement for volume to be above its average for a signal to fire.
Show Market Structure: Toggles the HH/LL text labels.
🔍 Deconstruction of the Underlying Scientific and Academic Framework
The script's logic is rooted in Fractal Geometry and Auction Market Theory .
● Mandelbrot's Fractals: The use of `leftBars` and `rightBars` is a direct application of identifying market fractals. Markets are self-similar across timeframes; a pivot on a 5-minute chart is structurally identical to one on a Weekly chart. This script exploits this property by allowing nested timeframe analysis (LTF inside HTF).
● Memory of Price (Behavioral Finance): Support and resistance lines represent zones where market participants have previously established value (Price Memory). The "Breakout" signal is mathematically significant because it represents a shift in the supply/demand equilibrium. When price closes beyond a stored array value (the pivot price), it signifies that the aggressive limit orders that created the pivot have been exhausted or withdrawn, validating a new search for value.
⚠️ Disclaimer
All provided scripts and indicators are strictly for educational exploration and must not be interpreted as financial advice or a recommendation to execute trades. I expressly disclaim all liability for any financial losses or damages that may result, directly or indirectly, from the reliance on or application of these tools. Market participation carries inherent risk where past performance never guarantees future returns, leaving all investment decisions and due diligence solely at your own discretion.

BTC Swing Plan Levels & ZonesThis indicator visualizes a clean, rules-based Bitcoin swing-trade plan with clearly defined entry, target, and risk zones.
🔹 What it shows
• Breakout Entry Level
• Multiple Profit Target Zones (T1 → T4)
• Primary & Hard Stop Risk Zone
• Mid-levels for structure awareness
• Optional background highlight when price is above the breakout (plan active)
All levels are fully editable from the settings panel, allowing you to adapt the framework to any BTC market regime or timeframe.
🔹 How to use
Wait for price to break and hold above the Entry level
Manage the trade target-by-target
Respect the defined stop zone for risk control
Stretch target (T4) is optional and meant for strong trend continuation
🔹 Designed for
• Swing traders
• Structure-based traders
• Risk-managed BTC positioning
• Clean chart layouts (no indicators, no noise)
This tool is not a signal generator — it is a visual trade-planning framework.
Always manage position size and risk responsibly.

MDZ Strategy v4.2 - Multi-factor trend strategyWhat This Strategy Does
MDZ (Momentum Divergence Zones) v4.2 is a trend-following strategy that enters long positions when multiple momentum and trend indicators align. It's designed for swing trading on higher timeframes (2H-4H) and uses ATR-based position management.
The strategy waits for strong trend confirmation before entry, requiring agreement across five different filters. This reduces trade frequency but aims to improve signal quality.
Entry Logic
A long entry triggers when ALL of the following conditions are true:
1. EMA Stack (Trend Structure)
Price > EMA 20 > EMA 50 > EMA 200
This "stacked" alignment indicates a strong established uptrend
2. RSI Filter (Momentum Window)
RSI between 45-75 (default)
Confirms momentum without entering overbought territory
3. ADX Filter (Trend Strength)
ADX > 20 (default)
Ensures the trend has sufficient strength, not a ranging market
4. MACD Confirmation
MACD line above signal line
Histogram increasing (momentum accelerating)
5. Directional Movement
+DI > -DI
Confirms bullish directional pressure
Exit Logic
Positions are managed with ATR-based levels:
ParameterDefaultDescriptionStop Loss2.5 × ATRBelow entry priceTake Profit6.0 × ATRAbove entry priceTrailing Stop2.0 × ATROptional, activates after entry
The default configuration produces a 1:2.4 risk-reward ratio.
Presets
The strategy includes optimized presets based on historical testing:
PresetTimeframeNotes1H Standard1 HourMore frequent signals2H Low DD2 HourConservative settings3H Optimized3 HourBalanced approach4H Swing4 HourWider stops for swing tradesCustomAnyFull manual control
Select "Custom" to adjust all parameters manually.
Inputs Explained
EMAs
Fast EMA (20): Short-term trend
Slow EMA (50): Medium-term trend
Trend EMA (200): Long-term trend filter
RSI
Length: Lookback period (default 14)
Min/Max: Entry window to avoid extremes
ADX
Min ADX: Minimum trend strength threshold
Risk
Stop Loss ATR: Multiplier for stop distance
Take Profit ATR: Multiplier for target distance
Trail ATR: Trailing stop distance (if enabled)
Session (Optional)
Filter entries by time of day
Recommended OFF for 3H+ timeframes
What's Displayed
Info Panel (Top Right)
Current preset
Trend status (Strong/Wait)
ADX, RSI, MACD readings
Position status
Risk-reward ratio
Stats Panel (Top Left)
Net P&L %
Total trades
Win rate
Profit factor
Maximum drawdown
Chart
EMA lines (20 blue, 50 orange, 200 purple)
Green background during strong uptrend
Triangle markers on entry signals
Important Notes
⚠️ This is a long-only strategy. It does not take short positions.
⚠️ Historical results do not guarantee future performance. Backtests show what would have happened in the past under specific conditions. Markets change, and any strategy can experience drawdowns or extended losing periods.
⚠️ Risk management is your responsibility. The default settings risk 100% of equity per trade for backtesting purposes. In live trading, appropriate position sizing based on your risk tolerance is essential.
⚠️ Slippage and commissions matter. The backtest includes 0.02% commission and 1 tick slippage, but actual execution costs vary by broker and market conditions.
Best Practices
Test on your specific market — Results vary significantly across different instruments
Use appropriate position sizing — Never risk more than you can afford to lose
Combine with your own analysis — No indicator replaces understanding market context
Paper trade first — Validate the strategy matches your trading style before risking capital
Alerts
Two alerts are available:
MDZ Long Entry: Fires when all entry conditions are met
Uptrend Started: Fires when EMA stack first aligns bullish
Methodology
This strategy is based on the principle that trend continuation has better odds than reversal when multiple timeframe momentum indicators agree. By requiring five independent confirmations, it filters out weak setups at the cost of fewer total signals.
The ATR-based exits adapt to current volatility rather than using fixed pip/point targets, which helps the strategy adjust to different market conditions.
Questions? Leave a comment below.

The Setup Factory - Swing Data TSF - Swing data
Useful intraday updated data for swing traders
Interpretation and summary:
1. 20D Avg $ Vol: The average daily dollar volume (Price × Volume) over the last 20 trading days.
2. Live $ Vol: The total dollar volume accumulated during the current daily bar so far.
3. Relative Vol %: Today's volume progress compared to the average amount of volume typically accumulated by this exact minute over the last 20 days.
4. Projected Vol %: A prediction of the final daily volume total, calculated by applying today's current rate of outperformance (Buzz) to the full-day average.
5. Continuous Volume Buzz: The percentage difference between today's current volume and the historical average for this specific time window (e.g., how far "ahead of schedule" the stock is).
6. Volume Pace (15m): A comparison of the last 15 minutes of volume against the average 15-minute speed of the day so far (excluding the opening 15-minute surge).
7. Daily ATR %: The 14-day average daily price range (volatility) expressed as a percentage of the current stock price.
8. Dist. Today Low: The percentage distance between the current price and today’s lowest point.
9. Dist. Prior Low: The percentage distance between the current price and yesterday’s lowest point.

Liquidity Sweep of Candle & Swing @MaxMaserati 3.0MMM Liquidity Sweep Detector for single candle sweep and/or Swing Sweep
Identify liquidity sweeps with precision. A sweep occurs when price wicks through a key level (previous candle high/low or swing point) but closes back inside the range - indicating a failed breakout and potential reversal.
The set includes: Sweep Low, 50% of wick, TGT level
KEY FEATURES:
- Two Detection Modes: Track sweeps on previous candle levels OR swing highs/lows (pivot points)
- Both Mode: View candle and swing sweeps simultaneously
- Visual Clarity: Each sweep displays three extending lines (SWH/SWL, Target, 50% wick), box zone, and swept level with red X marker
- Smart Updates: When price creates new sweep levels without hitting targets, the entire sweep structure automatically relocates to the new level
- Double-Sided Logic: When both sides are swept on one candle, the indicator intelligently places the sweep on the longest wick side
SWEEP DEFINITION:
Bullish Sweep: Price wicks BELOW a low but closes ABOVE it (back inside range)
Bearish Sweep: Price wicks ABOVE a high but closes BELOW it (back inside range)
The indicator only creates sweeps on unviolated levels - levels that haven't been closed through yet. This ensures you're trading genuine liquidity sweeps, not broken levels.
CUSTOMIZATION:
- Adjustable swing lookback period
- Multiple box placement options
- Full color and display controls
- Invalidation options (Sweep High/Low or 50% Wick)
- Statistics panel showing active sweeps and completion rates
Perfect for traders using ICT concepts, Smart Money Theory, or institutional order flow analysis. Identify where large players are hunting liquidity before reversing price.
⚠️ DISCLAIMER
Educational Tool Only - This indicator is for educational and informational purposes only and does not constitute financial, investment, or trading advice.
Risk Warning - Trading involves substantial risk of loss and is not suitable for all investors. Past performance does not guarantee future results. No representation is made that this indicator will achieve profits or prevent losses.
User Responsibility - All trading decisions are solely your responsibility. The developer and Max Maserati Model assume no liability for losses incurred from using this indicator. Conduct your own research and consult a qualified financial advisor before making investment decisions.
By using this indicator, you acknowledge and agree to these terms.

EMA 21 Pullback - Swing Break (Single Signal)EMA 21 Pullback Swing Break – Single Entry Indicator
This indicator is designed for traders who prefer clean, structure-based entries
instead of frequent signals.
LOGIC:
1. EMA 21 defines the trend direction.
2. Price must pull back to EMA 21 (mandatory).
3. After pullback, an internal swing is formed.
4. Entry signal is generated only when that swing is broken.
5. Only ONE signal is allowed per EMA pullback.
6. Next signal appears only after price touches EMA again.
BUY CONDITIONS:
- Price above EMA 21
- Pullback to EMA 21
- Internal swing high formed after pullback
- Candle closes above that swing high
SELL CONDITIONS:
- Price below EMA 21
- Pullback to EMA 21
- Internal swing low formed after pullback
- Candle closes below that swing low
FEATURES:
✔ No repaint
✔ Structure-based entries
✔ Single signal per pullback
✔ Works best in trending markets
✔ Avoids sideways noise
BEST USE:
- Index trading (NIFTY, BANKNIFTY, SENSEX)
- Timeframes: 3m, 5m, 15m
- Combine with price action or higher timeframe trend
DISCLAIMER:
This indicator is for educational purposes only.
Always use proper risk management.

AMMOUSSA XAUUSD Professional Intraday SwingAMMOUSSA XAUUSD Professional Intraday Swing
AMMOUSSA XAUUSD Professional Intraday Swing
AMMOUSSA XAUUSD Professional Intraday Swing
AMMOUSSA XAUUSD Professional Intraday Swing

Korocham MA & SwingSMA 3Lines , Swing High Low
An indicator that displays 3 SMA lines and Swing Highs/Lows with 5 bars to the left and right.

15M Swing Sweep Lines + SMT (ES vs NQ)15M Swing Sweep Lines (NY Killzones)Visualize liquidity sweeps of 15-minute swing highs/lows exclusively during high-impact London & New York killzones.This ICT-inspired indicator detects when price sweeps (wicks beyond) the most recent confirmed 15-minute swing high or low — classic signs of liquidity raids or stop hunts — but only if the sweep happens during key "killzone" sessions where institutional activity is typically highest.Key Features15M Swing Detection: Uses confirmed pivot highs/lows (length 2) on the 15-minute timeframe for reliable structure points.
Killzone Filters (New York time):London Killzone: 3:00 AM – 4:59 AM
New York Killzone: 9:30 AM – 10:59 AM (captures the high-volatility NY open overlap)
Sweep Visualization:Bearish Sweep (high > last 15M swing high): Thick red horizontal line from the swing point to the sweep bar.
Bullish Sweep (low < last 15M swing low): Thick green horizontal line from the swing point to the sweep bar.
Lines use xloc.bar_time for precise placement and extend only to the bar where the sweep occurs.
No duplicates: Prevents multiple lines for the same swing sweep.
Non-repainting logic with lookahead_off for clean, trustworthy signals.
Why Killzones MatterMany ICT/SMC traders focus on these windows because they often feature aggressive manipulation, equal highs/lows sweeps, and the setup for strong directional moves. This tool helps you instantly spot when buy-side or sell-side liquidity has been raided on the 15M structure during these prime times.Ideal ForConfirming potential reversals or inducements after liquidity grabs.
Adding confluence to entries during London or NY sessions.
Futures traders (ES, NQ, etc.) looking for clean visual cues of smart money engineering.
Lightweight, overlay-friendly, and focused — add it to your chart for clearer insight into 15M liquidity sweeps when it matters most. Perfect companion for killzone-based strategies!

SIDD EMA RSI Supertrend Signal Table🔥 SIDD EMA RSI SuperTrend Multi-Timeframe Signal Table
**SIDD EMA RSI SuperTrend Signal Table** is a **clean, powerful multi-timeframe trend confirmation dashboard** designed for traders who want **clarity, confluence, and speed** — all in one glance.
This indicator **does NOT repaint** and uses **industry-standard trend logic** combining **EMA structure, RSI momentum, and SuperTrend direction** across **6 different timeframes**.
---
## 🧠 Core Logic Behind the Indicator
This script works on **three independent trend engines**, displayed together in a compact table:
### ✅ 1️⃣ EMA Trend (Structure Based)
* Uses **EMA 50 vs EMA 200**
* **Bullish** → EMA 50 above EMA 200
* **Bearish** → EMA 50 below EMA 200
* Captures **primary market structure**
### ✅ 2️⃣ RSI Trend (Momentum Based)
* RSI Length: **14**
* **Bullish** → RSI > **55**
* **Bearish** → RSI ≤ **55**
* Helps confirm **trend strength & momentum**
### ✅ 3️⃣ SuperTrend (Price Action Based)
* ATR Length: **10**
* Factor: **3.0**
* Clearly defines **trend direction & trailing bias**
* Excellent for **entry & exit alignment**
---
## ⏱️ Multi-Timeframe Coverage
The table analyzes trends across **6 configurable timeframes**:
* Intraday → **5m, 15m, 1H**
* Swing → **4H, Daily**
* Positional → **Weekly**
Each timeframe shows:
* 📈 EMA Trend
* 📊 RSI Trend
* 🔁 SuperTrend Direction
Color-coded for instant readability:
* 🟢 Bullish
* 🔴 Bearish
* ⚪ Neutral
---
## 🎯 How to Use This Indicator
✔ **Trend Trading**
Trade only when **EMA + RSI + SuperTrend align** across higher & lower timeframes.
✔ **Intraday Confirmation**
Use higher TF (1H / 4H) bias and take entries on lower TF.
✔ **Avoid Chop & False Signals**
If signals are mixed → market is likely **sideways or risky**.
✔ **Swing & Positional Trades**
Daily + Weekly alignment gives **high-probability setups**.
---
## ⚙️ Customization Options
* Adjustable **timeframes**
* Table **position** (Top/Bottom – Left/Right)
* Table **size** (Extra Small / Small / Normal)
* Custom **colors, borders & text**
* Optimized for **minimal chart clutter**
---
## ⚠️ Disclaimer
This indicator is a **trend confirmation & decision-support tool**.
Always combine with **price action, support/resistance, and proper risk management**.

NSE Swing Breadth NSE Swing Breadth – Market Health Dashboard (0–200, % from Neutral)
Overview
NSE Swing Breadth – Market Health Dashboard is a market-wide health and regime indicator designed to track internal strength and participation across Large-, Mid-, and Small-cap indices in the Indian equity market.
Instead of focusing on price alone, this tool measures how strongly each segment is behaving relative to its own swing trend, normalizes those movements, and combines them into a single Market Health score. The result is a clean, objective dashboard that helps traders identify Risk-On, Caution, and Risk-Off regimes.
This indicator is best used for position sizing, exposure control, and timing aggressiveness, rather than individual stock entries.
Data Used
The indicator internally tracks three broad NSE indices:
Large Caps → NIFTY100EQUALWEIGHT
Mid Caps → NIFTYMIDCAP150
Small Caps → NIFTYSMLCAP250
Using equal-weighted and broad indices ensures the signal reflects true market participation, not just index heavyweights.
Core Logic
1. Swing Strength Model
For each index, the script calculates normalized swing strength:
Price is compared to its EMA swing baseline
The deviation from the EMA is normalized using the EMA of absolute deviations
This creates a volatility-adjusted strength value, allowing fair comparison across market regimes
This answers the question:
Is this segment pushing meaningfully above or below its recent trend?
2. Strength Converted to % from Neutral (Baseline = 100)
Each segment’s strength is converted into percentage-style points around a neutral baseline of 100:
100 = Neutral
+15 = +15% strength above neutral
–20 = –20% weakness below neutral
These values are plotted as three smooth lines:
Blue → Large Caps
Orange → Mid Caps
Purple → Small Caps
This makes relative leadership and divergence immediately visible.
3. Market Health Score (0–100)
The indicator combines all three segments into a single Market Health score:
Large Caps → 40% weight
Mid Caps → 35% weight
Small Caps → 25% weight
Extreme values are clamped to avoid distortion, and the final score is normalized to a 0–100 scale:
70–100 → Strong, broad participation
40–69 → Mixed / unstable participation
0–39 → Weak, risk-off conditions
Visual Components
📊 Market Health Histogram
A vertical histogram displays Market Health (0–100) with enhanced visibility:
🟢 Green (≥ 70) → Strong Risk-On regime
🟠 Orange (40–69) → Caution / Transition
🔴 Red (< 40) → Risk-Off regime
The histogram is visually compact and designed to reflect true market health, not exaggerated spikes.
📈 Strength Lines (Baseline = 100)
Three strength lines show % deviation from neutral:
Above 100 → Positive internal strength
Below 100 → Internal weakness
These lines help identify:
Leadership (which segment is driving the market)
Early deterioration (small/mid caps weakening first)
Broad confirmation (all segments rising together)
Dashboard Tables
📌 Market Regime Table (Bottom-Left)
Displays the current market regime:
🟢 RISK ON
🟡 CAUTION
🔴 RISK OFF
Along with the exact Market Health score (0–100).
📌 Strength Table (Top-Right)
Shows Large / Mid / Small cap strength as % from neutral, for example:
+18% → 18% above neutral
–12% → 12% below neutral
This avoids misleading interpretations and keeps values intuitive and actionable.
How to Use This Indicator
Risk-On (Green)
Favor full position sizes, trend-following strategies, and broader participation trades.
Caution (Orange)
Reduce leverage, tighten stops, and be selective. Expect choppiness.
Risk-Off (Red)
Prioritize capital protection, reduce exposure, and avoid aggressive longs.
This indicator is not an entry signal — it is a market environment filter.
⚠️ Important Style Setting (Required)
For correct visualization:
Settings → Style → Uncheck “Labels on price scale”
This prevents the indicator’s internal 0–200 model scale from interfering with the chart’s price scale and keeps the pane clean and readable.
Summary
NSE Swing Breadth – Market Health Dashboard provides a clear, objective view of market internals, helping traders align their risk with the true underlying condition of the market — not just price movement.
It is especially effective for:
Market regime identification
Exposure management
Avoiding false breakouts in weak breadth environments

Stage 2 Pullback Swing indicatorThis scanner is built for swing traders who want high-probability pullbacks inside strong, established uptrends. It targets names in a confirmed Stage 2 bull phase (Weinstein model) that have pulled back 10–30% from a recent swing high on light selling volume, while still respecting fast EMAs.
Goal: find powerful uptrending stocks during controlled dips before the next leg higher.
What it looks for
Strong prior uptrend: price above the 50 and 200 SMAs, momentum positive over multiple timeframes
Confirmed Stage 2: price above a rising 30-week MA on the weekly chart
Pullback depth: 10–30% off recent swing highs—not too shallow, not broken
Pullback quality: range contained, no panic selling, trend structure intact
EMA behavior: price near EMA10 or EMA20 at signal time
Volume contraction: sellers fading throughout the pullback
Bullish shift: green candle back in trend direction
Why this matters
This setup hints at institutions defending positions during a temporary dip. Strong stocks pull back cleanly with declining volume, then resume the primary trend. This script alerts you when those conditions align.
Best way to use
Filter a strong universe before applying—quality tickers only
Pair with clear trade plans: risk defined by prior swing low or ATR
Trigger alerts instead of hunting charts manually
Intended for
Swing traders who want momentum continuation setups
Traders who prefer entering on controlled retracements
Anyone tired of chasing extended breakouts

US Market Long Horizon Momentum Summary in one paragraph
US Market Long Horizon Momentum is a trend following strategy for US index ETFs and futures built around a single eighteen month time series momentum measure. It helps you stay long during persistent bull regimes and step aside or flip short when long term momentum turns negative.
Scope and intent
• Markets. Large cap US equity indices, liquid US index ETFs, index futures
• Timeframes. 4h/ Daily charts
• Default demo used in the publication. SPY on 4h timeframe chart
• Purpose. Provide a minimal long bias index timing model that can reduce deep drawdowns and capture major cycles without parameter mining
• Limits. This is a strategy. Orders are simulated on standard candles only
Originality and usefulness
• Unique concept or fusion. One unscaled multiple month log return of an external benchmark symbol drives all entries and exits, with optional volatility targeting as a single risk control switch.
• Failure mode addressed. Fully passive buy and hold ignores the sign of long horizon momentum and can sit through multi year drawdowns. This script offers a way to step down risk in prolonged negative momentum without chasing short term noise.
• Testability. All parameters are visible in Inputs and the momentum series is plotted so users can verify every regime change in the Tester and on price history.
• Portable yardstick. The log return over a fixed window is a unit that can be applied to any liquid symbol with daily data.
Method overview in plain language
The method looks at how far the benchmark symbol has moved in log return terms over an eighteen month window in our example. If that long horizon return is positive the strategy allows a long stance on the traded symbol. If it is negative and shorts are enabled the strategy can flip short, otherwise it goes flat. There is an optional realised volatility estimate on the traded symbol that can scale position size toward a target annual volatility, but in the default configuration the model uses unit leverage and only the sign of momentum matters.
Base measures
Return basis. The core yardstick is the natural log of close divided by the close eighteen months ago on the benchmark symbol. Daily log returns of the traded symbol feed the realised volatility estimate when volatility targeting is enabled.
Components
• Component one Momentum eighteen months. Log of benchmark close divided by its close mom_lookback bars ago. Its sign defines the trend regime. No extra smoothing is applied beyond the long window itself.
• Component two Realised volatility optional. Standard deviation of daily log returns on the traded symbol over sixty three days. Annualised by the square root of 252. Used only when volatility targeting is enabled.
• Optional component Volatility targeting. Converts target annual volatility and realised volatility into a leverage factor clipped by a maximum leverage setting.
Fusion rule
The model uses a simple gate. First compute the sign of eighteen month log momentum on the benchmark symbol. Optionally compute leverage from volatility. The sign decides whether the strategy wants to be long, short, or flat. Leverage only rescales position size when enabled and does not change direction.
Signal rule
• Long suggestion. When eighteen month log momentum on the benchmark symbol is greater than zero, the strategy wants to be long.
• Short suggestion. When that log momentum is less than zero and shorts are allowed, the strategy wants to be short. If shorts are disabled it stays flat instead.
• Wait state. When the log momentum is exactly zero or history is not long enough the strategy stays flat.
• In position. In practice the strategy sits IN LONG while the sign stays positive and flips to IN SHORT or flat only when the sign changes.
Inputs with guidance
Setup
• Momentum Lookback (months). Controls the horizon of the log return on the benchmark symbol. Typical range 6 to 24 months. Raising it makes the model slower and more selective. Lowering it makes it more reactive and sensitive to medium term noise.
• Symbol. External symbol used for the momentum calculation, SPY by default. Changing it lets you time other indices or run signals from a benchmark while trading a correlated instrument.
Logic
• Allow Shorts. When true the strategy will open short positions during negative momentum regimes. When false it will stay flat whenever momentum is negative. Practical setting is tied to whether you use a margin account or an ETF that supports shorting.
Internal risk parameters (not exposed as inputs in this version) are:
• Target Vol (annual). Target annual volatility for volatility targeting, default 0.2.
• Vol Lookback (days). Window for realised volatility, default 63 trading days.
• Max Leverage. Cap on leverage when volatility targeting is enabled, default 2.
Usage recipes
Swing continuation
• Signal timeframe. Use the daily chart.
• Benchmark symbol. Leave at SPY for US equity index exposure.
• Momentum lookback. Eighteen months as a default, with twelve months as an alternative preset for a faster swing bias.
Properties visible in this publication
• Initial capital. 100000
• Base currency. USD
• Default order size method. 5% of the total capital in this example
• Pyramiding. 0
• Commission. 0.03 percent
• Slippage. 3 ticks
• Process orders on close. On
• Bar magnifier. Off
• Recalculate after order is filled. Off
• Calc on every tick. Off
• All request.security calls use lookahead = barmerge.lookahead_off
Realism and responsible publication
The strategy is for education and research only. It does not claim any guaranteed edge or future performance. All results in Strategy Tester are hypothetical and depend on the data vendor, costs, and slippage assumptions. Intrabar motion is not modeled inside daily bars so extreme moves and gaps can lead to fills that differ from live trading. The logic is built for standard candles and should not be used on synthetic chart types for execution decisions.
Performance is sensitive to regime structure in the US equity market, which may change over time. The strategy does not protect against single day crash risk inside bars and does not model gap risk explicitly. Past behavior of SPY and the momentum effect does not guarantee future persistence.
Honest limitations and failure modes
• Long sideways regimes with small net change over eighteen months can lead to whipsaw around the zero line.
• Very sharp V shaped reversals after deep declines will often be missed because the model waits for momentum to turn positive again.
• The sample size in a full SPY history is small because regime changes are infrequent, so any test must be interpreted as indicative rather than statistically precise.
• The model is highly dependent on the chosen lookback. Users should test nearby values and validate that behavior is qualitatively stable.
Legal
Education and research only. Not investment advice. You are responsible for your own decisions. Always test on historical data and in simulation with realistic costs before any live use.

Crypto Anchored VWAP (Swing High/Low)Crypto Anchored VWAP (Swing High/Low)
This indicator provides an automatic Anchored VWAP system designed specifically for highly volatile assets such as cryptocurrencies (ETH, BTC, SOL, etc.).
Unlike traditional AVWAP tools that require manual date input, this script automatically anchors VWAP to the most recent swing high and swing low, making it ideal for real-time trend tracking and intraday/4H structure analysis.
How It Works
The script detects local swing lows and swing highs based on user-defined swing length.
When a new swing point appears, an Anchored VWAP is initialized from that specific candle.
As price evolves, the AVWAP dynamically becomes:
A trend boundary
A fair-value line
A mean-reversion attractor
Traders can use these levels to identify:
Trend continuation
Breakout confirmation
Mean reversion pullbacks
Overextended expansions
Included Features
✔ Auto-Anchored VWAP from swing low
✔ Auto-Anchored VWAP from swing high
✔ Standard deviation bands (1σ) for volatility context
✔ Designed for Crypto 4H / 1H / 15m
✔ Works on any asset & any timeframe
How To Use
1. Trend Direction
Price above Swing-Low VWAP → Bullish bias
Price below Swing-High VWAP → Bearish bias
2. Trade Setups
Break → Retest → Hold above AVWAP = Trend continuation long
Reject from AVWAP / σ band = Mean-reversion short setup
AVWAP zone → High probability liquidity reaction
3. Volatility Bands
Price touching +1σ = extension
Price returning to 0σ = mean reversion
Price breaking −1σ = trend weakening
Inputs
Swing Length: determines sensitivity of swing high/low detection
(Default: 5)
Best Use Cases
ETH 4H trend following
BTC structure shifts
Altcoin volatility filtering
Identifying institutional "cost basis" zones
Confirming breakouts / fakeouts
Notes
This is not a trading system by itself but a structural tool meant to help traders understand trend and value location. Always combine AVWAP with market structure, volume, and risk management.
Disclaimer
This script is for educational and informational purposes only. It does not constitute financial advice or a recommendation to buy or sell any asset. Use at your own discretion.

3-bar Swing Liquidity Grab📊 3-BAR SWING LIQUIDITY GRAB
WHAT IT DOES
Automatically detects 3-bar swing highs/lows and alerts you to liquidity grab moments — when price breaks structural levels to trigger stop-losses, then reverses.
SIGNALS AT A GLANCE
Signal What It Means Trade Idea
SH 🟠▼ Swing High (Resistance) Reference level
SL 🔵▲ Swing Low (Support) Reference level
LQH 🔴❌ Fake break ABOVE resistance SHORT ⬇️
LQL 🟢❌ Fake break BELOW support LONG ⬆️
HOW TO TRADE IT
Spot the trend — Is price going up or down?
Wait for signal — LQL (green) in uptrend, LQH (red) in downtrend
Enter on signal — Place order on that bar
Stop Loss — Just outside the swing level
Take Profit — At the next swing level
SETTINGS EXPLAINED
Swing length: 1 = 3-bar swing, 2 = 5-bar swing (use 1 for scalp, 2 for larger TF)
Lookback bars: Time window to find liquidity grabs (10-20 for scalp, 50+ for position)
Toggles: Show/hide swing markers and signals
BEST ON THESE TIMEFRAMES
TF Type Settings
M5-M15 Scalp SL: 1, LB: 10-15
M15-H1 Intraday SL: 1, LB: 15-20
H1-H4 Swing SL: 1-2, LB: 20-50
D+ Position SL: 2, LB: 50+
KEY RULES
✅ DO:
Trade signals aligned with major trend
Always use stop loss
Use 2-5% risk per trade
Confirm with price action
❌ DON'T:
Trade choppy/sideways markets
Ignore the trend
Chase signals
Overtrade
REAL EXAMPLE
LONG Trade (LQL Signal):
text
Uptrend → Swing Low forms at 1.0950
→ Price dips to 1.0930 (below SL)
→ Closes at 1.0955 (above SL) = GREEN ❌ (LQL)
→ BUY at 1.0960
→ Stop Loss: 1.0920
→ Take Profit: 1.1050 (previous Swing High)
WORKS ON
✅ Crypto (Bitcoin, Ethereum, Altcoins)
✅ Forex (EUR/USD, GBP/USD, etc.)
✅ Stocks & Indices
✅ Commodities (Gold, Oil, etc.)
Any asset, any timeframe, any market.
DISCLAIMER
This is a technical analysis tool, not financial advice. Past performance does not guarantee future results. Always use proper risk management and test on a demo account first.

Daily Oversold Swing ScreenerThat script is a **Pine Script Indicator** designed to identify potential **swing trade entry points** on a daily timeframe by looking for stocks that are **oversold** but still in a **healthy long-term uptrend**.
It screens for a high-probability reversal setup by combining four specific technical conditions.
Here is a detailed breakdown of the script's purpose and logic:
---
## 📝 Script Description: Daily Oversold Swing Screener
This Pine Script indicator serves as a **momentum and trend confirmation tool** for active traders seeking short-to-intermediate-term long entries. It uses data calculated on the **Daily** timeframe to generate signals, regardless of the chart resolution you are currently viewing.
The indicator is designed to filter out stocks that are in a strong downtrend ("falling knives") and only signal pullbacks within an established uptrend, which significantly increases the probability of a successful swing trade bounce.
### 🔑 Key Conditions for a Signal:
The indicator generates a buy signal when **all four** of the following conditions are met on the Daily timeframe:
#### 1. Oversold Momentum
* **Condition:** `rsiD < rsiOS` (Daily RSI is below the oversold level, typically **30**).
* **Purpose:** Confirms that the selling pressure has been extreme and the stock is temporarily out of favor, setting up a potential bounce.
#### 2. Momentum Turning Up
* **Condition:** `rsiD > rsiPrev` (Current Daily RSI value is greater than the previous day's Daily RSI value).
* **Purpose:** This is the most crucial filter. It confirms that the momentum has **just started to shift upward**, indicating that the low may be in and the stock is turning away from the oversold region.
#### 3. Established Uptrend (No Falling Knives)
* **Condition:** `sma50 > sma200 and closeD > sma50` (50-day SMA is above the 200-day SMA, AND the current daily close is above the 50-day SMA).
* **Purpose:** This is a **long-term trend filter**. It ensures that the current oversold condition is just a **pullback** within a larger, structurally bullish market (50 > 200), and that the price is still holding above the short-term trend line (Close > 50 SMA). This effectively screens out weak stocks in continuous downtrends.
#### 4. Price at Support (Bollinger Bands)
* **Condition:** `closeD <= lowerBB` (Daily Close is less than or equal to the lower Bollinger Band).
* **Purpose:** Provides a secondary measure of extreme price deviation. When the price touches or breaches the lower band, it suggests a significant move away from the mean (basis), often signaling strong statistical support where price is likely to revert.
### 📌 Summary of Signal
The final signal (`signal`) is triggered only when the market is confirmed to be **in a healthy long-term trend (Condition 3)**, the price is at an **extreme support level (Condition 4)**, the momentum is **oversold (Condition 1)**, and most importantly, the **momentum has begun to reverse (Condition 2)**.

cd_sfp_CxGeneral:
This indicator is designed to assist users who trade the Swing Failure Pattern ( SFP ).
In technical literature (various definitions exist), an SFP is a situation where the price violates a previous swing level but fails to close beyond that level.
• (Liquidity Sweep)
• (Buyer or seller dominance)
• (Stop hunt)
• (Turtle Soup)
The general strategy is built upon seeking trade opportunities after an SFP is formed and conviction is established that the market direction has changed.
Components used to gather confirmation:
• Determining Bias: Periodic SAR
• Obtaining Breakout/Reversal Confirmation: Change in State Delivery (CISD)
• Defining the Buyer/Seller Block (Supply/Demand Zones): Mitg Blocks (Mitigation Blocks), FVG (Fair Value Gaps), and Standard Deviation Projection
• Key Levels: Previous HTF (Higher Time Frame) levels
• Setting Targets: Standard Deviation Projection
• Trade Management: Anchored VWAP and opposing blocks
• Time-Based Context: Session Killzone times
• Notifications: An alarm/alert system will be utilized to stay informed.
________________________________________
Details:
Swing and Swing Failure Pattern:
Swing Sweep Types (Liquidity Sweep):
1. Single
2. Consecutive (The liquidity of the entity that swept the liquidity is being swept)
Bias Determination
We need to filter out the numerous SFPs that occur across all time frames. Our first strong filter will be the Bias. We will only look for trades aligned with our bias.
We will use Periodic SAR (Stop and Reverse) to determine the bias. We compare the price with the SAR value from a Higher Time Frame than the one we are trading on.
• Price > SAR => Bullish Bias
• Price < SAR => Bearish Bias
Depending on the pair, H1 SAR may be chosen for scalp trades, and Daily/Weekly SAR for intraday and swing trades.
Key Levels
Strategies looking for trades after a liquidity grab generally state that the sweep / stop hunt movement should occur at a significant price level.
The most fundamental Key Level levels are (User can customize):
• Previous Week High & Low
• Previous Day High & Low
• Previous H4 High & Low
• Previous H1 High & Low
• Asia Killzone High & Low
• London Killzone High & Low
• New York Killzone High & Low
• Monday Range High & Low values
We will prefer SFP formations that occur when these levels are swept. When Key Levels are violated, an information label appears on the screen.
Blocks / Zones
To strengthen our hand, we will use three types of blocks/zones, either with Key Levels or separately. When an SFP structure is formed in these areas (along with bias and breakout confirmation), our expectation is for the price to continue in our desired direction. These regions are:
1. Mitigation Blocks (Mtg)
o (Details can be found in the cd_VWAP_mtg_Cx indicator)
o In short: A second candle, following a bullish candle, crosses its high but fails to close above it. We call this a sweep / SFP. When the price, which was expected to go to the low, instead makes a new high/close, an Mtg block is formed. (Buyers are dominant)
2. FVGs (Fair Value Gaps)
o We use classic FVG structures.
3. Standard Deviation Projection Boxes
o When we get an SFP structure + breakout confirmation (CISD), we use the Standard Deviation Projection to determine our profit-taking and take-profit levels.
o Based on the idea that the price often respects the range between -2 and -2.5 of the projection values, we box this range and use it as our area of interest. (Our expectation is for the price to reverse after reaching this target).
o Let's mark it on the chart.
Confirmation
To summarize what has been explained so far: we look for the price to form an SFP structure in levels/zones we deem important, aligned with our bias, and for the breakout to be confirmed with a CISD.
No single component is strong on its own, but the success rate increases when they occur together.
We observe the following as additional confirmation along with the CISD: a new Mtg block forming in the direction of the breakout, high-volume movement (with FVG and a large body), and respect for VWAPs, the resistance/support line, and the defense block.
Additional Confirmations with Breakouts:
• Defence block, new mtg and VWAP
• Resistance / Support Line:
Indicator Signals
The indicator marks all formed sweeps, selected key levels, blocks, the projection, and CISD confirmations on the screen. The candle where the CISD confirmation occurs is indicated by an arrow.
• Arrows with double short lines signify a CISD that follows an SFP occurring at a Key Level.
• All other CISD candle indications are shown with single-line arrows.
Trade Management
When selecting profit targets in trades (preferably), the projection, opposing blocks, and structures that have formed are taken into account. Do not neglect to look at the structures that have formed against you when entering a trade.
Menu Settings:
• For Mtg blocks, the trading timeframe or a higher timeframe can be selected.
• FVGs formed in the current timeframe are displayed when the price creates an SFP (in "Fvg" option).
• Deviation boxes are displayed when the price creates an SFP (in box).
• The SAR HTF setting (H1) for scalp trades may vary depending on the pair. Users trying trades on higher timeframes should increase the HTF setting.
o Example: If you are looking for a trade with an SFP structure on H1, the SAR HTF setting should be H4 or higher.
• VWAP lines are refreshed starting from the candle that executed the sweep when the price forms an SFP. The only setting to adjust is the source selection setting (hlc3 is selected).
• Time frames and Killzone / Special Zone settings for Key Levels can be changed/should be checked.
Alarms / Alerts:
The conditions that will trigger an alert can be selected from the menu.
• To receive an alert aligned with the bias, the "Alignment with bias" checkbox must be selected.
• The alert should be set on the timeframe where you plan to enter the trade.
• The display options do not affect the alarm conditions. (Example: FVGs are monitored even when the menu selection is "off").
• If the necessary conditions are met, the alarm is triggered on the new candle that opens after the CISD confirmation.
• The alarm will not be triggered more than once at the same Key Level.
The user can preferably select alerts:
• Bias-aligned or Bias-independent
• Sweep (without waiting for CISD)
• Sweep + CISD (without looking for other conditions)
• Sweep + Key Level + CISD (the swept level is a Key Level)
• Sweep + Mtg / Fvg / Dev. + CISD (SFP formed in any of the blocks)
• Sweep + Mtg + CISD (SFP formed in the Mtg block)
• Sweep + Fvg + CISD (SFP formed inside the FVG)
• Sweep + Deviation Box + CISD (SFP formed inside the Dev. Box)
• Sweep + Key Level + Mtg / Fvg / Dev. + CISD (SFP formed simultaneously at a Key Level and any of the blocks)
Trade Example:
• Conditions: Bias-aligned + Sweep + Mtg/Fvg/Dev (at least one) + CISD
• Extra Confirmations: Respect for the Defense Block + Respect for VWAP
• Target (TP): Projection between -2 and -2.5
I welcome your thoughts and suggestions regarding my indicator, which I believe will be successful in the long run by adhering to uncompromising risk management and a strict trading plan.
Happy Trading!

Aibuyzone Spot & Swing ZonesAibuyzone Spot & Swing Zones is a technical tool that helps identify potential buy zones during established bullish trends.
It is designed for spot and swing traders who prefer to buy pullbacks within broader uptrends.
This indicator does not place trades or make predictions — it only highlights contextual market areas for study.
How It Works
Trend Alignment Filter
A higher-timeframe EMA and two local EMAs determine trend direction.
Only when both the local and higher-timeframe trends agree as bullish will a potential buy zone be considered valid.
Dynamic Buy Zone (Value Area)
The indicator measures a rolling price range over a user-selected number of bars (e.g., last 50).
The lower fraction of this range (configurable percentage) becomes the buy zone band.
When price revisits this lower section during a bullish trend, it is interpreted as a potential value or discount area.
Liquidity Sweep Filter (Optional)
Detects bars that make a new low relative to recent candles and then close back up with a strong lower wick.
This condition can indicate a possible liquidity grab or stop-hunt event that precedes reversals.
RSI Pullback Filter (Optional)
Confirms that price momentum has cooled during the pullback phase.
Signals occur when RSI falls within a defined “pullback” zone (default 30–55), helping avoid chasing overextended moves.
Confluence Scoring
Each of the three criteria — buy zone presence, liquidity sweep, RSI pullback — adds one point to a confluence score.
A signal only appears when the score meets or exceeds the chosen threshold (for example, 2 of 3).
Visual Elements
Fast and Slow EMAs for short-term trend visualization.
A shaded area marking the dynamic buy zone.
Optional background tint when the overall trend is bullish.
Optional labels below bars when confluence criteria are met.
Alert condition available for custom user alerts.
Suggested Use
Select a higher timeframe that fits your trading horizon (e.g., 4h for swing, 1d for position trading).
Use the shaded band as a visual guide for where price may offer “discounts” within an uptrend.
Combine with support/resistance, volume, or other confluence methods for confirmation.
Adjust the confluence requirement for stricter or looser signals.
Disclaimer
This script is provided for educational and analytical purposes only.
It does not constitute financial advice or a recommendation to buy or sell any asset.
All trading involves risk — always perform your own analysis and manage risk according to your own judgment.
