Swing Levels and Liquidity - By LeviathanThis script will plot pivot points (swing highs and lows) in the form of lines, boxes or labels to help you identify market structure, “liquidity” areas, swing failure patterns, etc. You are also able to see the volume traded at each pivot point, which will help you compare their significance.
Bars Left-Right
A pivot high (swing high) is a bar in a series of bars that has a higher value than the bars around it and a pivot low (swing low) is a bar in a series of bars that has a lower value than the bars surrounding it. The Bars Left and Bars Right parameters are used to define the number of bars on the left and right sides of a pivot point that the function should consider when identifying pivot highs and lows in a time series. For example, if Bars Left is set to 5 and Bars Right is set to 6, the function will look for a pivot point by comparing the value of the current bar with the values of the 5 bars to its left and the 6 bars to its right. If the value of the current bar is higher than all of these bars, it is considered a pivot high point. These parameter can be used to adjust the sensitivity of the script (lowering the Bars Left and Bars Right parameters will give you more swing points and increasing the Bars Left and Bars Right parameters will give you fewer swing points).
”Show Boxes” - This will draw a box above the swing high and a box below the swing low to help you visualise a large area of interest around swing points. Additional box types and the width of the box can be adjusted in Appearance settings below.
”Show Lines” - This will draw a horizontal line at the level of each swing high and swing low.
”Show Labels” - This will plot a circle at the high point of each swing high and at the low point of each swing low.
”Show Volume” - This will display the amount of volume traded in a given swing point candle. It can help you identify the significance of a given swing point by comparing it to the volumes of other swing points.
”Extend Until Filled” - This will extend the swing point levels until they are mitigated by the price. Turning it off will continue plotting the levels just a few more bars after a swing point occurs.
”Appearance” - You can show/hide swing points, choose the colors of labels, lines and boxes, choose the size and positioning of the text, choose line and box appearance (adjust the Box Width when switching between timeframes!) and more.
More updates coming soon (MTF, more data…)
Поиск скриптов по запросу "swing"

Swing Trend AnalysisIntroducing the Swing Trend Analyzer: A Powerful Tool for Swing and Positional Trading
The Swing Trend Analyzer is a cutting-edge indicator designed to enhance your swing and positional trading by providing precise entry points based on volatility contraction patterns and other key technical signals. This versatile tool is packed with features that cater to traders of all timeframes, offering flexibility, clarity, and actionable insights.
Key Features:
1. Adaptive Moving Averages:
The Swing Trend Analyzer offers multiple moving averages tailored to the timeframe you are trading on. On the daily chart, you can select up to four different moving average lengths, while all other timeframes provide three moving averages. This flexibility allows you to fine-tune your analysis according to your trading strategy. Disabling a moving average is as simple as setting its value to zero, making it easy to customize the indicator to your needs.
2. Dynamic Moving Average Colors Based on Relative Strength:
This feature allows you to compare the performance of the current ticker against a major index or any symbol of your choice. The moving average will change color based on whether the ticker is outperforming or underperforming the selected index over the chosen period. For example, on a daily chart, if the 21-day moving average turns blue, it indicates that the ticker has outperformed the selected index over the last 21 days. This visual cue helps you quickly identify relative strength, a key factor in successful swing trading.
3. Visual Identification of Price Contractions:
The Swing Trend Analyzer changes the color of price bars to white (on a dark theme) or black (on a light theme) when a contraction in price is detected. Price contractions are highlighted when either of the following conditions is met: a) the current bar is an inside bar, or b) the price range of the current bar is less than the 14-period Average Daily Range (ADR). This feature makes it easier to spot price contractions across all timeframes, which is crucial for timing entries in swing trading.
4. Overhead Supply Detection with Automated Resistance Lines:
The indicator intelligently detects the presence of overhead supply and draws a single resistance line to avoid clutter on the chart. As price breaches the resistance line, the old line is automatically deleted, and a new resistance line is drawn at the appropriate level. This helps you focus on the most relevant resistance levels, reducing noise and improving decision-making.
5. Buyable Gap Up Marker: The indicator highlights bars in blue when a candle opens with a gap that remains unfilled. These bars are potential Buyable Gap Up (BGU) candidates, signaling opportunities for long-side entries.
6. Comprehensive Swing Trading Information Table:
The indicator includes a detailed table that provides essential data for swing trading:
a. Sector and Industry Information: Understand the sector and industry of the ticker to identify stocks within strong sectors.
b. Key Moving Averages Distances (10MA, 21MA, 50MA, 200MA): Quickly assess how far the current price is from key moving averages. The color coding indicates whether the price is near or far from these averages, offering vital visual cues.
c. Price Range Analysis: Compare the current bar's price range with the previous bar's range to spot contraction patterns.
d. ADR (20, 10, 5): Displays the Average Daily Range over the last 20, 10, and 5 periods, crucial for identifying contraction patterns. On the weekly chart, the ADR continues to provide daily chart information.
e. 52-Week High/Low Data: Shows how close the stock is to its 52-week high or low, with color coding to highlight proximity, aiding in the identification of potential breakout or breakdown candidates.
f. 3-Month Price Gain: See the price gain over the last three months, which helps identify stocks with recent momentum.
7. Pocket Pivot Detection with Visual Markers:
Pocket pivots are a powerful bullish signal, especially relevant for swing trading. Pocket pivots are crucial for swing trading and are effective across all timeframes. The indicator marks pocket pivots with circular markers below the price bar:
a. 10-Day Pocket Pivot: Identified when the volume exceeds the maximum selling volume of the last 10 days. These are marked with a blue circle.
b. 5-Day Pocket Pivot: Identified when the volume exceeds the maximum selling volume of the last 5 days. These are marked with a green circle.
The Swing Trend Analyzer is designed to provide traders with the tools they need to succeed in swing and positional trading. Whether you're looking for precise entry points, analyzing relative strength, or identifying key price contractions, this indicator has you covered. Experience the power of advanced technical analysis with the Swing Trend Analyzer and take your trading to the next level.

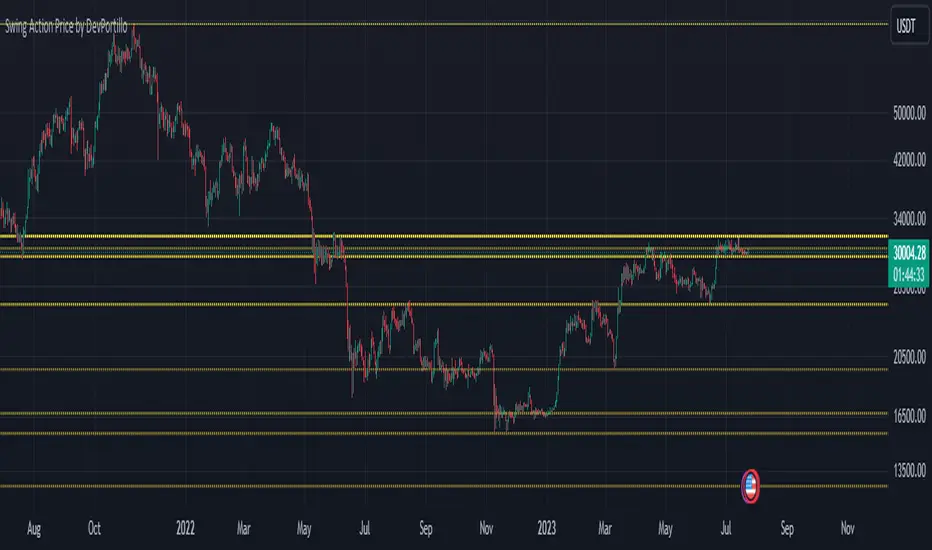
Swing Action PriceEnglish:
**Description of "Swing Action Price" TradingView Script**
"Swing Action Price" is a custom technical indicator designed to identify swing highs and swing lows in a financial market. The script calculates and plots various lines on the chart to visualize these swing points. Swing highs are points where the price has made a local peak, while swing lows are points where the price has made a local trough.
The indicator displays the following lines on the chart:
1. Dotted lines representing each individual swing high and swing low identified on different timeframes (10, 30, 60, 100, 150, 200, 700, and 1000 bars).
2. Dotted lines representing the most recent swing high and swing low for the current bar.
How the indicator works:
1. The script uses historical price data to calculate swing highs and swing lows based on specific conditions.
2. For each of the mentioned timeframes, the indicator identifies the highest high and lowest low within a defined number of bars (10, 30, 60, etc.).
3. Once a new swing high or swing low is identified, the corresponding dotted lines are drawn on the chart, extending from the previous swing point to the current one.
The "Swing Action Price" indicator can be used by traders to visually identify key support and resistance levels in the market. It helps them recognize potential trend reversals or continuation points, which may be valuable for making trading decisions.
Please note that trading indicators should always be used in conjunction with other technical and fundamental analysis tools to make informed trading choices. The "Swing Action Price" indicator is offered under the Mozilla Public License 2.0, and the developer's username is "damianjorgeportillo."
Remember that past performance is not indicative of future results, and it's essential to exercise caution and apply risk management strategies when trading financial markets.
/******************************/
Spanish:
**Descripción del Script "Swing Action Price" en TradingView**
"Swing Action Price" es un indicador técnico personalizado diseñado para identificar máximos y mínimos en un mercado financiero. El script calcula y muestra diversas líneas en el gráfico para visualizar estos puntos de inflexión. Los máximos se producen cuando el precio alcanza un pico local, mientras que los mínimos ocurren cuando el precio alcanza un valle local.
El indicador muestra las siguientes líneas en el gráfico:
1. Líneas punteadas que representan cada máximo y mínimo individual identificado en diferentes marcos de tiempo (10, 30, 60, 100, 150, 200, 700 y 1000 barras).
2. Líneas punteadas que representan el máximo y mínimo más reciente para la barra actual.
Cómo funciona el indicador:
1. El script utiliza datos históricos de precios para calcular los máximos y mínimos en función de ciertas condiciones.
2. Para cada uno de los marcos de tiempo mencionados, el indicador identifica el máximo más alto y el mínimo más bajo dentro de un número específico de barras (10, 30, 60, etc.).
3. Una vez que se identifica un nuevo máximo o mínimo, se dibujan las líneas punteadas correspondientes en el gráfico, extendiéndose desde el punto de inflexión anterior hasta el actual.
El indicador "Swing Action Price" puede ser utilizado por traders para identificar visualmente niveles clave de soporte y resistencia en el mercado. Ayuda a reconocer posibles puntos de inversión o continuación de tendencia, lo que puede ser valioso para tomar decisiones comerciales.
Por favor, ten en cuenta que los indicadores de trading siempre deben utilizarse junto con otras herramientas de análisis técnico y fundamental para tomar decisiones comerciales informadas. El indicador "Swing Action Price" se ofrece bajo la Licencia Pública de Mozilla 2.0, y el nombre de usuario del desarrollador es "damianjorgeportillo".
Recuerda que el rendimiento pasado no garantiza resultados futuros, y es esencial ser cauteloso y aplicar estrategias de gestión de riesgos al operar en los mercados financieros.
Swing PointsThis indicator gives a clear indication of price action swing-points as well as an indication of whether it is a higher, lower, or equal swing point relative to the last high/low.

Swing Trading IndicatorThis script is a swing‑trading dashboard designed for BTC, ETH, S&P 500 (for now). It combines weekly RSI, USDT.D, VIX, moving averages and Fisher Transform into a single visual tool, with background highlights, an on‑chart info table and ready‑made alerts to help you time high‑probability swing entries and manage risk.
1. Overview
The indicator is intended to work on daily timeframe.
Signals are context‑aware: BTC and ETH get USDT.D conditions, SPX gets VIX and EMA‑100 logic, and all non‑ETH symbols can also use Fisher Transform as a mean‑reversion filter.
2. Conditions and background highlights
Each component sets a boolean condition and, when active, paints a background layer:
Weekly RSI condition
True when weekly RSI is below its symbol‑specific threshold.
USDT.D conditions
BTC: triggered when USDT.D is above the user threshold and the chart symbol is BTC.
ETH: same logic for ETH, but tracked separately..
VIX condition (SPX only)
True when VIX high is at or above the VIX threshold while the chart is SPX.
EMA condition (BTC & SPX)
BTC: daily close below EMA‑200.
SPX: daily close below EMA‑100.
Fisher Transform condition (non‑ETH)
Fisher Transform on the chart timeframe, using the configured period.
True when Fisher value is below the Fisher threshold.
3. Intended use and notes
This indicator is designed as a confluence tool for swing traders, not a standalone buy/sell system. It works best on assets that are in a clear uptrend, where the main idea is to accumulate during corrections within that broader bullish structure.
During larger market shocks, deep corrections, or black‑swan events, trend‑based and mean‑reversion filters can produce false signals, because volatility and correlations often behave abnormally in those periods. For that reason, this script should always be combined with independent risk management, higher‑timeframe trend analysis, and your own discretion.

Swing Structure + Session Sweeps“Scalper-Friendly Trend & Sweep Detector”
Swing Structure + Session Sweeps with TEMA Cloud
This powerful all-in-one tool is designed for intraday traders, swing traders, and scalpers who want to spot high-probability reversals, trend continuations, and liquidity sweeps with confluence.
🔹 Core Features
Multi-layered TEMA Cloud (9, 20, 34, 50) for clear trend structure
Dynamic Bull/Bear labels when the trend flips
Centerline for TEMA 20 to visualize core trend direction
Session-based liquidity sweep detection (Asia, London, NY)
Volume and absorption dots to catch hidden pressure
Swing high/low detection (external and internal)
Visual VWAP, daily highs/lows, and customizable session zones
Optional alerts for volume spikes, absorption, and reversal sweeps
📈 Use it to:
Confirm directional bias
Anticipate pullbacks and breakouts
Identify volume-backed reversals
Align trades with session strength and swing confluence
⚙️ Built for scalpers, intraday opportunists, and precision chartists alike.

Swing Indicator (2 before, 1 after) v2 with Dong-DangFeatures
Detection Swing (swing HIGH is the highest bar among 2 bars before and 1 bar after, and swing LOW is the lowest bar among 2 bars before and 1 bar after)
Dong-Dang (The line plot switch between a swing HIGH and LOW ==> represents the price movement)
Fixes
fix swing detection from the last version when there are 2 or more bars that have the same high or low price
======== ======== ========
ฟีเจอร์
การจับสวิง (จะเป็นสวิง HIGH ก็ต่อเมื่อแท่งนั้นสูงกว่า 2 แท่งก่อนหน้า และ 1 แท่งด้านหลัง, และจะเป็นสวิง LOW ก็ต่อเมื่อแท่งนั้นต่ำกว่า 2 แท่งก่อนหน้า และ 1 แท่งด้านหลัง)
ด๊องแด๊ง (คือเส้นที่ลากสลับไปมาระหว่างสวิง High และ Low ==> ใช้เพื่อดูการเคลื่อนที่ของราคา)
สิ่งที่แก้ไข
แก้ไขการจับสวิงจากเวอร์ชันก่อนหน้า ในกรณีที่มีแท่งเทียน 2 แท่ง หรือมากกว่า มีค่า high หรือ low เท่ากัน
======== ======== ========
Credit: Bravo Trade Academy

Swing Pivots High LowBINANCE:BTCUSDT
This indicator is an opensource merge of the built in 'Pivot Points High Low' and the most popular 'Swing-high-low-support-resistance' indicators. The original 'Pivot Points High Low' does not have extensions with better visibility, while the most popular 'Swing-high-low-support-resistance' has no source available. I've also added additional configurable alert conditions for Pivot High and Low Crossover/Crossunder.
Please read the official documentation for further information about the indicator.

Swing EMAWhat is Swing EMA?
Swing EMA is an exponential moving average crossover-based indicator used for low-risk directional trading.
it's used for different types of Ema 20,50,100 and 200, 3 of them are plotted on chat 20,100,200.
100 and 200 Ema is used for showing support and resistance and it contains highlights area between them and its change color according to market crossover condition.
20 moving average is used for knowing Market Behaviour and changing its color according to crossover conditions of 50 and 20 Ema.
How does it work?
It contains 4 different types of moving averages 20,50,100, 200 out of 3 are plotted on the chart.
20 Ema is used for knowing current market behavior. Its changes its color based on the crossover of 50 Ema and 20 Ema, if 20 Ema is higher than 50 Ema then it changes its color to green, and its opposites are changed their color to red when 20 Ema is lower than 50 Ema.
100 and 200 Ema used as a support and resistance and is also contain highlighted areas between them its change their color based on the crossover if 100 Ema is higher than 200 Ema a then both of them are going to change color to Green and as an opposite, if 200 Ema is higher then 100 Ema is going to change its color to red.
So in simple word 100 and 200 Ema is used as support and resistance zone and 20 Ema is used to know current market behavior.
How to use it?
It is very easy to understand by looking at the example I gave where are the two different types of phrases. phrase bull phrase and bear phrase so 100 and 200 Ema is used as a support and resistance and to tell you which phrase is currently on the market on example there is a bull phrase on the left side and bear phrase on the right side by using your technical analysis you can find out a really good spot to buy your stocks on a bull phrase and too short on the bear phrase. 20 Ema is used as a knowing the current market behavior it doesn't make any difference on buying or selling as much as 100 Ema and 200 Ema.
Tips
Don't trade against the market.
Try trade on trending stocks rather than sideways stock.
The higher the area between 100 Ema and 200 Ema is the stronger the phrase.
Do Backtesting before real trading.
Enjoy Trading.

Swing Dream - PAINT BARS | MA | EMA | DMA | VWAP | TABLE | ADR %- Swing Dream -
Script created for breakout-swing traders, in the style of QullaMaggie * , Dan Zanger, Oliver Kell, and Stockbee.
The following indicators are used by most successful breakout-swing traders such as mentioned above.
(As published) it contains:
Painted Bars, also known as inside/outside candles. Used for candle analysis and to determine breakout pivots & levels. For instance; use it in different timeframes and seek formations (ex, 3-1-2). For further inspiration, study Rob Smith's The Strat .
MA, Simple Moving Averages (Basic levels = 10,20,50,200). Use this indicator to define resistance/support areas as well as the overall long/swing-term trend. In breakout strategies such as EP, Flags, etc this can be used for trailing stops; an example, post-breakout, let the price ride the 20ma before exiting your position.
EMA, Exponential Moving Averages with periods inspired by Qullamaggie (10,20,65). Use this on shorter timeframes (ex, 1h) and for the same principles as MAs.
VWAP, Volume-Weighted Average Price. As for the previous, utilize this as a level indicator to find areas of resistance/support. Good for swing-trading as it implies whenever holders are profitable or not.
DMA, Displaced Moving Average (Horizontal). Personally, I use this a lot. Works very well for trailing stops (post breakout) and "bounce" areas. Choose your own offset and period.
ADR%, Average Daily Range Percentage. Displayed in the table and used to define a symbol's volatility. A very good tool for Qullamaggie-style trading. Personally, I try to find setups with over 6% ADR. Basic definition; low ADR% = Increased chance of a symbol to move slower and in smaller ranges. A higher value equals the opposite.
Table. A table with basic symbol-related information. Could save you plenty of time whenever you scan or search for new swing setups. Looking to add more features here.
Why should you use this script? Well, instead of having tens of different indicators, use this script and combine everything together with EP, Flag, or breakout principles. Suited for every plan, and more efficient in my opinion.
View settings to turn on/off different indicators.
* If you're looking for an introduction and further explanation of how Qullamaggie uses mentioned indicators, I could recommend checking out his website, stream, or participation in "Chat With Traders".
At last, I want to credit: @jkcqld @neolao @TheScrutiniser
This Script will get updated and improved.
// TechFille006

Swing/Scalper HULL + T3 avg Crypto StrategyThis is a both a swing and a scalper strategy(depends on the timeframe that you use), that works with all timeframes, however I noticed that with swing 3h works the best on most crypto pairs, such as ETH, BTC and so on.
Its main components are:
Hull moving average
T3 moving average
Risk management
With them I make an average and use it as the main moving average.
Rules for entry
For long: Average moving average is bigger than previous average moving average value.
For short:Average moving average is lower than previous average moving average value.
Rules for exit
We exit when either the TP/SL has been hit, or when we get a different condition than previous one(both for long and short).
If you have any questions, let me know !

Swing IndicatorThis indicator provides some base code for looping over data to identify swings in price action. Full code commentary can be found on the backtest rookies website.
The indicator shall allow users to "analyse" a recent historical candle to detect whether it was a swing point. This will work by inputting a number to select which historical candle you want to check. The indicator will then check all candles after it until the current candle. It shall also check the same amount of candles before it. If the candle analysed has the lowest low or highest high in the complete range, then we know it was a swing point.

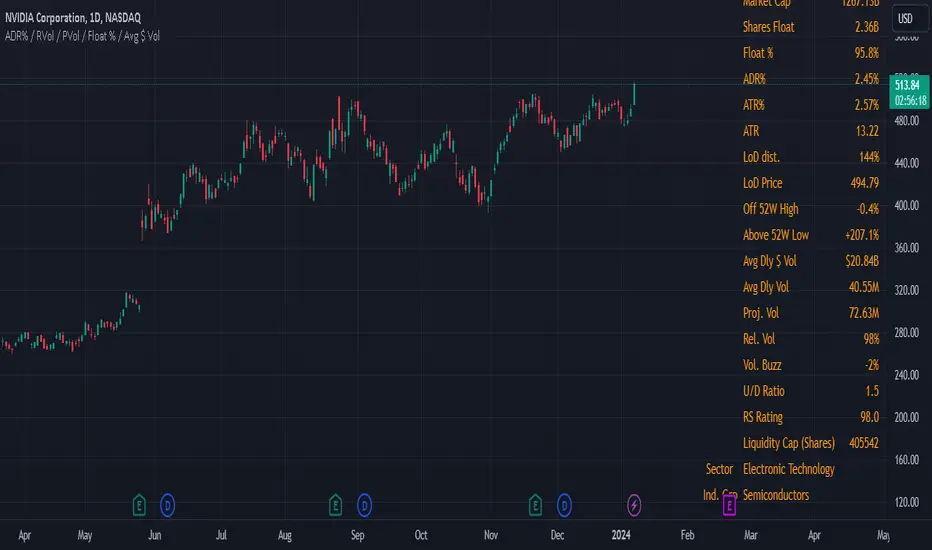
Swing Data - ADR% / RVol / PVol / Float % / Avg $ VolThis table presents consolidated data that swing traders can refer to quickly for their benefit. I am of the firm belief that the information provided in this uncomplicated table is precisely what you require to optimize your trading efficiency, and ultimately, profitability.
The data includes;
1. Market Capitalization - a measure of the total value of a publicly traded company's outstanding shares.
2. Float % - the percentage of a company's outstanding shares that are available for trading on the open market. It is calculated by dividing the number of a company's outstanding shares that are available for trading on the open market by the total number of outstanding shares. A lower float percentage generally means that there are fewer shares available for trading, which can lead to increased volatility in the stock price. On the other hand, a higher float percentage generally means that there are more shares available for trading, which can lead to greater stability in the stock price.
3. ADR% - a technical analysis indicator that measures the average daily price movement as a percentage of its current price. It is calculated by taking the difference between the average high and low prices for a time period, and then dividing it by the current price. The resulting value is then multiplied by 100 to give the ADR% for that day. The ADR% can be useful for traders to assess the potential volatility of a stock. A higher ADR% indicates a greater potential for price movement.
4. ATR - measures the range of price movements of an asset over a specified period of time, taking into account any gaps in price. It is calculated by taking the highest value of the following three values:
The difference between the current high and the current low
The absolute value of the difference between the current high and the previous close
The absolute value of the difference between the current low and the previous close
The resulting value is then averaged over the specified period of time to create the ATR value. This indicator is reflects the average volatility of the asset over the specified period of time.
5. LoD dist. - also refer to Low Of Day distance, a range level gauge of current price based on historical volatility of the price movement, in this case I use ATR. for the historical volatility. Please find below as example for the calculation.
eg. LoD dist. = 104%
Current price (A) = $24.49
Low Price (B) = $22.16
Difference (A) - (B) = $2.33
ATR = $2.25
LoD dist = $2.33 / $2.25 = 103.55% (round up to nearest whole number = 104%)
6. Average Daily $ Volume - used to measure the average amount of money that is traded in a stock or a security over a particular period of time, typically a day. It is calculated by multiplying the average daily trading volume of a security by its average price.
7. Average Daily Volume - used to measure the average no. of share that is traded in a stock or a security over a particular period of time, typically a day.
8. Projected Volume - an estimate of the total volume of trading activity that is expected to occur for the day (from the specific time data), based on an average volume over a specific period of time. Projected volume can be used by traders and investors to help make informed decisions about buying or selling securities, and can also be used as an indicator of market sentiment and volatility. However, it's important to note that projected volume is an estimate and actual trading activity may vary.
9. Relative Volume - a measure of the volume of a stock that is trading at the specific time, relative to its average trading volume over a longer period. It is expressed as a percentage and is often used by traders and investors to identify stocks that are trading with higher or lower than usual volume.
Swing Structure Scanner [LuxAlgo]The Swing Structure Scanner Indicator is a dashboard type indicator which displays a Consolidated "High/Low-Only" view of swing structure, with the capability to retrieve and display swing points from up to 6 different tickers and timeframes at once.
🔶 USAGE
This indicator displays swing structure data from up to 6 unique tickers or timeframes; Each graph represents the current swing structure retrieved from the requested chart/s.
Each swing graph displays the current live swing point positioning relative to the previous swing points. By analyzing the different formations, patterns can more easily be recognized and found across multiple tickers or timeframes at once.
This indicator serves as a nifty tool for confluence recognition, whether that's confluence throughout market tickers, or confluence through higher timeframes on the same ticker.
Alternatively, viewing the relative positioning of each swing point to each other, should give a clearer idea when higher lows or lower highs are formed. This can potentially indicate a newly forming trend, as well as serving as a warning to watch for breakouts.
The swing length can be changed to align with each individual's strategy, as well as a display look back can be adjusted to show more or less swing points at one time.
The display is fairly customizable, it is not fixed to 6 symbols at all times and can be minimized to only display the number of symbols needed; Additionally, the display can be set to vertical mode or horizontal(default) to utilize as needed.
Note: Hover over the swing point in the dashboard to get a readout of the exact price level of the swing point.
🔶 SETTINGS
Swing Length: Set the swing length for the structure calculations.
Swing Display Lookback: Sets the number of swing points (Pairs) to display in each Swing Graph display.
Symbols: Sets the Timeframe and Symbol for each Swing Graph.
Vertical Display: Display the Swing Graphs up and down, rather than side to side.
Scaling Factor: Scales the entire indicator up or down, to fit your needs.

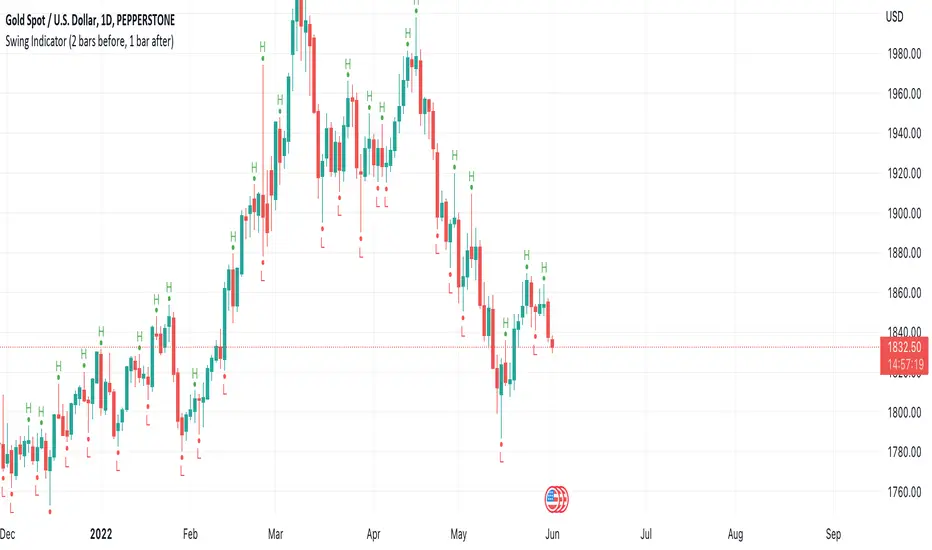
Swing Indicator (2 bars before, 1 bar after)This swing indicator is created to mark swing high and low followed by the condition of Bravo Trade Academy.
Conditions for being a Swing High
- The high price of swing high bar has to be higher than the high price of 2 bars before and 1 bar after
Conditions for being a Swing Low
- The low price of swing low bar has to be lower than the low price of 2 bars before and 1 bar after
=========================================================================
Swing Indicator นี้สร้างขึ้นเพื่อช่วยในการมาร์ค Swing High และ Swing Low ตามเงื่อนไขการเป็น Swing หน้า 2 หลัง 1 ของ Bravo Trade Academy
เงื่อนไขการเป็น Swing High
- ราคา High ของแท่งที่เป็น Swing High จะต้องสูงกว่าราคา High ของแท่งก่อนหน้า 2 แท่ง และแท่งหลัง 1 แท่ง
เงื่อนไขการเป็น Swing Low
- ราคา Low ของแท่งที่เป็น Swing Low จะต้องต่ำกว่าราคา Low ของแท่งก่อนหน้า 2 แท่ง และแท่งหลัง 1 แท่ง
Swing Failure Pattern [UAlgo]🔶 Description:
The Swing Failure Pattern (SFP)o aims to identify potential reversal points in price action by detecting instances where price attempts to break past a previous high or low but fails to sustain that momentum, often indicating a shift in market sentiment.
🔶 Key Features:
Swing Failure Pattern Identification: The indicator identifies Swing Failure Patterns where price attempts to breach a recent high or low but fails to maintain that momentum, potentially signaling a reversal.
Customizable Lookback Period: Traders can adjust the lookback period to define the range within which Swing Failure Patterns are identified.
Minimum Bars Between SFP: This feature allows users to set a minimum number of bars required between Swing Failure Patterns to filter out noise and improve the accuracy of signals.
RSI Confluence: Traders have the option to incorporate RSI (Relative Strength Index) confluence into the signals, filtering SFP signals based on overbought and oversold levels of RSI. This adds an additional layer of confirmation to potential reversal points.
Example :
without Confluence :
with Confluence:
Customizable RSI Parameters: Users can customize the length of the RSI period as well as define overbought and oversold levels according to their trading strategy.
Visual Alerts: The indicator provides visual alerts on the price chart using labels to highlight potential Swing Failure Patterns, aiding traders in identifying these patterns quickly and efficiently.
Disclaimer:
Please note that the Swing Failure Pattern indicator is provided for informational purposes only and should not be considered as financial advice. Trading involves substantial risk, and users should conduct their own research and analysis or consult with a financial advisor before making any investment decisions based on this indicator. Additionally, past performance is not indicative of future results.

Swing BoxesHey, folks!
Sorry for not posting anything for such a long time. Don't have enough ideas and resources to get inspiration, so trying to brainstorm good stuff in my free time from university studies.
But despite my absence more I now have 300+ people subscribed to me! Thanks, guys, for keeping interest for my work, as I still do value each boost on my script, for real :)
So here is new script , enjoy!
Swing Boxes is pretty simple indicator, which plots signals with "boxes", that help you determine price targets.
What is the idea behind?
I wanted to make indicator, that could help me make swing trades with nice accuracy (as all we want, lol), and for signal criteria I decided to use highs and lows of the price . Then I started coding some ideas to see which of them could be worthy. And, actually, Swing Boxes appeared to be good. But the thing is, that I didn't intend to build them, they appeared as an anomaly from my code :)
I started to explore this anomaly (it looked super cool, but was repainting hard) to fix it and I succeeded, now Swng Boxes don't repaint.
The main idea is that when price goes above it's highest value of p-bars back or below it's lowest value p-bars back, then there is a some god probability, that price will continue to follow current direction.
And the things about Swing Boxes is that when there is a good trend movement, the boxes become super small to track price movement and when price breaks out in the counter-trend direction, then you will be able to almost perfectly catch a top or a bottom! But most of the signals won't be so high-quality, so don't think that is this some holy grail to trade swing-trading, because it is not.
Signal logic
Quick hint:
- epsilon(variable e ) = ATR * ATR_Factor . It is used to determine box's sensitivity to price changes.
If previous close is higher than variable, which contains previous HIGHEST value (variable h in the code), then update the this variable by taking up-to-date highest value and add epsilon( e ) to it;
If previous close is lower than variable, which contains previous LOWEST value (variable l in the code), then update the this variable by taking up-to-date lowest value and substract epsilon( e ) from it.
Variables decribed above ( h and l ) are box's top and bottom respectively, so if price cross them, it is logical to update it is value.
Settings and what is what
Swing Box Period - numbers fo bars in the past to find highest and lowest price from. The bigger the input, the bigger the boxes will be;
ATR Period;
ATR Factor - multiplier for ATR, determines sensitivity for price changes. The bigger this input, the more accurate signals will be, but less the probability that the signal will be on the top or a bottom.
Show Boxes? - when chosen, plots box's top and bottom. Used to determine price targets.
Show Baseline? - when chosen, plot's baseline, which midline between box's top and bottom.
How to use?
This indicator plots green and red triangles by default.
- Green triangle --> Buy ;
- Red triangle --> Sell ;
As I've said before, many signals from indicator will probably be garbage, so you need to tune settings for youself, so it could satisfy you .
You can enable showing boxes to see box's top and bottom. Box's bottom --> your entry, top --> your profit target.
If you find a way to sort bad signals, you will be able to trade with super cool RR, because the signal from Swing Boxes appear to be a good one, there is almost 95% probability, that price will not even come close to your stop loss, so you can trade with super small stop-losses! Smaller stop-loss --> smaller risk --> smaller loss --> bigger profit, it is that easy.
Also you can enable baseline to use at as your 1st TP, and box's top/bottom as 2nd TP, closing 25% on TP1 and the rest on TP2 (but that is just mine recommendation, you can use different RM (risk-management), if you want).
Also you can use baseline as your S/R (Support/Resistance) line, test it out on your charts.
And please, hear me out: as all other indicators out here on the TradingView, Swing Boxes ARE NOT meant to be traded in solo! Many bad signal can go in a row, so PLEASE find your way to filter out bad signals with other indicators.
You can see here the example of a garabge-class signal in a row, so be don't be deluded!
I do hope that somebody will suggest and idea to improve this thing, as I personally don't have enough time to think about it because of my university studies, but I will probably try it make this thing better throughout the time.
And that's it for now, folks! If you have any ideas for scripts, strategies or anything else, feel free to DM me or leave a comment, I will check it.
Hope you will find this script useful.
Take your profits!
- Tarasenko Fyodor

Swing VWAP Crypto and Stocks StrategyThis is a strategy designed for swing trading on markets such as crypto and stocks.
Its components are:
VWAP
Time Management
Risk management
Rules for entry:
We entry only on Monday, if our close of the candle crossed above VWAP
Rules for exit
We exit always on Sunday or if we either hit the TP/SL levels.
If you have any questions let me know

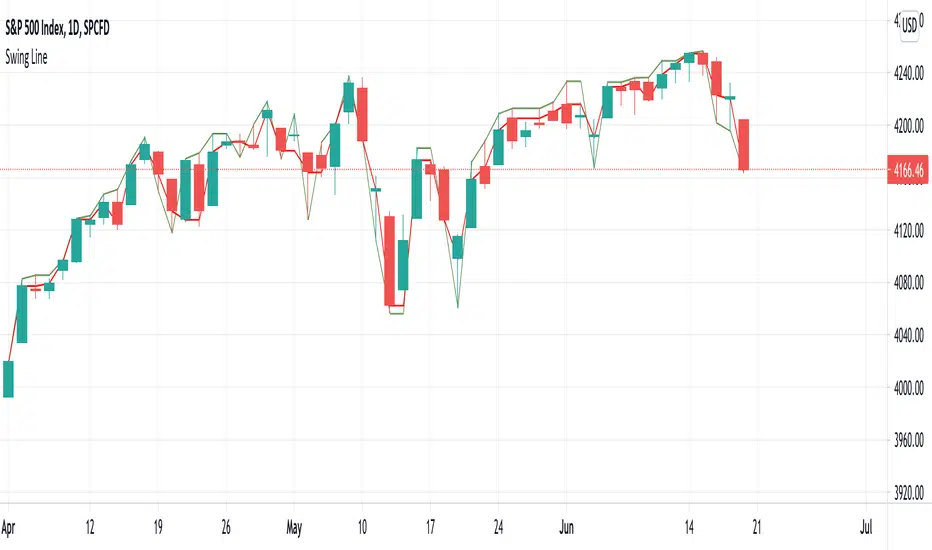
Swing LineThe author was inspired by Charles Dow's concept on trend and Gann's concept on swing trade.
Swing line can help identify resistance and support. Breaking resistance indicate an uptrend. Breaking support indicates a downtrend. This is a simple and intuitive method in trend determination.
However, many chart readers nowadays set Candlestick as preferred pattern. The shared indicator provides another choice for constructing swing lines.
Swing Failure Pattern Inquisitor SFP Inquisitor
v0.2a
coded by Bogdan Vaida
Code for Swing High, Swing Low and Swing Failure Pattern.
Note that we're still in the alpha version, bugs may appear.
Note that the number you set in your Swing History variable
will also be the minimum delay you see until the apples appear.
This is because we're checking the forward "history" too.
The SFP will only check for these conditions:
- high above Swing History high and close below it
- low below Swing History high and close above it
In some cases you may see an apple before the SFP that "doesn't fit"
with the SFP conditions. That's because that apple was drawn later and
the SFP actually appeared because of the previous apple .
20 candles later.
Legend:
🍏 - swing high
🍎 - swing low
🧺 - candle where the last swing was driven from
🍌 - swing failure pattern
🍎🍌 - hungry scenario: swing low but also a SFP compared to the last swing

Swing/Daytrading strategy with reversal option
Hello, today I bring a swing reversal strategy that work on all financial markets.
It uses timeframes starting from 1h, the bigger the better.
Its very dangerous because it has no stop loss, neither a take profit. Our exit condition is based on the reversal on the entry .
For entry we have 2 types : normal and reversal
Lets say we want to go long , for that we check the last CLOSE of a candle with the previos HIGH. If its higher than that, and at the same time CLOSE is bigger than the moving average, we have a long entry.
For short we have CLOSE with the previous LOW. If its lower than that and at the same time is lower than moving average, we have a short entry.
For moving average we use T3 MA
For reversal what I do, is , I take the short condition and I apply it to long, and for long I apply the short condition.
On many cases I found out it work amazingly.
I forgot to add: it also has a time entry system, so we use the best hours/sessions for entries .
Exit a trade: lets say we enter short, when we find a long condition, we close short and enter into long. Viceversa for long.
If you have any questions, let me know.
Enjoy it :)

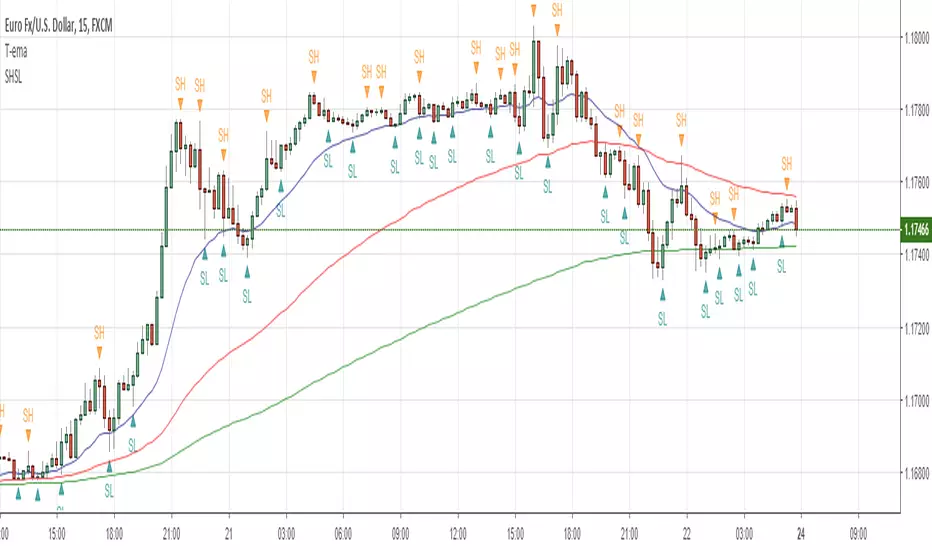
Swing Highs and Lows (version 2)My second version of plotting Swing Highs and Swing Lows
A Swing High (SH): a price bar high preceed by two lower highs (LH) and followed by two lower highs (LH)
This version enables you to ignores swing highs and lows when the market volatility is small and not suitable for trading.
Thus it will depict fewer number of SH and SL markers, making the chart a bit cleaner and easier for us to read.
Volatility is measured simply by the amount of pips moved within five consecutive bars: the default is set at 10 pips, meaning that when you take five consecutive bars and the gap of the highest high and the lowest low is less than or equal to 10 pips, it will not depict SH or SL markers.
To use this function, check "set volatility threshold?" box under the Format icon and set a threshold in pips.
(I typically trade EURUSD so the pips input is customized for that)
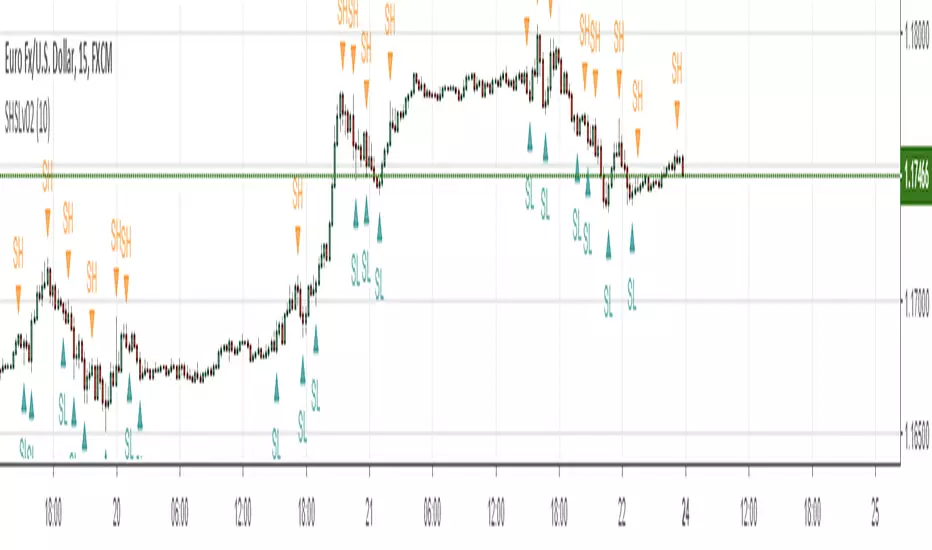
Swing Highs and LowsSimple script to overlay swing highs and lows.
A Swing High (SH): a price bar high preceded by two lower highs (LH) and followed by two lower highs (LH).