Поиск скриптов по запросу "swing"


The Pivot Reversal Strategy (Just changed it a bit)Just changed it a bit, no kudos to me, was literally five minutes changing parameters.
Cheers

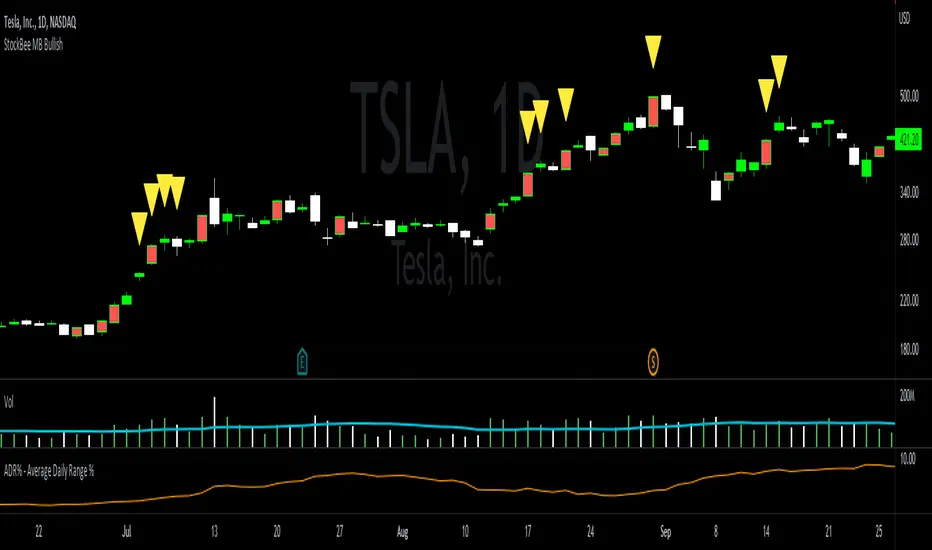
StockBee MB BullishStockBee Bullish Momentum Burst & 20% Plus Study Tool
The Stockbee bullish momentum burst study tool is helpful for practitioners of the momentum burst method who want to easily find historical momentum bursts and/or 20% plus gainers using Trading View. This script finds three specific breakouts that meet the below criteria:
4% Breakouts (Colors Candle Body)
1. Volume of the candle is greater than the previous candle volume.
2. The percent change of candle's price is greater than 4% from the previous candle close.
3. Current candle close is less than 30% from candle's high.
**Users can toggle 4% Breakouts on/off and also change candle body color in settings**
Dollar Breakouts (Colors Candle Body)
1. The change of candle's price is greater than $0.90 from the previous candle close.
2. Current candle close is less than 30% from candle's high.
** Dollar Breakout does not take volume into consideration **
**Users can toggle Dollar Breakouts on/off and also change candle body color in settings**
20% Plus Gainers (Displays Yellow Triangle Icon)
1. The change over five candles is greater than 20%.
**Users can toggle 20% plus label on/off, cannot change the label color**
This script also filters out any candle that gaps up and breaks down with a close above 4% the previous candle (Eliminates gap-ups that fade). This tool is meant to find and filter possible candidates. Not every marked candle is a great momentum burst trade. Users can look at 4% Breakouts, Dollar Breakouts, 20% Plus Gainers individually or any combination of the three.
This is helpful for Trading View users trading this specific setup.
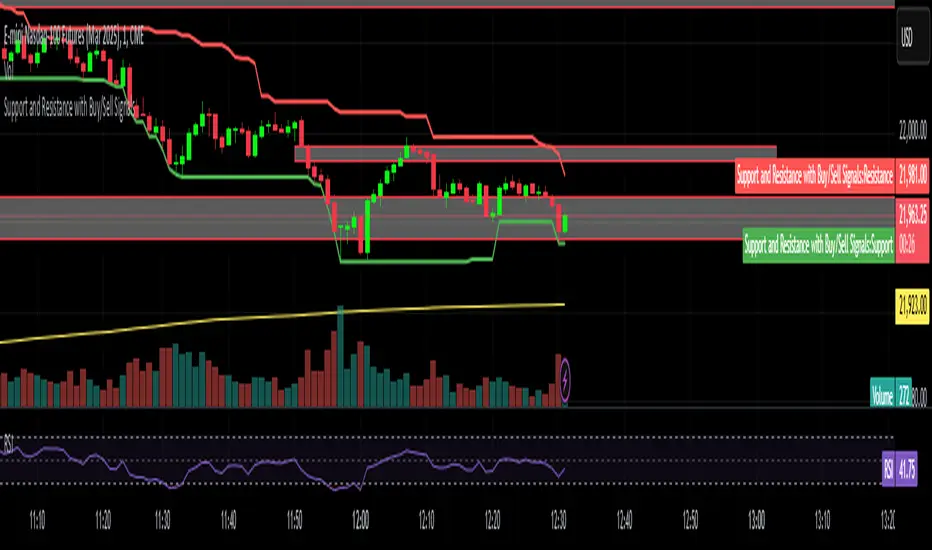
Support and Resistance with Buy/Sell SignalsSwing Highs and Lows:
The script identifies swing highs and lows using the ta.highest and ta.lowest functions over a user-defined swing_length period.
Swing highs are treated as resistance levels.
Swing lows are treated as support levels.
Buy Signal:
A buy signal is generated when the price closes above the resistance level (ta.crossover(close, swing_high)).
Sell Signal:
A sell signal is generated when the price closes below the support level (ta.crossunder(close, swing_low)).
Plotting:
Support and resistance levels are plotted on the chart.
Buy and sell signals are displayed as labels on the chart.
Background Highlighting:
The background is highlighted in green for buy signals and red for sell signals (optional).
Swings as Music - Full octaveEvery level corresponds as every note. plot it from high to low and your chart will show you the levels related to the notes vibrations.

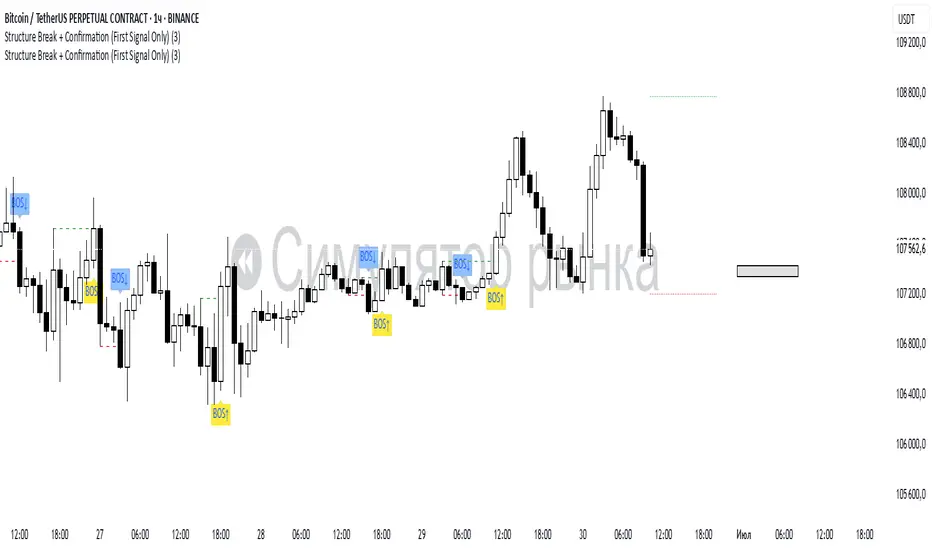
Structure Break + Confirmation (First Signal Only)Swing Detection:
A Swing High is detected when the high of the central candle (based on a lookback period) is greater than the highs of the candles before and after.
A Swing Low is detected when the low of the central candle is lower than the lows of the candles before and after.
Break of Structure (BOS):
A BOS Up is confirmed when a candle closes above the most recent swing high (with a body close).
A BOS Down is confirmed when a candle closes below the most recent swing low.
Confirmation (CONF):
A CONF Up is triggered when price makes a new high after a BOS Up.
A CONF Down is triggered when price makes a new low after a BOS Down.
Only the first confirmation after a BOS is plotted.
Visuals:
Cross marks (×) are plotted at swing points.
BOS signals are shown with green (up) and red (down) labels.
CONF signals are shown with lime (up) and orange (down) triangle markers.
Dotted lines are drawn at the levels of broken swing highs/lows.
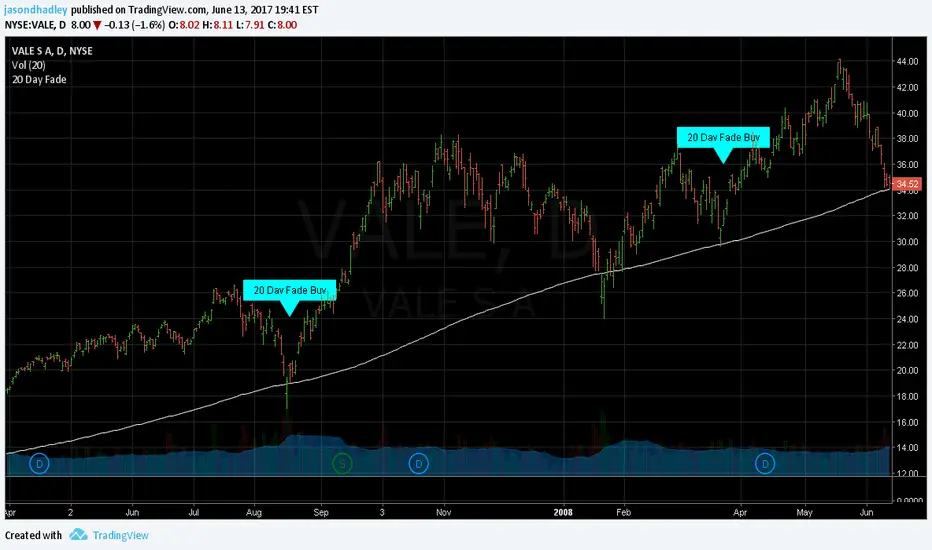
20 Day Fade20 Day Fade from MarketGeeks, I like the idea!.
This indicator only looks at daily bars, regardless of what timeframe you are using.
We look for a new 20 day low that closes within the 25th percentile of it's daily range.
We also want our security to be in an uptrend.
Finally we are looking for the next day closing price (or current price) to be atleast 2% above the previous days (20 day low) high.
Once all these conditions are satisfied it produces the text bubble letting you know that it is prime to buy.
The next version I will update with short options as well.
One day I may convert this into a strategy, but probably not. If you want to, please feel free to. All I ask is that you give credit for the base code, as I have done for the idea behind this indicator.
Ichimoku Trading Signals 1Swing Trading (Strategy 1, H4+ timeframes)
Use the Kumo Cloud to identify the trend: price above a green cloud = uptrend; price below a red cloud = downtrend.
Entry signals occur when price or the Tenkan-sen line crosses the Kijun-sen line, confirmed by Chikou Span momentum.
Exit triggers when price crosses back through the Kijun-sen or when Tenkan-sen crosses back below (for long positions) or above (for short positions).
Place stop-loss orders just beyond the nearest swing low/high candle cluster to manage risk tightly.
Ichimoku Trading Signals 2Swing Trading (Strategy 1, H4+ timeframes)
Use the Kumo Cloud to identify the trend: price above a green cloud = uptrend; price below a red cloud = downtrend.
Entry signals occur when price or the Tenkan-sen line crosses the Kijun-sen line, confirmed by Chikou Span momentum.
Exit triggers when price crosses back through the Kijun-sen or when Tenkan-sen crosses back below (for long positions) or above (for short positions).
Place stop-loss orders just beyond the nearest swing low/high candle cluster to manage risk tightly.

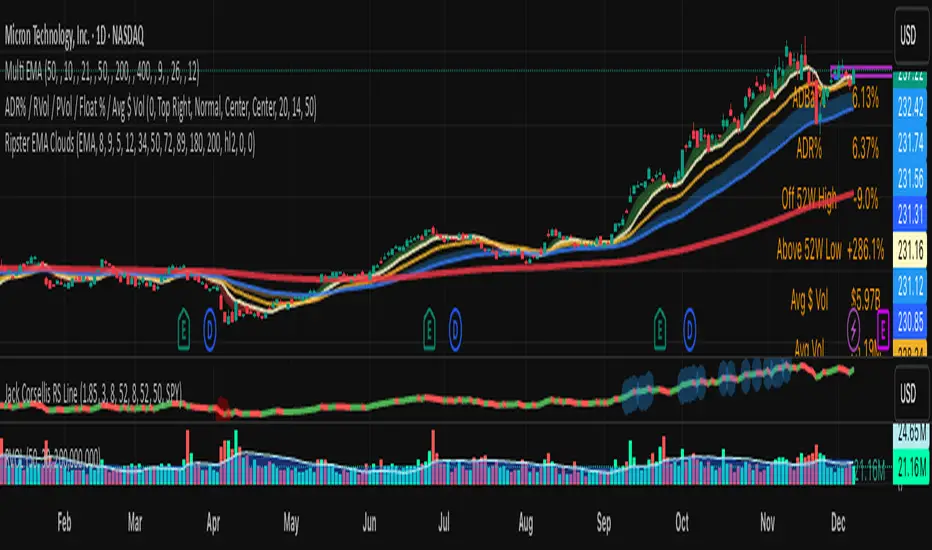
Swing Data - ADR% / RVol / PVol / Float % / Avg $ Vol (Mod)Modified from this source code:
I have added the current bar DR so i can compare to ADR of the current bar to see if it is worth taking the trade for my bar-by-bar practice.
Quick too instead of having to measure it each time
Swing Trade BUY/SELL + SCORING +COLOUR FIXBUY/SELL labels now appear with a score (1–3) next to them.
Color coding visually distinguishes signal strength:
BUY → 1 yellow, 2 light green, 3 dark green
SELL → 1 orange, 2 red, 3 burgundy
This allows you to instantly see the signal strength both numerically and visually.


Swing Strategy MTF with Auto SL/TP + Weekly Pivotsested and Working Notes:
Works on any intraday chart (like 1H or 4H)
Uses Daily trend for confirmation by default
Adjust trend EMAs or pivot TF if needed
Wait for a signal label after candle close
Targets and SL are drawn automatically
—

Swing Finder By Akash
This script is designed to highlight areas on a chart where there are **three or more consecutive candles** of the same color (bullish or bearish). It provides a visual indication of extended bullish or bearish momentum by changing the background color and marking the starting point of these areas.
### **How it works:**
1. **Identifying Bullish and Bearish Candles:**
- **Bullish candles** are defined as candles where the closing price is higher than the opening price (close > open).
- **Bearish candles** are defined as candles where the closing price is lower than the opening price (close < open).
2. **Consecutive Candle Counters:**
- A counter for **bullish candles** (`bullishCount`) and **bearish candles** (`bearishCount`) is maintained to track consecutive occurrences of bullish and bearish candles.
- These counters are **incremented** when consecutive bullish or bearish candles occur. They are **reset** to zero whenever a trend reversal happens (e.g., from bullish to bearish or vice versa).
3. **Area Marking:**
- If there are **three or more consecutive bullish candles**, the background is highlighted in **green** to indicate a bullish area.
- If there are **three or more consecutive bearish candles**, the background is highlighted in **red** to indicate a bearish area.
- A **green label** is plotted below the bars where the bullish area starts, and a **red label** is plotted above the bars where the bearish area starts.
### **Visual Indicators:**
- **Background Color:**
- **Green** for areas with 3 or more consecutive bullish candles.
- **Red** for areas with 3 or more consecutive bearish candles.
- **Labels:**
- A **green label** is plotted below the chart to mark the start of a bullish area.
- A **red label** is plotted above the chart to mark the start of a bearish area.
### **Usage:**
- This indicator can help traders identify strong trends, as consecutive bullish or bearish candles often indicate extended momentum in one direction.
- By marking these areas, traders can potentially look for entry points or identify when trends may be losing strength or reversing.
---
Feel free to adjust the description if you'd like it to reflect more specific details based on your use case!

Swing BandsThis indicator is a result of experimentation with price action of candle high and lows for quantifying reversals and trend continuation.
The band area shows trend reversal incoming and possible chop.
Middle line is the trend reversal price level. Candle colors change if the close price is above or below the middle line.
Long and short positions can be taken when above or below the bands.
Trend continuations are in effect when price retraces into the bands and breaks above or below in the same direction of the trend.

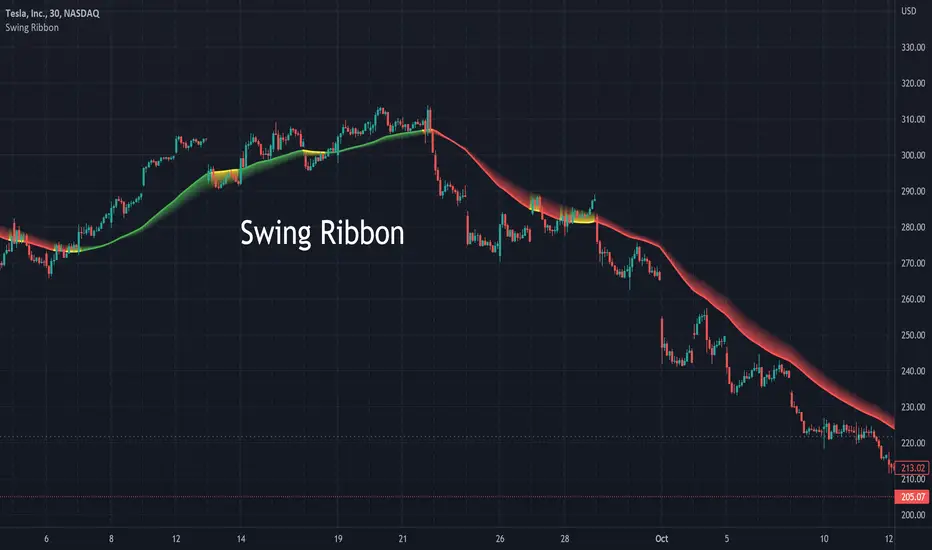
Swing RibbonA configurable fast and slow moving average combined to help visualize the current trend and potential changes in trend.
Allows for specifying a fixed set of minutes or days instead of just bars so that the visualization is similar when changing time-frames.
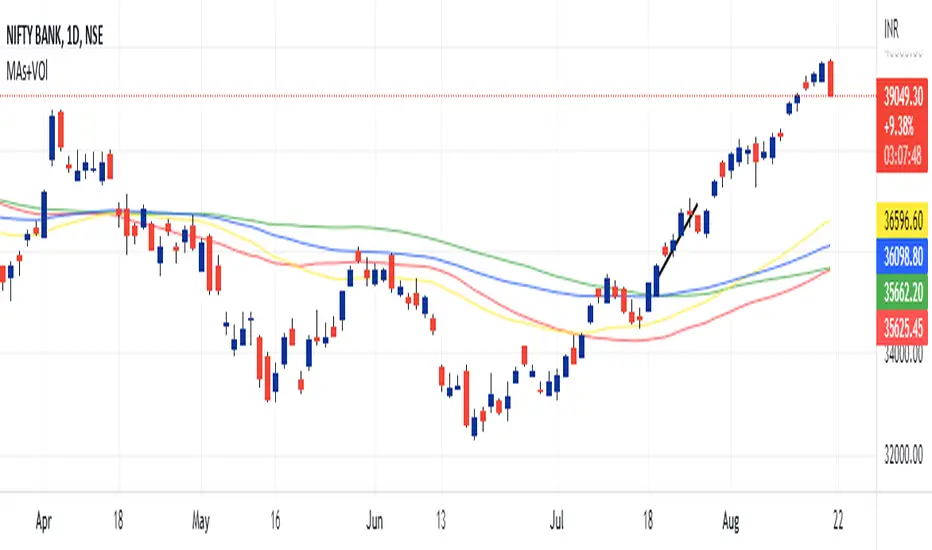
MAs+VOlIt a Combination of 4 Moving Averages.
2 Simple Moving Averages (50 SMA & 100 SMA)
2 Fast Moving Averages (50 EMA & 100 EMA)
Swing Trend StrategyThis script is a trend following system which uses a long term Moving Average to spot the trend in combination with the Average True Range to filter out Fakeouts, limiting the overall drawdown.
Default Settings and Calculation:
- The trend is detected using the Exponential Moving Average on 200 periods.
- The Average True Range is calculated on 10 periods.
- The Market is considered in an Uptrend when the price closes above the EMA + ATR.
- The Market is considered in a Downtrend when the price closes below the EMA - ATR.
- The strategy will open a LONG position when the market is in an Uptrend.
- The strategy will close its LONG positions when the price closes below the EMA.
- The strategy will open a SHORT position when the market is in a Downtrend.
- The strategy will close its SHORT positions when the price closes above the EMA.
This script is best suited for the 4h timeframe, and shows good results on BTC and ETH especially.
The options allow to modify the type of moving average to use, the period of the moving average, the ATR multiplier to add as well as the possibility to open short trades or not.
