Swing Trading SPX CorrelationThis is a long timeframe script designed to benefit from the correlation with the Percentage of stocks Above 200 moving average from SPX
At the same time with this percentage we are creating a weighted moving average to smooth its accuracy.
The rules are simple :
If the moving average is increasing its a long signal/short exit
If the moving average is decreased its a short signal/long exit.
Curently the strategy has been adapted for long only entries.
If you have any questions let me know !
Поиск скриптов по запросу "swing"

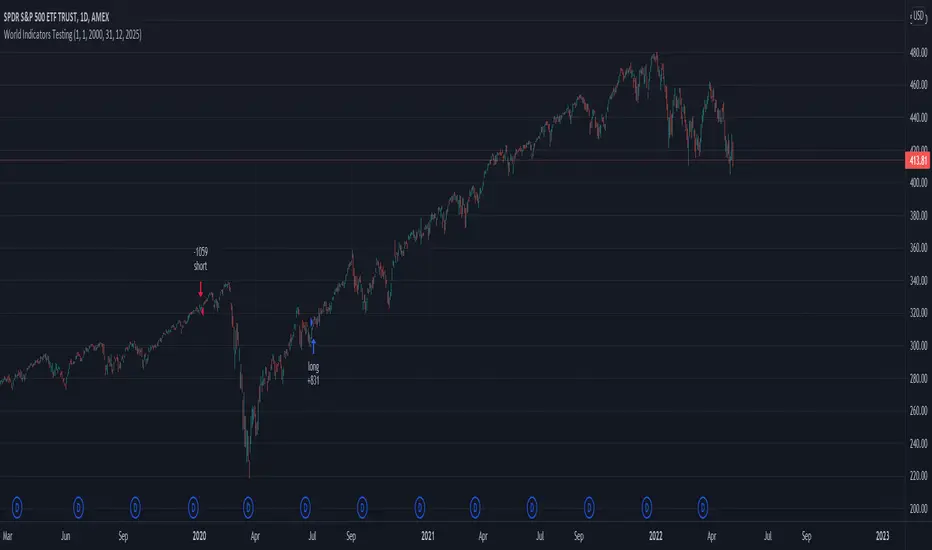
Swing Stock designed for Monthly/Yearly Trading This is a strategy tester designed around the most important data from FRED - Federal Reserve Economic Data
As input data, we have:
// Personal Consumption Expenditures
// Real Retail and Food Services Sales
// Leading Index for the United States
// All Employees: Total Nonfarm Payrolls
// Real Gross Domestic Product
// Gross Domestic Product
I adapted the long and short entry based on the GDP data, since they are most accurate in prediction compared to the rest.
However, feel free to test with other as well if you want.
For this test I compared previous GDP values, if they were higher than previous that represent a long signals, if they were smaller that represents a reversal=short signal.
From the tests performed we can see that GDP is highly accurate and overall as long as there is patience, profits are going to be make, sometimes even beat the index itself.
If you have any questions, let me know !
Swing Assassin's Consolidated ScriptI put this script together to essentially consolidate a number of scripts that I use on a daily basis into one script. This is an ongoing improvement effort, so there may be some garbage in here right now so keep that in mind if you intend to use this to help in your trading.
There are 5 moving averages (Hull). I use the Fast, Mid and Slow to find entries after I us the Medium Slow and Super Slow to identify a trend. Otherwise, I have those three turned off.
This script also uses Bollinger Bands which I literally cannot trade without.
The script also has anchored VWAP , automated support/resistance lines, and a homebrewed Volume Profile that is a copy from Ildar Akhmetgaleev's indicator "Poor Man's Volume Profile" used under Mozilla Public License Version 2.0.

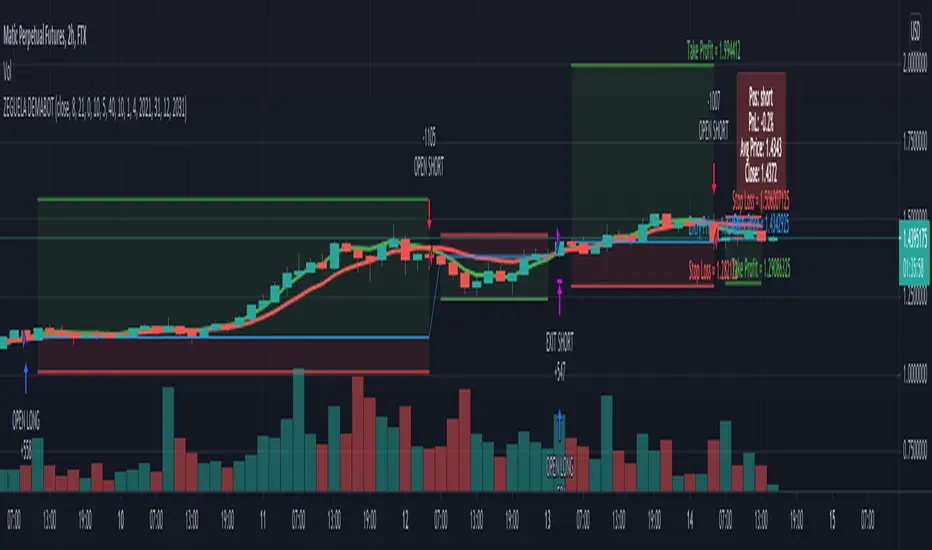
ZEGUELA DEMABOTSwing trading bot strategy. This indicator uses Dema 8 and Dema 24 crosses to throw buy and sell signals. You can also se take profit and stop loss parameters
Swing High Low Price Channel V.1You should buy/sell small order at small plot zone or after small plot. And, Buy/sell big order at big plot zone or after big plot.
Recommended, You should use this with Fibonacci Retracement, Price Action or Graph Pattern.


srd786-Intraday VWAP Price Action IndicatorDISCLAIMER
This Pine Script indicator does not constitute financial advice; it is just intended for educational and informational purposes. It functions as a tool for technical analysis that could help traders spot possible trading opportunities. It is crucial to remember that participating in financial markets has a number of risks that might result in large losses and are not suitable for all investors.
Users are encouraged to conduct their own thorough investigation and analysis prior to using this indicator. Avoiding trading with money that one cannot afford to lose is essential. It is also advised to seek advice from a certified financial expert. Users must use suitable risk management techniques and recognize that past success does not guarantee future outcomes.
Any losses, damages, or other consequences resulting from the usage of this indicator are not the author's responsibility. The user is ultimately responsible for all trading decisions, therefore using this tool is at their own risk.
INTRODUCTION
The “srd786-Intraday VWAP Price Action Indicator” is a sophisticated Pine Script (version 6) trading tool designed for intraday traders who focus on New York session trading hours. This indicator combines multiple technical analysis concepts including Volume Weighted Average Price (VWAP), Average True Range (ATR) for risk management, swing point detection for support/resistance identification, and momentum analysis through RSI. The primary objective is to generate high-probability long and short signals based on price action confluence with trend, momentum, and key structural levels.
1.
VWAP (Volume Weighted Average Price): Shows the "fair" average price based on both price and trading volume.
2.
ATR (Average True Range): Measures how much the price typically moves each day.
3.
Trend Analysis: Identifies whether the market is going up, down, or sideways.
4.
Momentum Indicators: Shows how strong the current price movement is.
5.
Support & Resistance: Identifies key price levels where the price might stop or reverse.
6.
Swing Points: Finds significant turning points in the price.
This indicator is specifically optimized for the New York trading session (9:30 AM to 4:00 PM ET), making it particularly suitable for traders who focus on US market hours. It provides a complete trading framework that includes not only signal generation but also precise trade management levels including entry prices, stop-loss orders, and profit targets based on a configurable reward-to-risk ratio.
The philosophy behind this indicator is confluence-based trading. Rather than relying on a single indicator or condition, it requires multiple factors to align before generating a trade signal. This approach filters out lower-probability setups and focuses only on high-quality opportunities where price action, trend direction, momentum, and key technical levels all point in the same direction.
CORE CONCEPT AND METHODOLOGY
Volume Weighted Average Price (VWAP)
VWAP is the cornerstone of this indicator's trading methodology. Unlike a simple moving average that treats all price bars equally, VWAP incorporates volume data into its calculation, giving more weight to bars with higher trading volume. This makes VWAP a more accurate representation of the true average price where the most significant trading activity occurred.
The calculation of VWAP is performed using the built-in 'ta.vwap()' function, which computes the cumulative volume-weighted average price from the beginning of the session. For intraday traders, VWAP serves as a critical reference point that indicates whether the current price is trading at a premium (above VWAP) or discount (below VWAP) relative to the session's volume-weighted average.
In this indicator, the VWAP source is configurable through the 'vwapSource' parameter, with the default being HLC3 (High + Low + Close / 3). This source selection allows traders to experiment with different price types such as typical price, weighted close, or even custom sources to suit their trading style and market preferences.
Average True Range (ATR) for Risk Management
The Average True Range, calculated using 'ta.atr()', measures market volatility by decomposing the current range of price movement. ATR does not indicate price direction;
instead, it quantifies the degree of price movement or volatility over a specified period. In this indicator, ATR serves dual purposes: determining the distance for limit orders and calculating stop-loss levels.
The 'atrLength' parameter (default: 14) controls the lookback period for the ATR calculation. A shorter length makes the indicator more responsive to recent volatility, while a longer length provides a smoother average that may be more suitable for less volatile markets. The 'atrMultiplier' (default: 1.5) determines how many ATR units away the stop-loss is placed from the entry price, allowing traders to adjust their risk exposure based on current market conditions.
Swing Detection and Support/Resistance
Swing points represent significant turning points in price action where the market has temporarily exhausted its directional momentum. This indicator uses pivot high and pivot low calculations to identify swing highs and swing lows, which then form the basis for dynamic support and resistance levels.
The 'swingLength' parameter (default: 5) defines how many bars to the left and right of a potential pivot point must be lower (for pivot highs) or higher (for pivot lows) to confirm the swing point. This lookback period helps filter out minor price fluctuations and focuses on more significant structural levels.
Support and resistance levels are stored in arrays ('swingHighArray' and 'SwingLowArray'), with the most recent swing points serving as the primary reference levels. The 'srLookback' parameter (default: 20) controls the overall lookback window and also determines how many
swing points to maintain in each array, ensuring that only relevant historical levels are considered.
Breakout Detection
When a price moves past a major support or resistance level, this is known as a price breakout. This price breakout suggests that there is a possibility of a new trend direction heading forward.Breakout detection eliminates noise, as little price fluctuations or volatility may momentarily drive prices past a threshold without authentic conviction.Detection of breakouts affirms robustness when the price above the threshold by 2%, indicating genuine market interest, and mitigates whipsaws to prevent placing trades based on transient price swings.
The Breakout Tolerance parameter, set by default to 2%, regulates the breakout tolerance for the indicator. A price closure above the current high plus a minor tolerance buffer (usually 2%) indicates a potential continuation of upward movement, classified as a Bullish Breakout. Conversely, when the price closes below the recent low plus a minor tolerance buffer (usually 2%), it suggests that the price may continue to decline, which is classified as a Bearish Breakout Down.
Trend Identification
Trend determination is accomplished through an Exponential Moving Average (EMA) with a configurable length ('trendMaLength', default: 9). The indicator classifies trend into three
states: BULLISH (price above EMA with confirmation from the previous bar), BEARISH (price below EMA with confirmation), and SIDEWAYS (price crossing or near the EMA).
The EMA is chosen over simple moving averages because it responds more quickly to recent price changes while still providing enough smoothing to filter out noise. The confirmation requirement (both current and previous bar must be on the same side of the EMA) reduces false signals during periods of choppy price action.
Momentum Analysis
Momentum is measured using the Relative Strength Index (RSI) with a configurable length ('momentumLength', default: 9). RSI values are categorized into five states to provide nuanced momentum readings: STRONG BULL (RSI above 70), BUILDING (RSI between 55 and 70), NEUTRAL (RSI between 45 and 55), WEAKENING (RSI below 45), and STRONG BEAR (RSI below 30).
This momentum categorization allows traders to distinguish between strong trending conditions (STRONG BULL/BEAR) and transitions (BUILDING/WEAKENING), providing context for trade signals and helping to avoid entering positions during momentum divergences.
CONFIGURATION PARAMETERS
VWAP Settings
The 'vwapSource' parameter determines which price value is used in the VWAP calculation. The default value of 'hlc3' (High + Low + Close / 3) provides a balanced representation of each bar's price action. Traders can modify this to use typical price ('high + low + close / 3'), weighted close ('high + low + close + close / 4'), or other price types depending on their analytical preferences.
ATR Settings
The 'atrLength' parameter sets the lookback period for the Average True Range calculation. The default of 14 periods is standard across most trading platforms and timeframes, providing a good balance between responsiveness and smoothness. The 'atrMultiplier' parameter (default: 1.5) scales the ATR value to determine stop-loss distances. A multiplier of 1.5 means the stop-loss is placed 1.5 ATR units away from the entry price, providing enough buffer to accommodate normal volatility while limiting risk.
Trade Settings
The 'rrRatio' parameter (default: 3.0) establishes the reward-to-risk ratio for trade targets. A ratio of 2.0 means the profit target is twice the distance of the stop-loss from the entry price. The 'limitOrderDistance' parameter (default: 0.5) determines how far below (for long trades)
or above (for short trades) the current close the limit order is placed, measured in ATR units. This allows traders to enter positions at better prices while waiting for pullbacks.
Swing Detection Settings
The 'swingLength' parameter (default: 5) controls pivot identification sensitivity. Higher values identify more significant swing points but may miss shorter-term opportunities. The 'showSwings' boolean parameter toggles the visual display of swing high and low points on the chart.
Support & Resistance Settings
The 'srLookback' parameter (default: 20) defines how many bars back to search for swing points and support/resistance levels. The 'breakoutTolerance' parameter (default: 0.02 or 2%) adds a small buffer to breakout detection to account for minor penetration of support/resistance levels due to price spikes or slippage.
Trend & Momentum Settings
The 'trendMaLength' parameter (default: 9) sets the EMA length for trend determination, while 'momentumLength' (default: 9) sets the RSI lookback period. Both should be at least 5 periods for meaningful calculations.
Table Settings
The 'showTable' parameter (default: true) enables the display of two information tables that provide real-time data on Indicator values and trade levels.
SIGNAL GENERATION LOGIC
Long Signal Conditions
A long signal is generated when all the following conditions are simultaneously true:
1.
Session Filter: The trade must occur during New York session hours (9:30 AM - 4:00 PM ET).
2.
Trend Confirmation: The trend must be BULLISH (price above EMA with confirmation).
3.
Price Position: Current price must be above VWAP, indicating bullish price action.
4.
Breakout or No Resistance: Either price is breaking out above resistance level with tolerance, or there is no prior resistance level to overcome.
5.
Momentum Alignment: Momentum must be either STRONG BULL or BUILDING.
This confluence of conditions ensures that long trades are only taken when the market is trending higher, price is confirming strength by trading above VWAP, and momentum is supportive of continued upward movement.
Short Signal Conditions
A short signal is generated when all the following conditions are simultaneously true:
1.
Session Filter: The trade must occur during New York session hours
2.
Trend Confirmation: The trend must be BEARISH (price below EMA with confirmation)
3.
Price Position: Current price must be below VWAP, indicating bearish price action
4.
Breakout or No Support: Either price is breaking down below support level with tolerance, or there is no prior support level to overcome
5.
Momentum Alignment: Momentum must be either STRONG BEAR or WEAKENING
Similar to long signals, short trades require alignment across multiple timeframes and analytical approaches, filtering out counter-trend trades and focusing on high-probability setups.
TRADE MANAGEMENT FRAMEWORK
Entry Price Calculation
For long trades, the limit order price is calculated as: 'Close - (ATR Value × Limit Order Distance)'. This places the entry price below the current close, allowing traders to buy on dips while maintaining a favorable entry price. For short trades, the limit order is placed above the current close: 'Close + (ATR Value × Limit Order Distance)'.
The limit order distance is expressed in ATR units, making it adaptive to current volatility conditions. In more volatile markets, the limit order will be placed further from the current price, while in calmer markets, it will be closer.
Stop-Loss Placement
Stop-loss levels are calculated using the ATR multiplier to ensure adaptive risk management. For long trades: 'Entry Price - (ATR Value × ATR Multiplier)'. For short trades: 'Entry Price + (ATR Value × ATR Multiplier)'.
This adaptive approach to stop-loss placement means that in volatile markets, stops are wider to avoid being stopped out by normal price fluctuations, while in quieter markets, stops are tighter to limit potential losses. The default multiplier of 1.5 provides approximately 1.5 times the average true range of protection.
Target Price Calculation
Profit targets are determined by the reward-to-risk ratio: 'Entry Price + (ATR Stop Distance × RR Ratio)' for long trades and 'Entry Price - (ATR Stop Distance × RR Ratio)' for short trades. The default ratio of 2.0 means the target is twice the distance of the stop-loss, providing a favorable risk-reward profile.
New York Session Tracking
The indicator includes specialized logic for tracking the New York session open price. When a new NY session begins (determined by the 'isNewNySession' variable), the current open price is recorded and maintained throughout the session. This provides a reference point for measuring intraday directional bias from the session's starting level.
INFORMATION TABLES
Indicators Table
This table displays the current price, VWAP value, NY session open price, support level,resistance level, ATR, ATR-scaled stop distance, current trend classification, momentum state with RSI value, and breakout status. All values are color-coded based on their bullish or bearish implications. The VWAP cell is color-coded green if price is above VWAP (bullish) and red if below (bearish), providing instant visual confirmation of price's position relative to this critical level.
Trade Levels Table
This table shows current signal status (LONG, SHORT, or WAIT), limit order distance in ATR units, calculated limit order price, stop-loss level, and target price with the reward-to-risk ratio displayed. The signal cell is highlighted in green for long signals and red for short signals.
ALERT CONDITIONS
The indicator includes four alert conditions that can be configured in TradingView:
1.
LONG Signal: Triggers when a long signal is generated, providing entry price, stop-loss, and target information.
2.
SHORT Signal: Triggers when a short signal is generated with corresponding trade details.
3.
Breakout Up: Notifies when price breaks out above resistance level.
4.
Breakout Down: Notifies when price breaks down below support level.
These alerts enable traders to receive notifications via TradingView's alert system without continuously monitoring the charts.
USAGE EXAMPLES AND TRADING SCENARIOS
Strong Bullish Trend with VWAP Support
In this scenario, price has been trading above the 9-period EMA for multiple bars, confirming a bullish trend. The current price is above VWAP, indicating buyers are willing to pay a premium. A recent swing low has established a support level, and RSI is reading 65, indicating building momentum without being overextended. When price breaks above the recent swing high resistance with a 2% tolerance, the indicator generates a long signal. The trader places a limit order below the current bar's close (0.5 ATR units) and sets the stop-loss 1.5 ATR units below the entry, with a target 2.0 times the stop distance away.
Short Setup During Volatile Session
During a particularly volatile NY session, price gaps down below VWAP early in the day. The 9-period EMA is declining, and both current and previous bars are below it, confirming a bearish trend. The RSI has dropped to 28, indicating strong bearish momentum. A recent swing high serves as resistance, and when price breaks below the swing low support level, the indicator generates a short signal. The trader enters on a limit order placed 0.5 ATR units above the current price, with the stop-loss 1.5 ATR units above the entry and the target at a 2.0 reward-to-risk ratio.
Avoiding Counter-Trend Trades
Consider a scenario where price is above VWAP and the RSI reads 72 (overbought), but the price is below the 9-period EMA and the previous bar was also below the EMA. In this case, the trend is classified as BEARISH (or SIDEWAYS) despite the bullish price position relative to VWAP. The indicator will not generate a long signal because the trend condition is not met, protecting the trader from what could be a bear trap or continuation pattern.
No Prior Levels Scenario
At the beginning of a trading session or after significant volatility has cleared prior swing points, there may be no established support or resistance levels in the lookback window. In this case, the breakout condition 'or na(resistanceLevel)' allows long signals to be generated without requiring a resistance level to be broken, enabling traders to participate in emerging trends without waiting for prior levels to form.
BEST PRACTICES AND TIPS
Timeframe Selection
This indicator is optimized for intraday timeframes (1-minute to 60-minute charts) and specifically for NY session trading. Higher timeframes may produce more reliable signals but fewer opportunities, while lower timeframes will generate more signals but with potentially lower reliability. Traders should backtest on their preferred timeframe before trading live.
Market Conditions
The indicator performs best in trending markets with clear directional bias. During ranging or sideways markets, the trend condition may oscillate frequently, and VWAP may oscillate around price, reducing signal quality. Consider filtering signals or reducing position size during low-volatility, range-bound conditions.
Parameter Optimization
While the default parameters have been selected for general applicability, traders should consider optimizing certain parameters for specific markets or instruments. For highly volatile instruments like crude oil or natural gas, increasing the 'atrMultiplier' to 2.0 or 2.5 may provide more appropriate risk management. For less volatile instruments like certain forex pairs, reducing the multiplier to 1.0 or 1.2 may improve signal quality.
Multiple Timeframe Analysis
For enhanced performance, traders can analyze the trend on a higher timeframe (such as 15-minute or hourly) while taking signals on a lower timeframe (such as 5-minute or 1-minute). This multi-timeframe approach ensures that signals are aligned with the larger trend direction.
Risk Management
While the indicator provides calculated stop-loss levels, traders should consider their overall position sizing and portfolio risk. The ATR-based stops provide a market-adaptive approach, but individual risk tolerance and account size should ultimately determine position sizing. The 2.0 reward-to-risk ratio is fixed but can be adjusted based on personal preferences or the specific characteristics of the instrument being traded.
INTEGRATION WITH TRADINGVIEW
Adding the Indicator
To add this indicator to a TradingView chart, paste the code into the Pine Script editor and click "Add to Chart." The indicator will appear in the chart's sidebar and begin calculating immediately once sufficient historical data is available.
Configuring Alerts
To set up alerts, right-click on any of the alert conditions in the indicator's settings panel (long signal, short signal, breakout up, or breakout down) and select "Add Alert." Configure the alert frequency and notification methods (push notification, email, webhook, etc.) according to your preferences.
Customization
All input parameters can be adjusted through the indicator's settings panel without modifying the source code. Traders can experiment with different VWAP sources, ATR lengths and multipliers, swing detection parameters, and table display options to suit their trading style and market preferences.
LIMITATIONS AND CONSIDERATIONS
Session Dependency
The indicator is specifically designed for NY session trading and will not generate signals outside these hours. Traders focused on other sessions or 24-hour markets may need to modify the session string to match their trading hours.
Historical Data Requirements
The indicator requires sufficient historical data to accurately calculate swing points and support/resistance levels. On lower timeframe charts with limited history, the initial signals may be less reliable until adequate swing points are identified.
Lag in Swing Detection
By definition, swing points are confirmed after the price has moved away from them, introducing some lag into support/resistance identification. Traders should be aware that the most recent swing point may not be confirmed until several bars after it occurs.
Not Financial Advice
This indicator is a technical analysis tool and should not be construed as financial advice. Traders are responsible for their own research and risk management decisions. Past performance of any trading system does not guarantee future results.
SUMMARY
The code follows a logical flow:
•
Version and Declaration: Pine Script version 6 indicator declaration with overlay enabled
•
Input Parameters: All user-configurable settings grouped by category
•
Session Logic: New York session tracking and open price recording
•
Core Calculations: VWAP, ATR, EMA, RSI, swing points
•
Support/Resistance Logic: Array-based storage and retrieval of swing levels
•
Trend and Momentum Classification: Categorization of current market state
•
Signal Generation: Confluence-based long and short conditions
•
Trade Level Calculations: Entry, stop-loss, and target pricing
•
Visual Plots: Hidden plots for alert data access
•
Information Tables: Real-time display of key values
•
Alert Conditions: Four configurable alert triggers
This structured approach ensures clarity, maintainability, and extensibility for future modifications or enhancements.

Liquidity Gravity Engine [Pineify]```markdown
Liquidity Gravity Engine - Market Structure, Displacement, Liquidity Rails
Overview
Liquidity Gravity Engine is a market structure + liquidity visualization indicator designed to help you read flow , impulse , and liquidity magnets on any symbol and timeframe. Instead of relying on a single moving average, it builds a dynamic “flow ribbon” from confirmed swing structure, highlights displacement candles that create imbalance (FVG-style gaps), and projects unmitigated swing levels as liquidity rails that price often revisits.
Key Features
Liquid Flow Ribbon: a structure-based dynamic band that adapts to volatility.
Displacement Highlighting: flags momentum candles that expand beyond ATR and form an imbalance.
Liquidity Rails: extends unmitigated swing highs/lows as potential targets until swept.
Trend Context: displacement is filtered using the ribbon’s smoothed centerline.
How It Works
Market Structure (Swings) : swing highs/lows are detected using pivot logic over your “Structure Lookback”. Pivots become confirmed only after the lookback window completes, which means historical swing points can update until they are confirmed.
Flow Construction : the most recent confirmed swing high and swing low define a top and bottom boundary. Their midpoint is then smoothed with an EMA to create the “liquid” centerline.
Displacement + Imbalance : a candle is considered displacement when its range expands beyond ATR(14) × Displacement Factor and it creates a simple FVG-style gap (current low above the high two bars back for bullish, or current high below the low two bars back for bearish). The bar is then filtered by being on the correct side of the smoothed flow center.
Liquidity Rails : each new confirmed swing high/low can become a dotted rail. Rails extend forward and are removed once price sweeps beyond the level (mitigation), keeping the chart focused on active liquidity.
Trading Ideas and Insights
Use the ribbon as context : bias is stronger when price holds one side of the flow centerline.
Treat displacement markers as impulse confirmation : they often appear at breakout moments or at the start of expansions.
Use liquidity rails as magnets : unmitigated swing highs/lows can act as targets for continuation or mean-reversion moves.
Combine structure + displacement: a sweep into a rail followed by an opposite displacement can hint at a reversal attempt.
How Multiple Components Work Together
This indicator is intentionally built as a single liquidity-driven workflow:
Swings define structure.
Structure defines the flow ribbon (trend/volatility context).
The ribbon filters displacement so you see momentum that aligns with flow.
Liquidity rails provide objective target zones derived from the same swing structure.
The result is a cohesive view of market structure flow, institutional-style displacement, and liquidity targets without stacking multiple separate indicators.
Unique Aspects
Structure-first ribbon: the band is anchored to confirmed swing points, not just a price average.
Imbalance-aware displacement: requires both range expansion and a gap-style condition, reducing generic “big candle” noise.
Self-cleaning liquidity rails: mitigated levels are removed to keep the chart readable.
How to Use
Start with defaults on a clean chart.
Identify the flow: price above the smoothed centerline favors bullish flow; below favors bearish flow.
Watch for displacement diamonds (“D”): they often validate a push away from structure and can mark the start of a leg.
Plan around rails: treat dotted lines as potential objectives and areas where reactions/sweeps can occur.
Customization
Structure Lookback : smaller values = more sensitive swings; larger values = cleaner, slower structure.
Displacement Factor : higher values = fewer, stronger displacement bars; lower values = more signals.
Show Liquidity Rails + Liquidity Lookback : control whether rails are plotted and how active levels are emphasized.
Visuals : adjust bullish/bearish flow colors and liquidity line styling for your chart theme.
Conclusion
Liquidity Gravity Engine helps you map market structure, highlight displacement and imbalance (FVG-style) momentum, and visualize liquidity targets with rails that stay relevant until swept. Use it for trend context, breakout confirmation, and liquidity-based trade planning on forex, crypto, stocks, and indices.

Adaptive Market Structure Channel By S B PrasadAdaptive Market Structure Channel (AMSC)
Institutional-Grade Trend, Volatility & Liquidity Framework
Overview
The Adaptive Market Structure Channel (AMSC) is a multi-engine, adaptive trading framework designed to read market structure, volatility, liquidity, and trend strength in real time.
It integrates ATR-based channels, pivot structure, supply–demand zones, liquidity sweeps, multi-factor momentum, and higher-timeframe confirmation into a single, coherent visual system.
AMSC is not a single-indicator strategy.
It is a context-driven decision framework intended to help traders align entries with dominant trend, structural levels, and institutional activity.
Core Components
1️⃣ Adaptive ATR Trend Channel
Dynamic ATR-based support & resistance
Automatically adjusts to volatility
Color-coded trend strength (strong / weak regimes)
Acts as the primary trend bias filter
2️⃣ Pivot-Based ATR Trend Channels
Channels built from confirmed pivot highs and lows
ATR-expanded structure, not fixed slopes
Separates impulse moves from corrections
Useful for trend continuation and pullback trades
3️⃣ Market Structure: Supply & Demand Zones
Automatically plots fresh demand and supply zones
Zones extend forward until violated
Helps identify high-probability reaction areas
Used as a location filter, not a standalone signal
4️⃣ Liquidity Sweep Detection (Smart Money Logic)
Identifies equal high / equal low liquidity pools
Detects stop-hunt style sweeps
Validates sweeps only when price reacts from structure zones
Prevents chasing false breakouts
5️⃣ Multi-Factor Trend Confirmation Engine
Combines:
EMA structure
MACD momentum
RSI regime
VWAP positioning
Optional ribbon & HMA filters
Signals are generated only when a majority of factors align, avoiding single-indicator bias.
6️⃣ Volatility Context (Bollinger Bands)
Provides volatility expansion / contraction context
Helps distinguish trend continuation vs compression
Works as a background regime filter
7️⃣ Higher Timeframe Confirmation
Confirms trend using a user-selected HTF
Prevents counter-trend trades during strong HTF bias
Essential for intraday and swing traders
8️⃣ Session-Aware Trading
Optional India, London, and New York session filters
Signals only during active market participation
Avoids low-liquidity false signals
9️⃣ Professional Dashboard
Real-time display of:
Trend direction
Trend strength
Factor alignment
HTF bias
Active zone
Trade signal
Session status
Designed for quick decision-making, not clutter.
How to Use AMSC (Best Practice)
✔ Trade in the direction of the ATR trend
✔ Enter near demand/supply within the channel
✔ Confirm with factor alignment & HTF bias
✔ Use liquidity sweeps as entry triggers, not signals alone
✔ Avoid trades during low-strength or inactive sessions
AMSC performs best when used as a confluence system, not a mechanical entry-exit robot.
Ideal Use Cases
Intraday index trading
Swing trading in trending markets
Futures & FX structure-based trading
Traders who prefer context over indicators
What AMSC Is NOT
❌ Not a scalping toy
❌ Not a repainting indicator
❌ Not a one-click signal generator
It is built for disciplined traders who understand structure and risk.
Final Note
AMSC is designed to think like the market, not predict it.
Use it to read conditions, not chase signals.
MSC — BEST CLEAN SETUP (RECOMMENDED)
🎯 Design Philosophy
“Context first, signals last.”
The goal is to:
Read trend & structure at a glance
Avoid indicator overload
Let price + zones + channel do the heavy lifting
1️⃣ CORE VISUALS (KEEP ON)
These are non-negotiable.
🔹 Adaptive ATR Trend Channel
✅ ON
Primary trend bias
Use ATR Trendline Color = ON
This alone defines:
Bull vs Bear
Strength vs weakness
👉 If price is above channel → bullish context
👉 If price is below channel → bearish context
🔹 Pivot ATR Trend Channel
✅ ON
Channel fill: ON
Transparency ≥ 85
Purpose:
Visualise trend slope
Spot pullbacks inside trend
👉 Treat channel edges as dynamic structure, not entry signals.
🔹 Supply & Demand Zones
✅ ON
Transparency: 80–85
Zones auto-expire visually when violated
👉 These are your only horizontal levels.
2️⃣ SMART FILTERS (SELECTIVE)
💧 Liquidity Sweep
✅ ON
Lookback: 5
Tolerance: 0.15 ATR
👉 Use sweeps only near zones
❌ Ignore sweeps in the middle of nowhere
⏱ Session Filter
✅ ON
Trade only one session
India (for NSE)
London (for FX)
New York (for US indices)
❌ Do NOT enable multiple sessions simultaneously
🔍 Higher Timeframe (HTF)
✅ ON
Intraday: Daily
Swing: Weekly
👉 If HTF disagrees → no trade
3️⃣ WHAT TO TURN OFF (CRITICAL)
This is where clutter dies.
❌ Bollinger Bands
🚫 OFF by default
Use only when studying volatility compression
Otherwise adds visual noise
❌ Full ATR Channel (Ver 15)
🚫 OFF
Redundant with pivot + ATR trend
Keep only one channel logic
❌ SuperTrend Channel
🚫 OFF
ATR Trend Channel already covers this
❌ Pivot Levels (P, R1, S1…)
🚫 OFF
Zones replace static pivots
Too many horizontal lines = paralysis
❌ Previous Day / Week Levels
🚫 OFF
Turn ON only for index option trading
Otherwise clutter
4️⃣ MOVING AVERAGES (STRICT RULE)
Keep ONLY:
EMA Fast (9)
EMA Slow (21)
Optional:
HMA → ON only for scalping
❌ Do NOT stack multiple MAs visually
5️⃣ DASHBOARD (MINIMAL MODE)
🧭 Dashboard
✅ ON
Position: Top Right
Text Size: Small
Watch only:
Trend
Strength
HTF
Zone
Signal
Ignore factor numbers once confidence develops.
6️⃣ SIGNAL USAGE (DISCIPLINE RULE)
✔ Signal must appear inside a zone
✔ Signal must align with trend & HTF
✔ Signal must be during session
❌ Never take:
Signals mid-channel
Signals against HTF
Signals during flat strength (<30%)
7️⃣ RECOMMENDED PRESETS (COPY THIS)
🔹 Intraday (Clean)
Timeframe: 5m / 15m
HTF: Daily
Session: India / NY
BB: OFF
Full ATR: OFF
SuperTrend: OFF
Pivots: OFF
🔹 Swing (Ultra Clean)
Timeframe: 1H / 4H
HTF: Weekly
Liquidity: ON
Zones: ON
Dashboard: ON (small)
8️⃣ GOLDEN RULE (MOST IMPORTANT)
If you cannot explain the trade using only:
Trend channel
One zone
One sweep
Do not trade it.
🏁 FINAL VERDICT
AMSC is not cluttered by design.
Clutter comes from turning everything ON.
Used correctly:
The chart stays clean
Decisions become obvious
Overtrading disappears
AMSC – TRADE EXECUTION RULEBOOK
Framework rule:
Trend → Structure → Liquidity → Entry → Risk → Exit
1️⃣ MARKET PRE-CONDITIONS (MANDATORY)
❌ NO TRADE unless ALL are TRUE
✅ Trend Filter
ATR Trend Channel = Bull for longs / Bear for shorts
Trend strength ≥ 40%
Price must be on the correct side of the channel
✅ HTF Confirmation
HTF bias must match LTF trend
If HTF is neutral → NO TRADE
✅ Session Filter
Trade only during active session
No first 5 minutes after session open
No last 15 minutes before session close
2️⃣ LOCATION RULE (MOST IMPORTANT)
🔹 Long Trades
Price must be inside or just above a DEMAND zone
Zone must be:
Fresh (not tested more than twice)
Within the Pivot ATR Channel
🔹 Short Trades
Price must be inside or just below a SUPPLY zone
Same freshness rules apply
❌ No zone → no trade
3️⃣ LIQUIDITY CONFIRMATION (ENTRY TRIGGER)
🔹 Long Entry Trigger
At the demand zone, you must see:
✔ Sell-side liquidity sweep
✔ Sweep candle closes bullish
✔ Sweep occurs inside the zone
🔹 Short Entry Trigger
At the supply zone, you must see:
✔ Buy-side liquidity sweep
✔ Sweep candle closes bearish
✔ Sweep occurs inside the zone
4️⃣ ENTRY RULE (EXECUTION)
🔵 LONG ENTRY
Enter BUY when all conditions align and:
Enter at:
Close of the sweep candle OR
50% retrace of the sweep candle (preferred)
🔴 SHORT ENTRY
Enter SELL when:
Enter at:
Close of the sweep candle OR
50% retrace of the sweep candle
5️⃣ STOP-LOSS RULES (NON-NEGOTIABLE)
🔻 Long SL
Place SL at:
Lowest point of the demand zone
OR
Below sweep low − 0.1 ATR (whichever is lower)
🔺 Short SL
Place SL at:
Highest point of the supply zone
OR
Above sweep high + 0.1 ATR (whichever is higher)
❌ Never trail SL early
❌ Never move SL to break-even before partial exit
6️⃣ POSITION SIZE (FIXED RISK ONLY)
Risk per trade: 0.5% – 1% max
If SL distance is large → reduce position size
Do not widen SL to fit position
7️⃣ EXIT RULES (STRUCTURED)
🎯 TARGET 1 (T1 – Protection)
At 1R
Action:
Book 50%
Move SL to Break-Even
🎯 TARGET 2 (T2 – Structure)
Next opposite zone
OR
Pivot ATR Channel mid-line
Book 30%
🎯 FINAL EXIT (TREND FOLLOW)
Exit remaining 20% when:
✔ Opposite liquidity sweep occurs
✔ Price closes beyond Pivot ATR Channel
✔ HTF bias flips
✔ Session ends
8️⃣ NO-TRADE CONDITIONS (ABSOLUTE)
❌ Trend strength < 30%
❌ Zone already tested 3+ times
❌ Liquidity sweep outside zone
❌ Entry candle is oversized (>1.8 ATR)
❌ Trade against HTF
❌ Emotional or revenge trade
9️⃣ ONE-SCREEN TRADE CHECKLIST
Before clicking BUY/SELL:
✔ Trend aligned
✔ HTF aligned
✔ In session
✔ At zone
✔ Sweep confirmed
✔ SL defined
✔ R ≥ 2 possible
If any answer = NO → skip trade
🔒 DISCIPLINE STATEMENT (PRINT THIS)
AMSC does not pay for activity.
It pays for patience, location, and discipline.
🏁 EXPECTED PERFORMANCE (REALISTIC)
Win rate: 45–60%
R:R average: 1:2.5 to 1:4
Drawdown: low
Trade frequency: selective
Adaptive Market Structure Channel — Visual Layout
5
🧭 How to READ the Chart (Left → Right)
1️⃣ Core Trend Context (FIRST thing your eyes see)
ATR Trend Channel
Acts as dynamic support/resistance
Green = bullish regime
Red = bearish regime
No second trendline competing with it
👉 If price is on the wrong side → no trade
2️⃣ Pivot ATR Structure Channel (SECOND layer)
Sloping channel following real swing structure
Shows:
Trend acceleration
Healthy pullbacks
Channel fill is very light (high transparency)
👉 Pullbacks inside this channel are valid
👉 Breaks outside = caution / exit
3️⃣ Supply & Demand Zones (ONLY horizontal objects)
Few, wide, soft-colored zones
No pivot clutter, no fibs, no grids
👉 Trades happen only here
4️⃣ Liquidity Sweep Markers (EVENT-BASED)
Appears only near zones
Indicates stop-hunt, not entry by itself
👉 Sweep + zone + trend = setup
👉 Sweep alone = ignore
5️⃣ Dashboard (Decision Support, not distraction)
Small
Corner-placed
Shows only:
Trend
Strength
HTF bias
Zone
Signal
Session
👉 After experience, you’ll barely look at it
🚫 What You DO NOT See (Very Important)
A clean AMSC chart intentionally avoids:
Multiple moving averages
Pivot levels (P/R/S)
Too many channels
Oscillator panels
Bright fills or thick lines
If your chart looks “busy”, something is ON that should be OFF.
🧠 Mental Model (Keep This Image in Mind)
AMSC chart =
1 dynamic trend
1 structure channel
1 zone
1 liquidity event
1 decision
Anything more → clutter
Anything less → blind trading
✅ Final Visual Checklist (Before Trading)
✔ Chart background visible
✔ Candles clearly readable
✔ Zones visible but not loud
✔ Channel guides the eye
✔ Nothing overlaps price excessively
If yes → you are trading AMSC correctly

MRG VWAP CompleteMRG VWAP Complete - Indicator Description
📊 Overview
MRG VWAP Complete is a professional all-in-one VWAP indicator that combines two powerful volume-weighted average price tools into a single, highly customizable solution. This indicator provides traders with both anchored VWAP with deviation bands and a weekly VWAP that resets every Sunday, offering comprehensive price analysis across multiple timeframes.
🎯 Key Features
Dual VWAP System
Standard VWAP: Highly configurable with multiple anchor periods and deviation bands
Weekly VWAP: Automatically resets every Sunday for swing trading strategies
Option to display both simultaneously or independently
Standard VWAP Capabilities
Multiple Anchor Periods:
Session (Daily)
Week / Month / Quarter / Year
Decade / Century
Corporate Events: Earnings / Dividends / Splits
Customizable Parameters:
Source selection (HLC3, Close, Open, etc.)
Hide on 1D timeframes and above
Offset adjustment
Custom color and line thickness (1-5)
Advanced Deviation Bands System
Three Independent Band Levels:
Each band can be enabled/disabled individually
Customizable multipliers for each level
Independent color selection for each band
Optional fill toggle for each band
Two Calculation Modes:
Standard Deviation: Traditional statistical approach
Percentage: Distance calculated as percentage of VWAP value
Visual Customization:
✅ Enable/disable band fills independently
🎨 Choose any color for each band
📏 Transparent fills (95% opacity) for clear price action visibility
🎯 Clean chart display with only desired elements
Weekly VWAP Features
Resets automatically every Sunday
Customizable source input
Independent color and line width settings
Perfect for identifying weekly trends and key levels
⚙️ Complete Parameter List
Display Options
Show/Hide Standard VWAP
Show/Hide Weekly VWAP
Standard VWAP Settings
Anchor Period selection
Source selection
Hide on 1D or above option
Offset value
VWAP color
VWAP line width (1-5)
Bands Settings
Calculation mode (Standard Deviation / Percentage)
Band #1: Enable, Multiplier, Color, Fill toggle
Band #2: Enable, Multiplier, Color, Fill toggle
Band #3: Enable, Multiplier, Color, Fill toggle
Weekly VWAP Settings
Weekly VWAP color
Weekly VWAP line width (1-5)
Source selection
📈 Strategic Applications
Mean Reversion Trading
Use deviation bands to identify overbought/oversold conditions
Enter trades when price reaches outer bands
Target VWAP for exits
Trend Confirmation
Price above VWAP = Bullish bias
Price below VWAP = Bearish bias
Weekly VWAP confirms longer-term trend direction
Support & Resistance
VWAP acts as dynamic support/resistance
Deviation bands provide multiple levels for entries/exits
Weekly VWAP identifies major swing levels
Multi-Timeframe Analysis
Combine Standard VWAP (intraday) with Weekly VWAP (swing)
Identify confluence zones where both VWAPs align
Spot divergences between short-term and weekly trends
Breakout Trading
Monitor price action around VWAP levels
Trade breakouts through deviation bands
Weekly VWAP breaks signal strong momentum
💡 Advantages
✨ All-in-One Solution: No need for multiple VWAP indicators
⏱️ Time-Saving: Pre-configured with professional settings
🎯 Precision: Multiple anchor periods for different trading styles
🎨 Fully Customizable: Every visual element can be adjusted
📊 Clean Charts: Toggle fills on/off for optimal visualization
🔄 Automatic Updates: Both VWAPs update in real-time
📱 Universal: Works on all timeframes and instruments
🎓 Ideal For
Trading Styles
Day Trading (M1, M5, M15)
Swing Trading (H1, H4, D1)
Scalping strategies
Position trading
Markets
Forex (XAUUSD, EUR/USD, GBP/USD, etc.)
Indices (US30, NAS100, SPX500)
Cryptocurrencies
Commodities
Stocks
Strategies
VWAP mean reversion
Trend following
Breakout trading
Volume-weighted support/resistance
Institutional order flow analysis
🔧 Recommended Settings
For Day Trading (M5-M15)
Standard VWAP: Anchor = Session
Band #1: Multiplier 1.0, Fill ON
Band #2: Multiplier 2.0, Fill OFF
Weekly VWAP: Enabled for major levels
For Swing Trading (H1-H4)
Standard VWAP: Anchor = Week
Band #1: Multiplier 1.5, Fill ON
Band #2: Multiplier 2.5, Fill ON
Weekly VWAP: Primary level for trend confirmation
For Scalping (M1-M5)
Standard VWAP: Anchor = Session
Band #1: Multiplier 0.5, Fill ON
Band #2: Multiplier 1.0, Fill OFF
Weekly VWAP: Disabled for cleaner chart
📊 Understanding the Bands
Band Multiplier = 1.0
Contains ~68% of price action (1 standard deviation)
Primary mean reversion zone
Band Multiplier = 2.0
Contains ~95% of price action (2 standard deviations)
Strong overbought/oversold signal
Band Multiplier = 3.0
Contains ~99.7% of price action (3 standard deviations)
Extreme reversal zones
🎯 Trading Tips
Confluence Trading: Enter when price touches a deviation band AND Weekly VWAP
Trend Confirmation: Only take long trades above both VWAPs, shorts below both
Band Rejection: Watch for candle rejections at outer bands for reversal signals
Volume Confirmation: Strong moves should break bands with high volume
Time of Day: VWAP is most reliable during high-volume sessions
📌 Important Notes
VWAP resets based on anchor period selection
Weekly VWAP uses Sunday as the start of the week
Deviation bands require sufficient volume data
Best used in combination with other technical analysis tools
Not a standalone trading system - use proper risk management
🚀 Why Choose MRG VWAP Complete?
✅ Professional Grade: Used by institutional traders
✅ Maximum Flexibility: Adapt to any trading style
✅ Visual Clarity: Customizable colors and fills
✅ Dual Perspective: Intraday + weekly analysis combined
✅ Easy to Use: Intuitive parameter organization
✅ Performance Optimized: Efficient code for smooth charting
Master volume-weighted price analysis with the most complete VWAP indicator available! 📊🚀
💼 Perfect For Professional Traders
Whether you're a retail trader or institutional analyst, MRG VWAP Complete provides the tools you need to:
Identify fair value zones
Spot institutional order flow
Time entries with precision
Manage risk effectively
Trade with the smart money
Elevate your VWAP trading to the next level! 💎

Apex Wallet - Ultimate Multi-Oscillator (9-in-1) & Market TrendThe Apex Wallet Multi-Oscillator is a powerful "All-in-One" technical analysis tool designed to clean up your charts by combining nine of the most effective momentum and trend indicators into a single workspace. This script is engineered to adapt to different trading styles—Scalping, Day-Trading, or Swing-Trading—with a single click.
+4
Whether you are looking for trend exhaustion, momentum shifts, or volatility breakouts, this indicator provides a clear, visual summary of market dynamics.
+1
Key Features
9 Indicators in 1: Access RSI, Stochastic, StochRSI, MACD, Zero-Lag MACD, Andean Oscillator, and the Traders Dynamic Index (TDI).
+1
Smart Layout Modes:
Raw (Brut): Classic view with original values.
+1
Stacked (Empilé): Organizes indicators into fixed vertical zones to prevent overlapping.
+1
Proportional Stacking: Automatically calculates and adjusts the height of blocks based on active oscillators.
+2
Trading Presets: Switch between Scalping, Day-Trading, and Swing-Trading modes. The script automatically adjusts periods and lengths (e.g., RSI 7 for Scalping vs. 21 for Swing) to match the market speed.
+3
Included Oscillators
Stochastic & RSI: Standard momentum tools with color-coded signals.
Traders Dynamic Index (TDI): A full suite including the RSI Price Line, Signal Line, and Market Base Line with optional Bollinger Bandwidth columns.
+1
MACD & Zero-Lag MACD: Includes histogram fills and trend-colored lines for faster reaction to price movement.
+2
Andean Oscillator: An advanced tool to identify Bull/Bear dominance and market "Range" or "Reversal" states.
Visual Signals & Alerts
Market Trend: Optional visual coloring based on indicator crosses to quickly spot bullish or bearish momentum.
+3
Customizable UI: High-fidelity rendering with dashed levels and proportional fills for a professional, clean interface.
+1
Integrated Alerts: Pre-configured alerts for Andean Oscillator trend changes (Bullish, Bearish, or Reversal).
How to use
Select your Trading Mode in the settings based on your timeframe.
Toggle the indicators you want to see.
Use the Stacked mode if you want to keep your sub-window organized without lines crossing each other.

Apex Wallet - Ultimate Trading Suite: All-In-One Overlay & SignaOverview The Apex Wallet All-In-One is a comprehensive professional trading toolkit designed to centralize every essential technical analysis tool directly onto your main price chart. Instead of cluttering your workspace with dozens of separate indicators, this script integrates trend analysis, volatility bands, automated chart patterns, and a multi-indicator signal engine into a single, cohesive interface.
Key Modular Features:
Trend Core: Features dynamic trend curves, cloud fills for momentum visualization, and a multi-timeframe dashboard (1m to 4h) to ensure you are always trading with the higher-timeframe bias.
Automated Chart Structures: Automatically detects and plots Support/Resistance levels, Standard Pivot Points, Market Gaps, and Fair Value Gaps (Imbalances).
Volatility & Volume: Includes professional-grade VWAP with standard deviation bands, Bollinger Bands, and a built-in Volume Delta (Raw/Net) tracker.
Signal Engine: A powerful cross-logic system that generates entry signals based on RSI (QQE), MACD (Zero-cross & Relance), Stochastic, TDI, and the Andean Oscillator.
Predictive Projections: A unique feature that projects current indicator slopes into future candles to help anticipate potential trend continuations or reversals.
Adaptability The script includes three core presets—Scalping, Day-Trading, and Swing-Trading—which automatically adjust all internal periods (Moving Averages, Bollinger, RSI, etc.) to match your specific market speed.
Visual Cleanliness Every feature is toggleable. You can display a "clean" chart with just the Trend Cloud or a "complete" workstation with signals, patterns (Doji, Engulfing), and pivot levels

ZigZag Volume Profile [ChartPrime]⯁ OVERVIEW
ZigZag Volume Profile combines swing structure with volume analytics by plotting a ZigZag of major price swings and overlaying a detailed volume profile around each swing. At the end of each swing, it highlights the Point of Control (POC) — the price level with the highest traded volume — and extends it forward to identify key areas of potential support or resistance.
⯁ KEY FEATURES
ZigZag Swing Detection:
Automatically detects swing highs and lows based on a user-defined length, creating clean visual segments of market structure.
These segments act as boundaries for volume profile calculations.
swingHigh = ta.highest(swingLength)
swingLow = ta.lowest(swingLength)
ZigZag Channel Visualization:
The ZigZag structure is connected with sloped lines, forming a visual “channel” of the price movement.
The ZigZag can optionally, scaled by ATR.
Volume Profile Around Each Swing:
For every completed swing (high to low or low to high), the indicator constructs a full volume profile using user-defined bin counts.
It scans volume across price levels in the swing and plots histogram-style bins using a gradient color to indicate volume magnitude.
Dynamic Bin Width and Slope Adjustment:
Bins are distributed across a vertical ATR-based range, and their width is adjusted based on the percentage of total swing volume.
The volume fill direction is adapted to the swing’s slope for visually aligned plotting.
POC Detection and Extension:
The highest volume bin in each swing is identified as the Point of Control (POC).
This level is plotted with a thicker line and extended horizontally into the future as a key reaction level.
Automatic POC Expiry on Price Interaction:
POC lines are continuously extended unless breached by price.
When price crosses the POC level, the extension is terminated — signaling that the level may have been absorbed.
Clean Volume Bin Visualization:
Bin colors range from green (low volume) to blue (higher volume), with the POC always marked in red by default for easy identification.
Volume percentages are optionally labeled at each bin level.
Flexible Swing Profile Parameters:
Users can control:
Number of volume bins
Bin width
Channel width (ATR factor)
Visibility of the swing channel or POC lines
Efficient Memory Handling:
Old POC lines and volume profiles are automatically removed from memory after a threshold to keep charts clean and performant.
⯁ USAGE
Use ZigZag swings to define market structure visually.
Analyze volume profile around each swing to understand where most trading activity occurred.
Use POC extensions as dynamic support/resistance zones for entries, stops, or take-profits.
Watch for price interaction with extended POC lines — breaks may suggest absorbed liquidity or breakout potential.
Use the ATR-based channel width to adapt profiles based on market volatility.
⯁ CONCLUSION
ZigZag Volume Profile offers a powerful fusion of structure and volume. By plotting detailed volume profiles over each price swing and extending the POC as actionable S/R levels, this tool provides deep insight into market participation zones — giving traders a tactical edge in both ranging and trending environments.

Elliott Wave Rule EngineWhat this tool does
The indicator scans price for two concurrent swing structures—a Small (shorter-degree) and a Large (higher-degree) set—then applies an Elliott/NeoWave rule engine to the most recent 5-swing motive (1-2-3-4-5) or 3-swing corrective (A-B-C). It produces:
Blue lines for Small swings and Orange lines for Large swings.
A rule dashboard (optional) showing PASS/FAIL/WARN for core rules & guidelines.
Buy/Sell labels when (a) a valid motive completes and (b) loop “consensus,” alignment, and scoring gates are satisfied.
Reading the chart
Small swings: thin blue segments, built from your Small settings.
Large swings: thicker orange segments, from your Large settings.
Background tint: faint green when a motive (impulse/diagonal) is valid right now on Small.
Labels (if enabled):
“1…5” or “A-B-C” markers on the latest detected structure.
Buy/Sell label at the last pivot when all gates pass; text may include a score %.
How it works
For both Small and Large degrees the script:
- Loops over all (left, right) combinations you specify (e.g., Small Left = 3..6, Right = 0..0) and calls ta.pivothigh/low.
- Aggregates the results:
- Keeps the most extreme pivot found in the loop (highest high or lowest low) that’s newer than the last accepted swing.
- Gates acceptance by minimum % change versus the last opposite swing (inside the loop) and a post-aggregation filter (Small Minimum swing %, Large Minimum swing %).
- Merges back-to-back same-type swings (HH or LL) by keeping only the more extreme one.
- Keeps only the last N=lookbackWaves swings (default 100).
- Consensus (used for signals) comes from the loop counts:
- sBuyConsensus = small L-count / total-combos (bullish bias)
- sSellConsensus = small H-count / total-combos (bearish bias)
(and the same for Large). This is a data-driven “how many combos agreed” measure.
2) Rule engine (Impulse/Diagonal vs. Corrective)
When there are at least 6 Small swings, the engine tests 1-2-3-4-5:
Hard rules (must pass for an Impulse):
- Wave-2 not > 100% of Wave-1 (no retrace beyond start of W1).
- Wave-3 not the shortest among 1,3,5.
- Wave-4 doesn’t overlap Wave-1 (if it does, structure may be a Diagonal).
- Diagonal eligibility: Rules 1 & 2 pass but Rule 3 fails ⇒ eligible as a Diagonal (
Guidelines (7 checks, count toward a threshold you set):
- W2 retraces a Fib level (within ±fibTol).
- W4 retraces a Fib level (within ±fibTol).
- W3 strongest momentum (speed = |Δprice| / bars).
- Alternation: W2 vs W4 have meaningfully different “sharpness” (price per bar), threshold altSlopeThr.
- Proportion (Price): |W1| and |W3| within propTolP× each other.
- Proportion (Time): W1W3 and W2W4 durations within propTolT×.
- W5 weaker than W3 (momentum divergence proxy).
A Motive is valid if:
- Impulse: all 3 hard rules pass and guideline passes ≥ Min guideline passes.
- Diagonal: diagonal-eligible and guideline passes ≥ Min guideline passes.
- if motive fails, the engine still evaluates ABC as Zigzag and Flat to populate the table:
- Zigzag: B shallower than ~0.618A; C ≈ A or 1.618A (±fibTol).
- Flat: B ≥ ~0.9A; expanded flat if B > 1.0A and C in *A; “running” note if C < A.
3) Signal logic (consensus-gated & scored)
Signals fire only on new Small pivots and only if a Small motive just validated:Direction comes from the motive’s W1 (up = bull, down = bear).
Consensus checks (from the loop):
Use Sell consensus if the last pivot is a High, or Buy consensus if it’s a Low.Require it ≥ Min SMALL loop consensus and ahead of the opposite side by at least Min consensus margin.If you also require Large quality: check the corresponding Large consensus ≥ Min LARGE loop consensus.
Alignment: If Require small/large directional alignment is ON, Small and Large directions must match (or the Large motive must be complete).
Score:
- If Large not required: finalScore = smallConsensus × smallQuality.
- If Large required: finalScore = smallConsensus × smallQuality × largeQuality.
- Need finalScore ≥ Min final score.
When all gates pass, you’ll see “Buy xx%” or “Sell xx%” at the pivot.
Inputs (explained):
- Smaller Wave Swing Detection (Looped)
- Small Left Min / Max (default 3..6): ta.pivot* left widths to scan.
- Small Right Min / Max (default 0..0): right widths to scan (0 = earliest confirmation).
- Small Minimum swing % (post-aggregation) (0.3%): filters out tiny swings after the loop.
- Larger Wave Swing Detection (Looped)
- Large Left Min / Max (100..200) and Right Min/Max (0..0): higher-degree scan (defaults are big; adjust for intraday).
- Large Minimum swing % (post-aggregation) (1.5%).
- Loop Filters (inside the loop)
- Small loop min % change (0.20%): a candidate pivot counts only if move vs. last opposite Small swing ≥ this.
- Large loop min % change (1.50%): same idea for Large.
Rule Engine Tolerances
- Fibonacci tolerance (±%) (0.05 = 5%): closeness to Fib levels.
-Same-degree TIME proportion max (x) (2.00×) and PRICE proportion max (x) (3.00×).
- Alternation slope ratio threshold (0.10): higher = stricter alternation.
- Min guideline passes (0–7) (5): threshold for motive validity.
- Signal Probability (Loop Consensus)
- Min SMALL loop consensus (0.60).
- Min LARGE loop consensus (0.50) (used only if Large validation matters).
- Min consensus margin vs opposite (0.10): e.g., 0.60 vs 0.45 fails (margin 0.15 passes).
Require LARGE 1–5 valid (or diagonal) for signal (off by default).
Min final score (0.20): gate on the composite score.
Annotate label with score % (on).
WARN (orange): guideline not met—pattern can still be valid if total passes ≥ Min guideline passes.
FAQ
Q: Why did I get a diagonal instead of an impulse?
A: Wave-4 overlapped Wave-1 (Rule 3). If Rules 1 & 2 pass and guidelines meet your minimum, it’s eligible as a Diagonal.
Q: Where do Buy/Sell labels come from?
A: Only after a valid Small motive at a new pivot, and only if consensus, alignment, and final score gates pass (per your settings).
Q: It “missed” a wave in hindsight.
A: Pivots require right bars to confirm; extremely tight settings can filter that swing; adjust Small min % or ranges.
Q: Are there repaints?
A: No, It uses standard pivot confirmation; until a pivot is confirmed, recent swings can evolve. After confirmation, lines/labels are stable.
Limitations & disclaimers
Elliott/NeoWave rules are heuristics; markets are messy. Treat outputs as structured context, not certainty.
Consensus is pattern-scan agreement, not probability of profit Not investment advice; always couple with risk management.

TraderDemircan Auto Fibonacci RetracementDescription:
What This Indicator Does:This indicator automatically identifies significant swing high and swing low points within a customizable lookback period and draws comprehensive Fibonacci retracement and extension levels between them. Unlike the manual Fibonacci tool that requires you to constantly redraw levels as price action evolves, this automated version continuously updates the Fibonacci grid based on the most recent major swing points, ensuring you always have current and relevant support/resistance zones displayed on your chart.Key Features:
Automatic Swing Detection: Continuously scans the specified lookback period to find the most significant high and low points, eliminating manual drawing errors
Comprehensive Level Coverage: Plots 16 Fibonacci levels including 7 retracement levels (0.0 to 1.0) and 9 extension levels (1.115 to 3.618)
Top-Down Methodology: Draws from swing high to swing low (right-to-left), following the traditional Fibonacci retracement convention where 100% is at the top
Dual Labeling System: Shows both exact price values and Fibonacci percentages for easy reference
Complete Customization: Individual toggle controls and color selection for each of the 16 levels
Flexible Display Options: Adjust line thickness (1-5), style (solid/dashed/dotted), and extension direction (left/right/both)
Visual Swing Markers: Red diamond at the swing high (starting point) and green diamond at the swing low (ending point)
Optional Trend Line: Connects the two swing points to visualize the overall price movement direction
How It Works:The indicator employs a sophisticated swing point detection algorithm that operates in two stages:Stage 1 - Find the Swing Low (Support Base):
Scans the entire lookback period to identify the lowest low, which becomes the anchor point (0.0 level in traditional retracement terms, though displayed at the bottom of the grid).Stage 2 - Find the Swing High (Resistance Peak):
After identifying the swing low, searches for the highest high that occurred after that low point, establishing the swing range. This creates a valid price movement range for Fibonacci analysis.Fibonacci Calculation Method:
The indicator uses the top-down approach where:
1.0 Level = Swing High (100% retracement, the top)
0.0 Level = Swing Low (0% retracement, the bottom)
Retracement Levels (0.236 to 0.786) = Potential support zones during pullbacks from the high
Extension Levels (1.115 to 3.618) = Potential target zones below the swing low
Formula: Price = SwingHigh - (SwingHigh - SwingLow) × FibonacciLevelThis ensures that 0.0 is at the bottom and extensions (>1.0) plot below the swing low, following standard Fibonacci retracement convention.Fibonacci Levels Explained:Retracement Levels (0.0 - 1.0):
0.0 (Gray): Swing low - the base support level
0.236 (Red): Shallow retracement, first minor support
0.382 (Orange): Moderate retracement, commonly watched support
0.5 (Purple): Psychological midpoint, significant support/resistance
0.618 (Blue - Golden Ratio): The most important retracement level, high-probability reversal zone
0.786 (Cyan): Deep retracement, last defense before full reversal
1.0 (Gray): Swing high - the initial resistance level
Extension Levels (1.115 - 3.618):
1.115 (Green): First extension, minimal downside target
1.272 (Light Green): Minor extension, common profit target
1.414 (Yellow-Green): Square root of 2, mathematical significance
1.618 (Gold - Golden Extension): Primary downside target, most watched extension level
2.0 (Orange-Red): 200% extension, psychological round number
2.382 (Pink): Secondary extension target
2.618 (Purple): Deep extension, major target zone
3.272 (Deep Purple): Extreme extension level
3.618 (Blue): Maximum extension, rare but powerful target
How to Use:For Retracement Trading (Buying Pullbacks in Uptrends):
Wait for price to make a significant move up from swing low to swing high
When price starts pulling back, watch for reactions at key Fibonacci levels
Most common entry zones: 0.382, 0.5, and especially 0.618 (golden ratio)
Enter long positions when price shows reversal signals (candlestick patterns, volume increase) at these levels
Place stop loss below the next Fibonacci level
Target: Return to swing high or higher extension levels
For Extension Trading (Profit Targets):
After price breaks below the swing low (0.0 level), use extensions as profit targets
First target: 1.272 (conservative)
Primary target: 1.618 (golden extension - most commonly reached)
Extended target: 2.618 (for strong trends)
Extreme target: 3.618 (only in powerful trending moves)
For Counter-Trend Trading (Fading Extremes):
When price reaches deep retracements (0.786 or below), look for exhaustion signals
Watch for divergences between price and momentum indicators at these levels
Enter reversal trades with tight stops below the swing low
Target: 0.5 or 0.382 levels on the bounce
For Trend Continuation:
In strong uptrends, shallow retracements (0.236 to 0.382) often hold
Use these as low-risk entry points to join the existing trend
Failure to hold 0.5 suggests weakening momentum
Breaking below 0.618 often indicates trend reversal, not just retracement
Multi-Timeframe Strategy:
Use daily timeframe Fibonacci for major support/resistance zones
Use 4H or 1H Fibonacci for precise entry timing within those zones
Confluence between multiple timeframe Fibonacci levels creates high-probability zones
Example: Daily 0.618 level aligning with 4H 0.5 level = strong support
Settings Guide:Lookback Period (10-500):
Short (20-50): Captures recent swings, more frequent updates, suited for day trading
Medium (50-150): Balanced approach, good for swing trading (default: 100)
Long (150-500): Identifies major market structure, suited for position trading
Higher values = more stable levels but slower to adapt to new trends
Pivot Sensitivity (1-20):
Controls how many candles are required to confirm a swing point
Low (1-5): More sensitive, identifies minor swings (default: 5)
High (10-20): Less sensitive, only major swings qualify
Use higher sensitivity on lower timeframes to filter noise
Individual Level Toggles:
Enable only the levels you actively trade to reduce chart clutter
Common minimalist setup: Show only 0.382, 0.5, 0.618, 1.0, 1.618, 2.618
Comprehensive setup: Enable all levels for maximum information
Visual Customization:
Line Thickness: Thicker lines (3-5) for presentation, thinner (1-2) for trading
Line Style: Solid for primary levels (0.5, 0.618, 1.618), dashed/dotted for secondary
Price Labels: Essential for knowing exact entry/exit prices
Percent Labels: Helpful for quickly identifying which Fibonacci level you're looking at
Extension Direction: Extend right for forward-looking analysis, left for historical context
What Makes This Original:While Fibonacci indicators are common on TradingView, this script's originality comes from:
Intelligent Two-Stage Detection: Unlike simple high/low finders, this uses a sequential approach (find low first, then find the high that occurred after it), ensuring logical price flow representation
Comprehensive Level Set: Includes 16 levels spanning from retracement to extreme extensions, more than most Fibonacci tools
Top-Down Methodology: Properly implements the traditional Fibonacci retracement convention (high to low) rather than the reverse
Automatic Range Validation: Only draws Fibonacci when both swing points are valid and in the correct temporal order
Dual Extension Options: Separate controls for extending lines left (historical context) and right (forward projection)
Smart Label Positioning: Places percentage labels on the left and price labels on the right for clarity
Visual Swing Confirmation: Diamond markers at swing points help users understand why levels are positioned where they are
Important Considerations:
Historical Nature: Fibonacci retracements are based on past price swings; they don't predict future moves, only suggest potential support/resistance
Self-Fulfilling Prophecy: Fibonacci levels work partly because many traders watch them, creating actual support/resistance at those levels
Not All Levels Hold: In strong trends, price may slice through multiple Fibonacci levels without pausing
Context Matters: Fibonacci works best when aligned with other support/resistance (previous highs/lows, moving averages, trendlines)
Volume Confirmation: The most reliable Fibonacci reversals occur with volume spikes at key levels
Dynamic Updates: The levels will redraw as new swing highs/lows form, so don't rely solely on static screenshots
Best Practices:
Don't Trade Blindly: Fibonacci levels are zones, not exact prices. Look for confirmation (candlestick patterns, indicators, volume)
Combine with Price Action: Watch for pin bars, engulfing candles, or doji at key Fibonacci levels
Use Stop Losses: Place stops beyond the next Fibonacci level to give trades room but limit risk
Scale In/Out: Consider entering partial positions at 0.5 and adding more at 0.618 rather than all-in at one level
Check Multiple Timeframes: Daily Fibonacci + 4H Fibonacci convergence = high-probability zone
Respect the 0.618: This golden ratio level is historically the most reliable for reversals
Extensions Need Strong Trends: Don't expect extensions to be hit unless there's clear momentum beyond the swing low
Optimal Timeframes:
Scalping (1-5 minutes): Lookback 20-30, watch 0.382, 0.5, 0.618 only
Day Trading (15m-1H): Lookback 50-100, all retracement levels important
Swing Trading (4H-Daily): Lookback 100-200, focus on 0.5, 0.618, 0.786, and extensions
Position Trading (Daily-Weekly): Lookback 200-500, all levels relevant for long-term planning
Common Fibonacci Trading Mistakes to Avoid:
Wrong Swing Selection: Choosing insignificant swings produces meaningless levels
Premature Entry: Entering as soon as price touches a Fibonacci level without confirmation
Ignoring Trend: Fighting the main trend by buying deep retracements in downtrends
Over-Reliance: Using Fibonacci in isolation without confirming with other technical factors
Static Analysis: Not updating your Fibonacci as market structure evolves
Arbitrary Lookback: Using the same lookback period for all assets and timeframes
Integration with Other Tools:Fibonacci + Moving Averages:
When 0.618 level aligns with 50 or 200 EMA, confluence creates stronger support
Price bouncing from both Fibonacci and MA simultaneously = high-probability trade
Fibonacci + RSI/Stochastic:
Oversold indicators at 0.618 or deeper retracements = strong buy signal
Overbought indicators at swing high (1.0) = potential reversal warning
Fibonacci + Volume Profile:
High-volume nodes aligning with Fibonacci levels create robust support/resistance
Low-volume areas near Fibonacci levels may see rapid price movement through them
Fibonacci + Trendlines:
Fibonacci retracement level + ascending trendline = double support
Breaking both simultaneously confirms trend change
Technical Notes:
Uses ta.lowest() and ta.highest() for efficient swing detection across the lookback period
Implements dynamic line and label arrays for clean redraws without memory leaks
All calculations update in real-time as new bars form
Extension options allow customization without modifying core code
Format.mintick ensures price labels match the symbol's minimum price increment
Tooltip on swing markers shows exact price values for precision

BUZARA// © Buzzara
// =================================
// PLEASE SUPPORT THE TEAM
// =================================
//
// Telegram: t.me
// =================================
//@version=5
VERSION = ' Buzzara2.0'
strategy('ALGOX V6_1_24', shorttitle = '🚀〄 Buzzara2.0 〄🚀'+ VERSION, overlay = true, explicit_plot_zorder = true, pyramiding = 0, default_qty_type = strategy.percent_of_equity, initial_capital = 1000, default_qty_value = 1, calc_on_every_tick = false, process_orders_on_close = true)
G_SCRIPT01 = '■ ' + 'SAIYAN OCC'
//#region ———— <↓↓↓ G_SCRIPT01 ↓↓↓> {
// === INPUTS ===
res = input.timeframe('15', 'TIMEFRAME', group ="NON REPAINT")
useRes = input(true, 'Use Alternate Signals')
intRes = input(10, 'Multiplier for Alernate Signals')
basisType = input.string('ALMA', 'MA Type: ', options= )
basisLen = input.int(50, 'MA Period', minval=1)
offsetSigma = input.int(5, 'Offset for LSMA / Sigma for ALMA', minval=0)
offsetALMA = input.float(2, 'Offset for ALMA', minval=0, step=0.01)
scolor = input(false, 'Show coloured Bars to indicate Trend?')
delayOffset = input.int(0, 'Delay Open/Close MA', minval=0, step=1,
tooltip = 'Forces Non-Repainting')
tradeType = input.string('BOTH', 'What trades should be taken : ',
options = )
//=== /INPUTS ===
h = input(false, 'Signals for Heikin Ashi Candles')
//INDICATOR SETTINGS
swing_length = input.int(10, 'Swing High/Low Length', group = 'Settings', minval = 1, maxval = 50)
history_of_demand_to_keep = input.int(20, 'History To Keep', minval = 5, maxval = 50)
box_width = input.float(2.5, 'Supply/Demand Box Width', group = 'Settings', minval = 1, maxval = 10, step = 0.5)
//INDICATOR VISUAL SETTINGS
show_zigzag = input.bool(false, 'Show Zig Zag', group = 'Visual Settings', inline = '1')
show_price_action_labels = input.bool(false, 'Show Price Action Labels', group = 'Visual Settings', inline = '2')
supply_color = input.color(#00000000, 'Supply', group = 'Visual Settings', inline = '3')
supply_outline_color = input.color(#00000000, 'Outline', group = 'Visual Settings', inline = '3')
demand_color = input.color(#00000000, 'Demand', group = 'Visual Settings', inline = '4')
demand_outline_color = input.color(#00000000, 'Outline', group = 'Visual Settings', inline = '4')
bos_label_color = input.color(#00000000, 'BOS Label', group = 'Visual Settings', inline = '5')
poi_label_color = input.color(#00000000, 'POI Label', group = 'Visual Settings', inline = '7')
poi_border_color = input.color(#00000000, 'POI border', group = 'Visual Settings', inline = '7')
swing_type_color = input.color(#00000000, 'Price Action Label', group = 'Visual Settings', inline = '8')
zigzag_color = input.color(#00000000, 'Zig Zag', group = 'Visual Settings', inline = '9')
//END SETTINGS
// FUNCTION TO ADD NEW AND REMOVE LAST IN ARRAY
f_array_add_pop(array, new_value_to_add) =>
array.unshift(array, new_value_to_add)
array.pop(array)
// FUNCTION SWING H & L LABELS
f_sh_sl_labels(array, swing_type) =>
var string label_text = na
if swing_type == 1
if array.get(array, 0) >= array.get(array, 1)
label_text := 'HH'
else
label_text := 'LH'
label.new(
bar_index - swing_length,
array.get(array,0),
text = label_text,
style = label.style_label_down,
textcolor = swing_type_color,
color = swing_type_color,
size = size.tiny)
else if swing_type == -1
if array.get(array, 0) >= array.get(array, 1)
label_text := 'HL'
else
label_text := 'LL'
label.new(
bar_index - swing_length,
array.get(array,0),
text = label_text,
style = label.style_label_up,
textcolor = swing_type_color,
color = swing_type_color,
size = size.tiny)
// FUNCTION MAKE SURE SUPPLY ISNT OVERLAPPING
f_check_overlapping(new_poi, box_array, atrValue) =>
atr_threshold = atrValue * 2
okay_to_draw = true
for i = 0 to array.size(box_array) - 1
top = box.get_top(array.get(box_array, i))
bottom = box.get_bottom(array.get(box_array, i))
poi = (top + bottom) / 2
upper_boundary = poi + atr_threshold
lower_boundary = poi - atr_threshold
if new_poi >= lower_boundary and new_poi <= upper_boundary
okay_to_draw := false
break
else
okay_to_draw := true
okay_to_draw
// FUNCTION TO DRAW SUPPLY OR DEMAND ZONE
f_supply_demand(value_array, bn_array, box_array, label_array, box_type, atrValue) =>
atr_buffer = atrValue * (box_width / 10)
box_left = array.get(bn_array, 0)
box_right = bar_index
var float box_top = 0.00
var float box_bottom = 0.00
var float poi = 0.00
if box_type == 1
box_top := array.get(value_array, 0)
box_bottom := box_top - atr_buffer
poi := (box_top + box_bottom) / 2
else if box_type == -1
box_bottom := array.get(value_array, 0)
box_top := box_bottom + atr_buffer
poi := (box_top + box_bottom) / 2
okay_to_draw = f_check_overlapping(poi, box_array, atrValue)
// okay_to_draw = true
//delete oldest box, and then create a new box and add it to the array
if box_type == 1 and okay_to_draw
box.delete( array.get(box_array, array.size(box_array) - 1) )
f_array_add_pop(box_array, box.new( left = box_left, top = box_top, right = box_right, bottom = box_bottom, border_color = supply_outline_color,
bgcolor = supply_color, extend = extend.right, text = 'SUPPLY', text_halign = text.align_center, text_valign = text.align_center, text_color = poi_label_color, text_size = size.small, xloc = xloc.bar_index))
box.delete( array.get(label_array, array.size(label_array) - 1) )
f_array_add_pop(label_array, box.new( left = box_left, top = poi, right = box_right, bottom = poi, border_color = poi_border_color,
bgcolor = poi_border_color, extend = extend.right, text = 'POI', text_halign = text.align_left, text_valign = text.align_center, text_color = poi_label_color, text_size = size.small, xloc = xloc.bar_index))
else if box_type == -1 and okay_to_draw
box.delete( array.get(box_array, array.size(box_array) - 1) )
f_array_add_pop(box_array, box.new( left = box_left, top = box_top, right = box_right, bottom = box_bottom, border_color = demand_outline_color,
bgcolor = demand_color, extend = extend.right, text = 'DEMAND', text_halign = text.align_center, text_valign = text.align_center, text_color = poi_label_color, text_size = size.small, xloc = xloc.bar_index))
box.delete( array.get(label_array, array.size(label_array) - 1) )
f_array_add_pop(label_array, box.new( left = box_left, top = poi, right = box_right, bottom = poi, border_color = poi_border_color,
bgcolor = poi_border_color, extend = extend.right, text = 'POI', text_halign = text.align_left, text_valign = text.align_center, text_color = poi_label_color, text_size = size.small, xloc = xloc.bar_index))
// FUNCTION TO CHANGE SUPPLY/DEMAND TO A BOS IF BROKEN
f_sd_to_bos(box_array, bos_array, label_array, zone_type) =>
if zone_type == 1
for i = 0 to array.size(box_array) - 1
level_to_break = box.get_top(array.get(box_array,i))
// if ta.crossover(close, level_to_break)
if close >= level_to_break
copied_box = box.copy(array.get(box_array,i))
f_array_add_pop(bos_array, copied_box)
mid = (box.get_top(array.get(box_array,i)) + box.get_bottom(array.get(box_array,i))) / 2
box.set_top(array.get(bos_array,0), mid)
box.set_bottom(array.get(bos_array,0), mid)
box.set_extend( array.get(bos_array,0), extend.none)
box.set_right( array.get(bos_array,0), bar_index)
box.set_text( array.get(bos_array,0), 'BOS' )
box.set_text_color( array.get(bos_array,0), bos_label_color)
box.set_text_size( array.get(bos_array,0), size.small)
box.set_text_halign( array.get(bos_array,0), text.align_center)
box.set_text_valign( array.get(bos_array,0), text.align_center)
box.delete(array.get(box_array, i))
box.delete(array.get(label_array, i))
if zone_type == -1
for i = 0 to array.size(box_array) - 1
level_to_break = box.get_bottom(array.get(box_array,i))
// if ta.crossunder(close, level_to_break)
if close <= level_to_break
copied_box = box.copy(array.get(box_array,i))
f_array_add_pop(bos_array, copied_box)
mid = (box.get_top(array.get(box_array,i)) + box.get_bottom(array.get(box_array,i))) / 2
box.set_top(array.get(bos_array,0), mid)
box.set_bottom(array.get(bos_array,0), mid)
box.set_extend( array.get(bos_array,0), extend.none)
box.set_right( array.get(bos_array,0), bar_index)
box.set_text( array.get(bos_array,0), 'BOS' )
box.set_text_color( array.get(bos_array,0), bos_label_color)
box.set_text_size( array.get(bos_array,0), size.small)
box.set_text_halign( array.get(bos_array,0), text.align_center)
box.set_text_valign( array.get(bos_array,0), text.align_center)
box.delete(array.get(box_array, i))
box.delete(array.get(label_array, i))
// FUNCTION MANAGE CURRENT BOXES BY CHANGING ENDPOINT
f_extend_box_endpoint(box_array) =>
for i = 0 to array.size(box_array) - 1
box.set_right(array.get(box_array, i), bar_index + 100)
//
stratRes = timeframe.ismonthly ? str.tostring(timeframe.multiplier * intRes, '###M') :
timeframe.isweekly ? str.tostring(timeframe.multiplier * intRes, '###W') :
timeframe.isdaily ? str.tostring(timeframe.multiplier * intRes, '###D') :
timeframe.isintraday ? str.tostring(timeframe.multiplier * intRes, '####') :
'60'
src = h ? request.security(ticker.heikinashi(syminfo.tickerid),
timeframe.period, close, lookahead = barmerge.lookahead_off) : close
// CALCULATE ATR
atrValue = ta.atr(50)
// CALCULATE SWING HIGHS & SWING LOWS
swing_high = ta.pivothigh(high, swing_length, swing_length)
swing_low = ta.pivotlow(low, swing_length, swing_length)
// ARRAYS FOR SWING H/L & BN
var swing_high_values = array.new_float(5,0.00)
var swing_low_values = array.new_float(5,0.00)
var swing_high_bns = array.new_int(5,0)
var swing_low_bns = array.new_int(5,0)
// ARRAYS FOR SUPPLY / DEMAND
var current_supply_box = array.new_box(history_of_demand_to_keep, na)
var current_demand_box = array.new_box(history_of_demand_to_keep, na)
// ARRAYS FOR SUPPLY / DEMAND POI LABELS
var current_supply_poi = array.new_box(history_of_demand_to_keep, na)
var current_demand_poi = array.new_box(history_of_demand_to_keep, na)
// ARRAYS FOR BOS
var supply_bos = array.new_box(5, na)
var demand_bos = array.new_box(5, na)
//END CALCULATIONS
// NEW SWING HIGH
if not na(swing_high)
//MANAGE SWING HIGH VALUES
f_array_add_pop(swing_high_values, swing_high)
f_array_add_pop(swing_high_bns, bar_index )
if show_price_action_labels
f_sh_sl_labels(swing_high_values, 1)
f_supply_demand(swing_high_values, swing_high_bns, current_supply_box, current_supply_poi, 1, atrValue)
// NEW SWING LOW
else if not na(swing_low)
//MANAGE SWING LOW VALUES
f_array_add_pop(swing_low_values, swing_low)
f_array_add_pop(swing_low_bns, bar_index )
if show_price_action_labels
f_sh_sl_labels(swing_low_values, -1)
f_supply_demand(swing_low_values, swing_low_bns, current_demand_box, current_demand_poi, -1, atrValue)
f_sd_to_bos(current_supply_box, supply_bos, current_supply_poi, 1)
f_sd_to_bos(current_demand_box, demand_bos, current_demand_poi, -1)
f_extend_box_endpoint(current_supply_box)
f_extend_box_endpoint(current_demand_box)
channelBal = input.bool(false, "Channel Balance", group = "CHART")
lr_slope(_src, _len) =>
x = 0.0, y = 0.0, x2 = 0.0, xy = 0.0
for i = 0 to _len - 1
val = _src
per = i + 1
x += per
y += val
x2 += per * per
xy += val * per
_slp = (_len * xy - x * y) / (_len * x2 - x * x)
_avg = y / _len
_int = _avg - _slp * x / _len + _slp
lr_dev(_src, _len, _slp, _avg, _int) =>
upDev = 0.0, dnDev = 0.0
val = _int
for j = 0 to _len - 1
price = high - val
if price > upDev
upDev := price
price := val - low
if price > dnDev
dnDev := price
price := _src
val += _slp
//
= ta.kc(close, 80, 10.5)
= ta.kc(close, 80, 9.5)
= ta.kc(close, 80, 8)
= ta.kc(close, 80, 3)
barsL = 10
barsR = 10
pivotHigh = fixnan(ta.pivothigh(barsL, barsR) )
pivotLow = fixnan(ta.pivotlow(barsL, barsR) )
source = close, period = 150
= lr_slope(source, period)
= lr_dev(source, period, s, a, i)
y1 = low - (ta.atr(30) * 2), y1B = low - ta.atr(30)
y2 = high + (ta.atr(30) * 2), y2B = high + ta.atr(30)
x1 = bar_index - period + 1, _y1 = i + s * (period - 1), x2 = bar_index, _y2 = i
//Functions
//Line Style function
get_line_style(style) =>
out = switch style
'???' => line.style_solid
'----' => line.style_dashed
' ' => line.style_dotted
//Function to get order block coordinates
get_coordinates(condition, top, btm, ob_val)=>
var ob_top = array.new_float(0)
var ob_btm = array.new_float(0)
var ob_avg = array.new_float(0)
var ob_left = array.new_int(0)
float ob = na
//Append coordinates to arrays
if condition
avg = math.avg(top, btm)
array.unshift(ob_top, top)
array.unshift(ob_btm, btm)
array.unshift(ob_avg, avg)
ob := ob_val
//Function to remove mitigated order blocks from coordinate arrays
remove_mitigated(ob_top, ob_btm, ob_left, ob_avg, target, bull)=>
mitigated = false
target_array = bull ? ob_btm : ob_top
for element in target_array
idx = array.indexof(target_array, element)
if (bull ? target < element : target > element)
mitigated := true
array.remove(ob_top, idx)
array.remove(ob_btm, idx)
array.remove(ob_avg, idx)
array.remove(ob_left, idx)
mitigated
//Function to set order blocks
set_order_blocks(ob_top, ob_btm, ob_left, ob_avg, ext_last, bg_css, border_css, lvl_css)=>
var ob_box = array.new_box(0)
var ob_lvl = array.new_line(0)
//Global elements
var os = 0
var target_bull = 0.
var target_bear = 0.
// Create non-repainting security function
rp_security(_symbol, _res, _src) =>
request.security(_symbol, _res, _src )
htfHigh = rp_security(syminfo.tickerid, res, high)
htfLow = rp_security(syminfo.tickerid, res, low)
// Main Indicator
// Functions
smoothrng(x, t, m) =>
wper = t * 2 - 1
avrng = ta.ema(math.abs(x - x ), t)
smoothrng = ta.ema(avrng, wper) * m
rngfilt(x, r) =>
rngfilt = x
rngfilt := x > nz(rngfilt ) ? x - r < nz(rngfilt ) ? nz(rngfilt ) : x - r : x + r > nz(rngfilt ) ? nz(rngfilt ) : x + r
percWidth(len, perc) => (ta.highest(len) - ta.lowest(len)) * perc / 100
securityNoRep(sym, res, src) => request.security(sym, res, src, barmerge.gaps_off, barmerge.lookahead_on)
swingPoints(prd) =>
pivHi = ta.pivothigh(prd, prd)
pivLo = ta.pivotlow (prd, prd)
last_pivHi = ta.valuewhen(pivHi, pivHi, 1)
last_pivLo = ta.valuewhen(pivLo, pivLo, 1)
hh = pivHi and pivHi > last_pivHi ? pivHi : na
lh = pivHi and pivHi < last_pivHi ? pivHi : na
hl = pivLo and pivLo > last_pivLo ? pivLo : na
ll = pivLo and pivLo < last_pivLo ? pivLo : na
f_chartTfInMinutes() =>
float _resInMinutes = timeframe.multiplier * (
timeframe.isseconds ? 1 :
timeframe.isminutes ? 1. :
timeframe.isdaily ? 60. * 24 :
timeframe.isweekly ? 60. * 24 * 7 :
timeframe.ismonthly ? 60. * 24 * 30.4375 : na)
f_kc(src, len, sensitivity) =>
basis = ta.sma(src, len)
span = ta.atr(len)
wavetrend(src, chlLen, avgLen) =>
esa = ta.ema(src, chlLen)
d = ta.ema(math.abs(src - esa), chlLen)
ci = (src - esa) / (0.015 * d)
wt1 = ta.ema(ci, avgLen)
wt2 = ta.sma(wt1, 3)
f_top_fractal(_src) => _src < _src and _src < _src and _src > _src and _src > _src
f_bot_fractal(_src) => _src > _src and _src > _src and _src < _src and _src < _src
top_fractal = f_top_fractal(src)
bot_fractal = f_bot_fractal(src)
f_fractalize (_src) => top_fractal ? 1 : bot_fractal ? -1 : 0
f_findDivs(src, topLimit, botLimit) =>
fractalTop = f_fractalize(src) > 0 and src >= topLimit ? src : na
fractalBot = f_fractalize(src) < 0 and src <= botLimit ? src : na
highPrev = ta.valuewhen(fractalTop, src , 0)
highPrice = ta.valuewhen(fractalTop, high , 0)
lowPrev = ta.valuewhen(fractalBot, src , 0)
lowPrice = ta.valuewhen(fractalBot, low , 0)
bearSignal = fractalTop and high > highPrice and src < highPrev
bullSignal = fractalBot and low < lowPrice and src > lowPrev
// Get user input
enableSR = input(false , "SR On/Off", group="SR")
colorSup = input(#00000000 , "Support Color", group="SR")
colorRes = input(#00000000 , "Resistance Color", group="SR")
strengthSR = input.int(2 , "S/R Strength", 1, group="SR")
lineStyle = input.string("Dotted", "Line Style", , group="SR")
lineWidth = input.int(2 , "S/R Line Width", 1, group="SR")
useZones = input(true , "Zones On/Off", group="SR")
useHLZones = input(true , "High Low Zones On/Off", group="SR")
zoneWidth = input.int(2 , "Zone Width %", 0,
tooltip = "it's calculated using % of the distance between highest/lowest in last 300 bars", group="SR")
expandSR = input(true , "Expand SR")
// Get components
rb = 10
prd = 284
ChannelW = 10
label_loc = 55
style = lineStyle == "Solid" ? line.style_solid :
lineStyle == "Dotted" ? line.style_dotted : line.style_dashed
ph = ta.pivothigh(rb, rb)
pl = ta.pivotlow (rb, rb)
sr_levels = array.new_float(21, na)
prdhighest = ta.highest(prd)
prdlowest = ta.lowest(prd)
cwidth = percWidth(prd, ChannelW)
zonePerc = percWidth(300, zoneWidth)
aas = array.new_bool(41, true)
u1 = 0.0, u1 := nz(u1 )
d1 = 0.0, d1 := nz(d1 )
highestph = 0.0, highestph := highestph
lowestpl = 0.0, lowestpl := lowestpl
var sr_levs = array.new_float(21, na)
label hlabel = na, label.delete(hlabel )
label llabel = na, label.delete(llabel )
var sr_lines = array.new_line(21, na)
var sr_linesH = array.new_line(21, na)
var sr_linesL = array.new_line(21, na)
var sr_linesF = array.new_linefill(21, na)
var sr_labels = array.new_label(21, na)
if (not na(ph) or not na(pl))
for x = 0 to array.size(sr_levels) - 1
array.set(sr_levels, x, na)
highestph := prdlowest
lowestpl := prdhighest
countpp = 0
for x = 0 to prd
if na(close )
break
if not na(ph ) or not na(pl )
highestph := math.max(highestph, nz(ph , prdlowest), nz(pl , prdlowest))
lowestpl := math.min(lowestpl, nz(ph , prdhighest), nz(pl , prdhighest))
countpp += 1
if countpp > 40
break
if array.get(aas, countpp)
upl = (not na(ph ) and (ph != 0) ? high : low ) + cwidth
dnl = (not na(ph ) and (ph != 0) ? high : low ) - cwidth
u1 := countpp == 1 ? upl : u1
d1 := countpp == 1 ? dnl : d1
tmp = array.new_bool(41, true)
cnt = 0
tpoint = 0
for xx = 0 to prd
if na(close )
break
if not na(ph ) or not na(pl )
chg = false
cnt += 1
if cnt > 40
break
if array.get(aas, cnt)
if not na(ph )
if high <= upl and high >= dnl
tpoint += 1
chg := true
if not na(pl )
if low <= upl and low >= dnl
tpoint += 1
chg := true
if chg and cnt < 41
array.set(tmp, cnt, false)
if tpoint >= strengthSR
for g = 0 to 40 by 1
if not array.get(tmp, g)
array.set(aas, g, false)
if (not na(ph ) and countpp < 21)
array.set(sr_levels, countpp, high )
if (not na(pl ) and countpp < 21)
array.set(sr_levels, countpp, low )
// Plot
var line highest_ = na, line.delete(highest_)
var line lowest_ = na, line.delete(lowest_)
var line highest_fill1 = na, line.delete(highest_fill1)
var line highest_fill2 = na, line.delete(highest_fill2)
var line lowest_fill1 = na, line.delete(lowest_fill1)
var line lowest_fill2 = na, line.delete(lowest_fill2)
hi_col = close >= highestph ? colorSup : colorRes
lo_col = close >= lowestpl ? colorSup : colorRes
if enableSR
highest_ := line.new(bar_index - 311, highestph, bar_index, highestph, xloc.bar_index, expandSR ? extend.both : extend.right, hi_col, style, lineWidth)
lowest_ := line.new(bar_index - 311, lowestpl , bar_index, lowestpl , xloc.bar_index, expandSR ? extend.both : extend.right, lo_col, style, lineWidth)
if useHLZones
highest_fill1 := line.new(bar_index - 311, highestph + zonePerc, bar_index, highestph + zonePerc, xloc.bar_index, expandSR ? extend.both : extend.right, na)
highest_fill2 := line.new(bar_index - 311, highestph - zonePerc, bar_index, highestph - zonePerc, xloc.bar_index, expandSR ? extend.both : extend.right, na)
lowest_fill1 := line.new(bar_index - 311, lowestpl + zonePerc , bar_index, lowestpl + zonePerc , xloc.bar_index, expandSR ? extend.both : extend.right, na)
lowest_fill2 := line.new(bar_index - 311, lowestpl - zonePerc , bar_index, lowestpl - zonePerc , xloc.bar_index, expandSR ? extend.both : extend.right, na)
linefill.new(highest_fill1, highest_fill2, hi_col)
linefill.new(lowest_fill1 , lowest_fill2 , lo_col)
if (not na(ph) or not na(pl))
for x = 0 to array.size(sr_lines) - 1
array.set(sr_levs, x, array.get(sr_levels, x))
for x = 0 to array.size(sr_lines) - 1
line.delete(array.get(sr_lines, x))
line.delete(array.get(sr_linesH, x))
line.delete(array.get(sr_linesL, x))
linefill.delete(array.get(sr_linesF, x))
if (not na(array.get(sr_levs, x)) and enableSR)
line_col = close >= array.get(sr_levs, x) ? colorSup : colorRes
array.set(sr_lines, x, line.new(bar_index - 355, array.get(sr_levs, x), bar_index, array.get(sr_levs, x), xloc.bar_index, expandSR ? extend.both : extend.right, line_col, style, lineWidth))
if useZones
array.set(sr_linesH, x, line.new(bar_index - 355, array.get(sr_levs, x) + zonePerc, bar_index, array.get(sr_levs, x) + zonePerc, xloc.bar_index, expandSR ? extend.both : extend.right, na))
array.set(sr_linesL, x, line.new(bar_index - 355, array.get(sr_levs, x) - zonePerc, bar_index, array.get(sr_levs, x) - zonePerc, xloc.bar_index, expandSR ? extend.both : extend.right, na))
array.set(sr_linesF, x, linefill.new(array.get(sr_linesH, x), array.get(sr_linesL, x), line_col))
for x = 0 to array.size(sr_labels) - 1
label.delete(array.get(sr_labels, x))
if (not na(array.get(sr_levs, x)) and enableSR)
lab_loc = close >= array.get(sr_levs, x) ? label.style_label_up : label.style_label_down
lab_col = close >= array.get(sr_levs, x) ? colorSup : colorRes
array.set(sr_labels, x, label.new(bar_index + label_loc, array.get(sr_levs, x), str.tostring(math.round_to_mintick(array.get(sr_levs, x))), color=lab_col , textcolor=#000000, style=lab_loc))
hlabel := enableSR ? label.new(bar_index + label_loc + math.round(math.sign(label_loc)) * 20, highestph, "High Level : " + str.tostring(highestph), color=hi_col, textcolor=#000000, style=label.style_label_down) : na
llabel := enableSR ? label.new(bar_index + label_loc + math.round(math.sign(label_loc)) * 20, lowestpl , "Low Level : " + str.tostring(lowestpl) , color=lo_col, textcolor=#000000, style=label.style_label_up ) : na
// Get components
rsi = ta.rsi(close, 28)
//rsiOb = rsi > 78 and rsi > ta.ema(rsi, 10)
//rsiOs = rsi < 27 and rsi < ta.ema(rsi, 10)
rsiOb = rsi > 65 and rsi > ta.ema(rsi, 10)
rsiOs = rsi < 35 and rsi < ta.ema(rsi, 10)
dHigh = securityNoRep(syminfo.tickerid, "D", high )
dLow = securityNoRep(syminfo.tickerid, "D", low )
dClose = securityNoRep(syminfo.tickerid, "D", close )
ema = ta.ema(close, 144)
emaBull = close > ema
equal_tf(res) => str.tonumber(res) == f_chartTfInMinutes() and not timeframe.isseconds
higher_tf(res) => str.tonumber(res) > f_chartTfInMinutes() or timeframe.isseconds
too_small_tf(res) => (timeframe.isweekly and res=="1") or (timeframe.ismonthly and str.tonumber(res) < 10)
securityNoRep1(sym, res, src) =>
bool bull_ = na
bull_ := equal_tf(res) ? src : bull_
bull_ := higher_tf(res) ? request.security(sym, res, src, barmerge.gaps_off, barmerge.lookahead_on) : bull_
bull_array = request.security_lower_tf(syminfo.tickerid, higher_tf(res) ? str.tostring(f_chartTfInMinutes()) + (timeframe.isseconds ? "S" : "") : too_small_tf(res) ? (timeframe.isweekly ? "3" : "10") : res, src)
if array.size(bull_array) > 1 and not equal_tf(res) and not higher_tf(res)
bull_ := array.pop(bull_array)
array.clear(bull_array)
bull_
// === BASE FUNCTIONS ===
// Returns MA input selection variant, default to SMA if blank or typo.
variant(type, src, len, offSig, offALMA) =>
v1 = ta.sma(src, len) // Simple
v2 = ta.ema(src, len) // Exponential
v3 = 2 * v2 - ta.ema(v2, len) // Double Exponential
v4 = 3 * (v2 - ta.ema(v2, len)) + ta.ema(ta.ema(v2, len), len) // Triple Exponential
v5 = ta.wma(src, len) // Weighted
v6 = ta.vwma(src, len) // Volume Weighted
v7 = 0.0
sma_1 = ta.sma(src, len) // Smoothed
v7 := na(v7 ) ? sma_1 : (v7 * (len - 1) + src) / len
v8 = ta.wma(2 * ta.wma(src, len / 2) - ta.wma(src, len), math.round(math.sqrt(len))) // Hull
v9 = ta.linreg(src, len, offSig) // Least Squares
v10 = ta.alma(src, len, offALMA, offSig) // Arnaud Legoux
v11 = ta.sma(v1, len) // Triangular (extreme smooth)
// SuperSmoother filter
// 2013 John F. Ehlers
a1 = math.exp(-1.414 * 3.14159 / len)
b1 = 2 * a1 * math.cos(1.414 * 3.14159 / len)
c2 = b1
c3 = -a1 * a1
c1 = 1 - c2 - c3
v12 = 0.0
v12 := c1 * (src + nz(src )) / 2 + c2 * nz(v12 ) + c3 * nz(v12 )
type == 'EMA' ? v2 : type == 'DEMA' ? v3 : type == 'TEMA' ? v4 : type == 'WMA' ? v5 : type == 'VWMA' ? v6 : type == 'SMMA' ? v7 : type == 'HullMA' ? v8 : type == 'LSMA' ? v9 : type == 'ALMA' ? v10 : type == 'TMA' ? v11 : type == 'SSMA' ? v12 : v1
// security wrapper for repeat calls
reso(exp, use, res) =>
security_1 = request.security(syminfo.tickerid, res, exp, gaps = barmerge.gaps_off, lookahead = barmerge.lookahead_on)
use ? security_1 : exp
// === /BASE FUNCTIONS ===
// === SERIES SETUP ===
closeSeries = variant(basisType, close , basisLen, offsetSigma, offsetALMA)
openSeries = variant(basisType, open , basisLen, offsetSigma, offsetALMA)
// === /SERIES ===
// Get Alternate resolution Series if selected.
closeSeriesAlt = reso(closeSeries, useRes, stratRes)
openSeriesAlt = reso(openSeries, useRes, stratRes)
//
lxTrigger = false
sxTrigger = false
leTrigger = ta.crossover (closeSeriesAlt, openSeriesAlt)
seTrigger = ta.crossunder(closeSeriesAlt, openSeriesAlt)
G_RISK = '■ ' + 'Risk Management'
//#region ———— <↓↓↓ G_RISK ↓↓↓> {
// ———————————
//Tooltip
T_LVL = '(%) Exit Level'
T_QTY = '(%) Adjust trade exit volume'
T_MSG = 'Paste JSON message for your bot'
//Webhook Message
O_LEMSG = 'Long Entry'
O_LXMSGSL = 'Long SL'
O_LXMSGTP1 = 'Long TP1'
O_LXMSGTP2 = 'Long TP2'
O_LXMSGTP3 = 'Long TP3'
O_LXMSG = 'Long Exit'
O_SEMSG = 'Short Entry'
O_SXMSGSL = 'Short SL'
O_SXMSGA = 'Short TP1'
O_SXMSGB = 'Short TP2'
O_SXMSGC = 'Short TP3'
O_SXMSGX = 'Short Exit'
// ——————————— | | | Line length guide |
i_lxLvlTP1 = input.float (0.2, 'Level TP1' , group = G_RISK,
tooltip = T_LVL)
i_lxQtyTP1 = input.float (80.0, 'Qty TP1' , group = G_RISK,
tooltip = T_QTY)
i_lxLvlTP2 = input.float (0.5, 'Level TP2' , group = G_RISK,
tooltip = T_LVL)
i_lxQtyTP2 = input.float (10.0, 'Qty TP2' , group = G_RISK,
tooltip = T_QTY)
i_lxLvlTP3 = input.float (7.0, 'Level TP3' , group = G_RISK,
tooltip = T_LVL)
i_lxQtyTP3 = input.float (2, 'Qty TP3' , group = G_RISK,
tooltip = T_QTY)
i_lxLvlSL = input.float (0.5, 'Stop Loss' , group = G_RISK,
tooltip = T_LVL)
i_sxLvlTP1 = i_lxLvlTP1
i_sxQtyTP1 = i_lxQtyTP1
i_sxLvlTP2 = i_lxLvlTP2
i_sxQtyTP2 = i_lxQtyTP2
i_sxLvlTP3 = i_lxLvlTP3
i_sxQtyTP3 = i_lxQtyTP3
i_sxLvlSL = i_lxLvlSL
G_MSG = '■ ' + 'Webhook Message'
i_leMsg = input.string (O_LEMSG ,'Long Entry' , group = G_MSG, tooltip = T_MSG)
i_lxMsgSL = input.string (O_LXMSGSL ,'Long SL' , group = G_MSG, tooltip = T_MSG)
i_lxMsgTP1 = input.string (O_LXMSGTP1,'Long TP1' , group = G_MSG, tooltip = T_MSG)
i_lxMsgTP2 = input.string (O_LXMSGTP2,'Long TP2' , group = G_MSG, tooltip = T_MSG)
i_lxMsgTP3 = input.string (O_LXMSGTP3,'Long TP3' , group = G_MSG, tooltip = T_MSG)
i_lxMsg = input.string (O_LXMSG ,'Long Exit' , group = G_MSG, tooltip = T_MSG)
i_seMsg = input.string (O_SEMSG ,'Short Entry' , group = G_MSG, tooltip = T_MSG)
i_sxMsgSL = input.string (O_SXMSGSL ,'Short SL' , group = G_MSG, tooltip = T_MSG)
i_sxMsgTP1 = input.string (O_SXMSGA ,'Short TP1' , group = G_MSG, tooltip = T_MSG)
i_sxMsgTP2 = input.string (O_SXMSGB ,'Short TP2' , group = G_MSG, tooltip = T_MSG)
i_sxMsgTP3 = input.string (O_SXMSGC ,'Short TP3' , group = G_MSG, tooltip = T_MSG)
i_sxMsg = input.string (O_SXMSGX ,'Short Exit' , group = G_MSG, tooltip = T_MSG)
i_src = close
G_DISPLAY = 'Display'
//
i_alertOn = input.bool (true, 'Alert Labels On/Off' , group = G_DISPLAY)
i_barColOn = input.bool (true, 'Bar Color On/Off' , group = G_DISPLAY)
// ———————————
// @function Calculate the Take Profit line, and the crossover or crossunder
f_tp(_condition, _conditionValue, _leTrigger, _seTrigger, _src, _lxLvlTP, _sxLvlTP)=>
var float _tpLine = 0.0
_topLvl = _src + (_src * (_lxLvlTP / 100))
_botLvl = _src - (_src * (_sxLvlTP / 100))
_tpLine := _condition != _conditionValue and _leTrigger ? _topLvl :
_condition != -_conditionValue and _seTrigger ? _botLvl :
nz(_tpLine )
// @function Similar to "ta.crossover" or "ta.crossunder"
f_cross(_scr1, _scr2, _over)=>
_cross = _over ? _scr1 > _scr2 and _scr1 < _scr2 :
_scr1 < _scr2 and _scr1 > _scr2
// ———————————
//
var float condition = 0.0
var float slLine = 0.0
var float entryLine = 0.0
//
entryLine := leTrigger and condition <= 0.0 ? close :
seTrigger and condition >= 0.0 ? close : nz(entryLine )
//
slTopLvl = i_src + (i_src * (i_lxLvlSL / 100))
slBotLvl = i_src - (i_src * (i_sxLvlSL / 100))
slLine := condition <= 0.0 and leTrigger ? slBotLvl :
condition >= 0.0 and seTrigger ? slTopLvl : nz(slLine )
slLong = f_cross(low, slLine, false)
slShort = f_cross(high, slLine, true )
//
= f_tp(condition, 1.2,leTrigger, seTrigger, i_src, i_lxLvlTP3, i_sxLvlTP3)
= f_tp(condition, 1.1,leTrigger, seTrigger, i_src, i_lxLvlTP2, i_sxLvlTP2)
= f_tp(condition, 1.0,leTrigger, seTrigger, i_src, i_lxLvlTP1, i_sxLvlTP1)
tp3Long = f_cross(high, tp3Line, true )
tp3Short = f_cross(low, tp3Line, false)
tp2Long = f_cross(high, tp2Line, true )
tp2Short = f_cross(low, tp2Line, false)
tp1Long = f_cross(high, tp1Line, true )
tp1Short = f_cross(low, tp1Line, false)
switch
leTrigger and condition <= 0.0 => condition := 1.0
seTrigger and condition >= 0.0 => condition := -1.0
tp3Long and condition == 1.2 => condition := 1.3
tp3Short and condition == -1.2 => condition := -1.3
tp2Long and condition == 1.1 => condition := 1.2
tp2Short and condition == -1.1 => condition := -1.2
tp1Long and condition == 1.0 => condition := 1.1
tp1Short and condition == -1.0 => condition := -1.1
slLong and condition >= 1.0 => condition := 0.0
slShort and condition <= -1.0 => condition := 0.0
lxTrigger and condition >= 1.0 => condition := 0.0
sxTrigger and condition <= -1.0 => condition := 0.0
longE = leTrigger and condition <= 0.0 and condition == 1.0
shortE = seTrigger and condition >= 0.0 and condition == -1.0
longX = lxTrigger and condition >= 1.0 and condition == 0.0
shortX = sxTrigger and condition <= -1.0 and condition == 0.0
longSL = slLong and condition >= 1.0 and condition == 0.0
shortSL = slShort and condition <= -1.0 and condition == 0.0
longTP3 = tp3Long and condition == 1.2 and condition == 1.3
shortTP3 = tp3Short and condition == -1.2 and condition == -1.3
longTP2 = tp2Long and condition == 1.1 and condition == 1.2
shortTP2 = tp2Short and condition == -1.1 and condition == -1.2
longTP1 = tp1Long and condition == 1.0 and condition == 1.1
shortTP1 = tp1Short and condition == -1.0 and condition == -1.1
// ——————————— {
//
if strategy.position_size <= 0 and longE and barstate.isconfirmed
strategy.entry(
'Long',
strategy.long,
alert_message = i_leMsg,
comment = 'LE')
if strategy.position_size > 0 and condition == 1.0
strategy.exit(
id = 'LXTP1',
from_entry = 'Long',
qty_percent = i_lxQtyTP1,
limit = tp1Line,
stop = slLine,
comment_profit = 'LXTP1',
comment_loss = 'SL',
alert_profit = i_lxMsgTP1,
alert_loss = i_lxMsgSL)
if strategy.position_size > 0 and condition == 1.1
strategy.exit(
id = 'LXTP2',
from_entry = 'Long',
qty_percent = i_lxQtyTP2,
limit = tp2Line,
stop = slLine,
comment_profit = 'LXTP2',
comment_loss = 'SL',
alert_profit = i_lxMsgTP2,
alert_loss = i_lxMsgSL)
if strategy.position_size > 0 and condition == 1.2
strategy.exit(
id = 'LXTP3',
from_entry = 'Long',
qty_percent = i_lxQtyTP3,
limit = tp3Line,
stop = slLine,
comment_profit = 'LXTP3',
comment_loss = 'SL',
alert_profit = i_lxMsgTP3,
alert_loss = i_lxMsgSL)
if longX
strategy.close(
'Long',
alert_message = i_lxMsg,
comment = 'LX')
//
if strategy.position_size >= 0 and shortE and barstate.isconfirmed
strategy.entry(
'Short',
strategy.short,
alert_message = i_leMsg,
comment = 'SE')
if strategy.position_size < 0 and condition == -1.0
strategy.exit(
id = 'SXTP1',
from_entry = 'Short',
qty_percent = i_sxQtyTP1,
limit = tp1Line,
stop = slLine,
comment_profit = 'SXTP1',
comment_loss = 'SL',
alert_profit = i_sxMsgTP1,
alert_loss = i_sxMsgSL)
if strategy.position_size < 0 and condition == -1.1
strategy.exit(
id = 'SXTP2',
from_entry = 'Short',
qty_percent = i_sxQtyTP2,
limit = tp2Line,
stop = slLine,
comment_profit = 'SXTP2',
comment_loss = 'SL',
alert_profit = i_sxMsgTP2,
alert_loss = i_sxMsgSL)
if strategy.position_size < 0 and condition == -1.2
strategy.exit(
id = 'SXTP3',
from_entry = 'Short',
qty_percent = i_sxQtyTP3,
limit = tp3Line,
stop = slLine,
comment_profit = 'SXTP3',
comment_loss = 'SL',
alert_profit = i_sxMsgTP3,
alert_loss = i_sxMsgSL)
if shortX
strategy.close(
'Short',
alert_message = i_sxMsg,
comment = 'SX')
// ———————————
c_tp = leTrigger or seTrigger ? na :
condition == 0.0 ? na : color.green
c_entry = leTrigger or seTrigger ? na :
condition == 0.0 ? na : color.blue
c_sl = leTrigger or seTrigger ? na :
condition == 0.0 ? na : color.red
p_tp1Line = plot (
condition == 1.0 or
condition == -1.0 ? tp1Line : na,
title = "TP Line 1",
color = c_tp,
linewidth = 1,
style = plot.style_linebr)
p_tp2Line = plot (
condition == 1.0 or
condition == -1.0 or
condition == 1.1 or
condition == -1.1 ? tp2Line : na,
title = "TP Line 2",
color = c_tp,
linewidth = 1,
style = plot.style_linebr)
p_tp3Line = plot (
condition == 1.0 or
condition == -1.0 or
condition == 1.1 or
condition == -1.1 or
condition == 1.2 or
condition == -1.2 ? tp3Line : na,
title = "TP Line 3",
color = c_tp,
linewidth = 1,
style = plot.style_linebr)
p_entryLine = plot (
condition >= 1.0 or
condition <= -1.0 ? entryLine : na,
title = "Entry Line",
color = c_entry,
linewidth = 1,
style = plot.style_linebr)
p_slLine = plot (
condition == 1.0 or
condition == -1.0 or
condition == 1.1 or
condition == -1.1 or
condition == 1.2 or
condition == -1.2 ? slLine : na,
title = "SL Line",
color = c_sl,
linewidth = 1,
style = plot.style_linebr)
fill(
p_tp3Line, p_entryLine,
color = leTrigger or seTrigger ? na :color.new(color.green, 90))
fill(
p_entryLine, p_slLine,
color = leTrigger or seTrigger ? na :color.new(color.red, 90))
//
plotshape(
i_alertOn and longE,
title = 'Long',
text = 'Long',
textcolor = color.white,
color = color.green,
style = shape.labelup,
size = size.tiny,
location = location.belowbar)
plotshape(
i_alertOn and shortE,
title = 'Short',
text = 'Short',
textcolor = color.white,
color = color.red,
style = shape.labeldown,
size = size.tiny,
location = location.abovebar)
plotshape(
i_alertOn and (longX or shortX) ? close : na,
title = 'Close',
text = 'Close',
textcolor = color.white,
color = color.gray,
style = shape.labelup,
size = size.tiny,
location = location.absolute)
l_tp = i_alertOn and (longTP1 or shortTP1) ? close : na
plotshape(
l_tp,
title = "TP1 Cross",
text = "TP1",
textcolor = color.white,
color = color.olive,
style = shape.labelup,
size = size.tiny,
location = location.absolute)
plotshape(
i_alertOn and (longTP2 or shortTP2) ? close : na,
title = "TP2 Cross",
text = "TP2",
textcolor = color.white,
color = color.olive,
style = shape.labelup,
size = size.tiny,
location = location.absolute)
plotshape(
i_alertOn and (longTP3 or shortTP3) ? close : na,
title = "TP3 Cross",
text = "TP3",
textcolor = color.white,
color = color.olive,
style = shape.labelup,
size = size.tiny,
location = location.absolute)
plotshape(
i_alertOn and (longSL or shortSL) ? close : na,
title = "SL Cross",
text = "SL",
textcolor = color.white,
color = color.maroon,
style = shape.labelup,
size = size.tiny,
location = location.absolute)
//
plot(
na,
title = "─── ───",
editable = false,
display = display.data_window)
plot(
condition,
title = "condition",
editable = false,
display = display.data_window)
plot(
strategy.position_size * 100,
title = ".position_size",
editable = false,
display = display.data_window)
//#endregion }
// ——————————— <↑↑↑ G_RISK ↑↑↑>
//#region ———— <↓↓↓ G_SCRIPT02 ↓↓↓> {
// @function Queues a new element in an array and de-queues its first element.
f_qDq(_array, _val) =>
array.push(_array, _val)
_return = array.shift(_array)
_return
var line a_slLine = array.new_line(1)
var line a_entryLine = array.new_line(1)
var line a_tp3Line = array.new_line(1)
var line a_tp2Line = array.new_line(1)
var line a_tp1Line = array.new_line(1)
var label a_slLabel = array.new_label(1)
var label a_tp3label = array.new_label(1)
var label a_tp2label = array.new_label(1)
var label a_tp1label = array.new_label(1)
var label a_entryLabel = array.new_label(1)
newEntry = longE or shortE
entryIndex = 1
entryIndex := newEntry ? bar_index : nz(entryIndex )
lasTrade = bar_index >= entryIndex
l_right = 10
line.delete(
f_qDq(a_slLine,
line.new(
entryIndex,
slLine,
last_bar_index + l_right,
slLine,
style = line.style_solid,
color = c_sl)))
line.delete(
f_qDq(a_entryLine,
line.new(
entryIndex,
entryLine,
last_bar_index + l_right,
entryLine,
style = line.style_solid,
color = color.blue)))
line.delete(
f_qDq(a_tp3Line,
line.new(
entryIndex,
tp3Line,
last_bar_index + l_right,
tp3Line,
style = line.style_solid,
color = c_tp)))
line.delete(
f_qDq(a_tp2Line,
line.new(
entryIndex,
tp2Line,
last_bar_index + l_right,
tp2Line,
style = line.style_solid,
color = c_tp)))
line.delete(
f_qDq(a_tp1Line,
line.new(
entryIndex,
tp1Line,
last_bar_index + l_right,
tp1Line,
style = line.style_solid,
color = c_tp)))
label.delete(
f_qDq(a_slLabel,
label.new(
last_bar_index + l_right,
slLine,
'SL: ' + str.tostring(slLine, '##.###'),
style = label.style_label_left,
textcolor = color.white,
color = c_sl)))
label.delete(
f_qDq(a_entryLabel,
label.new(
last_bar_index + l_right,
entryLine,
'Entry: ' + str.tostring(entryLine, '##.###'),
style = label.style_label_left,
textcolor = color.white,
color = color.blue)))
label.delete(
f_qDq(a_tp3label,
label.new(
last_bar_index + l_right,
tp3Line,
'TP3: ' + str.tostring(tp3Line, '##.###'),
style = label.style_label_left,
textcolor = color.white,
color = c_tp)))
label.delete(
f_qDq(a_tp2label,
label.new(
last_bar_index + l_right,
tp2Line,
'TP2: ' + str.tostring(tp2Line, '##.###'),
style = label.style_label_left,
textcolor = color.white,
color = c_tp)))
label.delete(
f_qDq(a_tp1label,
label.new(
last_bar_index + l_right,
tp1Line,
'TP1: ' + str.tostring(tp1Line, '##.###'),
style = label.style_label_left,
textcolor = color.white,
color = c_tp)))
// ———————————
//
if longE or shortE or longX or shortX
alert(message = 'Any Alert', freq = alert.freq_once_per_bar_close)
if longE
alert(message = 'Long Entry', freq = alert.freq_once_per_bar_close)
if shortE
alert(message = 'Short Entry', freq = alert.freq_once_per_bar_close)
if longX
alert(message = 'Long Exit', freq = alert.freq_once_per_bar_close)
if shortX
alert(message = 'Short Exit', freq = alert.freq_once_per_bar_close)
//#endregion }
// ——————————— <↑↑↑ G_SCRIPT03 ↑↑↑>

Fibonacci Trend - Aynet1. Inputs
lookbackPeriod: Defines the number of bars to consider for calculating swing highs and lows. Default is 20.
fibLevel1 to fibLevel5: Fibonacci retracement levels to calculate price levels (23.6%, 38.2%, 50%, 61.8%, 78.6%).
useTime: Enables or disables time-based Fibonacci projections.
riskPercent: Defines the percentage of risk for trading purposes (currently not used in calculations).
2. Functions
isSwingHigh(index): Identifies a swing high at the given index, where the high of that candle is higher than both its previous and subsequent candles.
isSwingLow(index): Identifies a swing low at the given index, where the low of that candle is lower than both its previous and subsequent candles.
3. Variables
swingHigh and swingLow: Store the most recent swing high and swing low prices.
swingHighTime and swingLowTime: Store the timestamps of the swing high and swing low.
fib1 to fib5: Fibonacci levels based on the difference between swingHigh and swingLow.
4. Swing Point Detection
The script checks if the last bar is a swing high or swing low using the isSwingHigh() and isSwingLow() functions.
If a swing high is detected:
The high price is stored in swingHigh.
The timestamp of the swing high is stored in swingHighTime.
If a swing low is detected:
The low price is stored in swingLow.
The timestamp of the swing low is stored in swingLowTime.
5. Fibonacci Levels Calculation
If both swingHigh and swingLow are defined, the script calculates the Fibonacci retracement levels (fib1 to fib5) based on the price difference (priceDiff = swingHigh - swingLow).
6. Plotting Fibonacci Levels
Fibonacci levels (fib1 to fib5) are plotted as horizontal lines using the line.new() function.
Labels (e.g., "23.6%") are added near the lines to indicate the level.
Lines and labels are color-coded:
23.6% → Blue
38.2% → Green
50.0% → Yellow
61.8% → Orange
78.6% → Red
7. Filling Between Fibonacci Levels
The plot() function creates lines for each Fibonacci level.
The fill() function is used to fill the space between two levels with semi-transparent colors:
Blue → Between fib1 and fib2
Green → Between fib2 and fib3
Yellow → Between fib3 and fib4
Orange → Between fib4 and fib5
8. Time-Based Fibonacci Projections
If useTime is enabled:
The time difference (timeDiff) between the swing high and swing low is calculated.
Fibonacci time projections are added based on multiples of 23.6%.
If the current time reaches a projected time, a label (e.g., "T1", "T2") is displayed near the high price.
9. Trading Logic
Two placeholder variables are defined for trading logic:
longCondition: Tracks whether a condition for a long trade is met (currently not implemented).
shortCondition: Tracks whether a condition for a short trade is met (currently not implemented).
These variables can be extended to define entry/exit signals based on Fibonacci levels.
How It Works
Detect Swing Points: It identifies recent swing high and swing low points on the chart.
Calculate Fibonacci Levels: Based on the swing points, it computes retracement levels.
Visualize Levels: Plots the levels on the chart with labels and fills between them.
Time Projections: Optionally calculates time-based projections for future price movements.
Trading Opportunities: The framework provides tools for detecting potential reversal or breakout zones using Fibonacci levels.
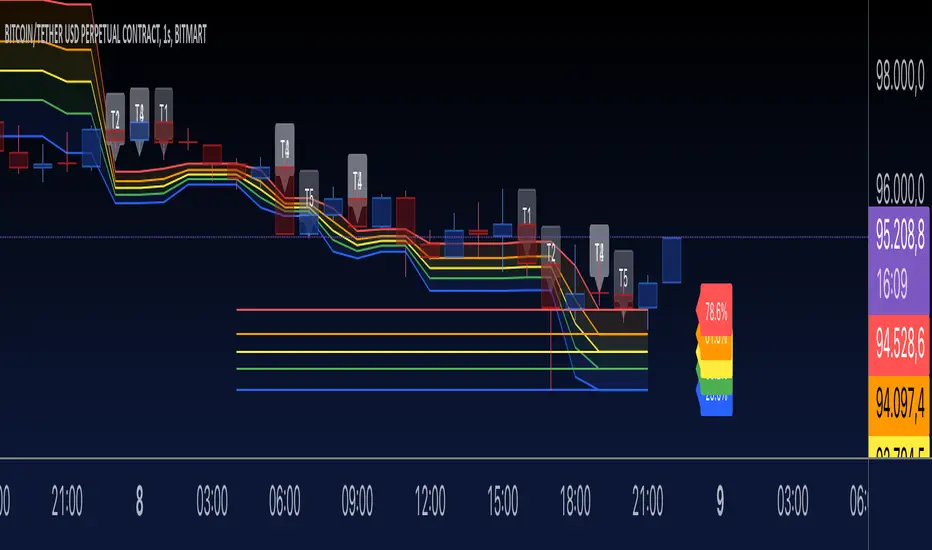
SMT Divergence [Kodexius]SMT Divergence is a correlation-based divergence detector built around the Smart Money Technique concept: when two normally correlated instruments should be making similar swing progress, but one prints a new extreme while the other fails to confirm it. This “disagreement” can be a valuable contextual signal around liquidity runs, distribution phases, and potential reversal or continuation points.
The script compares the chart symbol (primary) with a user-selected comparison symbol (for example BTC vs ETH, ES vs NQ, EUR/USD vs GBP/USD) and automatically scans both instruments for confirmed swing highs and swing lows using pivot logic. Once swings are established, it checks for classic SMT conditions:
Primary makes a new swing extreme while the comparison symbol forms a non-confirming swing .
To support a wider range of markets, the indicator includes an Inverse Correlation option for pairs that typically move opposite to each other (for example DXY vs EUR/USD). With this enabled, the divergence rules are logically flipped so that the script still detects “non-confirmation” in a way that is consistent with the pair’s relationship.
The indicator is designed to be readable and actionable. It can draw divergence labels directly on the main chart, connect the relevant swing points with lines, show a compact information table with the last signal and settings, and optionally render the comparison symbol as a mini candle chart in the indicator pane for quick visual validation.
🔹 Features
🔸 Two-Symbol SMT Analysis (Primary vs Compare)
Select any comparison symbol to evaluate correlation structure and divergence. The script fetches the comparison OHLC data using the current chart timeframe to keep both series aligned for analysis.
🔸 Inverse Correlation Mode
For inversely correlated pairs, enable “Inverse Correlation” so the script interprets confirmation appropriately (for example, a higher low on the comparison instrument might be expected to correspond to a lower low on the primary, depending on the relationship). This helps avoid false conclusions when the pair naturally moves opposite.
🔸 Pivot-Based Swing with Adjustable Sensitivity
Swings are detected using confirmed pivots (left bars and right bars). This provides cleaner structural swing points compared with raw candle-to-candle comparisons, and it lets you control sensitivity for different market conditions and timeframes. The script also limits stored swing history to keep performance stable.
🔸 Flexible Detection Mode: Time Matched or Independent Swings
You can choose how swings are paired across instruments:
Time Matched searches for a comparison swing that occurred at the same pivot time as the primary swing.
Independent Swings compares each symbol’s own last two swings without requiring an exact time match.
🔸 Range Control and Noise Filtering
To reduce weak or irrelevant signals:
“Max Bars Between Swings” ensures the two swings being compared are close enough in structure to be meaningful.
“Min Price Diff (%)” can require a minimum percentage change between the primary’s last two swing prices to confirm the move is significant.
🔸 Clear Visual Output with Tooltips
When a divergence is detected, the script can print a label (“SMT”) with bullish or bearish styling and a tooltip that includes the symbol pair and the primary swing price for quick context.
🔸 Divergence Lines for Context
Optional lines connect the relevant swing points, making it easier to see the exact structure that triggered the signal. One line can be drawn on the main chart and another in the indicator pane for the comparison series.
🔸 Info Table (At a Glance)
A compact table can display the active symbols, correlation mode, total divergences stored, and the most recent signal type.
🔸 Alerts Included
Built-in alert conditions are provided for bullish SMT, bearish SMT, and any SMT event so you can automate notifications without editing the code.
🔸 Optional Comparison Candle Panel
If enabled, the indicator can plot the comparison symbol as candles in the indicator pane. This is useful for confirming whether the divergence is happening around major levels, consolidations, or impulsive legs on the secondary instrument.
🔹 Calculations
This section summarizes the core logic used by the script.
1. Data Synchronization (Comparison Symbol)
The comparison instrument is requested on the chart’s current timeframe so swing calculations are performed consistently:
=
request.security(compareSymbolInput, timeframe.period, )
This ensures pivots and swing times are derived from the same bar cadence as the primary chart.
2. Swing Detection via Confirmed Pivots
Swings are detected using pivot logic with user-defined left and right bars:
primaryPivotHigh = ta.pivothigh(high, pivotLeftBars, pivotRightBars)
primaryPivotLow = ta.pivotlow(low, pivotLeftBars, pivotRightBars)
Because pivots are confirmed only after the “right bars” have closed, the script stores each swing using an offset so the swing’s bar index and time reflect where the pivot actually occurred, not where it was confirmed.
3. Swing Storage and Retrieval
Both symbols maintain arrays of SwingPoint objects. Each new swing is pushed into the array, and older swings are dropped once the array exceeds the configured maximum. This makes the divergence engine predictable and prevents uncontrolled memory growth.
The script then retrieves the last and previous swing highs and lows (per symbol) to evaluate structure.
4. Matching Logic (Time Matched vs Independent)
When “Time Matched” is selected, the script searches the comparison swing array for a pivot that occurred at the exact same timestamp as the primary swing. When “Independent Swings” is selected, it simply uses the comparison symbol’s last two swings of the same type.
5. Bullish SMT Condition (LL vs HL)
A bullish SMT event is defined as:
Primary forms a lower low (last low < previous low)
Comparison forms a higher low (last low > previous low)
If inverse correlation is enabled, the comparison condition flips to maintain logical confirmation rules
The two primary swings must be within the configured bar distance window
Optional minimum percentage difference must be satisfied
A simple anti duplication rule prevents repeated triggers on the same structure
These checks are implemented directly in the bullish detection block.
6. Bearish SMT Condition (HH vs LH)
A bearish SMT event is defined as:
Primary forms a higher high (last high > previous high)
Comparison forms a lower high (last high < previous high)
Inverse correlation flips the comparison rule
Range checks, minimum difference filtering, and duplicate protection apply similarly
These checks are implemented in the bearish detection block.
7. Percentage Difference Filter
The optional “Min Price Diff (%)” filter measures the relative distance between the last two primary swing prices. This prevents very small structural changes from being treated as valid SMT signals.
priceDiffPerc = math.abs(lastSwing.price - prevSwing.price) / prevSwing.price * 100.0
The divergence condition is only allowed to trigger if this value exceeds the user defined threshold.
priceOk = priceDiffPerc >= minPriceDiff
This filter is especially useful on higher timeframes or during low volatility conditions, where micro structure noise can otherwise produce misleading signals.
8. Visualization and Output
When a divergence is confirmed, the script:
Stores the event in a divergence array (limited by “Max Divergences to Display”)
Draws a directional SMT label with a tooltip (optional)
Draws connecting lines using time based coordinates for clean alignment (optional)
It also updates an information table on the last bar only, and exposes alertconditions for automation workflows.

Golden Cross 50/200 EMATrend-following systems are characterized by having a low win rate, yet in the right circumstances (trending markets and higher timeframes) they can deliver returns that even surpass those of systems with a high win rate.
Below, I show you a simple bullish trend-following system with clear execution rules:
System Rules
-Long entries when the 50-period EMA crosses above the 200-period EMA.
-Stop Loss (SL) placed at the lowest low of the 15 candles prior to the entry candle.
-Take Profit (TP) triggered when the 50-period EMA crosses below the 200-period EMA.
Risk Management
-Initial capital: $10,000
-Position size: 10% of capital per trade
-Commissions: 0.1% per trade
Important Note:
In the code, the stop loss is defined using the swing low (15 candles), but the position size is not adjusted based on the distance to the stop loss. In other words, 10% of the equity is risked on each trade, but the actual loss on the trade is not controlled by a maximum fixed percentage of the account — it depends entirely on the stop loss level. This means the loss on a single trade could be significantly higher or lower than 10% of the account equity, depending on volatility.
Implementing leverage or reducing position size based on volatility is something I haven’t been able to include in the code, but it would dramatically improve the system’s performance. It would fix a consistent percentage loss per trade, preventing losses from fluctuating wildly with changes in volatility.
For example, we can maintain a fixed loss percentage when volatility is low by using the following formula:
Leverage = % of SL you’re willing to risk / % volatility from entry point to stop loss
And when volatility is high and would exceed the fixed percentage we want to expose per trade (if the SL is hit), we could reduce the position size accordingly.
Practical example:
Imagine we only want to risk 15% of the position value if the stop loss is triggered on Tesla (which has high volatility), but the distance to the SL represents a potential 23.57% drop. In this case, we subtract the desired risk (15%) from the actual volatility-based loss (23.57%):
23.57% − 15% = 8.57%
Now suppose we normally use $200 per trade.
To calculate 8.57% of $200:
200 × (8.57 / 100) = $17.14
Then subtract that amount from the original position size:
$200 − $17.14 = $182.86
In summary:
If we reduce the position size to $182.86 (instead of the usual $200), even if Tesla moves 23.57% against us and hits the stop loss, we would still only lose approximately 15% of the original $200 position — exactly the risk level we defined. This way, we strictly respect our risk management rules regardless of volatility swings.
I hope this clearly explains the importance of capping losses at a fixed percentage per trade. This keeps risk under control while maintaining a consistent percentage of capital invested per trade — preventing both statistical distortion of the system and the potential destruction of the account.
About the code:
Strategy declaration:
The strategy is named 'Golden Cross 50/200 EMA'.
overlay=true means it will be drawn directly on the price chart.
initial_capital=10000 sets the initial capital to $10,000.
default_qty_type=strategy.percent_of_equity and default_qty_value=10 means each trade uses 10% of available equity.
margin_long=0 indicates no margin is used for long positions (this is likely for simulation purposes only; in real trading, margin would be required).
commission_type=strategy.commission.percent and commission_value=0.1 sets a 0.1% commission per trade.
Indicators:
Calculates two EMAs: a 50-period EMA (ema50) and a 200-period EMA (ema200).
Crossover detection:
bullCross is triggered when the 50-period EMA crosses above the 200-period EMA (Golden Cross).
bearCross is triggered when the 50-period EMA crosses below the 200-period EMA (Death Cross).
Recent swing:
swingLow calculates the lowest low of the previous 15 periods.
Stop Loss:
entryStopLoss is a variable initialized as na (not available) and is updated to the current swingLow value whenever a bullCross occurs.
Entry and exit conditions:
Entry: When a bullCross occurs, the initial stop loss is set to the current swingLow and a long position is opened.
Exit on opposite signal: When a bearCross occurs, the long position is closed.
Exit on stop loss: If the price falls below entryStopLoss while a position is open, the position is closed.
Visualization:
Both EMAs are plotted (50-period in blue, 200-period in red).
Green triangles are plotted below the bar on a bullCross, and red triangles above the bar on a bearCross.
A horizontal orange line is drawn that shows the stop loss level whenever a position is open.
Alerts:
Alerts are created for:Long entry
Exit on bearish crossover (Death Cross)
Exit triggered by stop loss
Favorable Conditions:
Tesla (45-minute timeframe)
June 29, 2010 – November 17, 2025
Total net profit: $12,458.73 or +124.59%
Maximum drawdown: $1,210.40 or 8.29%
Total trades: 107
Winning trades: 27.10% (29/107)
Profit factor: 3.141
Tesla (1-hour timeframe)
June 29, 2010 – November 17, 2025
Total net profit: $7,681.83 or +76.82%
Maximum drawdown: $993.36 or 7.30%
Total trades: 75
Winning trades: 29.33% (22/75)
Profit factor: 3.157
Netflix (45-minute timeframe)
May 23, 2002 – November 17, 2025
Total net profit: $11,380.73 or +113.81%
Maximum drawdown: $699.45 or 5.98%
Total trades: 134
Winning trades: 36.57% (49/134)
Profit factor: 2.885
Netflix (1-hour timeframe)
May 23, 2002 – November 17, 2025
Total net profit: $11,689.05 or +116.89%
Maximum drawdown: $844.55 or 7.24%
Total trades: 107
Winning trades: 37.38% (40/107)
Profit factor: 2.915
Netflix (2-hour timeframe)
May 23, 2002 – November 17, 2025
Total net profit: $12,807.71 or +128.10%
Maximum drawdown: $866.52 or 6.03%
Total trades: 56
Winning trades: 41.07% (23/56)
Profit factor: 3.891
Meta (45-minute timeframe)
May 18, 2012 – November 17, 2025
Total net profit: $2,370.02 or +23.70%
Maximum drawdown: $365.27 or 3.50%
Total trades: 83
Winning trades: 31.33% (26/83)
Profit factor: 2.419
Apple (45-minute timeframe)
January 3, 2000 – November 17, 2025
Total net profit: $8,232.55 or +80.59%
Maximum drawdown: $581.11 or 3.16%
Total trades: 140
Winning trades: 34.29% (48/140)
Profit factor: 3.009
Apple (1-hour timeframe)
January 3, 2000 – November 17, 2025
Total net profit: $9,685.89 or +94.93%
Maximum drawdown: $374.69 or 2.26%
Total trades: 118
Winning trades: 35.59% (42/118)
Profit factor: 3.463
Apple (2-hour timeframe)
January 3, 2000 – November 17, 2025
Total net profit: $8,001.28 or +77.99%
Maximum drawdown: $755.84 or 7.56%
Total trades: 67
Winning trades: 41.79% (28/67)
Profit factor: 3.825
NVDA (15-minute timeframe)
January 3, 2000 – November 17, 2025
Total net profit: $11,828.56 or +118.29%
Maximum drawdown: $1,275.43 or 8.06%
Total trades: 466
Winning trades: 28.11% (131/466)
Profit factor: 2.033
NVDA (30-minute timeframe)
January 3, 2000 – November 17, 2025
Total net profit: $12,203.21 or +122.03%
Maximum drawdown: $1,661.86 or 10.35%
Total trades: 245
Winning trades: 28.98% (71/245)
Profit factor: 2.291
NVDA (45-minute timeframe)
January 3, 2000 – November 17, 2025
Total net profit: $16,793.48 or +167.93%
Maximum drawdown: $1,458.81 or 8.40%
Total trades: 172
Winning trades: 33.14% (57/172)
Profit factor: 2.927

Logarithmic Regression AlternativeLogarithmic regression is typically used to model situations where growth or decay accelerates rapidly at first and then slows over time. Bitcoin is a good example.
𝑦 = 𝑎 + 𝑏 * ln(𝑥)
With this logarithmic regression (log reg) formula 𝑦 (price) is calculated with constants 𝑎 and 𝑏, where 𝑥 is the bar_index .
Instead of using the sum of log x/y values, together with the dot product of log x/y and the sum of the square of log x-values, to calculate a and b, I wanted to see if it was possible to calculate a and b differently.
In this script, the log reg is calculated with several different assumed a & b values, after which the log reg level is compared to each Swing. The log reg, where all swings on average are closest to the level, produces the final 𝑎 & 𝑏 values used to display the levels.
🔶 USAGE
The script shows the calculated logarithmic regression value from historical swings, provided there are enough swings, the price pattern fits the log reg model, and previous swings are close to the calculated Top/Bottom levels.
When the price approaches one of the calculated Top or Bottom levels, these levels could act as potential cycle Top or Bottom.
Since the logarithmic regression depends on swing values, each new value will change the calculation. A well-fitted model could not fit anymore in the future.
Swings are based on Weekly bars. A Top Swing, for example, with Swing setting 30, is the highest value in 60 weeks. Thirty bars at the left and right of the Swing will be lower than the Top Swing. This means that a confirmation is triggered 30 weeks after the Swing. The period will be automatically multiplied by 7 on the daily chart, where 30 becomes 210 bars.
Please note that the goal of this script is not to show swings rapidly; it is meant to show the potential next cycle's Top/Bottom levels.
🔹 Multiple Levels
The script includes the option to display 3 Top/Bottom levels, which uses different values for the swing calculations.
Top: 'high', 'maximum open/close' or 'close'
Bottom: 'low', 'minimum open/close' or 'close'
These levels can be adjusted up/down with a percentage.
Lastly, an "Average" is included for each set, which will only be visible when "AVG" is enabled, together with both Top and Bottom levels.
🔹 Notes
Users have to check the validity of swings; the above example only uses 1 Top Swing for its calculations, making the Top level unreliable.
Here, 1 of the Bottom Swings is pretty far from the bottom level, changing the swing settings can give a more reliable bottom level where all swings are close to that level.
Note the display was set at "Logarithmic", it can just as well be shown as "Regular"
In the example below, the price evolution does not fit the logarithmic regression model, where growth should accelerate rapidly at first and then slows over time.
Please note that this script can only be used on a daily timeframe or higher; using it at a lower timeframe will show a warning. Also, it doesn't work with bar-replay.
🔶 DETAILS
The code gathers data from historical swings. At the last bar, all swings are calculated with different a and b values. The a and b values which results in the smallest difference between all swings and Top/Bottom levels become the final a and b values.
The ranges of a and b are between -20.000 to +20.000, which means a and b will have the values -20.000, -19.999, -19.998, -19.997, -19.996, ... -> +20.000.
As you can imagine, the number of calculations is enormous. Therefore, the calculation is split into parts, first very roughly and then very fine.
The first calculations are done between -20 and +20 (-20, -19, -18, ...), resulting in, for example, 4.
The next set of calculations is performed only around the previous result, in this case between 3 (4-1) and 5 (4+1), resulting in, for example, 3.9. The next set goes even more in detail, for example, between 3.8 (3.9-0.1) and 4.0 (3.9 + 0.1), and so on.
1) -20 -> +20 , then loop with step 1 (result (example): 4 )
2) 4 - 1 -> 4 +1 , then loop with step 0.1 (result (example): 3.9 )
3) 3.9 - 0.1 -> 3.9 +0.1 , then loop with step 0.01 (result (example): 3.93 )
4) 3.93 - 0.01 -> 3.93 +0.01, then loop with step 0.001 (result (example): 3.928)
This ensures complicated calculations with less effort.
These calculations are done at the last bar, where the levels are displayed, which means you can see different results when a new swing is found.
Also, note that this indicator has been developed for a daily (or higher) timeframe chart.
🔶 SETTINGS
Three sets
High/Low
• color setting
• Swing Length settings for 'High' & 'Low'
• % adjustment for 'High' & 'Low'
• AVG: shows average (when both 'High' and 'Low' are enabled)
Max/Min (maximum open/close, minimum open/close)
• color setting
• Swing Length settings for 'Max' & 'Min'
• % adjustment for 'Max' & 'Min'
• AVG: shows average (when both 'Max' and 'Min' are enabled)
Close H/Close L (close Top/Bottom level)
• color setting
• Swing Length settings for 'Close H' & 'Close L'
• % adjustment for 'Close H' & 'Close L'
• AVG: shows average (when both 'Close H' and 'Close L' are enabled)
Show Dashboard, including Top/Bottom levels of the desired source and calculated a and b values.
Show Swings + Dot size

Sentinel Market Structure [JOAT]
Sentinel Market Structure - Smart Money Structure Analysis
Introduction and Purpose
Sentinel Market Structure is an open-source overlay indicator that identifies swing highs/lows, tracks market structure (HH/HL/LH/LL), detects Break of Structure (BOS) and Change of Character (CHoCH) signals, and marks order blocks. The core problem this indicator solves is that retail traders often miss structural shifts that smart money traders use to identify trend changes.
This indicator addresses that by automatically tracking market structure and alerting traders to key structural breaks that often precede significant moves.
Why These Components Work Together
Each component provides different structural information:
1. Swing Detection - Identifies significant pivot highs and lows. These are the building blocks of market structure.
2. Structure Labels (HH/HL/LH/LL) - Classifies each swing relative to the previous swing. Higher Highs + Higher Lows = uptrend. Lower Highs + Lower Lows = downtrend.
3. Break of Structure (BOS) - Identifies when price breaks a swing level in the direction of the trend. This is a continuation signal.
4. Change of Character (CHoCH) - Identifies when price breaks a swing level against the trend. This is a potential reversal signal.
5. Order Blocks - Marks the last opposing candle before an impulse move. These zones often act as future support/resistance.
How the Detection Works
Swing Detection:
bool swingHighDetected = high == ta.highest(high, swingLength * 2 + 1)
bool swingLowDetected = low == ta.lowest(low, swingLength * 2 + 1)
BOS vs CHoCH Logic:
// BOS: Break in direction of trend (continuation)
bool bullishBOS = close > lastSwingHigh and marketTrend >= 0
// CHoCH: Break against trend (reversal signal)
bool bullishCHOCH = close > lastSwingHigh and marketTrend < 0
Order Block Detection:
bool bullOB = close < open and // Previous candle bearish
close > open and // Current candle bullish
close > high and // Breaking above
(high - low) > ta.atr(14) * 1.5 // Strong impulse
Signal Types
HH (Higher High) - Swing high above previous swing high (bullish structure)
HL (Higher Low) - Swing low above previous swing low (bullish structure)
LH (Lower High) - Swing high below previous swing high (bearish structure)
LL (Lower Low) - Swing low below previous swing low (bearish structure)
BOS↑/BOS↓ - Break of structure in trend direction (continuation)
CHoCH↑/CHoCH↓ - Change of character against trend (potential reversal)
Dashboard Information
Trend - Current market bias (BULLISH/BEARISH/NEUTRAL)
Swing High - Last swing high price with HH/LH label
Swing Low - Last swing low price with HL/LL label
Structure - Current structure state (HH+HL, LH+LL, etc.)
Price - Price position relative to structure
How to Use This Indicator
For Trend Following:
1. Identify trend using structure (HH+HL = uptrend, LH+LL = downtrend)
2. Enter on BOS signals in trend direction
3. Use swing levels for stop placement
For Reversal Trading:
1. Watch for CHoCH signals (break against trend)
2. Confirm with order block formation
3. Enter on retest of order block zone
For Risk Management:
1. Place stops beyond swing highs/lows
2. Use structure lines as trailing stop references
3. Exit when CHoCH signals against your position
Input Parameters
Swing Detection Length (5) - Bars on each side for pivot detection
Show Swing High/Low Points (true) - Toggle swing markers
Show BOS/CHoCH (true) - Toggle structural break signals
Show Structure Lines (true) - Toggle horizontal swing lines
Show Order Blocks (true) - Toggle order block zones
Zone Extension (50) - How far order block boxes extend
Timeframe Recommendations
15m-1H: Good for intraday structure analysis
4H-Daily: Best for swing trading structure
Lower timeframes require smaller swing detection length
Limitations
Swing detection has inherent lag (needs confirmation bars)
Not all BOS/CHoCH signals lead to continuation/reversal
Order block zones are simplified (not full ICT methodology)
Structure analysis is subjective - different traders see different swings
Open-Source and Disclaimer
This script is published as open-source under the Mozilla Public License 2.0 for educational purposes.
This indicator does not constitute financial advice. Market structure analysis does not guarantee trade outcomes. Always use proper risk management.
- Made with passion by officialjackofalltrades

TRAPPER TRENDLINES — PRICEDraws dynamic trendlines on price by connecting the two most recent confirmed swing points (highs to highs for resistance, lows to lows for support). Swings are defined with a symmetric left/right pivot window. Old anchors are ignored so lines stay attached to current structure. Optional break alerts are included.
How it works (plain language)
Pivots: A bar is a swing high (or low) only if it’s the most extreme point compared with a set number of bars on the left and the right.
Lines:
Support connects the last two confirmed swing lows.
Resistance connects the last two confirmed swing highs.
Lines can be extended right only or both left & right (toggle).
Recency filter: Only swings within the last N bars are kept. This avoids anchoring to very old pivots far from current price.
Alerts: Optional alerts fire when price closes above resistance or below support.
Inputs
Auto Settings
Auto pivot size by chart timeframe: When ON, the script picks a pivot size suitable for the current timeframe (you can scale it with Auto pivot multiplier). When OFF, the manual left/right inputs are used.
Auto pivot multiplier: Scales the auto pivot size (e.g., 1.5 makes pivots stricter).
Manual Pivots
Pivot Left / Pivot Right: Bars to the left/right required to confirm a swing. Example: Left=50 & Right=50 keeps only major swings.
Recency Filter
Use last N bars for pivots: Swings older than this window are discarded so trendlines stay relevant to current price.
Style
Support/Resistance color: Line colors.
Extend Left & Right: When ON, both endpoints extend; when OFF, lines extend to the right only.
Alerts
Enable Break Alerts: When ON, alert conditions are exposed:
Price: Break Up — close above resistance.
Price: Break Down — close below support.
Suggested settings
Higher timeframes (4H / 1D / 1W):
Manual: Pivot Left = 50, Pivot Right = 50, Use last N bars = 400–800.
Or enable Auto with Auto pivot multiplier = 1.0–1.5.
Intraday (15m / 30m / 1H):
Manual: Pivot Left = 30, Pivot Right = 30, Use last N bars = 300–500.
Or enable Auto with multiplier ≈ 1.0–1.2.
Pairing with RSI for confluence/divergence
This tool is designed to pair with a companion TRAPPER TRENDLINES — RSI (or any RSI trendline script):
To mirror swings, set RSI Pivot Lookback equal to the price Pivot Left/Right you use here.
Example: Price = 50/50 → RSI Pivot Lookback = 50.
Keep RSI at Length 14 with 70/30 channel for clarity.
Confluence: Price holds/rejects at a trendline while RSI trendline agrees.
Divergence: Price prints a higher high (resistance line rising) while RSI prints a lower high (RSI resistance line falling), or vice-versa for lows. Matching pivot windows makes these relationships clear and reduces false signals.
Reading the signals
Trendline touch/hold: Potential reaction area; wait for follow-through.
Break Up / Break Down (alerts): Close beyond the line. Consider retest behavior, higher-timeframe context, and volume/RSI confirmation.
Notes & limitations
Pivots require future bars to confirm (by design). Lines update as pivots confirm.
“Use last N bars” purposely ignores very old swings. Increase this value if you need legacy structure.
Lines are based on two most recent confirmed pivots per side; rapidly changing markets can replace anchors as new swings confirm.
This is a visual/analytical tool. No strategy entries/exits or performance claims are provided.
Compliance
This script is for educational purposes only and does not constitute financial advice. Trading involves risk. Past results do not guarantee future outcomes. No promises of profit, accuracy, or performance are made.
Alerts (titles/messages)
Price: Break Up — “Price broke above resistance trendline.”
Price: Break Down — “Price broke below support trendline.”
Quick start
Add the indicator to your chart.
Choose Auto or set Pivot Left/Right manually.
Set Use last N bars for how far back to consider swings.
Toggle Extend Left & Right to your preference.
(Optional) Add your RSI trendline indicator and match Pivot Lookback with your price pivot size for clean confluence/divergence.
Enable alerts if you want notifications on breaks.
