text_utilsLibrary "text_utils"
a set of functions to handle placeholder in texts
add_placeholder(list, key, value)
add a placehodler key and value to a local list
Parameters:
list : - reference to a local string array containing all placeholders, add string list = array.new_string(0) to your code
key : - a string representing the placeholder in a text, e.g. '{ticker}'
value : - a string representing the value of the placeholder e.g. 'EURUSD'
Returns: void
add_placeholder(list, key, value, format)
add a placehodler key and value to a local list
Parameters:
list : - reference to a local string array containing all placeholders, add string list = array.new_string(0) to your code
key : - a string representing the placeholder in a text, e.g. '{ticker}'
value : - an integer value representing the value of the placeholder e.g. 10
format : - optional format string to be used when converting integer value to string, see str.format() for details, must contain '{0}'
Returns: void
add_placeholder(list, key, value, format)
add a placehodler key and value to a local list
Parameters:
list : - reference to a local string array containing all placeholders, add string list = array.new_string(0) to your code
key : - a string representing the placeholder in a text, e.g. '{ticker}'
value : - a float value representing the value of the placeholder e.g. 1.5
format : - optional format string to be used when converting float value to string, see str.format() for details, must contain '{0}'
Returns: void
replace_all_placeholder(list, text_to_covert)
replace all placeholder keys with their value in a given text
Parameters:
list : - reference to a local string array containing all placeholders
text_to_covert : - a text with placeholder keys before their are replaced by their values
Returns: text with all replaced placeholder keys
Поиск скриптов по запросу "text"
TextLibLibrary "TextLib"
TODO: Library with text / string functions
addText(before, value, separator)
Parameters:
before (string)
value (string)
separator (string)
addText(before, value1, value2, separator)
Parameters:
before (string)
value1 (string)
value2 (string)
separator (string)

TextLibrary "Text"
library to format text in different fonts or cases plus a sort function.
🔸 Credits and Usage
This library is inspired by the work of three authors (in chronological order of publication date):
Unicode font function - JD - Duyck
UnicodeReplacementFunction - wlhm
font - kaigouthro
🔹 Fonts
Besides extra added font options, the toFont(fromText, font) method uses a different technique. On the first runtime bar (whether it is barstate.isfirst , barstate.islast , or between) regular letters and numbers and mapped with the chosen font. After this, each character is replaced using the build-in key - value pair map function .
Also an enum Efont is included.
Note: Some fonts are not complete, for example there isn't a replacement for every character in Superscript/Subscript.
Example of usage (besides the included table example):
import fikira/Text/1 as t
i_font = input.enum(t.Efont.Blocks)
if barstate.islast
sentence = "this sentence contains words"
label.new(bar_index, 0, t.toFont(fromText = sentence, font = str.tostring(i_font)), style=label.style_label_lower_right)
label.new(bar_index, 0, t.toFont(fromText = sentence, font = "Circled" ), style=label.style_label_lower_left )
label.new(bar_index, 0, t.toFont(fromText = sentence, font = "Wiggly" ), style=label.style_label_upper_right)
label.new(bar_index, 0, t.toFont(fromText = sentence, font = "Upside Latin" ), style=label.style_label_upper_left )
🔹 Cases
The script includes a toCase(fromText, case) method to transform text into snake_case, UPPER SNAKE_CASE, kebab-case, camelCase or PascalCase, as well as an enum Ecase .
Example of usage (besides the included table example):
import fikira/Text/1 as t
i_case = input.enum(t.Ecase.camel)
if barstate.islast
sentence = "this sentence contains words"
label.new(bar_index, 0, t.toCase(fromText = sentence, case = str.tostring(i_case)), style=label.style_label_lower_right)
label.new(bar_index, 0, t.toCase(fromText = sentence, case = "snake_case" ), style=label.style_label_lower_left )
label.new(bar_index, 0, t.toCase(fromText = sentence, case = "PascalCase" ), style=label.style_label_upper_right)
label.new(bar_index, 0, t.toCase(fromText = sentence, case = "SNAKE_CASE" ), style=label.style_label_upper_left )
🔹 Sort
The sort(strings, order, sortByUnicodeDecimalNumbers) method returns a sorted array of strings.
strings: array of strings, for example words = array.from("Aword", "beyond", "Space", "salt", "pepper", "swing", "someThing", "otherThing", "12345", "_firstWord")
order: "asc" / "desc" (ascending / descending)
sortByUnicodeDecimalNumbers: true/false; default = false
_____
• sortByUnicodeDecimalNumbers: every Unicode character is linked to a Unicode Decimal number ( wikipedia.org/wiki/List_of_Unicode_characters ), for example:
1 49
2 50
3 51
...
A 65
B 66
...
S 83
...
_ 95
` 96
a 97
b 98
...
o 111
p 112
q 113
r 114
s 115
...
This means, if we sort without adjusting ( sortByUnicodeDecimalNumbers = true ), in ascending order, the letter b (98 - small) would be after S (83 - Capital).
By disabling sortByUnicodeDecimalNumbers , Capital letters are intermediate transformed to str.lower() after which the Unicode Decimal number is retrieved from the small number instead of the capital number. For example S (83) -> s (115), after which the number 115 is used to sort instead of 83.
Example of usage (besides the included table example):
import fikira/Text/1 as t
if barstate.islast
aWords = array.from("Aword", "beyond", "Space", "salt", "pepper", "swing", "someThing", "otherThing", "12345", "_firstWord")
label.new(bar_index, 0, str.tostring(t.sort(strings= aWords, order = 'asc' , sortByUnicodeDecimalNumbers = false)), style=label.style_label_lower_right)
label.new(bar_index, 0, str.tostring(t.sort(strings= aWords, order = 'desc', sortByUnicodeDecimalNumbers = false)), style=label.style_label_lower_left )
label.new(bar_index, 0, str.tostring(t.sort(strings= aWords, order = 'asc' , sortByUnicodeDecimalNumbers = true )), style=label.style_label_upper_right)
label.new(bar_index, 0, str.tostring(t.sort(strings= aWords, order = 'desc', sortByUnicodeDecimalNumbers = true )), style=label.style_label_upper_left )
🔸 Methods/functions
method toFont(fromText, font)
toFont : Transforms text into the selected font
Namespace types: series string, simple string, input string, const string
Parameters:
fromText (string)
font (string)
Returns: `fromText` transformed to desired `font`
method toCase(fromText, case)
toCase : formats text to snake_case, UPPER SNAKE_CASE, kebab-case, camelCase or PascalCase
Namespace types: series string, simple string, input string, const string
Parameters:
fromText (string)
case (string)
Returns: `fromText` formatted to desired `case`
method sort(strings, order, sortByUnicodeDecimalNumbers)
sort : sorts an array of strings, ascending/descending and by Unicode Decimal numbers or not.
Namespace types: array
Parameters:
strings (array)
order (string)
sortByUnicodeDecimalNumbers (bool)
Returns: Sorted array of strings

Textmate Language for Pine Script v5 2023-05Updated Syntax Colouring to include UDT and methods and libraries, and a few other extras.
Remember to Update when new built in language features are introduced.
This will not be Maintained frequently, it's an update to present times

Text Price to Chart By MercalonaThis script was developed to visualize ideas of trades sent by groups on the internet. For example (Telegram, Whatsapp, Discord).
This is a trade idea:
XAUUSD BUY
Entry: 1766.40
SL: 1757.40
TP1: 1769.40
TP2: 1772.40
TP3: 1776.40
TP4: 1780.40
TP5: 1800
So what needs to be done?
1. Open this script in the "GBPNZD" chart.
2. Click on "configuration"
3. Copy the message.
4. Paste the message in the "Prices" field
5. Click "Ok"
What is the end result?
Then, if everything goes well, all lines compatible with the price informed in the message text will be displayed.
The lines can be green if the word "buy" or "Bought" exists, otherwise it will be red
It is also possible to configure 3 dates to be displayed on the graph.
Usually the first date is set to know the point that the entry was made in the trade.
Please feedback us.
We hope this helps you!

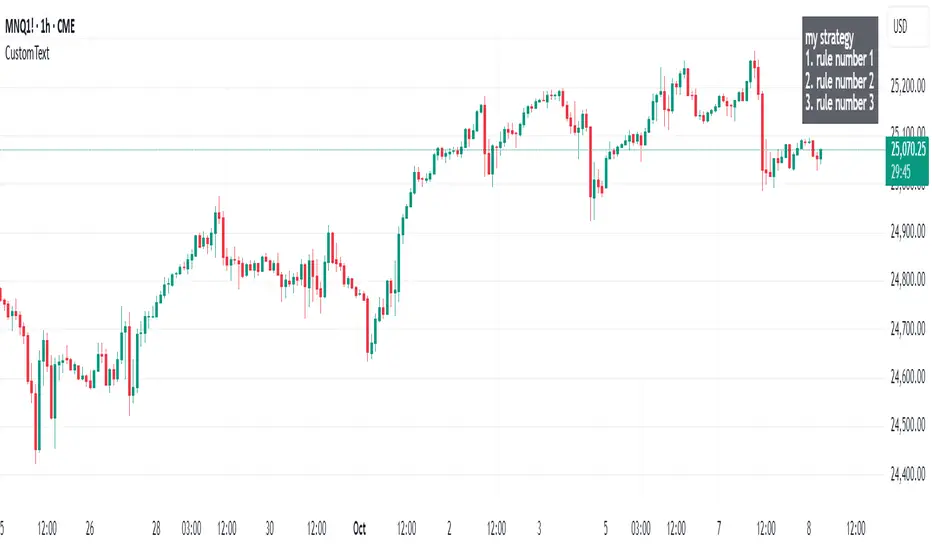
Custom Text Display📋 Custom Text Display - User Guide
Overview
This indicator allows you to display custom text anywhere on your TradingView chart with full control over appearance and positioning.
Features
📝 Text Settings
Custom Text: Write any text you want to display on your chart. Can be multiple lines.
Text Alignment: Choose how your text is aligned within the box
Left
Center
Right
Text Color: Pick any color for your text
Background Color: Choose the background color of the text box (includes transparency control)
Text Size: Select from 5 different text sizes
Tiny
Small
Normal
Large
Huge
📍 Position Settings
Table Position: Choose where the text box appears on your chart
Top Left
Top Center
Top Right
Bottom Left
Bottom Center
Bottom Right
Vertical Offset (0-20): Fine-tune the vertical position
0 = Default position (no offset)
Higher values = Move the text box further down
Use this to avoid overlapping with other indicators or chart elements
How to Use
Add the indicator to your TradingView chart
Open the settings by clicking the gear icon next to the indicator name
Enter your text in the "Custom Text" field
Customize appearance:
Choose your preferred colors for text and background
Select text size and alignment
Position the box:
Select one of the 6 main positions
Use "Vertical Offset" to fine-tune the exact position (add empty space above the text)
Click OK to apply changes
Use Cases
📊 Display trading notes or reminders
📈 Show key levels or targets
💡 Add strategy descriptions
⚠️ Display risk warnings
📝 Create custom labels for specific chart setups
🎯 Mark important price zones with descriptions
Tips
Use transparent backgrounds (adjust the transparency slider) for a cleaner look
Vertical Offset is useful when you have multiple indicators at the top/bottom and need to avoid overlap
Large/Huge text works well for important notes you want to see at a glance
Combine different text alignments with different positions for better layout control
Note: The text box updates in real-time as you change settings, so you can preview your changes before applying them.
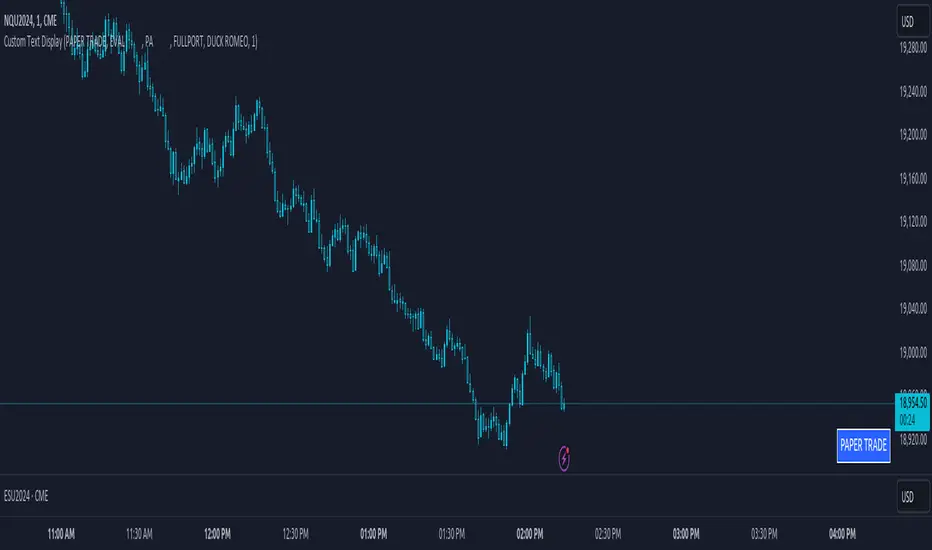
Custom Text DisplayThe "Custom Text Display" indicator allows users to display customizable text in a fixed position in the bottom-right corner of their chart. Each text entry can have its own color, which can be set in the indicator's settings. Follow these steps to set up and use the indicator effectively:
Adding the Indicator to Your Chart:
Apply the "Custom Text Display" indicator to your chart from the indicators list.
Configuring Text and Colors:
Open the settings for the indicator.
Enter the desired text for each of the five text fields labeled "Text 1", "Text 2", etc.
Choose a color for each text entry using the color pickers labeled "Color 1", "Color 2", etc.
Selecting the Active Text:
In the indicator settings, find the "Select Active Text" dropdown menu.
This menu offers six options: "0" (None), "1" (Text 1), "2" (Text 2), "3" (Text 3), "4" (Text 4), and "5" (Text 5).
Select the number corresponding to the text you want to activate. Only one text can be active at a time.
Viewing the Active Text on the Chart:
The selected active text will be displayed in the bottom-right corner of the chart with the corresponding background color.
If no text is selected (option "0"), no text will be displayed.
Motivational Text TableRelease Notes - Motivational Text Table Indicator v1.0
Standalone Indicator:
A new, standalone Pine Script v6 indicator that displays a motivational text table directly on the chart.
Customizable Text:
Users can set their own motivational message through the "Custom Motivational Text" input.
Configurable Appearance:
Change the text color and background color of the table.
Adjust the text size by choosing from "tiny", "small", "normal", "large", or "huge".
Select the table’s position on the chart from multiple preset locations (e.g., top_left, middle_center, bottom_right, etc.).
Static Display:
The table is drawn on the last bar, ensuring that the motivational text remains static during realtime updates.
User-Friendly Design:
The interface is simple and easy to customize, making it perfect for users who need a daily dose of motivation directly on their TradingView charts.
Enjoy your motivational boost on every chart!

NiGapo Notes / Remember Rules / Anchored TextThis is a notes indicator.
You can customize up to 15 lines.
You can use different textsize and customize the background and font color.
You can also disable/enable or choose different border width.

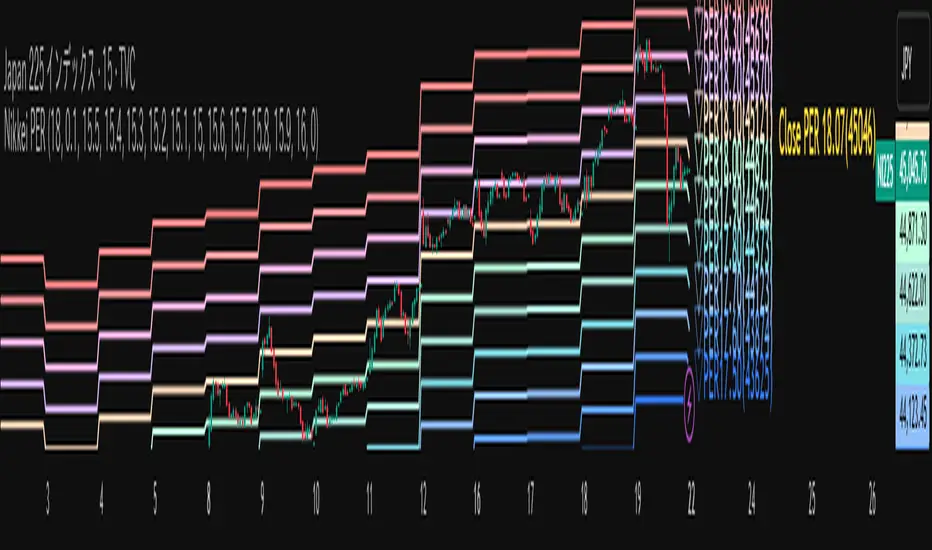
Nikkei PER Curve (EPS Text Area Input)
This indicator visualizes the PER levels of the Nikkei 225 based on the dates and EPS data entered in the text area.
By plotting multiple PER multiplier lines, it helps users to understand the following:
Potential support and resistance levels based on PER multipliers
Comparison between the current stock price and theoretical valuation levels
Observation of PER trends and detection of deviations from standard valuation levels
Trading Decisions:
When the stock price approaches a specific PER line, it can serve as a reference for support or resistance.
During intraday chart analysis, PER lines are drawn based on the most recent EPS, making them useful as reference levels even during market hours.
Valuation Analysis:
On daily charts, it helps to assess whether the Nikkei is overvalued or undervalued compared to historical levels, or to identify changes in valuation levels.
Risk Management:
The theoretical price lines based on PER can be used as reference points for stop-loss or profit-taking decisions.
Simple Data Input:
EPS data is entered in a text area, one line per date, in comma-separated format:
YYYY/MM/DD,EPS
YYYY/MM/DD,EPS
Multiple entries can be input by using line breaks between each date.
Note: Dates for which no candlestick exists in the chart will not be displayed.
This allows easy updating of PER lines without complex spreadsheets or external tools.
EPS Data Input: Manual input of date and EPS via the text area; supports multiple data entries.
PER Multiplier Lines:
For evenly spaced lines, simply set the central multiplier and the interval between lines. The indicator automatically generates 11 lines (center ±5 lines).
For non-even spacing or individual multiplier settings, you can choose to adjust each line.
Close PER Labels: Displays the PER of the close price relative to the current EPS.
Timeframe Limitation: Use on daily charts (1D) or lower. PER lines cannot be displayed on higher timeframes.
Label Customization: Allows adjustment of text size, color, and position.
EPS Parsing: The indicator reads the input text area line by line, splitting each line by a comma to obtain the date and EPS value.
Data Storage: The dates and EPS values are stored in arrays. These arrays allow the script to efficiently look up the latest EPS for any given date.
PER Calculation: For each chart bar, the indicator calculates the theoretical price for multiple PER multipliers using the formula:
Theoretical Price = EPS × PER multiplier
Line Plotting: PER lines are drawn at these calculated price levels. Labels are optionally displayed for the close price PER.
Date Matching: If a date from the EPS data does not exist as a candlestick on the chart, the corresponding PER line is not plotted.
PER lines are theoretical values: They serve as psychological reference points and do not always act as true support or resistance.
Market Conditions: Lines may be broken depending on market circumstances.
Accuracy of EPS Data: Be careful with EPS input errors, as incorrect data will result in incorrect PER curves.
Input Format: Dates and EPS must be correctly comma-separated and entered one per line. Dates with no corresponding candlestick on the chart will not be plotted. Incorrect formatting may prevent lines from displaying.
Reliability: No method guarantees success in trading; use in combination with backtesting and other technical analysis tools.
このインジケータは、入力した日付とEPSデータを基に日経225のPER水準を視覚化するものです
複数のPER倍率ラインを描画することで、以下を把握するのに役立ちます:
PER倍率に基づく潜在的なサポート・レジスタンス水準や目安
現在の株価と理論上の評価水準との比較
過去から現在までのPER推移の観察
トレード判断:
株価が特定の倍率のPERラインに近づいたとき、抵抗や支持の目安としての活用
日中足表示時は、前日(最新日)のEPSに基づいたPERラインを表示するように作成しているので、場中でも参考目安として使用可能
評価分析:
過去の推移と比較して日経が割高か割安か、またはPER評価水準が変化したかの確認
リスク管理:
PERに基づく理論価格ラインを、損切りや利確の目安としての利用
簡単なデータ入力:
EPSデータはテキストエリアに手動入力。1行につき1日付・EPSをカンマ区切りで記入します
例
2025/09/19,2492.85
2025/09/18,2497.43
行を改行することで複数データ入力が可能
注意: チャート上にローソク足が存在しない日付のデータは表示されません
表計算や外部ツールを使わずに倍率を掛けたPERラインの作成・更新が簡単に行える
PER倍率ライン:
等間隔ラインの場合、中心倍率と各ラインの間隔を設定するだけで、自動的に中心値±5本、計11本のラインを作成
等間隔以外や個別設定したい場合は で調整可能
終値PERラベル: 現在のEPSに対する終値PERを表示
時間足制限: 日足(1日足)以下で使用すること。高い時間足ではPERラインは表示できません
ラベルカスタマイズ: 文字サイズ、色、位置を調整可能
EPSデータの読み取り: 改行を検知し1日分のデータとして識別し、カンマで分割して日付とEPS値を取得
配列への格納: 日付とEPSを配列に格納し、各バーに対して最新のEPSを参照できるようにする
PER計算: 各バーに対して、以下の式で複数のPER倍率の理論価格を計算:
理論価格 = EPS × PER倍率
日付照合: EPSデータの日付がチャート上にローソク足として存在したら格納した配列からデータを取得。ローソク足が存在しない場合、そのPERラインは表示されない
ライン描画: 計算した価格にPERラインを描画。必要に応じて終値PERラベルも表示。
PERラインは理論値であり心理的目安として機能することがありますが、必ずしも機能する訳ではない
その為、過去の検証や他のテクニカル指標と併用推奨
市況によってはラインを無視するように突破する可能性ことがある
EPSデータの入力ミスに注意すること。誤入力するとPER曲線が誤表示される
日付とEPSの入力は1行ずつ、正しい位置でカンマ区切りをいれること
ローソク足が存在しない日付のデータは正しく表示されないことがあるので注意
誤った入力形式ではラインが表示されない場合がある
Custom Moving Average Ribbon with EMA Table & Text ColorComprehensive Description of the Custom Moving Average Ribbon with EMA Table & Text Color
The Custom Moving Average Ribbon with EMA Table & Text Color is a highly flexible and customizable indicator designed for traders who use multiple moving averages to assess trends, strength, and potential market reversals. It plots up to 8 moving averages (either SMA, EMA, WMA, or VWMA) on the price chart and displays a table summarizing the moving averages’ values, periods, and colors. The table also allows for the customization of the text color, making it easier to align with your chart’s theme or preference.
Key Features:
Multiple Moving Averages: You can display up to 8 moving averages (MA), each of which can be customized in terms of:
Type: SMA (Simple Moving Average), EMA (Exponential Moving Average), WMA (Weighted Moving Average), or VWMA (Volume-Weighted Moving Average).
Period: Each moving average has a user-defined period, which allows for flexibility depending on your trading style (short-term, medium-term, or long-term).
Enable/Disable: Each moving average can be independently enabled or disabled based on your preference.
Moving Average Ribbon: The indicator visualizes multiple moving averages as a ribbon, giving traders insight into the market's underlying trend. The interaction between these moving averages provides essential signals:
Uptrend: Shorter-term MAs above longer-term MAs, all sloping upward.
Downtrend: Shorter-term MAs below longer-term MAs, sloping downward.
Consolidation: MAs tightly packed, indicating low volatility or a sideways market.
Customizable Table: The indicator includes a table that displays:
The Name of each moving average (e.g., MA 1, MA 2, etc.).
The Period used for each moving average.
The Current Value of each moving average.
Color Coding for easier visual identification on the chart.
Text Color Customization: You can change the text color in the table to match your chart style or to ensure high visibility.
Responsive Design: This indicator works on any time frame, whether you're a day trader, swing trader, or long-term investor, and the table adjusts dynamically as new data comes in.
How to Use the Indicator
a) Trend Identification
The Custom Moving Average Ribbon helps in identifying trends and their strength. Here’s how you can interpret the plotted moving averages:
Uptrend (Bullish):
If the shorter-term moving averages (e.g., 5-period, 10-period) are above the longer-term moving averages (e.g., 50-period, 200-period), and all the MAs are sloping upward, it suggests a strong bullish trend.
The greater the separation between the moving averages, the stronger the uptrend.
Use the table to quickly verify the current value of each MA and confirm that the price is staying above most or all of the MAs.
Downtrend (Bearish):
When shorter-term moving averages are below the longer-term moving averages and all MAs are sloping downward, this indicates a bearish trend.
Greater separation between MAs indicates a stronger downtrend.
Neutral/Consolidating Market:
If the MAs are tightly packed and frequently crossing each other, the market is likely consolidating, and a strong trend is not in play.
In these situations, it’s better to wait for a clearer signal before taking any positions.
b) Reversal Signals
Golden Cross: When a short-term moving average (e.g., 50-period) crosses above a long-term moving average (e.g., 200-period), this is considered a bullish signal, suggesting a possible upward trend.
Death Cross: When a short-term moving average crosses below a long-term moving average, it’s considered a bearish signal, indicating a potential downward trend.
c) Using the Table for Quick Reference
The table allows you to monitor:
The current price value relative to each moving average. If the price is above most MAs, the market is likely in an uptrend, and if below, in a downtrend.
Changes in MA values: If you see values of shorter-term MAs moving closer to or crossing longer-term MAs, this could indicate a weakening trend or a potential reversal.
How to Combine this Indicator with Other Indicators for a Solid Strategy
The Custom Moving Average Ribbon is powerful on its own but can be enhanced when combined with other technical indicators to form a comprehensive trading strategy.
1. Combining with RSI (Relative Strength Index)
How It Works: RSI is a momentum oscillator that measures the speed and change of price movements, typically over 14 periods. It ranges from 0 to 100, with readings above 70 considered overbought and below 30 considered oversold.
Strategy:
Overbought in an Uptrend: If the moving average ribbon indicates an uptrend but the RSI shows the market is overbought (RSI > 70), it could signal a pullback or correction is imminent.
Oversold in a Downtrend: If the moving average ribbon indicates a downtrend but the RSI shows oversold conditions (RSI < 30), a bounce or reversal may be on the horizon.
2. Combining with MACD (Moving Average Convergence Divergence)
How It Works: MACD tracks the difference between two exponential moving averages, typically the 12-period and 26-period EMAs. It generates buy and sell signals based on crossovers and divergences.
Strategy:
Trend Confirmation: Use the MACD to confirm the direction and momentum of the trend indicated by the moving average ribbon. For example, if the MACD line crosses above the signal line while the shorter-term MAs are above the longer-term MAs, it confirms strong bullish momentum.
Divergences: Watch for divergences between price action and MACD. If price is making higher highs but MACD is making lower highs, it could signal a weakening trend, which you can verify using the moving averages.
3. Combining with Bollinger Bands
How It Works: Bollinger Bands plot two standard deviations above and below a moving average, typically the 20-period SMA. The bands widen during periods of high volatility and contract during periods of low volatility.
Strategy:
Breakout or Reversal: If price action moves above the upper Bollinger Band while the shorter-term MAs are crossing above the longer-term MAs, it confirms a strong breakout. Conversely, if price touches or falls below the lower Bollinger Band and the shorter MAs start crossing below the longer-term MAs, it indicates a potential breakdown.
Mean Reversion: In sideways markets, when the moving averages are tightly packed, Bollinger Bands can help spot mean reversion opportunities (buy near the lower band, sell near the upper band).
4. Combining with Volume Indicators
How It Works: Volume is a crucial confirmation indicator for any trend or breakout. Combining volume with the moving average ribbon can enhance your strategy.
Strategy:
Trend Confirmation: If the price breaks above the moving averages and is accompanied by high volume, it confirms a strong breakout. Similarly, if price breaks below the moving averages on high volume, it signals a strong downtrend.
Divergence: If price continues to trend in one direction but volume decreases, it could indicate a weakening trend, helping you prepare for a reversal.
Example Strategies Using the Indicator
Trend-Following Strategy:
Use the moving average ribbon to identify the main trend.
Combine with MACD or RSI for confirmation of momentum.
Enter trades when the shorter-term MAs confirm the trend and the confirmation indicator (MACD or RSI) aligns with the trend.
Exit trades when the moving averages start converging or when your confirmation indicator shows signs of reversal.
Reversal Strategy:
Wait for significant crossovers in the moving averages (Golden Cross or Death Cross).
Confirm the reversal with divergence in MACD or RSI.
Use Bollinger Bands to fine-tune your entry and exit points based on overbought/oversold conditions.
Conclusion
The Custom Moving Average Ribbon with EMA Table & Text Color indicator provides a robust framework for traders looking to use multiple moving averages to gauge trend direction, strength, and potential reversals. By combining it with other technical indicators like RSI, MACD, Bollinger Bands, and volume, you can develop a solid trading strategy that enhances accuracy, reduces false signals, and maximizes profit potential in various market conditions.
This indicator offers high flexibility with customization options, making it suitable for traders of all levels and strategies. Whether you're trend-following, scalping, or swing trading, this tool provides invaluable insights into market movements.

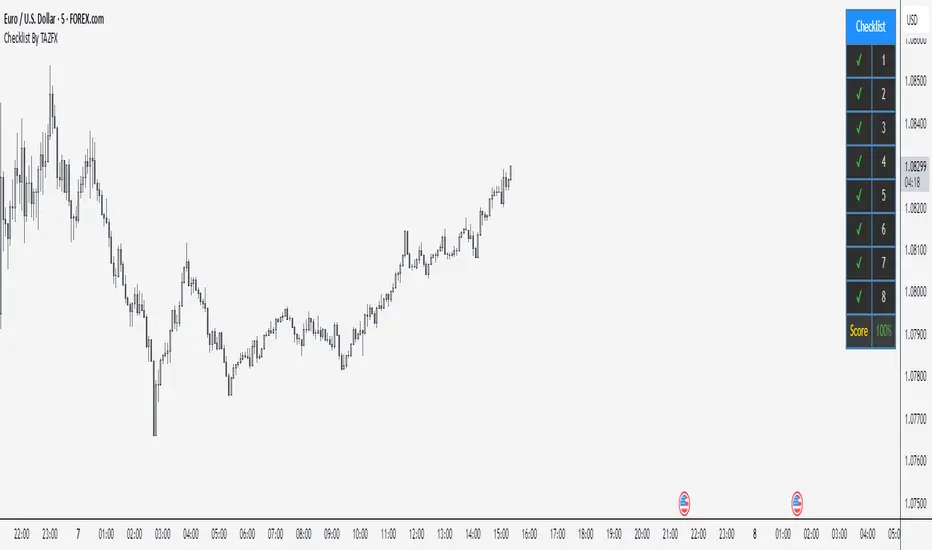
Checklist By TAZFX with Trade ScoreTrading Checklist is a customizable indicator designed for traders who want to stay disciplined and stick to their trading rules. Using this indicator, you can easily create and display your own personalized checklist of trading rules directly on your TradingView chart.
1. Customizable Settings:
• Positioning : Place the table in one of nine positions on the chart (e.g., bottom left, top right).
• Header : Modify the banner text, size, and color.
• Row Content : Define text for each row and control visibility.
• Appearance : Adjust text and background colors.
2. Checklist Table:
•Displays up to 8 rows with checkboxes (✅/❌) and custom labels for trade evaluation.
•Useful for tracking whether specific trade conditions or rules are met.
3. Trade Score Calculation:
•The Trade Score is a percentage that shows how many of your checklist items are checked compared to the total visible items.
Daily TQQQ Trend Strategy (Ultra-Discreet Text Signals)✅ TradingView Description (Professional + Clean)
Daily TQQQ Trend Strategy (Ultra-Discreet Text Signals)
This indicator provides clean, minimalistic trend-following signals designed for traders who want confirmation without cluttering the chart.
Instead of using arrows, boxes, or colored shapes, this script prints tiny text labels (“Buy – trend strong” / “Sell – trend weakening”) directly on the price chart. These messages are intentionally discreet so they do not interfere with existing indicators, automated systems, or visually busy setups.
🔍 How It Works
The indicator analyzes the market using three well-established components:
1. Trend Direction (EMA 8 & EMA 20)
• Buy condition: price above both EMAs
• Sell condition: price below both EMAs
2. Momentum Confirmation (MACD)
• Buy: MACD line > Signal line
• Sell: MACD line < Signal line
3. Strength Filter (RSI 14)
• Buy: RSI above 50 (bullish strength)
• Sell: RSI below 50 (weakening momentum)
Only when all conditions align does the indicator print a discreet buy or sell label.
🧭 Signal Types
Buy – trend strong
Appears below the candle when overall trend, momentum, and strength all turn bullish.
Sell – trend weakening
Appears above the candle when trend and momentum show weakness and downside pressure increases.

CM_Williams_Vix_Fix_V3_Upper_Text PlotsWilliams Vix Fix Text Plots! Alert Capable!
Use With Lower Indicator or as Single Indicator!
Has Text Plots For All Plot Types Lower Indicator Uses.
To Get Lower Indicator:
Info On Lower Indicator - Discussion:

Bollinger Bottom + Middle Lines with Inline TextThis script visualizes key Bollinger Band levels based on two different SMAs (20 & 50 periods), with clear labeling and a smart price table.
🔸 Features:
Draws lower and middle Bollinger Band lines for both SMA(20) and SMA(50)
Inline text at the end of each line instead of default labels (cleaner view)
A dynamic table in the top-right corner, sorted from highest to lowest level
Color-coded rows:
▪️ Orange → BB20 Mid & BB20 Lower
▪️ Green → BB50 Mid & BB50 Lower
Auto-updates each bar without cluttering the chart
✅ Ideal for identifying technical accumulation zones
✅ Suitable for investors using scaling-in strategies or mean-reversion logic

Custom Text BoxThis is an indicator to have text anchored in any symbol or chart, keep your ules at sight so is easy for you to follow, have your Bias too.

StyleLibraryLibrary "StyleLibrary"
A small library of Pine Script functions that return built-in style variables.
method sizeStyle(size)
Takes a `string` that returns the corresponding built-in size style variable.
Namespace types: series string, simple string, input string, const string
Parameters:
size (string) : A `string` representing a built-in size style: `"Tiny"`, `"Small"`, `"Normal"`, `"Large"`,
`"Huge"`, `"Auto"`.
Returns: The respective built-in size style variable.
method sizeStyle(size)
Takes a `sizeStyle` that returns the corresponding built-in size style variable.
Namespace types: series sizeStyle
Parameters:
size (series sizeStyle) : A `sizeStyle` representing a built-in size style variable.
Returns: The respective built-in size style variable.
method lineStyle(style)
Takes a `string` that returns the corresponding built-in line style variable.
Namespace types: series string, simple string, input string, const string
Parameters:
style (string) : A `string` representing a built-in line style: `"Dashed"`, `"Dotted"`, `"Solid"`.
Returns: The respective built-in line style variable.
method lineStyle(style)
Takes a `lineStyle` that returns the corresponding built-in line style variable.
Namespace types: series lineStyle
Parameters:
style (series lineStyle) : A `lineStyle` representing a built-in line style variable.
Returns: The respective built-in line style variable.
method labelStyle(style)
Takes a `string` that returns the corresponding built-in label style variable.
Namespace types: series string, simple string, input string, const string
Parameters:
style (string) : A `string` representing a built-in label style:
`"Arrow Down"`, `"Arrow Up"`, `"Circle"`, `"Cross"`, `"Diamond"`, `"Flag"`,
`"Label Center"`, `"Label Down"`, `"Label Left"`, `"Label Lower Left"`,
`"Label Lower Right"`, `"Label Right"`, `"Label Up"`, `"Label Upper Left"`,
`"Label Upper Right"`, `"None"`, `"Square"`, `"Text Outline"`, `"Triangle Down"`,
`"Triangle Up"`, `"XCross"`.
Returns: The respective built-in label style variable.
method labelStyle(style)
Takes a `labelStyle` that returns the corresponding built-in label style variable.
Namespace types: series labelStyle
Parameters:
style (series labelStyle) : A `labelStyle` representing a built-in label style variable.
Returns: The respective built-in label style variable.
method fontStyle(font)
Takes a `string` that returns the corresponding built-in font style variable.
Namespace types: series string, simple string, input string, const string
Parameters:
font (string) : A `string` representing a built-in font style: `"Default"`, `"Monospace"`.
Returns: The respective built-in font style variable.
method positionStyle(position)
Takes a `string` that returns the corresponding built-in position style variable.
Namespace types: series string, simple string, input string, const string
Parameters:
position (string) : A `string` representing a built-in position style:
`"Bottom Center", `"Bottom Left", `"Bottom Right", `"Middle Center", `"Middle Left",
`"Middle Right", `"Top Center", `"Top Left", `"Top Right".
Returns: The respective built-in position style variable.
method displayStyle(display)
Takes a `simple string` that returns the corresponding built-in display style variable.
Namespace types: simple string, input string, const string
Parameters:
display (simple string) : A `simple string` representing a built-in display style: `"All"`, `"Data Window"`,
`"None"`, `"Pane"`, `"Price Scale"`, `"Status Line"`.
Returns: The respective built-in display style variable.

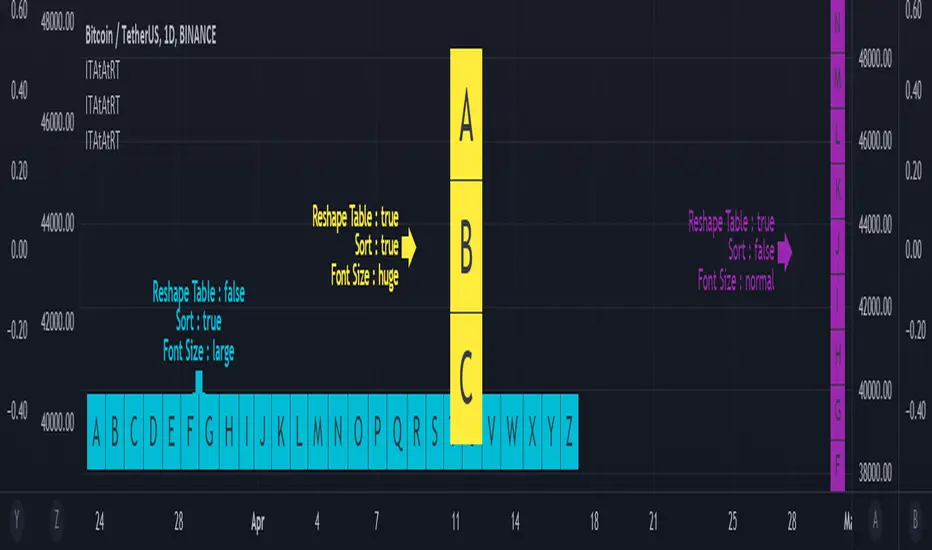
Input Text Area to Array then Reshape Table█ OVERVIEW
Simple method to convert from input.text_area to array using str.split.
Reshape table using switch, not necessary must use matrix.reshape.
Might be useful pine script to replace input.symbol.
█ FEATURES
Table can positioned by any position and font size can be resized.
Reshape table and sorting array if necessary.
█ CREDITS
Credits to TradingView for new update of input.text_area.
Remember Rules Label - incl. Text Function with different colorsHi BIG PLAYERS
Each of us makes mistakes and exceptions confirm the rule.
However, if you disregard the rules of trading, you lose your money - without any ifs and buts!
I have therefore created a reminder label for myself, which trading approaches I always want to stick to. These rules serve me as a guideline when I should trade.
Through the permanent reminder I set myself the goal of not trading too early and impatiently. The biggest problem of all traders is overtrading: the constant swaying back and forth between greed and fear. This must always be kept in mind. Because trading is in principle very simple: stick to your own rules. Keep a logbook and for my sake, record every trade as a screenshot in a PowerPoint presentation. Then you can see your mistakes in the past trades and recognize your background, why loss trades have arisen - you can also determine profit trades: As a rule, profits arise when you strictly adhere to your trading rules.
If you compare a company with a trader, then it is generally a similar procedure.
company view
a company plans its annual development with budget and forecast.
a company compares monthly between actual values and plan values and draws conclusions from the differences.
trader view
a trader should handle and plan his trade with all rules.
a trader should compare the result after the trade with the planned trade and discuss conclusions from possible differences.
I hope I could help other traders with this.
Kind regards
NXT2017

Time Range StatisticsA good amount of users requested a text box showing various price statistics, the following script returns various of these stats in a user-selected range, and include classical ones such as a central tendency measurement (mean), dispersion (normalized range) and percent change, but also include less common statistics such as average traded volume and number of gaps. The script also calculates the correlation between the closing price and another user-selected instrument.
The script is currently the longest one I ever made and took some efforts, as I wasn't satisfied with the statistics to be originally included. Big thx to Gael for the enormous feedback and the idea of the normalized range, to user @Cookiecrush for the feedback ( without ya I would have posted something bad you know umu ? ), and Lulidolce for the support, friendship is magic!
Selected Range
The setting Start determine the bar at which the range starts, while End determine at which bar the range end. To help you select these values, the current bar number (bar index) is displayed at the right of the indicator title in blue.
The setting evaluate to last bar will use a range starting at Start and ending at the last bar, as such you can use a full range by using Start = 0 and select evaluate to last bar
The range is highlighted by an area on the chart. By default Start = 9000 and End = 10000, you might not have this amount of data in your chart, as such use the displayed bar index to select Start and End, then set the settings as default.
Displayed Statistics
The statistics panel is displayed on the right side of the last bar, the panel has 3 sections, a title section who shows the symbol ticker, timeframe, and overall trends represented by a chart emoji, the overall trends are determined by comparing the number of higher highs with the number of lower low.
Below are displayed the date ranges with time format: year/month/day/hour:minute.
The second section shows the general statistics. The first one is the mean, also represented by the orange line in the chart, the blue line displayed represent the highest price value in the range, while the red one represents the lowest price value.
The second stat is the normalized range, and determine how spread is the price in the user-selected range, why not the standard deviation? Because the standard deviation might return results varying widely depending on the scale of the closing price, you could get measures such as 0.0156 or 16 or even 56 depending on the instrument, as such using a normalized range can be more appropriate as it lays in a range of (0,1). Lower values indicate a low degree of price variation. Note that I still want to find another measure in the future.
The percentage change (or relative change) indicates at which percentage the price has increased or decreased, and is calculated by subtracting the closing at bar Start with the price at bar End , divided by the price at bar End , the result is then multiplied by 100.
The average traded volume calculate the mean of the volume in the selected range, I used the same format used by the original volume indicator for clarity.
Finally, the last stats of the section is the number of gaps, this stat is by default hidden. An up gap is detected when the open price is superior to the previous high, while a down gap is detected when the open price is inferior to the previous low, this allow to only retain significant gaps.
The last section of the indicator panel shows the correlation between the closing price and another instrument, by default GOOG, this correlation is also calculated within the user-selected range. Positive values indicate a positive relationship, that is the two instruments tend to move in the same direction. Negative values indicate a negative relationship, both instruments tend to move in a direction opposite to each other. Values closer to 1 or -1 indicate a stronger relationship, while values closer to 0 indicate no relationship.
In Summary
The script shows various stats, each calculated within a user-selected range, in general one would be more interested in how these stats might evolve with time, but checking them in a custom range can be quite interesting.
Thx for reading. umu

Reminder Message (with color picker) - ApopheniaPaysThis is a very simple script. It displays a message above the latest price. I coded it because I need a constant reminder to keep me from overtrading.
You can customize several options:
- The message text
- How high above the latest price the message is displayed
- How often it is displayed. 1=display constantly, 2=only show it during every other period, 3=only show it every 3rd new period, etc. So, for example, if you are on the 15 minute chart, and set a frequency of 3, it will show it for the first 15 minutes out of every 45.
- Color and lightness. This can be used as an example of how to add a color selection input to your own scripts.

[TK] Just a labelThis script puts a simple label with a customizable text on the chart.
I use this to label my different chart layouts, as tradingview unfortunately has removed the current layout name from the main user interface.

